Embed Size (px)
Citation preview
Sains Malaysiana 48(1)(2019): 183–189 http://dx.doi.org/10.17576/jsm-2019-4801-21
Radio Frequency Interference on Nearby Radio Astronomical Lines: Relationship between Wind Speed and Radio Signal Strength
Measured at East Coast of Peninsular Malaysia(Gangguan Frekuensi Radio pada Talian Astronomi Radio Berdekatan: Hubungan antara Kelajuan Angin dan
Kekuatan Isyarat Radio Diukur di Pantai Timur Semenanjung Malaysia)
SHARIFAH NURUL AISYAH SYED ZAFAR, NOR HAZMIN SABRI*, ROSLAN UMAR & ZAINOL ABIDIN IBRAHIM
ABSTRACT
The East coast of Peninsular Malaysia receives a strong wind speed, heavy rain and high humidity during the Northeast monsoon. The Malaysian Meteorological Department claims that the wind speed during the Northeast season could reach 55.56 km/h or more. This strong wind speed and heavy rain could contribute to the attenuation of radio signals. This paper investigated the relationship between wind speed (km/h) and radio signal strength, RSS (dBm). The statistical correlation was employed to identify the correlation value and strength between them. The wind speed and RSS were collected during wet and dry seasons at Kusza Observatory, while the Spectrum analyser was used for measuring RSS (dBm) and the weather station for wind speed (km/h). The result showed that the wet season has strong and significant correlation compared to the dry season. Frequencies of 382.5 MHz, 945 MHz and 2160 MHz with correlation values of r = -0.583;-0.631 and -0:514, respectively, showed strong, negative and significant correlations with wind speed in the wet season. As for the dry season, only a frequency of 382.5 MHz showed a strong, positive and significant correlation with r = 0.555, while small and medium for others. This finding is useful to a radio astronomer to help determine the best period for radio astronomy observation with the lowest interference considering the weather in the East Coast of Peninsular Malaysia. Besides, this finding benefits a spectrum of users involved in mobile telecommunication, wireless internet, radio TV transmission and satellite broadcasting.
Keywords: Correlation; radio signal attenuation; radio signal strength; wind speed
ABSTRAK
Pantai Timur Semenanjung Malaysia menerima kelajuan angin yang kuat, hujan lebat dan kelembapan yang tinggi semasa monsun Timur Laut. Jabatan Meteorologi Malaysia menyatakan bahawa kelajuan angin semasa musim Timur Laut boleh mencapai 55.56 km/jam atau lebih. Kelajuan angin yang kuat dan hujan lebat ini menyumbang kepada pengurangan isyarat radio. Dalam kajian ini, kami mengkaji hubungan antara kelajuan angin (km/jam) dan kekuatan isyarat radio, RSS (dBm). Korelasi statistik digunakan untuk mengenal pasti nilai korelasi dan kekuatan antara kedua-dua faktor itu. Kelajuan angin dan RSS direkodkan pada musim lembab dan kering di Kusza Observatori sementara penganalisis spektrum digunakan untuk pengukuran RSS (dBm) dan alat stesen cuaca untuk kelajuan angin (km/jam). Keputusan kajian musim lembab menunjukkan korelasi yang kuat dan ketara berbanding musim kering. Frekuensi 382.5 MHz, 945 MHz dan 2160 MHz menunjukkan korelasi yang kuat negatif dan signifikan dengan kelajuan angin dan nilai korelasi r = -0.583; -0.631 dan -0: 514 pada musim lembab. Untuk musim kering, hanya frekuensi 382.5 MHz menunjukkan korelasi yang positif dan signifikan dengan r = 0.555, manakala korelasi kecil dan sederhana untuk yang lain. Penemuan ini berguna kepada astronomi radio untuk menentukan tempoh terbaik dalam kajian astronomi radio dengan gangguan yang paling rendah dengan cara mempertimbangkan faktor cuaca di pantai timur Semenanjung Malaysia. Di samping itu, penemuan ini akan memberi manfaat kepada pengguna spektrum seperti telekomunikasi mudah alih, internet tanpa wayar, transmisi TV radio dan penyiaran satelit.
Kata kunci: Kekuatan isyarat radio; kelajuan angin; korelasi; pengurangan isyarat radio
INTRODUCTION
Radio astronomy studies celestial objects in a range of radio frequencies. The radio astronomer needs a quiet environment which is free from interference. Therefore, the radio telescope was placed in an isolated area to avoid human-made interference (Sasao 2015). The radio signal
from cosmic objects like stars, pulsars and quasars is extremely weak due to very distant object. This is the challenge faced by the radio astronomer when dealing with Radio Frequency Interference (RFI), which comes from mobile phones, radio broadcasting and electronic equipment in order to have good resolution of data images
184
(Kraus 1966). According to Umar et al. (2013), RFI mainly originates from human activities such as the Global System for Mobile Communications (GSM), radio broadcasts, satellite communication and amateur radios, which are the common factors of radio signal attenuation. Apart from human-made interference, atmospheric condition also contributes to the increasing of the RFI level (Keiser 1979). Since signals from astronomical objects are very weak, the disturbance from the atmospheric conditions, such as weather and moisture content must be avoided even if the impact is low. Components of weather such as temperature, humidity, and wind in the atmosphere affects the varying refractivity index, which could lead to changes in radio signal propagation (Farmoriji & Oyeleye 2013). Several studies on how weather factors effect radio signals have been carried out (Sabri et al. 2015; Umar et al. 2014). These studies found that solar radiation had a minimum effect on radio frequencies up to 8 GHz, while a decrease in rain rate led to increases in interference levels. The signal strength was found to have decreased with an increase in relative humidity and the mathematical correlation value was at r= -0.93 (Joseph 2016). Temperature was found to have an impact on radio signal as the signal strength was determined to be inversely proportional to temperature with a computed correlation value of -0.94 (Amajama 2016). Wind speed indirectly affected radio signals as in Meng et al. (2009), who found that wind speed caused the movement of physical elements (leaves and branches) within the foliage channel in tropical forest, thereby obstructing and effecting radio signal propagation. The temporal variation in strengths of received signals induced by wind speed was performed through attenuation distribution, which is shown in the Probability Density Function (PDF) curve. In the following part, the flatter and wider the curve, the greater increase in the variation of radio frequency signals, hence, increasing the susceptibility to a degradation event. In the communication system, wind speed can cause disconnection and lower data rate in network performances. Based on statistical analyses, received signal strength was found to be positively correlated to wind speed and direction at a frequency of 5.8 GHz for wireless link (Chua et al. 2010). Beyond that, wind speed was reported to have a significant statistical relationship with radio data links at a frequency of 2.4 GHz and 5 GHz (Bri et al. 2010). In the radio astronomy field, there was a case where the Parkes Radio Telescope was sometimes affected by strong winds even though it has large dishes to receive radio signals. This could pose a problem for radio astronomical research and also compromise the quality of astronomical data (Cheng 2009). Thus, it is crucial to study the effects of wind on radio signals so that radio astronomical research can seek ways to reduce attenuation and path loss of radio signals as it propagates through the atmosphere from far distances (millions or billions of light years). This working paper investigated the relationship between wind speed and RSS in wet and dry conditions at frequencies of 382.5 MHz, 945 MHz, 1867.5 MHz and 2160 MHz. The frequencies are usually transmitted from the ground.
These frequencies were selected since they are near to three radio astronomical lines as listed by the International Astronomical Union (IAU), namely deuterium, DI (327.384 MHz), Hydrogen, HI (1420.406 MHz), Hydroxyl, OH (1612.231 MHz,1665.462 MHz, 1667.359 MHz, 1720.530 MHz) on Radio Astronomy Frequencies (1997). The frequency allocated by MCMC for the radio astronomical window at frequencies between 0-3500 MHz is shown as in Table 1. This study assumed that the effect of wind speed on these frequencies would describe how it disturbs DI lines, HI lines and OH lines detection in radio astronomy observation. The measurement was conducted at KUSZA Observatory (KO), East Coast Environmental Research Institute at Universiti Sultan Zainal Abidin, which is situated approximately 30 km from Kuala Terengganu in the East Coast of Peninsular Malaysia. This study will benefit radio astronomers when selecting sites with very minimum RFI, considering the wind factor. It will also benefit an active spectrum of entities, such as wireless telecommunication, satellite broadcasting, AM, FM & TV transmission and internet service providers in managing their services. Since Malaysia enjoys a tropical climate, the wind speeds are important in managing radio signal transmission. This is due to strong winds, high precipitation and a hot temperature, which are among the characteristics of tropical weather known to play a significant role in signal attenuation that could interfere with the reception of radio astronomical data from outer space.
MATERIALS AND METHODS
Two main data sets were collected in this study, which were wind speed (km/h) and RSS (dBm). In addition, humidity (%) and rain rate (mm) were also collected. The measurement was done in 24 h observation on 21st January 2016 and 3rd February 2016 which is in wet season for east coast of Peninsular Malaysia due to North-East (NE) monsoon. During NE monsoon, high precipitation occurs with heavy rain and strong winds. The 24 h measurement was also conducted on 31st May 2016 during the dry season brought about by the South-West (SW) monsoon. When the West Coast of Peninsular Malaysia is hit by heavy rain, the East Coast is usually dry with slow wind. These measurements were recorded from 10 am and carried out at KO, which was at a latitude of 5o 32 10N and 102o 56 55 E, featured on top of a hill, surrounded by the rainforest and nearby South China sea at 49 m above sea level. KO also has a population density of 3,274 people. Based on a spectrum survey done in potential sites in Malaysia, KO was ranked on top with the lowest RFI level among 14 sites (Abidin et al. 2009; Adnan & Ramadzan 2010; Umar et al. 2014, 2012). A low population density means low levels of radio emission and approaches the radio-quietness area. Following this, KO possess the appropriate site for a future radio astronomy observatory. The observatory’s receiver system comprised of the antenna, Low Noise Amplifier (LNA) and a 9 GHz spectrum analyser (Keysight N99150) connected to a
185
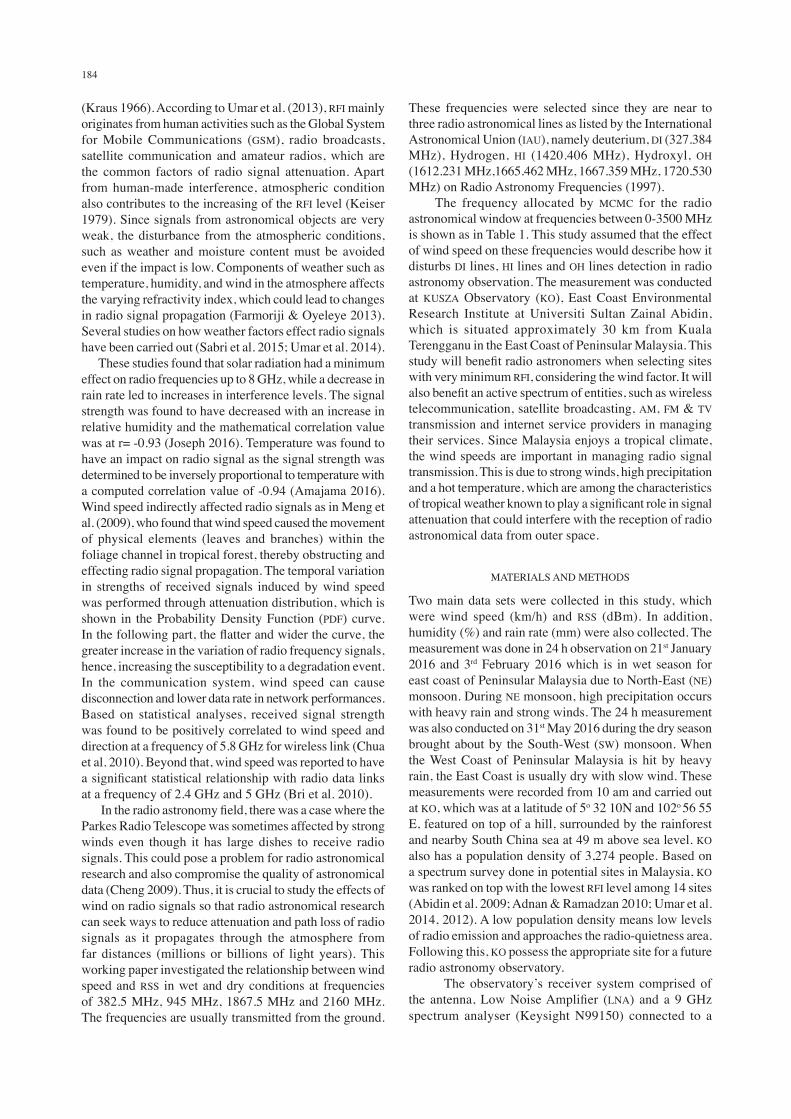
computer for spectrum data collection. The antenna was kept in vertical polarization with a height taller than trees. At the same time, data about wind speed, humidity and rain rate were collected using the Davis Vantage Pro 2 Weather Station. The receiver system is shown in Figure 1. By applying the correlation statistical analysis method, the relationship of the two variables, namely the RSS for each prominent peak as well as the wind speed factor were determined. Statistical analysis began by identifying the normality of the data using the Shapiro-Wilk test. In this case, the normality test was done to determine the appropriate correlation analysis for these two variables. The normality test involved hypothesis testing, which comprised of the null and alternative hypotheses. The null hypothesis states that the data is normally distributed, while the alternative hypothesis declares that the data is
not normally distributed. Thus, if the p-value is less than α-value (0.05), then the null hypothesis is rejected and if the p-value is greater than 0.05, then the null hypothesis is accepted. Shapiro-Wilk test is a test of normality that estimates the variance of a sample data. At the same time, the null hypothesis rule was used to determine whether the data is normally distributed. The Shapiro-Wilk normality test equation is given by,
(1)
where n is the number of observation; xi is the value of ordered sample; and ai is the tabulated coefficient.
TABLE 1. Frequency allocated by MCMC, ITU and radio astronomical windows at frequencies from 0-3500 MHz
Range of frequency (MHz)
Malaysians Communication and Multimedia Commission (MCMC)
International Telecommunication Union (ITU)
Nearby Radio Astronomical Window/Rest Frequency(MHz)
30-40.98 Space Operation, Fixed Mobile Space Operation, Fixed Mobile Continuum observation
87-156.7625 Fixed Mobile, Broadcasting, Maritimes Mobile
Fixed Mobile, Broadcasting, Maritimes Mobile
Pulsar
216-335.4 Fixed Mobile, Broadcasting, Radio Astronomy, Aeronautical Radio navigation
Fixed Mobile, Broadcasting, Radio Astronomy, Aeronautical Radio navigation
Pulsar, Continuum, Deuterium (DI) /327-327.7
460-806 Fixed Mobile, Metrological satellite, Broadcasting, Radio Astronomy
Fixed Mobile, Metrological satellite, Broadcasting, Radio Astronomy
Pulsar, Continuum
960-1535 Radio navigation satellite, Earth exploration satellite, space operation
Aeronautical Radio navigation, Radio navigation satellite, Earth exploration satellite, space operation
Hydrogen lines (HI)/1420.406
2290-3400 Mobile (except aeronautical mobile), Broadcasting satellite, Fixed satellite (space to earth)
Mobile (except aeronautical mobile), Broadcasting satellite, Fixed satellite (space to earth)
CH radical (CH)/3623.794,3335.481,3349.193
Pankonin & Price 1981; Sabri et al. 2015; Umar et al. 2014
FIGURE 1. Instrument setup for radio signal propagation observation (Sabri et al. 2015)
186
During the testing process, the output released was W (Wilk value), which is the p-value. The results of this study showed that the p-value was less than 0.05, which means data from this study were not normally distributed (Archdeacon 1994). Since the data did not follow the normal distribution then the non-parametric test (Spearman Rank Correlation analysis) was used to test the strength of the linear relationship between two variables (Artusi et al. 2002). The Spearman correlation coefficient equation is denoted as r and illustrate as,
(2) where n is the number of pair of ranks; and di is the difference between a pair of score (Vaughan 2001). In a correlation analysis, the range of values varies from +1 and -1. The positive sign indicates that the RSS increases as the wind speed increases, while the negative sign shows that the RSS decreases as the wind speed increases. On the other hand, the correlation value indicates the strength of the correlation. As reported by Cohen (1977), the absolute correlation value and its indication are listed in Table 2. Once the Spearman correlation coefficient was determined, the significance test was carried out by testing the hypothesis. There were two hypotheses involved, the null and alternative hypotheses. The null hypothesis declares there is no correlation between two variables, while the alternative hypothesis indicates there is a correlation between the variables. The significance test is conducted in order to observe the probability of a correlation. Prior to that, the significance level (α) must be concreted. In this case, it was assumed as 0.05. When the significance value (p) is less than the significance level (α) (0.05), the null hypothesis is rejected and shows there is significance and two variables are related. However, if the significance value is more than (0.05), the null hypothesis is not rejected as it is insignificant and there are no relations between the two variables (Chen & Popovich 2002; Shapiro et al. 1968).
RESULTS AND DISCUSSION
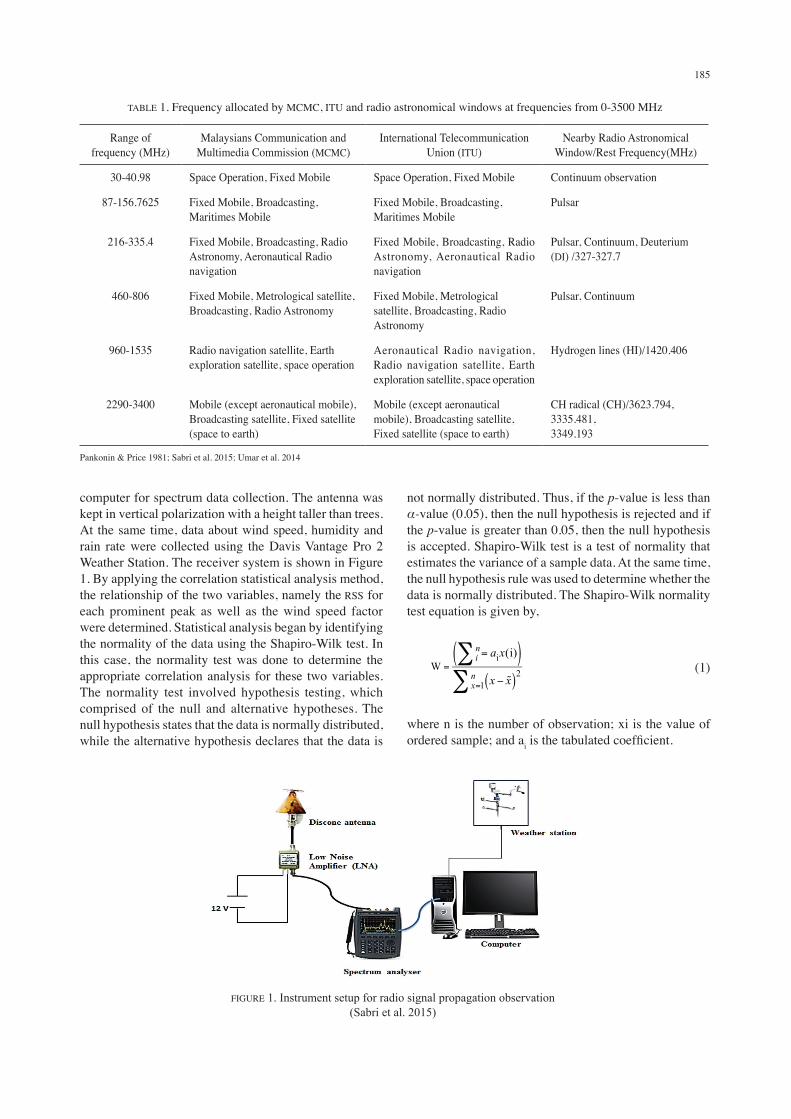
The average RSS at KO is shown in Figure 2. Based on the figure, 4 prominent peaks (interference frequency) were highlighted, namely 382.5, 945, 1867.5, and 2160 MHz. The correlation value at these frequencies was determined by the wind speed factor. These frequencies, which are in the Ultra High Frequency (UHF) band, mostly come from mobile phones and digital-trunked radio sources. Table 3 shows the prominent peaks and its sources. Equally important, these frequencies are nearby radio astronomical lines, such as Deuterium (DI), Hydrogen (HI) and Hydroxyl (OH), which could potentially cause interference. This study found that RSS were high attenuated during the wet season compared to the dry season based on the relationship graph between RSS (dBm) and wind speed (km/h). The type of plotted graph was the curve fit polynomial. This study found the polynomial curve to be appropriate curve in order to get best fit line to show the trend of RSS affected by wind speed. Based on Table 4, the wet season presented the highest correlation between RSS and wind speed compared to the dry season. Hence, the higher attenuation of RSS was attributed to strong winds accompanied by a high level of rain and humidity during the wet season.
TABLE 3. Prominent peaks and its sources
Frequency (MHz) Sources382.5945
1867.52160
Digital trunked radioMobile phone- (celcom)Mobile phone (GSM 1800)- DigiMobile phone(IMT 2000)- Digi
FIGURE 2. Average of RSS (dBm) at frequency from 0 - 3000 MHz with 4 prominent peak was labeled
TABLE 2. Absolute value of correlation and its indication
Absolute value of correlation Indication0.10.30.5
Small correlationMedium correlation
Large correlation
187
TABLE 4. Spearman correlation in wet and dry season at KO, East Coast of Peninsular Malaysia
Seasons RelationshipRange of
WS (km/h)
Range of humidity
(%)
Range of rain rate/(mm/h)
Spearman correlation coefficient, rFrequency(MHz)
382.5 945 1867.5 2160
WetRSS-WS
0-32 69-81 0 - 55.9 -0.512High corr.
-0.625High corr.
-0.356Medium corr.
-0.514High corr.
Dry 0-22.59 68 - 79 0 0.555High corr.
0.417Medium corr.
0.176Small corr.
0.359Medium corr.
WS = wind speed, corr.= correlation, all correlation was significant
TABLE 5. Beaufort wind speed scale (Mather 2005)
Wind speed level Wind speed (km/hr)
calmLight air
Light breezeGentle breeze
Moderate breezeFresh breeze
0 - 23-67-1213-1920-3031-40
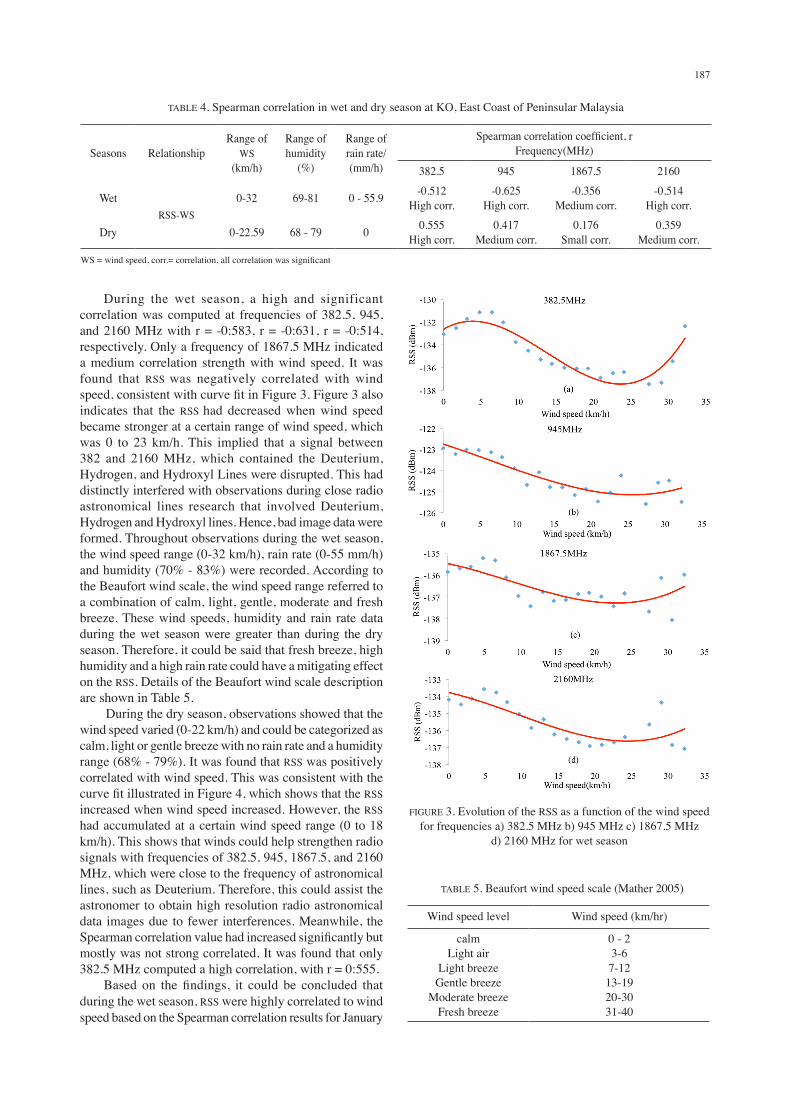
FIGURE 3. Evolution of the RSS as a function of the wind speed for frequencies a) 382.5 MHz b) 945 MHz c) 1867.5 MHz
d) 2160 MHz for wet season
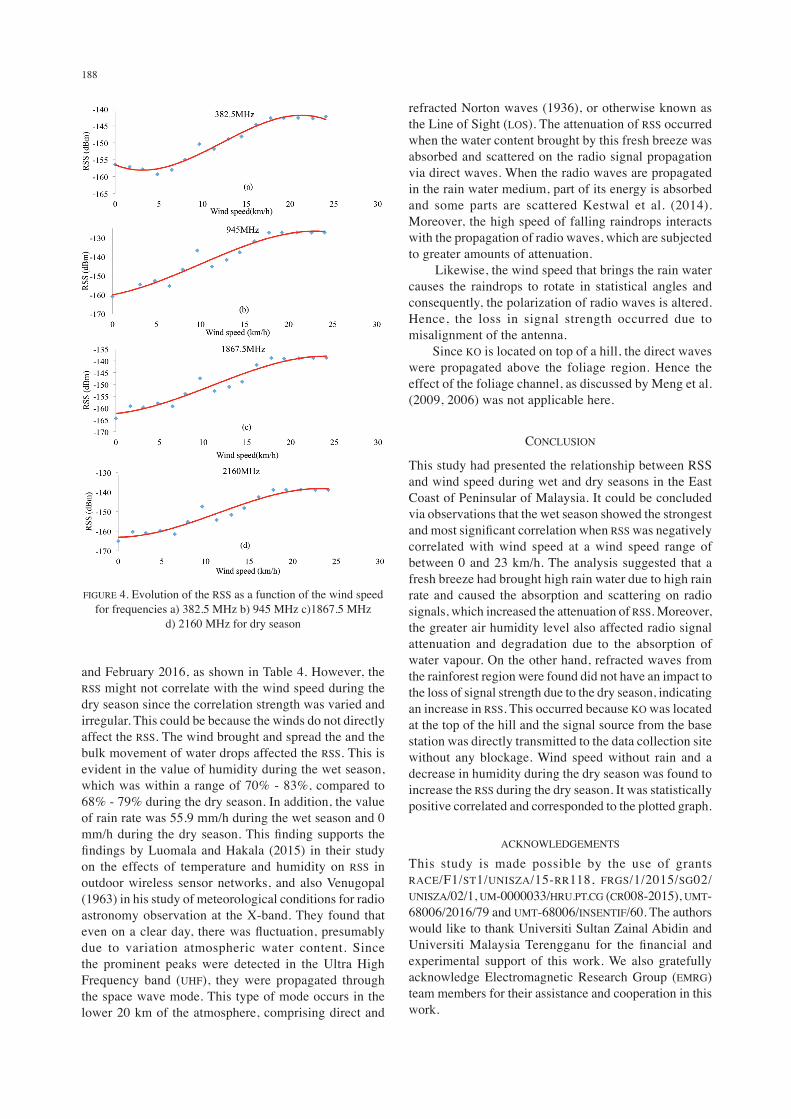
During the wet season, a high and significant correlation was computed at frequencies of 382.5, 945, and 2160 MHz with r = -0:583, r = -0:631, r = -0:514, respectively. Only a frequency of 1867.5 MHz indicated a medium correlation strength with wind speed. It was found that RSS was negatively correlated with wind speed, consistent with curve fit in Figure 3. Figure 3 also indicates that the RSS had decreased when wind speed became stronger at a certain range of wind speed, which was 0 to 23 km/h. This implied that a signal between 382 and 2160 MHz, which contained the Deuterium, Hydrogen, and Hydroxyl Lines were disrupted. This had distinctly interfered with observations during close radio astronomical lines research that involved Deuterium, Hydrogen and Hydroxyl lines. Hence, bad image data were formed. Throughout observations during the wet season, the wind speed range (0-32 km/h), rain rate (0-55 mm/h) and humidity (70% - 83%) were recorded. According to the Beaufort wind scale, the wind speed range referred to a combination of calm, light, gentle, moderate and fresh breeze. These wind speeds, humidity and rain rate data during the wet season were greater than during the dry season. Therefore, it could be said that fresh breeze, high humidity and a high rain rate could have a mitigating effect on the RSS. Details of the Beaufort wind scale description are shown in Table 5. During the dry season, observations showed that the wind speed varied (0-22 km/h) and could be categorized as calm, light or gentle breeze with no rain rate and a humidity range (68% - 79%). It was found that RSS was positively correlated with wind speed. This was consistent with the curve fit illustrated in Figure 4, which shows that the RSS increased when wind speed increased. However, the RSS had accumulated at a certain wind speed range (0 to 18 km/h). This shows that winds could help strengthen radio signals with frequencies of 382.5, 945, 1867.5, and 2160 MHz, which were close to the frequency of astronomical lines, such as Deuterium. Therefore, this could assist the astronomer to obtain high resolution radio astronomical data images due to fewer interferences. Meanwhile, the Spearman correlation value had increased significantly but mostly was not strong correlated. It was found that only 382.5 MHz computed a high correlation, with r = 0:555. Based on the findings, it could be concluded that during the wet season, RSS were highly correlated to wind speed based on the Spearman correlation results for January
188
and February 2016, as shown in Table 4. However, the RSS might not correlate with the wind speed during the dry season since the correlation strength was varied and irregular. This could be because the winds do not directly affect the RSS. The wind brought and spread the and the bulk movement of water drops affected the RSS. This is evident in the value of humidity during the wet season, which was within a range of 70% - 83%, compared to 68% - 79% during the dry season. In addition, the value of rain rate was 55.9 mm/h during the wet season and 0 mm/h during the dry season. This finding supports the findings by Luomala and Hakala (2015) in their study on the effects of temperature and humidity on RSS in outdoor wireless sensor networks, and also Venugopal (1963) in his study of meteorological conditions for radio astronomy observation at the X-band. They found that even on a clear day, there was fluctuation, presumably due to variation atmospheric water content. Since the prominent peaks were detected in the Ultra High Frequency band (UHF), they were propagated through the space wave mode. This type of mode occurs in the lower 20 km of the atmosphere, comprising direct and
refracted Norton waves (1936), or otherwise known as the Line of Sight (LOS). The attenuation of RSS occurred when the water content brought by this fresh breeze was absorbed and scattered on the radio signal propagation via direct waves. When the radio waves are propagated in the rain water medium, part of its energy is absorbed and some parts are scattered Kestwal et al. (2014). Moreover, the high speed of falling raindrops interacts with the propagation of radio waves, which are subjected to greater amounts of attenuation. Likewise, the wind speed that brings the rain water causes the raindrops to rotate in statistical angles and consequently, the polarization of radio waves is altered. Hence, the loss in signal strength occurred due to misalignment of the antenna. Since KO is located on top of a hill, the direct waves were propagated above the foliage region. Hence the effect of the foliage channel, as discussed by Meng et al. (2009, 2006) was not applicable here.
CONCLUSION
This study had presented the relationship between RSS and wind speed during wet and dry seasons in the East Coast of Peninsular of Malaysia. It could be concluded via observations that the wet season showed the strongest and most significant correlation when RSS was negatively correlated with wind speed at a wind speed range of between 0 and 23 km/h. The analysis suggested that a fresh breeze had brought high rain water due to high rain rate and caused the absorption and scattering on radio signals, which increased the attenuation of RSS. Moreover, the greater air humidity level also affected radio signal attenuation and degradation due to the absorption of water vapour. On the other hand, refracted waves from the rainforest region were found did not have an impact to the loss of signal strength due to the dry season, indicating an increase in RSS. This occurred because KO was located at the top of the hill and the signal source from the base station was directly transmitted to the data collection site without any blockage. Wind speed without rain and a decrease in humidity during the dry season was found to increase the RSS during the dry season. It was statistically positive correlated and corresponded to the plotted graph.
ACKNOWLEDGEMENTS
This study is made possible by the use of grants RACE/F1/ST1/UNISZA/15-RR118, FRGS/1/2015/SG02/UNISZA/02/1, UM-0000033/HRU.PT.CG (CR008-2015), UMT-68006/2016/79 and UMT-68006/INSENTIF/60. The authors would like to thank Universiti Sultan Zainal Abidin and Universiti Malaysia Terengganu for the financial and experimental support of this work. We also gratefully acknowledge Electromagnetic Research Group (EMRG) team members for their assistance and cooperation in this work.
FIGURE 4. Evolution of the RSS as a function of the wind speed for frequencies a) 382.5 MHz b) 945 MHz c)1867.5 MHz
d) 2160 MHz for dry season
189
REFERENCES
Abidin, Z.Z., Ibrahim, Z.A., Adnan S.B.R.S. & Anuar, N.K. 2009. Investigation of radio astronomical windows between 1 MHz and 2060 MHz in Universiti Malaya, Malaysia. New Astronomy 14: 579.
Adnan, S. & Ramadzan, S.B. 2010. The study of radio frequency interference (RFI) for radio astronomy in some remote locations in Peninsular Malaysia. PhD Thesis. Kuala Lumpur: University of Malaya (Unpublished).
Amajama, J. 2016. Impact of atmospheric temperature on (UHF) radio signal. International Journal of Engineering Research and General Science 4: 619-622.
Archdeacon, T.J. 1994. Correlation and Regression Analysis: A Historian’s Guide. Madison: University of Wisconsin Press.
Artusi, R., Verderio, P. & Marubini, E. 2002. Bravais-Pearson and Spearman correlation coefficients: Meaning, test of hypothesis and confidence interval. Int. J. Biol. Markers 17: 148-151.
Bri, D., Sendra, S., Coll, H. & Lloret, J. 2010. How the atmospheric variables affect to the WLAN Datalink Layer Parameters. In Telecommunications (AICT), 2010 Sixth Advanced International Conference. pp. 13-18.
Chen, P.Y. & Popovich, P.M. 2002. Correlation: Parametric and nonparametric measures. Sage University Papers Series on Quantitative Applications in the Social Sciences. pp. 104.
Cheng, J. 2009. The Principles of Astronomical Telescope Design. New York: Springer.
Chua, T.H., Wassell, I.J. & Rahman, T.A. 2010. Combined effects of wind speed and wind direction on received signal strength in foliated broadband fixed wireless links. Antennas and Propagation (EuCAP), 2010 Proceedings of the Fourth European Conference on IEEE. pp. 1-5.
Cohen, J. 1977. Statistical Power Analysis for the Behavioral Sciences. 2nd Revise. Mahwah, United States: Taylor & Francis Inc.
European Science Foundation. Committee on Radio Astronomy Frequencies. 1997. CRAF handbook for radio astronomy. CRAF Secretariat, Netherlands Foundation for Research Astronomy.
Keiser, B.E. 1979. Principles of Electromagnetic Compatibility. Dedham: Mass. Artech House, Inc. p. 341.
Kestwal, M.C., Joshi, S. & Garia, L.S. 2014. Prediction of rain attenuation and impact of rain in wave propagation at microwave frequency for tropical region (Uttarakhand, India). International Journal of Microwave Science and Technology. 2014: 958498.
Kraus, J.D. 1966. Radio Astronomy. New York: McGraw-Hill.Luomala, J. & Hakala, I. 2015. Effects of temperature and
humidity on radio signal strength in outdoor wireless sensor networks. Computer Science and Information Systems (FedCSIS). pp. 1247-1255.
Mather, J.R. 2005. Beaufort wind scale. In Encyclopedia of World Climatology. New York: Springer.
Meng, Y.S., Lee, Y.H. & Ng, B.C. 2009. The effects of tropical weather on radio-wave propagation over foliage channel. IEEE Transactions on Vehicular Technology 58(8): 4023-4030.
Meng, Y.S., Lee, Y.H. & Ng, B.C. 2006. VHF and UHF channel characterization in a tropical rainforest. Proc. 1st Int. Conf on Comm. and Electron. pp. 1-6.
Pankonin, V. & Price, R. 1981. Radio astronomy and spectrum management: The impact of WARC-79. IEEE Transactions on Communications 29(8): 1228-1237.
Sabri, N.H. 2015. Radio frequency interference: The effect of ambient carbon dioxide (CO2) concentration on radio signal for radio astronomy purposes. Malaysian Journal of Analytical Sciences 19(5): 1065-1071.
Sabri, N.H., Azlan, A.W., Umar, R., Sulan, S.S., Ibrahim, Z.A. & Mokhtar, W.Z.A.W. 2015. The effect of solar radiation on radio signal for radio astronomy purposes. Malaysian Journal of Analytical Sciences 19(6): 1374-1381.
Sabri, N.H., Umar, R., Mokhtar, W.W., Adli, W.Z., Abidin, Z.Z., Ibrahim, Z.A. & Kamarudin, M.K. 2015. Preliminary study of vehicular traffic effect on radio signal for radio. Jurnal Teknologi 75(1): 313-318.
Shapiro, S.S., Wilk, M.B. & Chen, H.J. 1968. A comparative study of various tests for normality. Journal of the American Statistical Association 63(324): 1343-1372.
Umar, R., Abidin, Z.Z., Ibrahim, Z.A., Rosli, Z. & Noorazlan, N. 2014. Selection of radio astronomical observation sites and its dependence on human generated RFI. Research in Astronomy and Astrophysics 14(2): 242-248.
Umar, R., Abidin, Z.Z., Ibrahim, Z.A., Gasiprong, N., Asanok, K., Nammahachak, S., Aukkaravittayapun, S., Somboopon, P., Prasit, A., Prasert, N., Hamidi, Z.S., Hashim, N. & Ungku Ferwani Salwa Ungku Ibrahim. 2013. The study of radio frequency interference (RFI) in altitude effect on radio astronomy in Malaysia and Thailand. World Applied Sciences Journal 28(12): 2158-2162.
Umar, R., Abidin, Z.Z., Ibrahim, Z.A., Hassan, M.S.R., Rosli, Z. & Hamidi, Z.S. 2012. Population density effect on radio frequencies interference (RFI) in radio astronomy. AIP Conference Proceedings 1454(1): 39-42.
Vaughan, L. 2001. Statistical Methods for the Information Professional: A Practical, Painless Approach to Understanding, Using, and Interpreting Statistics. Vol. 367. Information Today, Inc.
Venugopal, V.R. 1963. Meteorological conditions and radio astronomy observations at X-band. Journal of the Atmospheric Sciences 20(5): 372-375.
Sharifah Nurul Aisyah Syed Zafar & Roslan Umar East Coast Environmental Research Institute (ESERI) Universiti Sultan Zainal Abidin Gong Badak Campus, 21300 Kuala Terengganu, Terengganu Darul ImanMalaysia
Nor Hazmin Sabri*School of Fundamental Science Universiti Malaysia Terengganu 21030 Kuala Terengganu, Terengganu Darul ImanMalaysia
Zainol Abidin IbrahimPhysics Department, Faculty of Science Universiti of Malaya 50603 Kuala Lumpur, Federal Territory Malaysia
*Corresponding author; email: [email protected]
Received: 28 March 2018Accepted: 12 September 2018

![EYl]jaYda]f2 Kg ]`l k2 - Radio TEDDY · Einschalten: Berlin / Brandenburg: 90.2 MHz Kassel: 91.7 MHz Koblenz: 87.8 MHz Rostock: 95.8 MHz Schwerin: 102.9 MHz Livestream unter:](https://img.pdfslide.net/doc/110x75/6053f836f914577834507387/eyljaydaf2-kg-l-k2-radio-teddy-einschalten-berlin-brandenburg-902-mhz.jpg)