Embed Size (px)
Citation preview

Radio Quiet Fast and Wide Coronal Mass Ejections
N. Gopalswamy1, S. Yashiro2, H. Xie2, S. Akiyama2, E. Aguilar-Rodriguez2, M. L. Kaiser1, R. A.
Howard3 and J.-L. Bougeret4
1NASA Goddard Space Flight Center, Greenbelt, Maryland
2 The Catholic University of America, Washington DC
3. Naval Research Laboratory, Washington, DC
4 Paris Observatory, Meudon, France.
Abstract:
We report on the properties of radio-quiet (RQ) and radio-loud (RL) coronal mass ejections (CMEs)
that are fast and wide (FW). RQ CMEs lack of type II radio bursts in the metric and decameter-
hectometric (DH) wavelengths. RL CMEs are associated with metric or DH type II bursts. We found
that ~ 40% of the FW CMEs from 1996 to 2005 were radio quiet. The RQ CMEs had an average speed
of 1117 km/s compared to 1438 km/s for the RL, bracketing the average speed of all FW CMEs (1303
km/s). The fraction of full halo CMEs (apparent width = 360 deg) was the largest for the RL CMEs
(60%), smallest for the RQ CMEs (16%) and intermediate for all FW CMEs (42%). The median soft
X-ray flare size for the RQ CMEs (C6.9) was also smaller than that for the RL CMEs (M3.9). About
55% of RQ CMEs were back-sided, while the frontsided ones originated close to the limb. The RL
CMEs originated generally on the disk with only ~25% being backsided. The RQ FW CMEs suggest
that the Alfven speed in the low-latitude outer corona can often exceed 1000 km/s and can vary over a
factor of ≥3. None of the RQ CMEs was associated with large solar energetic particles, which is
useful information for space weather applications.
This is an unedited preprint of an article accepted for publication in The Astrophysical Journal. The final published articlemay differ from this preprint. Copyright 2007 by The American Astronomical Society. Please cite as 'ApJ preprintdoi:10.1086/'524765''.

1. Introduction
Type II radio bursts are generated at fast mode MHD shocks driven by coronal mass ejections (CMEs).
Solar flares are thought to be another source of shocks responsible for some metric type II bursts, but
recent results indicate that even these type II bursts are consistent with a CME-driver (see
Gopalswamy, 2006 for a recent review). Long-wavelength type II bursts occurring at decameter-
hectometric (DH) wavelengths can promptly identify shocks when they are still close to the Sun,
making them useful for delineating CMEs that can seriously impact the heliosphere. DH Type II bursts
are also closely associated with solar energetic particle (SEP) events (Gopalswamy, 2003; Cliver et al.,
2004) and hence are important in for studying SEP-producing shocks. However, there is a problem: a
significant fraction of fast CMEs are not associated with type II bursts (Gopalswamy et al., 2001b).
Even with speeds ≥ 900 km/s and widths ≥ 60 deg, some CMEs are not associated with type II bursts.
Possible reasons include: (i) the CME does not drive a shock, (ii) the shock does not result in
detectable radio emission, or (iii) the radio emission does not propagate to the observer. If the CMEs
are not associated with type II bursts, they may not produce SEPs either, which has important
implications for space weather. It is thus important to identify the distinguishing characteristics of RQ
and RL CMEs. To this end, we exploit the extensive and uniform data set on CMEs and type II radio
bursts available from the Solar and Heliospheric Observatory (SOHO) and Wind missions.
2. Data Selection
We define RQ (RQ) CMEs as those with no detectable type II radio emission in the metric or DH
wavelengths. Figure 1 gives one example each of a RQ and a RL (RL) CME. The two CMEs appear
very similar in the SOHO/LASCO field of view and have similar speeds (1660 km/s for RQ and 1893
This is an unedited preprint of an article accepted for publication in The Astrophysical Journal. The final published articlemay differ from this preprint. Copyright 2007 by The American Astronomical Society. Please cite as 'ApJ preprintdoi:10.1086/'524765''.

km/s for RL), but the associated radio dynamic spectra are quite different. While both CMEs are
associated with type III radio bursts, which mark the onset of the solar eruption, the 2005 July 25 CME
lacks a type II burst. The RL CMEs (as the 2005 September 10 CME shown in Fig. 1) are those
associated with an identifiable type II burst at metric or DH wavelengths. Properties of all RL CMEs
have been reported elsewhere (Gopalswamy et al., 2001b; 2005), but we concentrate on just the FW
RL CMEs here. The radio bursts were identified in the dynamic spectra of the Radio and Plasma Wave
(WAVES) Experiment (Bougeret et al., 1995) on board the Wind spacecraft. A list of Wind/WAVES
type II bursts is available on line (http://lep694.gsfc.nasa.gov/waves/waves.html). We also included
some events not in the catalog but identified while examining the radio quietness of FW CMEs.
Information on metric type II bursts was obtained from the National Geophysical Data Center (NGDC)
(ftp://ftp.ngdc.noaa.gov/STP/SOLAR_DATA/SOLAR_RADIO/SPECTRAL/). Note that radio quietness
means the lack of type II emission above the detection threshold of the Wind/WAVES experiment (for
DH) or ground based radio instruments (for metric). However, there may be other types of radio
emission such as type III bursts associated with these CMEs. Our definition differs from the “radio
silent” CMEs (Marque et al., 2006), which lacked just metric radio bursts (type III, type II or type IV).
We first developed a list of fast (speed ≥ 900 km/s) and wide (width ≥ 60 deg) CMEs and then
separated them as RQ and RL populations by checking the list against type II radio burst data in the
metric and DH wavelength domains. The FW CMEs were extracted from the CME catalog (Yashiro et
al., 2004) using the search engine available on line (http://cdaw.gsfc.nasa.gov/CME-list) by setting
width ≥ 60 deg and speed ≥ 900 km/s. The speed and width limits of FW CMEs stem from an earlier
investigation (Gopalswamy et al., 2001b), which found the average speed of CMEs associated with
DH type II bursts as 960 km/s and the average width of fast CMEs lacking type II bursts as 66 deg.
This is an unedited preprint of an article accepted for publication in The Astrophysical Journal. The final published articlemay differ from this preprint. Copyright 2007 by The American Astronomical Society. Please cite as 'ApJ preprintdoi:10.1086/'524765''.
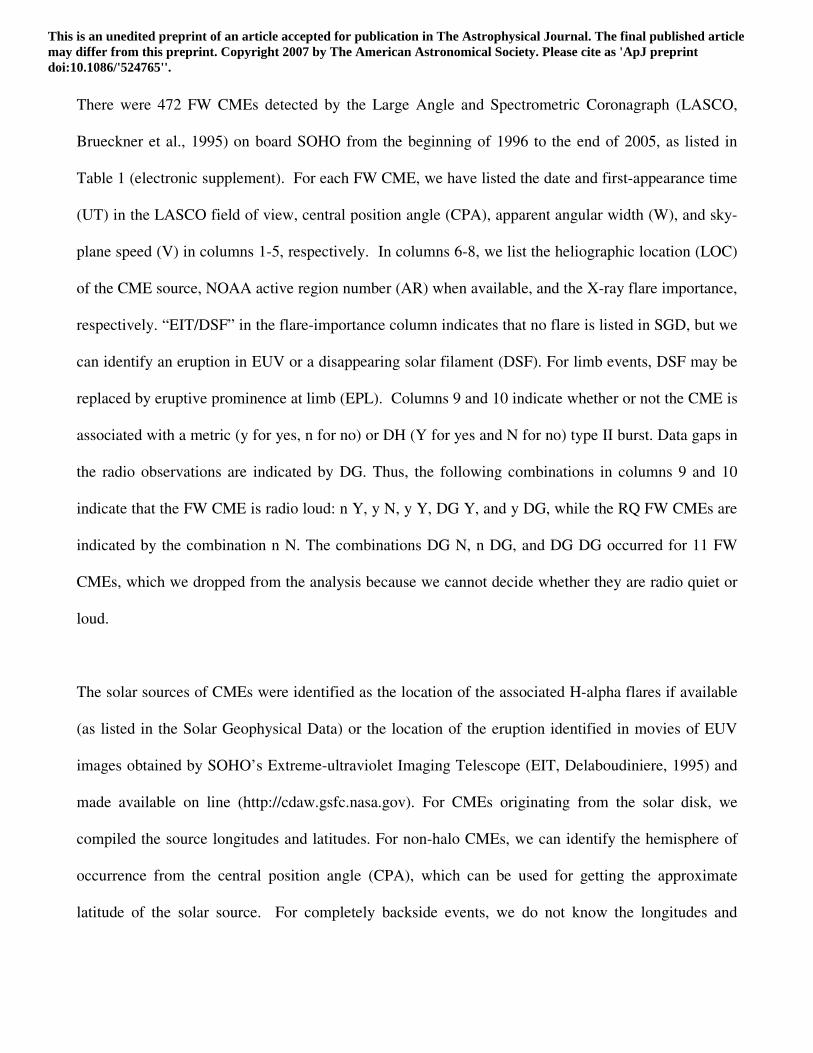
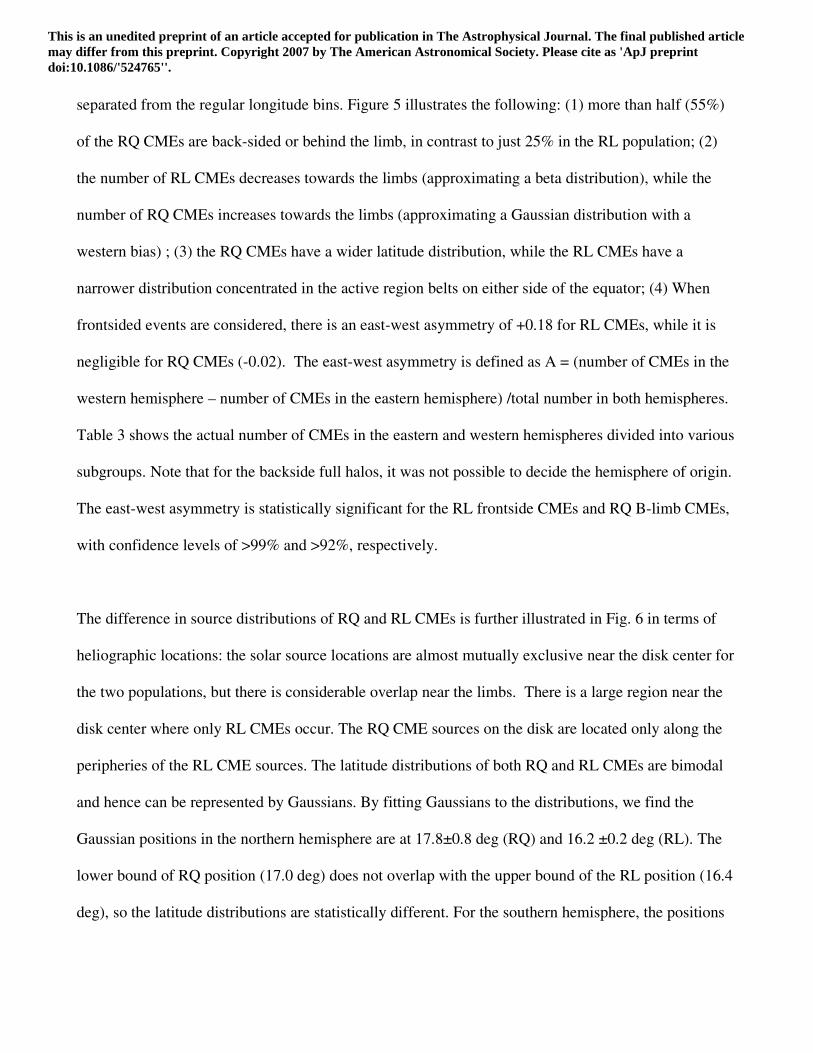
There were 472 FW CMEs detected by the Large Angle and Spectrometric Coronagraph (LASCO,
Brueckner et al., 1995) on board SOHO from the beginning of 1996 to the end of 2005, as listed in
Table 1 (electronic supplement). For each FW CME, we have listed the date and first-appearance time
(UT) in the LASCO field of view, central position angle (CPA), apparent angular width (W), and sky-
plane speed (V) in columns 1-5, respectively. In columns 6-8, we list the heliographic location (LOC)
of the CME source, NOAA active region number (AR) when available, and the X-ray flare importance,
respectively. “EIT/DSF” in the flare-importance column indicates that no flare is listed in SGD, but we
can identify an eruption in EUV or a disappearing solar filament (DSF). For limb events, DSF may be
replaced by eruptive prominence at limb (EPL). Columns 9 and 10 indicate whether or not the CME is
associated with a metric (y for yes, n for no) or DH (Y for yes and N for no) type II burst. Data gaps in
the radio observations are indicated by DG. Thus, the following combinations in columns 9 and 10
indicate that the FW CME is radio loud: n Y, y N, y Y, DG Y, and y DG, while the RQ FW CMEs are
indicated by the combination n N. The combinations DG N, n DG, and DG DG occurred for 11 FW
CMEs, which we dropped from the analysis because we cannot decide whether they are radio quiet or
loud.
The solar sources of CMEs were identified as the location of the associated H-alpha flares if available
(as listed in the Solar Geophysical Data) or the location of the eruption identified in movies of EUV
images obtained by SOHO’s Extreme-ultraviolet Imaging Telescope (EIT, Delaboudiniere, 1995) and
made available on line (http://cdaw.gsfc.nasa.gov). For CMEs originating from the solar disk, we
compiled the source longitudes and latitudes. For non-halo CMEs, we can identify the hemisphere of
occurrence from the central position angle (CPA), which can be used for getting the approximate
latitude of the solar source. For completely backside events, we do not know the longitudes and
This is an unedited preprint of an article accepted for publication in The Astrophysical Journal. The final published articlemay differ from this preprint. Copyright 2007 by The American Astronomical Society. Please cite as 'ApJ preprintdoi:10.1086/'524765''.

latitudes. For some CMEs, the solar sources are just behind the limb and we typically see a dimming
signature in EUV difference images above the limb. We refer to these as B-limb events because we can
say behind which limb the CMEs originate as opposed to the backside events.
3. Analysis and Results
The number of CMEs in the FW, RQ, and RL populations is sufficiently large so that meaningful
statistical results can be obtained. We compare the speed, width, X-ray flare size, and source
distributions among the three populations. We also use the general population of CMEs for reference.
The FW CMEs constitute only a small fraction (~4.5%) of all CMEs: there are only 472 FW CMEs
among the >104 CMEs recorded over the 10-year study period. Of the 461 FW CMEs considered for
the analysis, 193 (or 42%) were radio quiet and the rest (268 or 58%) were radio loud.
3.1 Speed and Width Distributions
Figure 2 shows the speed and width distributions of all FW, RQ, and RL CMEs. The arithmetic-mean
speeds for RQ and RL CMEs were 1117 km/s and 1438 km/s, respectively compared to 1303 km/s for
all FW CMEs. These speeds are greater than the average speed (470 km/s) of the general population by
a factor of 2-3. Thus the RQ and FW RL CMEs, respectively correspond to the lower- and higher-
speed subsets of the FW CMEs. The median speeds also have similar variations among different CME
populations (see Fig. 2).
In order to see if the difference in average speeds among the three FW CME populations is significant,
we fitted an exponential function of the form f ~ exp (- αv), where v is the speed in excess of the first
bin (1000 km/s) and 1/α represents the mean of the distribution (the speed at which the distribution
This is an unedited preprint of an article accepted for publication in The Astrophysical Journal. The final published articlemay differ from this preprint. Copyright 2007 by The American Astronomical Society. Please cite as 'ApJ preprintdoi:10.1086/'524765''.

drops to 1/e of its peak value). Figure 3 shows the speed distributions with the superposed exponential
fits. The α-values are also shown on the plot with the standard error obtained from the fitting procedure.
The mean values of the distributions are given by 1/α, which are also given on the plots in Fig. 3. We
notice that the upper and lower bounds of α for the three populations have no overlap, so the mean
values are distinct. In fact, the corresponding error bars (< 45 km/s) on the average speed are much
smaller than the bin size (200 km/s).
The width distributions of RQ and RL CMEs also show some significant differences (see Fig. 2). Halo
CMEs are generally more energetic because of their higher speeds and expected large widths
(Gopalswamy, 2004; Gopalswamy et al., 2007). Therefore, we can use the fraction of full halos as an
indicator of the presence of energetic CMEs in a population. The fraction of full halos is 41.9% for all
FW CMEs, bracketed by the fractions in RQ (17.9%) and RL (59.7%) populations. The general
population has the smallest fraction (3.6%). The full-halo bin (width = 360 deg) in Fig. 2 dominates in
the all FW and RL CME distributions. In the case of RQ CMEs, the full-halo bin is not the largest.
Table 2 compares the widths of FW, RQ, RL, and the general population of CMEs. The average width
of wide non-halos (60 deg ≤ width ≤ 120 deg) is similar for the FW (86 deg), RQ (86 deg), and RL (89
deg) populations. Combining the speed and width results, we can conclude that the RQ CMEs are the
least energetic on the average, while the RL CMEs are the most energetic.
3.2 Flare Sizes
It was possible to identify the soft X-ray flares and their sizes (peak X-ray flux expressed as flare class)
in the source regions of 81 RQ and 211 RL CMEs. The flare-size distributions in Fig. 4 show that the
median size of flares associated with RQ CMEs (C6.9) is smaller than that in RL CMEs (M3.9) by
This is an unedited preprint of an article accepted for publication in The Astrophysical Journal. The final published articlemay differ from this preprint. Copyright 2007 by The American Astronomical Society. Please cite as 'ApJ preprintdoi:10.1086/'524765''.

slightly less than an order of magnitude. The flares associated with RQ CMEs are predominantly of C-
class: of the 81 flares, 48 are of C-class and 26 are of M-class. Only 3 are of X-class and 4 are of B-
class. In contrast, the RL CMEs are dominated by M- and X-class flares (see Fig. 4): there are 109
M-, 66 X-, 41 C-, and 1 B-class flares. True sizes of flares occurring close to the limb are generally
unknown because of partial occultation by limbs. To avoid this problem, we considered subsets of RQ
and RL CMEs associated with flares occurring at least 15 degrees away from the limb (central
meridian distance < 85 degrees), resulting in 49 such RQ CMEs and 161 RL CMEs whose median
flare sizes are C7.4 and M5.1, respectively. The mean flare sizes from log-normal fits to the flare
distributions are C2.0 (RQ) and M1.6 (RL), respectively with errors less than +/- 1% in the mean
values. Thus both mean and median values confirm that the RQ CMEs are associated with weaker
flares. A weak correlation between CME kinetic energy and X-ray flare size is well known (e.g.,
Hundhausen, 1997), so the smaller flare size for RQ CMEs is consistent with the kinematic properties
discussed in the previous subsection. Therefore, the difference in flare sizes is consistent with the
difference in speeds and widths of RQ and RL CMEs.
From Fig. 4, we also note that the fraction of RQ CMEs with sources on the disk (81 out of 193 or
42%) is relatively small compared to the corresponding fraction (211 out of 268 or 79%) for the RL
CMEs. This is discussed in the following subsection.
3.3 CME Source Distributions
The longitude and latitude distributions of RQ and RL CMEs are shown in Fig. 5. Backside full halos
are eliminated because we do not know their source latitudes and longitudes. Events which are behind
the limb are included in the < -90 deg (eastern events) and > 90 deg (western events) bins, shown well
This is an unedited preprint of an article accepted for publication in The Astrophysical Journal. The final published articlemay differ from this preprint. Copyright 2007 by The American Astronomical Society. Please cite as 'ApJ preprintdoi:10.1086/'524765''.
separated from the regular longitude bins. Figure 5 illustrates the following: (1) more than half (55%)
of the RQ CMEs are back-sided or behind the limb, in contrast to just 25% in the RL population; (2)
the number of RL CMEs decreases towards the limbs (approximating a beta distribution), while the
number of RQ CMEs increases towards the limbs (approximating a Gaussian distribution with a
western bias) ; (3) the RQ CMEs have a wider latitude distribution, while the RL CMEs have a
narrower distribution concentrated in the active region belts on either side of the equator; (4) When
frontsided events are considered, there is an east-west asymmetry of +0.18 for RL CMEs, while it is
negligible for RQ CMEs (-0.02). The east-west asymmetry is defined as A = (number of CMEs in the
western hemisphere – number of CMEs in the eastern hemisphere) /total number in both hemispheres.
Table 3 shows the actual number of CMEs in the eastern and western hemispheres divided into various
subgroups. Note that for the backside full halos, it was not possible to decide the hemisphere of origin.
The east-west asymmetry is statistically significant for the RL frontside CMEs and RQ B-limb CMEs,
with confidence levels of >99% and >92%, respectively.
The difference in source distributions of RQ and RL CMEs is further illustrated in Fig. 6 in terms of
heliographic locations: the solar source locations are almost mutually exclusive near the disk center for
the two populations, but there is considerable overlap near the limbs. There is a large region near the
disk center where only RL CMEs occur. The RQ CME sources on the disk are located only along the
peripheries of the RL CME sources. The latitude distributions of both RQ and RL CMEs are bimodal
and hence can be represented by Gaussians. By fitting Gaussians to the distributions, we find the
Gaussian positions in the northern hemisphere are at 17.8±0.8 deg (RQ) and 16.2 ±0.2 deg (RL). The
lower bound of RQ position (17.0 deg) does not overlap with the upper bound of the RL position (16.4
deg), so the latitude distributions are statistically different. For the southern hemisphere, the positions
This is an unedited preprint of an article accepted for publication in The Astrophysical Journal. The final published articlemay differ from this preprint. Copyright 2007 by The American Astronomical Society. Please cite as 'ApJ preprintdoi:10.1086/'524765''.
are: -15.2 ± 0.6 deg (RQ) and -13.9 ± 0.2 deg (RL). Once again, the lower-latitude bound of the RQ
position (-14.6 deg) does not overlap with the higher-latitude bound of the RL position (-14.1 deg).
The predominant back-sided sources, more sources near the limb and the lack of sources near the disk
center, all suggest that the radio quiet CMEs are ejected at large angles to the to the Sun-Earth line.
One of the reasons for the lack of disk-center RQ CMEs is the projection effects. A 900 km/s CME at
the limb would appear to be much slower when originating near the disk center and hence may not be
selected. This will be further discussed in section 4.
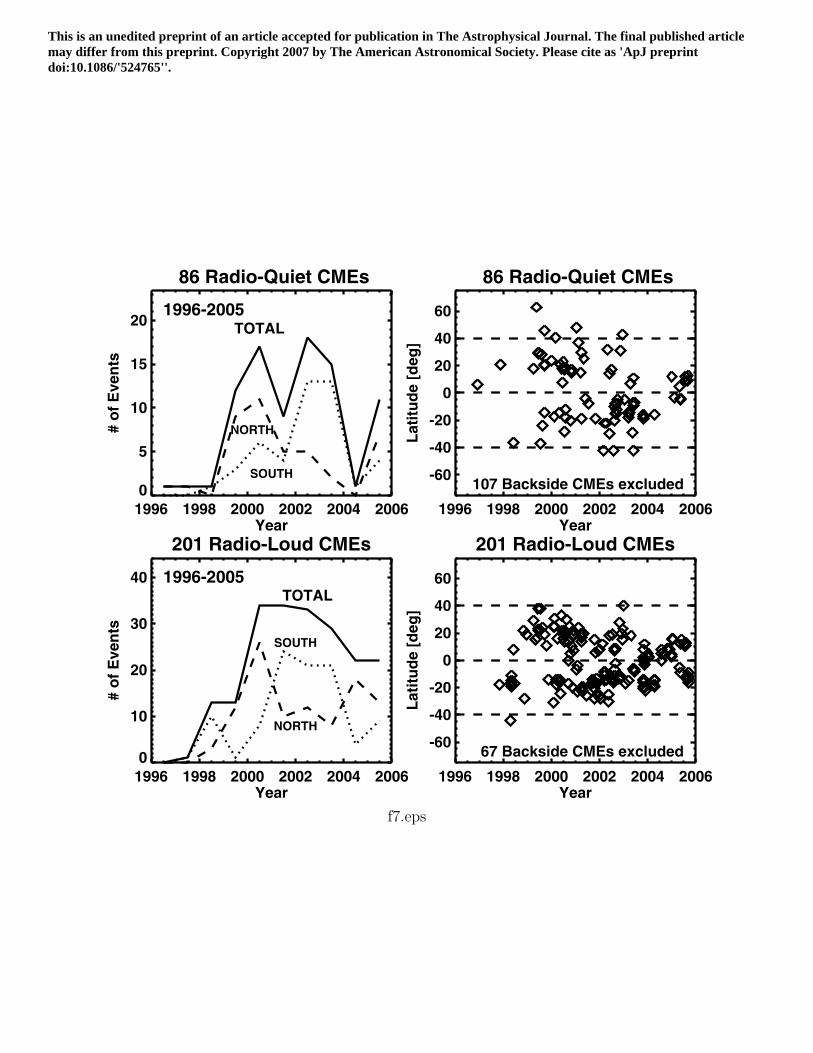
3.4 Solar-cycle Variation of Source Locations
The variation of the annual number of RQ and RL CMEs and their source latitudes are shown in Fig. 7.
We have used only those CMEs with known source locations. In the latitude – time plot, the RL CME
sources are located well within ±40 deg. The RL CME sources also follow the butterfly diagram,
which is not obvious in the case of RQ CMEs. There are relatively more RQ CME sources near the 40-
deg latitude than the RL sources, confirming the latitude distribution in Figs. 5 and 6. The source
locations also show a significant north-south asymmetry over short timescales, although none is
noticeable for the whole period (see Fig. 7). Both RQ and RL populations have more CMEs from the
northern hemisphere around year 2000. There are more RL CMEs from the southern hemisphere
around the year 2002, while the RQ CMEs appear more in number during 2003. These variations
simply reflect the closed-field regions available and active in the two hemispheres. The annual
variation of the RQ and RL CME numbers are distinct mainly during the solar maximum years. The
RQ CMEs shows a dip similar to the general population (see Gopalswamy, 2004), while the RL CMEs
have a broad maximum with no dip. When the northern and southern hemispheric sources are
considered separately, we see the first peak in RQ CMEs is contributed mainly from the northern
This is an unedited preprint of an article accepted for publication in The Astrophysical Journal. The final published articlemay differ from this preprint. Copyright 2007 by The American Astronomical Society. Please cite as 'ApJ preprintdoi:10.1086/'524765''.

hemisphere, while the second peak is dominated by the southern hemispheric events. For the RL
CMEs also one can see varying southern and northern hemispheric events, but the southern events
have a broad maximum, which is reflected in the total number. There is a clear dip in the number of
RL CMEs during the year 1999, consistent with the low number of SEP events (Gopalswamy et al.,
2003a) and geoeffective halo CMEs during that year (Gopalswamy et al, 2007). Finally, there is an
increase the number of CMEs in both the populations during the year 2005, which may be due to a
couple of super active regions.
3.5 Radio Quiet CMEs and Solar Energetic Particle Events
It is well known that type II radio bursts especially at longer wavelengths are good indicators of large
solar energetic particle (SEP) events (Gopalswamy, 2003; Cliver et al. 2004; Gopalswamy, 2006). So,
RQ CMEs should not be associated with SEP events. When we searched the GOES data for large SEP
events (those with a proton intensity of >10 pfu in the >10 MeV channel), none was found. However,
13 RQ CMEs (## 3, 7, 94, 117, 123, 132, 234, 262, 281, 322, 334, 356, and 434 in Table 1) showed
small particle enhancements above the GOES detection threshold (~0.1pfu) around the time of the RQ
CME onset. The peak fluxes of these events were well below 10 pfu and hence none of them would
qualify as large SEP events. For five events (#7 on 1997 November 14 at 10:04 UT, #117 on 2000
July 12 at 11:06 UT, #132 on 2000 September 19 at 13:50 UT, #234 on 2002 March 17 at 10:34 UT,
and #334 on 2003 May 27 at 22:06 UT), the SEP association is questionable either because of the
presence of other CMEs, or because of enhanced background SEP flux from previous events. The only
SEP event with intensity close to 10 pfu was on 2000 July 27 around 20 UT. There were two RQ
CMEs associated with this, a backside halo at 19:54 UT and a frontside non-halo at 20:06 UT. It is
possible that any metric type II burst must have been occulted in the case of the backside halo. The
This is an unedited preprint of an article accepted for publication in The Astrophysical Journal. The final published articlemay differ from this preprint. Copyright 2007 by The American Astronomical Society. Please cite as 'ApJ preprintdoi:10.1086/'524765''.
remaining 7 RQ CMEs were associated with unambiguous SEP enhancements, but the SEP intensity
was generally very low (< 1 pfu for 4 events < 2 pfu for 2 events). SEPs can be gradual (produced by
CME-driven shocks) and impulsive (produced by flare reconnection process), but the impulsive events
are generally of smaller in intensity and duration, and have a different composition properties such as
richness in He3 (Reames et al., 1999; Mewaldt, 2006). For two events, the intensity lasted for close to
1 day, so these may not be impulsive events due to flares. For the remaining events, further analysis is
needed to conclusively say whether these are gradual SEP events. Three of the RQ CMEs (2000 April
23, 2002 August 20, and 2003 October 24) with minor SEP enhancements occurred during intense type
III storms, so one cannot rule out the possibility that the weak type II bursts might have been masked.
Nevertheless, the presence of minor SEP events in association with a few RQ CMEs suggests that
weak shocks might have been present at least in a few cases that were capable of producing weak SEP
events. The lack of type II bursts may be due to slightly differing requirements for the production of
MeV ions and keV electrons by CME-driven shocks or differing detection thresholds for SEPs and
radio bursts. A detailed investigation of SEP association using SOHO/ERNE data (which have a lower
threshold than the GOES instrument) will be reported elsewhere. Recall that 42% of FW CMEs are
radio quiet and lack large SEP events. This result has significant implications for space weather. We
can eliminate ~42% FW CMEs as unimportant for producing large SEP events since they lack type II
radio bursts.
4. Discussion
CMEs drive shocks in the corona and interplanetary medium that produce type II radio emission. Such
CMEs are known to be faster and wider on the average (Gopalswamy et al., 2005). However, when we
start from fast (speed ≥ 900 km/s) and wide (angular width ≥ 60 degrees) CMEs, about 40% of them
This is an unedited preprint of an article accepted for publication in The Astrophysical Journal. The final published articlemay differ from this preprint. Copyright 2007 by The American Astronomical Society. Please cite as 'ApJ preprintdoi:10.1086/'524765''.

are not associated with type II radio bursts. In order to understand why these CMEs are radio quiet, we
examined the kinematic, flare, and source properties of the RQ CMEs and compared them with the
corresponding properties of the RL CMEs. The two populations seem to differ with respect to all these
three sets of properties.
RQ CMEs were first considered by Sheeley et al. (1984) while studying the association between metric
type II bursts and CMEs observed during 1979-1982 with the radio quietness decided by the lack of
metric type II bursts. The RQ CMEs in Sheeley et al. (1984) had speeds up to 1600 km/s with a median
value ~ 455 km/s. These authors explained the radio quietness as due either to fast CMEs not attaining
super-Alfvenic speeds, or to CME-driven shocks that are unable to excite type II emission in the lower
corona. Here we considered radio quietness as the lack of type II bursts in the metric or DH domains
for fast and wide CMEs. The average speed of RQ CMEs in our sample exceeds 1000 km/s implying
that Alfven speeds in the corona and near-Sun interplanetary medium can occasionally exceed 1000
km/s. High Alfven speeds are known in coronal holes, but we infer from the RQ CMEs that they can
occur even in the quiet corona. Such regions have been described as “tenuous” corona where the
density is significantly low making the Alfven speed very high (Gopalswamy et al., 2003b). The FW
CMEs launched into a tenuous corona were found to be SEP-poor; these CMEs are also radio quiet
because CME-driven shocks lacking ion acceleration may not accelerate electrons either. A
preliminary survey finds that none of the RQ CMEs were associated with large SEP events. It is
difficult for CMEs to drive shocks when launched into such a high-Alfven speed medium, so the RQ
CMEs either do not drive shocks or the shocks are so weak that they do not accelerate significant
levels of electrons needed for a type II burst.
This is an unedited preprint of an article accepted for publication in The Astrophysical Journal. The final published articlemay differ from this preprint. Copyright 2007 by The American Astronomical Society. Please cite as 'ApJ preprintdoi:10.1086/'524765''.

It is difficult to verify Sheeley et al. (1984) suggestion that some CME-driven shocks may be unable to
excite type II emission in the lower corona because radio emission is currently the only means of
detecting shocks near the Sun. Sheeley et al. (1984) did find shocks detected in situ that were
associated with fast RQ CMEs. But we cannot be sure whether the shocks were present near the Sun.
Large SEP events can indicate CME-driven shocks near the Sun, but as we discussed in section 3.5, the
RQ CMEs were not associated with large SEP events. The SEP events in the few cases were very
small in intensity, so these indicate only weak shocks at best. Another possibility is to look for white-
light signatures of CMEs (Sheeley et al. 2000; Vourlidas et al. 2003). Vourlidas et al. (2003) analyzed
Sharp features at the flanks of a few CMEs have been interpreted as white-light shock signature. A
systematic examination of is needed to see if such faint extensions are indeed white-light shocks. It is
possible that some accelerating CMEs attain super Alfvenic speeds only at large distances from the
Sun and hence drive shocks there. In fact, we found a large number of shocks detected at 1 AU that do
not have type II burst association (see Gopalswamy et al., 2001a). Properties of CMEs associated with
such RQ shocks will be reported elsewhere.
Let us consider the implications of the result that the RQ CMEs are launched predominantly away
from the Sun-Earth line. One of the implications is that the area of the shock surface “visible” to the
observer is drastically reduced when the CME is near the limb or backsided. The effect may be similar
when the CME is narrow (less shock surface compared to a wide CME). Radio bursts from back-sided
CMEs are generally narrower in bandwidth for the same reason (see Gopalswamy 2002 for an
example). It is also well known that limb type II bursts in the metric domain are generally observed
only in the harmonic mode because the fundamental component cannot propagate to the observer (see
e.g., Nelson and Melrose, 1985). It is possible that some of the CMEs (especially the backsided ones)
This is an unedited preprint of an article accepted for publication in The Astrophysical Journal. The final published articlemay differ from this preprint. Copyright 2007 by The American Astronomical Society. Please cite as 'ApJ preprintdoi:10.1086/'524765''.

may not be radio quiet at the source but the propagation effects make them appear so. This is
especially true for metric type II bursts. The second implication is that most of the RQ CMEs may not
be subject to projection effects (because most of them are within ±30 deg from the sky plane), so the
measured speeds are closer to the actual speeds. On the other hand, for the disk CMEs the speeds are
underestimated due to projection effects (see Gopalswamy et al., 2007, who found that for full halo
CMEs, the average speed of disk halos is smaller than that of limb halos by a factor of 1.6 ). This
means that a 900 km/s CME at the limb would measure much slower when appearing closer to the disk
center. This may be reason for the dearth of RQ CMEs near the disk center. Thus a limb CME of a
given speed is less energetic compared to a disk CME of the same speed. This makes the RQ CMEs
inherently less energetic, further strengthening the conclusion derived in section 3.1. However, the
fact remains that many CMEs with true speed exceeding 1000 km/s are radio quiet. The third
implication, especially for CMEs occurring at higher latitudes, is that the eruptions may be occurring
outside active regions – in quiescent filament regions. Flares associated with quiescent filament
eruptions consist of extended post-eruption arcades with weak soft X-ray emission. This is consistent
with the weaker soft X-ray flare sizes associated with RQ CMEs presented in section 3.2.
There are some RQ CMEs originating on the disk and ejected at smaller angles to the Sun-Earth line,
and have kinematic and source properties overlapping with those of the RL CMEs. Theses CMEs are
also likely to have actual speeds higher than the sky-plane speeds and they should not have the
geometry problem discussed above, so why don’t these CMEs produce radio emission? To examine
this, we consider a set of 10 western hemispheric RQ CMEs originating from within ±20 deg. latitude
and W00 to W60 in longitude (see Table 4). All but one is southern hemispheric events. Two events
are marginally disk events (W62). The speeds are barely above the minimum speed (900 km/s) used
This is an unedited preprint of an article accepted for publication in The Astrophysical Journal. The final published articlemay differ from this preprint. Copyright 2007 by The American Astronomical Society. Please cite as 'ApJ preprintdoi:10.1086/'524765''.

for selecting the CMEs, except for an outlier (2001 July 19 CME). The average speed of the remaining
9 CMEs is only 1020 km/s, which is less than the average speed (1117 km/s) of all RQ CMEs. The
outlier originated from S08W62 and moved out with a speed of 1668 km/s. Two frames of the
SOHO/LASCO/EIT images in Fig. 8 show this CME. The eruption was first seen in the EUV
difference image as a very compact eruption. Thirty minutes later, the CME was seen in the LASCO
field of view over the entire west limb. However, the CME contains a narrow bright feature within a
faint extended structure (similar to the event discussed by Vourlidas et al. 2003). Thus the CME is
somewhat peculiar in its appearance and has the characteristics of a narrow CME than a wide CME of
relatively uniform brightness. A systematic measurement of CME widths of the bright and faint
features has confirmed that most of the RQ CMEs are consistent with this conclusion (Michalek et al.
2007). Retroactively, a small drifting radio feature was found in the Wind/WAVES dynamic spectrum
(not shown) in the frequency range 14-9 MHz at ~10:20 UT and a small SEP event in the
SOHO/ERNE data (but none in GOES data) associated with the 2001 July 19 CME. Since we have
selected disk events, the average speed of 1020 km/s is likely an underestimate due to projection
effects. If we apply the average factor of 1.6 derived for halo CMEs, these RQ CMEs can have an
actual speed of ~1600 km/s. Since the visibility of type II bursts is not an issue for these CMEs, one
can conclude that CMEs with speeds as high as 1600 km/s may not be driving a shock near the Sun, or
at least the Mach number is not high enough to accelerate sufficient number of electrons to produce
detectable type II bursts. This means the Alfven speed in the ambient medium can be as high as 1600
km/s. We know from previous studies that limb CMEs with speeds as low as ~500 km/s produce DH
type II bursts (Gopalswamy et al. 2001b). The average speed of CMEs associated with purely metric
type II bursts originating close to the limb is 610 km/s (Gopalswamy et al., 2005). Comparing these
This is an unedited preprint of an article accepted for publication in The Astrophysical Journal. The final published articlemay differ from this preprint. Copyright 2007 by The American Astronomical Society. Please cite as 'ApJ preprintdoi:10.1086/'524765''.

with the speeds of the RQ CMEs, we can conclude that the Alfven speed in the corona and near-Sun
interplanetary medium can easily vary by a factor of 3.
We can summarize the possible reasons for the radio quietness of CMEs as follows: (i) smaller speed
and width of CMEs, (ii) smaller flare size, and (iii) Source regions being too far away from the Sun-
observer line. All three observational results point to the low energy of the RQ CMEs: width is
proportional to mass, so low speed narrow CMEs indicate low energy. Flare size weakly correlates
with CME kinetic energy so smaller flare size also implies lower CME energy. Limb CMEs have
lower energy compared to CMEs of same speed on the disk, so (iii) also implies lower energy. Item
(iii) may also be related to the visibility of the radio-emitting surface and possible hindrance to the
propagation of radiation to the observer while the shock itself may be producing type II radio emission.
Some of these CMEs may not be radio quiet if viewed from a suitable vantage point as has been noted
by Florens et al (2007). Future observations from the STEREO spacecraft may be able to clarify this
issue when the spacecraft separation becomes sufficiently large. The lower kinetic energy of CMEs
means they are less likely to drive shocks, especially when the medium is tenuous (or they may be
driving extremely weak shocks, which are not capable of accelerating electrons or ions). It is possible
that some sections of the CME-driven shock propagate through regions of lower Alfven speed and
produce radio emission but this may not be intense enough to be above the instrument threshold. For
RQ CMEs with speed, width, and source location, similar to those of RL CMEs, the difference may
just be the higher ambient Alfven speed encountered by the RQ CMEs. Since there are some truly RQ
CMEs originating on the disk, it is safe to conclude that the Alfven speed in the low-latitude outer
corona can often exceed 1000 km/s and can vary by a factor of ~3.
5. Conclusions
This is an unedited preprint of an article accepted for publication in The Astrophysical Journal. The final published articlemay differ from this preprint. Copyright 2007 by The American Astronomical Society. Please cite as 'ApJ preprintdoi:10.1086/'524765''.

We compiled the basic properties (speed, width, source locations), and sizes of associated soft X-ray
flares of a large number of fast and wide CMEs with and without associated type II radio bursts to
investigate why a large number of seemingly energetic CMEs are radio quiet. Observationally, we
have shown that radio quietness of CMEs may arise due to: (1) smaller speed and width (and hence
kinetic energy), (2) smaller soft X-ray flare sizes, and (3) eruption at large angles from the Sun-
observer line. The primary characteristic that distinguishes RQ and RL CMEs seems to be the lower
kinetic energy and all the other properties are consistent with this. However, there are many RL CMEs
with speeds << 900 km/s and RQ CMEs with speeds greater than 900 km/s, which points to the
important role played by the ambient medium in deciding the shock-driving capability of CMEs. The
characteristic speed (Alfven speed or fast mode speed) in the corona and interplanetary medium seem
to vary over a factor of ~3 and can often exceed 1000 km/s. Occasionally, the Alfven speed could be
as high as 1600 km/s. Thus a 500 km/s CME can be radio loud while a 1600 km/s CME can be radio
quiet depending on the characteristic speed of the medium through which the CMEs propagate. There
is a slight possibility that some back-sided RQ CMEs may not be truly so because of visibility issues,
but this needs confirmation with multiple spacecraft data. The complete lack of large SEP events
associated with the RQ CMEs helps eliminate ~ 42% of fast and wide CMEs that are not important for
space weather at least in geospace.
Acknowledgements: We thank P. Makela and A. Lara for helpful discussions. This work was
supported by NASA’s LWS TR&T and SR&T programs.
References
Bougeret, J.-L., et al. 1995, Space Sci. Rev., 71, 231
This is an unedited preprint of an article accepted for publication in The Astrophysical Journal. The final published articlemay differ from this preprint. Copyright 2007 by The American Astronomical Society. Please cite as 'ApJ preprintdoi:10.1086/'524765''.

Brueckner, G. E., et al. 1995, Sol. Phys., 162, 357
Cliver, E. W., Kahler, S. W., & Reames, D. V. 2004, ApJ, 605, 902
Delaboudiniere, J.-P., et al. 1995, Sol. Phys., 162, 291
Florens, M. S. L., Cairns, I. H., Knock, S. A., and Robinson, P. A., 2007, Geophys. Res. Lett., 34,
L04104
Gopalswamy, N. 2006, in AGU Monograph 165, Solar eruptions and energetic particles, ed. N.
Gopalswamy, R. Mewaldt, & J. Torsti, p. 207
Gopalswamy, N. 2003, Geophys. Res. Lett., 30, 8013, doi:10.1029/2003GL017277
Gopalswamy, N. 2004, in The Sun the Heliosphere As an Integrated System, ed. G. Poletto & S. Suess
(New York: Springer), 201
Gopalswamy, N., Lara, A., Kaiser, M. L. & Bougeret, J.-L. 2001a, J. Geophys. Res., 106, 25261
Gopalswamy, N., Yashiro, S., Kaiser, M. L., Howard, R. A., & Bougeret, J.-L. 2001b, J. Geophys.
Res., 106, 29219
Gopalswamy, N., et al. 2002, in COSPAR Colloq. Ser. 14, Solar terrestrial magnetic activity and space
environment, ed. H. N. Wang & R. Xu, 169
Gopalswamy, N., et al. 2003a, Geophys. Res. Lett., 30, 8015, doi:10.1029/2002GL016435
Gopalswamy, N., et al. 2003b, in AIP Conf. Proc. 679, Solar Wind Ten, ed. M. Velli, R. Bruno, & F.
Malara (New York: AIP), 608
Gopalswamy, N., et al. 2005, J. Geophys. Res., 110, A12S07, doi:10.1029/2005JA011158
Gopalswamy, N., et al. 2007, J. Geophys. Res., 112, A06112, doi:10.1029/2006JA012149
Hundhausen, A. J. 1997, in AGU Monograph 99, Coronal Mass Ejections, ed. N. Crooker, J. A.
Joselyn, & J. Feynman, 1
Marque, C., Posner, A., & Klein, K.-L. 2006, ApJ, 642, 1222
This is an unedited preprint of an article accepted for publication in The Astrophysical Journal. The final published articlemay differ from this preprint. Copyright 2007 by The American Astronomical Society. Please cite as 'ApJ preprintdoi:10.1086/'524765''.

Mewaldt, R. A. 2006, Space Sci. Rev., 124, 303
Michalek, G., Gopalswamy, N. and Xie, H., Solar Phys., in press, 2007
Nelson, G. J. & Melrose, D. B. 1985, in Solar Radiophysics, ed. D. J. McLean & N. R. Labrum
(Cambridge: Cambridge Univ. Press), 333
Reames, D. V. 1999, Space Sci. Rev., 90, 413
Sheeley, N. R., et al. 1984, ApJ, 279, 839
Sheeley, N. R., Hakala, W. N., and Wang, Y.-M. 2000, J. Geophys. Res., 105, 5081
Vourlidas, A., Wu, S. T., Wang, A. H., Subramanian, P., and Howard, R. A. 2003, Astrophys. J., 598,
1392
Yashiro, S. , et al., 2004, J. Geophys. Res., 109, A07105
This is an unedited preprint of an article accepted for publication in The Astrophysical Journal. The final published articlemay differ from this preprint. Copyright 2007 by The American Astronomical Society. Please cite as 'ApJ preprintdoi:10.1086/'524765''.

Table 1. Properties of fast and wide (FW) CMEs and their type II burst association SNo CME Date UT CPA W V LOC AR Imp m DH (1) (2) (3) (4) (5) (6) (7) (8) (9) (10) (11) 001 1996/07/12 15:37 260 68 1085 S11W72 7978 C4.9 DG N 002 1996/08/22 08:38 91 125 979 E90b 7986 C3.6 y Y? 003 1996/11/28 16:50 267 101 984 N06W90 7997 C1.3 n N 004 1997/02/23 02:55 82 90 905 NE90b 8019 B7.2 n N 005 1997/10/07 13:30 246 167 1271 Back ----- ---- y N 006 1997/11/06 12:10 360 360 1556 S18W63 8100 X9.4 y Y 007 1997/11/14 10:14 79 86 1042 N21E70 8108 C4.6 n N 008 1998/01/03 09:42 290 85 1020 NW90b ----- ---- n N 009 1998/03/29 03:48 360 360 1397 SW90b ----- ---- y Y 010 1998/03/31 06:12 360 360 1992 Back ----- ---- y Y?
[The complete version of this table is in the electronic edition of the Journal. The printed edition contains only a
sample.]
This is an unedited preprint of an article accepted for publication in The Astrophysical Journal. The final published articlemay differ from this preprint. Copyright 2007 by The American Astronomical Society. Please cite as 'ApJ preprintdoi:10.1086/'524765''.

Table 2. Widths of all (ALL), Fast and wide (FW), radio quiet (RQ), and radio loud (RL) CMEs.
ALL Full Halos Partial Halos 60 ≤W<120 deg W<60 deg CME
No. No. (%) No. (%) <W> No. (%) <W> No. (%) <W> ALL 10601 379 ( 3.6%) 811 ( 7.7%) 163 2681 (25.3%) 81 6724 (63.4%) 30 FW 472 198 (41.9%) 160 (33.9%) 180 114 (24.2%) 86 --- RQ 193 31 (16.1%) 79 (40.9%) 168 83 (43.0%) 86 --- RL 268 160 (59.7%) 81 (30.2%) 192 27 (10.1%) 89 ---
This is an unedited preprint of an article accepted for publication in The Astrophysical Journal. The final published articlemay differ from this preprint. Copyright 2007 by The American Astronomical Society. Please cite as 'ApJ preprintdoi:10.1086/'524765''.

Table 3. Numbers of RL and RQ CMEs in the eastern and western hemispheres with percentages in parentheses. Behind the limb (Blimb) CMEs are shown separately
East West Radio loud 82 (41%) 119 (59%) Radio loud (Blimb) 24 (51%) 23 (49%)
Radio quiet 44 (51%) 42 (49%) Radio quiet (Blimb) 47 (60%) 31 (40%)
Totalc 197 48% 215 (52%) a Number of events with sources on the disk up to a central\ meridian distance of 90 deg. bNumber of events in which the particular limb behind which the CME occurred can be identified cExcludes completely backside events
This is an unedited preprint of an article accepted for publication in The Astrophysical Journal. The final published articlemay differ from this preprint. Copyright 2007 by The American Astronomical Society. Please cite as 'ApJ preprintdoi:10.1086/'524765''.

Table 4. List of RQ CMEs close to the disk center CME Date UT CPA W V LOC AR Imp 1999/09/23 15:54 262 77 1150 S14W47 ----- EIT/DSF 2000/02/09 19:54 360 360 910 S17W40 8853 C7.4/2F 2001/07/19 10:30 275 166 1668 S08W62 9537 M1.8/1B 2002/08/20 08:54 237 122 1099 S10W38 10069 M3.4/1B 2002/09/17 08:06 210 249 960 S12W33 10114 C8.6/1F 2003/03/14 18:06 232 137 991 S18W62 ----- EIT/DSF 2003/03/17 19:54 291 96 1020 S14W39 10314 X1.5 2003/04/13 09:06 301 91 936 N07W49 10330 C2.7 2004/04/09 20:30 227 273 977 S16W29 10588 C2.8/SF 2005/02/17 00:06 360 360 1135 S03W24 ----- C8.0
This is an unedited preprint of an article accepted for publication in The Astrophysical Journal. The final published articlemay differ from this preprint. Copyright 2007 by The American Astronomical Society. Please cite as 'ApJ preprintdoi:10.1086/'524765''.

Figure Captions
Figure 1: (top) Dynamic spectra from Wind/WAVES experiment. The left spectrum has a type III
burst but no type II burst. The right spectrum has both type II and Type III bursts. (bottom) the
corresponding CMEs from SOHO/LASCO. The 2005 September 10 CME on the right side is radio
loud because it is associated with a type II burst. The 2005 July 25 CME on the left is radio quiet
because it is not associated with observable type II burst. Type III bursts, which mark the onset of an
eruption are observed in association with both CMEs. The vertical white lines drawn on the dynamic
spectra mark the times of the CMEs. The CMEs had similar speeds (1893 km/s for the radio-loud and
1660 km/s for the radio-quiet CME).
Figure 2: Speed (left) and width (right) distributions of four populations of CMEs (detected from 1996
to the end of 2005) from top to bottom: all CMEs, fast and wide (FW) CMEs, RQ FW CMEs, and all
FW RL CMEs. The number of CMEs in each population is indicated on the plots. The average (Ave)
and median (Med) speeds are shown on the plots. The numbers in parentheses correspond to the subset
of CMEs with fast CMEs in the top-left panel and for FW RL CMEs in the bottom-left panel. The
fractions of full halos (FHs) in different populations are shown for all the distributions.
Figure 3. Speed distributions of FW, RQ and RL CMEs with exponential fits of the form exp (-αv)
superposed, where v is the speed above 1000 km/s. The values of α with the error bars are given on the
plot. The means speeds (given by 1/α) at which the distribution drops to 1/e of the peak values are also
indicated by arrows.
This is an unedited preprint of an article accepted for publication in The Astrophysical Journal. The final published articlemay differ from this preprint. Copyright 2007 by The American Astronomical Society. Please cite as 'ApJ preprintdoi:10.1086/'524765''.

Figure 4. Size distribution of GOES soft X-ray flares associated with RQ and RL CMEs: (top) all
flares for which position information is available and (bottom) flares occurring within 85 degrees from
the central meridian. The median flare sizes are shown on the plots. Log-normal fits to the distributions
yield mean values of C2.0 and M1.9 with error bars less than 1%.
Figure 5. Longitude (left) and latitude (right) distributions of RQ and RL CMEs. Behind-the-limb
(“BLimb” ) events are included in the <-90 and > 90 bins as determined from EUV signatures above
the limb. Completely backsided CMEs are not included in the distributions because their solar sources
are unknown. Note the remarkable differences (center-to-limb variation, number of backside events)
between the RQ and RL CMEs. Fitting Gaussians to the latitude distribution in each hemisphere, we
get the Gaussians peaking at 17.8±0.8 deg (north) and -15.2 ±0.6 deg (south) for RQ CMEs; 16.2±0.2
deg (north) and -13.9±0.2 deg (south) for RL CMEs.
Figure 6. Heliographic locations of RQ (left) and RL (middle) CMEs and their comparison (right). The
RL CMEs generally originate from center-west parts of the disk while the radio quiet CMEs
preferentially originate from limb regions. The east-west asymmetry of the RL CMEs is quite evident
(more western events). There are more eastern RQ events, but the difference is not as prominent.
Figure 7. Solar-cycle variation of the annual number (left) and source latitudes (right) of RQ and RL
CMEs. The numbers are shown for individual hemispheres and the total. The number of CMEs in the
northern and southern hemispheres peak at different times, roughly coinciding with the two peaks in
the distribution of daily CME rate. The CME latitudes closely follow the active region belt for RL
This is an unedited preprint of an article accepted for publication in The Astrophysical Journal. The final published articlemay differ from this preprint. Copyright 2007 by The American Astronomical Society. Please cite as 'ApJ preprintdoi:10.1086/'524765''.

CMEs (mimicking the butterfly diagram), but are more scattered for RQ CMEs (see also Fig. 5). Only
CMEs with known solar source locations are used for the plots.
Figure 8. One of the fastest RQ CMEs (2001 July 19, speed = 1668 km/s) at two instances: (left) in the
SOHO/EIT difference image at 10:00 UT showing the compact CME below the SOHO/LASCO
occulting disk and (right) when it first appeared in the LASCO field of view at 10:30 UT. The CME
has a bright narrow feature and an extended faint feature.
This is an unedited preprint of an article accepted for publication in The Astrophysical Journal. The final published articlemay differ from this preprint. Copyright 2007 by The American Astronomical Society. Please cite as 'ApJ preprintdoi:10.1086/'524765''.

f1.eps
This is an unedited preprint of an article accepted for publication in The Astrophysical Journal. The final published articlemay differ from this preprint. Copyright 2007 by The American Astronomical Society. Please cite as 'ApJ preprintdoi:10.1086/'524765''.

All LASCO CMEs
0
1000
2000
3000
4000
5000
# o
f E
ven
ts
0 1000 2000 3000
10503 Events Med 409 km/s (1087 km/s) Ave 470 km/s (1223 km/s)
FW CMEs
0
50
100
150
200
250
# o
f E
ven
ts
0 1000 2000 3000
472 Events Med 1173 km/s
Ave 1303 km/s
FW Radio-Quiet CMEs
0
50
100
150
# o
f E
ven
ts
0 1000 2000 3000
193 Events Med 1062 km/s
Ave 1117 km/s
FW Radio-Loud CMEs
Speed [km/s]
0
20
40
60
80
100
# o
f E
ven
ts
0 1000 2000 3000
268 Events Med 1342 km/s
Ave 1438 km/s
All LASCO CMEs
0
1000
2000
3000
4000
5000
# o
f E
ven
ts
0 90 180 270 360
10601 Events
FHs = 3.6%
FW CMEs
0
50
100
150
200
250
# o
f E
ven
ts
0 90 180 270 360
472 Events
FHs = 41.9%
FW Radio-Quiet CMEs
0
10
20
30
40
50
60
# o
f E
ven
ts
0 90 180 270 360
193 Events
FHs = 16.1%
FW Radio-Loud CMEs
Width [deg]
0
50
100
150
200
# o
f E
ven
ts
0 90 180 270 360
268 Events
FHs = 59.7%
f2.eps
This is an unedited preprint of an article accepted for publication in The Astrophysical Journal. The final published articlemay differ from this preprint. Copyright 2007 by The American Astronomical Society. Please cite as 'ApJ preprintdoi:10.1086/'524765''.

FW CMEs
0.0
0.2
0.4
0.6
0.8
1.0
1.2
1.4
No
rmal
ized
Fre
qu
ency
0 1000 2000 3000
α =(2.6±0.1) x10-3
1380 km/s
472 Events
FW Radio-Quiet CMEs
0.0
0.2
0.4
0.6
0.8
1.0
1.2
1.4
No
rmal
ized
Fre
qu
ency
0 1000 2000 3000
α =(4.6±0.3) x10-3
1218 km/s
193 Events
FW Radio-Loud CMEs
Speed [km/s]
0.0
0.2
0.4
0.6
0.8
1.0
1.2
1.4
No
rmal
ized
Fre
qu
ency
0 1000 2000 3000
α =(1.5±0.1) x10-3
1674 km/s
268 Events
f3.eps
This is an unedited preprint of an article accepted for publication in The Astrophysical Journal. The final published articlemay differ from this preprint. Copyright 2007 by The American Astronomical Society. Please cite as 'ApJ preprintdoi:10.1086/'524765''.

Radio-Quiet Flares
Flare Class
0
20
40
60
# o
f E
ven
ts
B C M X X10
81 EventsMed Flare Size = C6.9
Flare Class
0
10
20
30
40
# o
f E
ven
ts
B C M X X10
49 Disk Events(Lon < 85 deg)Med Flare Size = C7.4
Radio-Loud Flares
Flare Class
0
50
100
150
# o
f E
ven
ts
B C M X X10
211 EventsMed Flare Size = M3.9
Flare Class
0
20
40
60
80
100
120
# o
f E
ven
ts
B C M X X10
161 Disk Events(Lon < 85 deg)Med Flare Size = M5.1
f4.eps
This is an unedited preprint of an article accepted for publication in The Astrophysical Journal. The final published articlemay differ from this preprint. Copyright 2007 by The American Astronomical Society. Please cite as 'ApJ preprintdoi:10.1086/'524765''.

Longitude
0
10
20
30
40
<-90 -90 -60 -30 0 30 60 90 >90
# o
f F
W R
adio
-Qu
iet
Eve
nts
86 Frontside CMEs (45%) 78 BLimb CMEs (40%) 29 Backside CMEs (15%) excluded
Longitude [deg]
0
10
20
30
<-90 -90 -60 -30 0 30 60 90 >90
# o
f F
W R
adio
-Lo
ud
Eve
nts
201 Frontside CMEs (75%) 47 BLimb CMEs (18%) 20 Backside CMEs ( 7%) excluded
Latitude
0
5
10
15
20
25
-90 -60 -30 0 30 60 90
86 Frontside CMEs 78 BLimb CMEs excluded 29 Backside CMEs excluded
Latitude [deg]
0
20
40
60
-90 -60 -30 0 30 60 90
201 Frontside CMEs 47 BLimb CMEs excluded 20 Backside CMEs excluded
f5.eps
This is an unedited preprint of an article accepted for publication in The Astrophysical Journal. The final published articlemay differ from this preprint. Copyright 2007 by The American Astronomical Society. Please cite as 'ApJ preprintdoi:10.1086/'524765''.

N
S
E W
N
S
E W
N
S
E W
f6.eps
This is an unedited preprint of an article accepted for publication in The Astrophysical Journal. The final published articlemay differ from this preprint. Copyright 2007 by The American Astronomical Society. Please cite as 'ApJ preprintdoi:10.1086/'524765''.
86 Radio-Quiet CMEs
1996 1998 2000 2002 2004 2006Year
0
5
10
15
20
# o
f E
ven
ts
1996-2005TOTAL
NORTH
SOUTH
201 Radio-Loud CMEs
1996 1998 2000 2002 2004 2006Year
0
10
20
30
40
# o
f E
ven
ts
1996-2005TOTAL
NORTH
SOUTH
86 Radio-Quiet CMEs
1996 1998 2000 2002 2004 2006Year
-60
-40
-20
0
20
40
60
Lat
itu
de
[deg
]
107 Backside CMEs excluded
201 Radio-Loud CMEs
1996 1998 2000 2002 2004 2006Year
-60
-40
-20
0
20
40
60
Lat
itu
de
[deg
]
67 Backside CMEs excluded
f7.eps
This is an unedited preprint of an article accepted for publication in The Astrophysical Journal. The final published articlemay differ from this preprint. Copyright 2007 by The American Astronomical Society. Please cite as 'ApJ preprintdoi:10.1086/'524765''.

f8.eps
This is an unedited preprint of an article accepted for publication in The Astrophysical Journal. The final published articlemay differ from this preprint. Copyright 2007 by The American Astronomical Society. Please cite as 'ApJ preprintdoi:10.1086/'524765''.