Embed Size (px)
Citation preview
Calhoun: The NPS Institutional Archive
Theses and Dissertations Thesis Collection
1966-05
Radioactive gaseous effluents from the core of the
AGN-201 reactor at the United States Naval
Postgraduate School
Bredderman, Rudolf Theodore Andrew
Monterey, California. U.S. Naval Postgraduate School
http://hdl.handle.net/10945/9621

May 1966
- . .. ~ .. ... - - - -.. ... ........ ... ..- - -
.-~. ~ ~-
I..,
l1
I Thesis880325
UNITED STATESNAVAL POSTGRADUATE SCHOOL
THESISRADIOACTIVE GA.SEOPS EFFLtRN'"rS FROc'l
'rifE CORE OF THE AGN-?Ol REACTOHAT THE UNITED STATES NAVAL POSTGRADUATE SCHOOL
·by
Rudolf Theodore Andrew Bredderman
./c1 it; bigIi 11kLiB1i!ls may gg 111iOO 81m MBI Pi Ia FaJl pI of the TI S U ? P $SZpdEZtidi!P0ol.
Thfs aocumenf naS oeen~tpproi1ea: "for pu'51fcr'¥l. "'1"'.""'''' 0l'·1·~ ",,,.1,,, -i-,'-", Q"-ic-ho-j\;"t-'_"',l -it' ·1 bl1teEt ,.$'9 V&\lW~ IlIV1l. ....k j;,)~ ..~v, ..;...,/o.J ' .........'"'.~ .... ! __ !,..,,.'J ..... • _". ',-'

..
•
RADIOACTIVE GASEOUS EFFLUENTS FRCN THE CORE OF THE AGN-201
REACTOR AT THE UNITED srATES NAVAL POS'IGRADUATE SCliQOL
by
Rudolf Theodore Andrew »reddermanLieutenant Comnander; "Uni't€d states Navy
B. S., Comel1 Universlty, 1956
. Submitted inpartlalfu1fi1lmentfor the degree of
MASrER OF SCIENCE IN PHYSICS
from the
UNITED srATES NAVAL POsrIGRADUATE SCHOOL
May 1966

ABSTRACT
A qualitative and quantitative analysis of the core gas
generated by the AGN-201 reactor at the United States Naval
Postgraduate School was madebyanalylts of .the spectrum of
gamna-rays emitted two hours a:fter peak power operations.
The principle radioactive isotopes present, based on gamma-
ray photopeak energies and half~lives, were found to be
Kr85m, Kr87, Kr88 , Xe133, and xe135 . The total activity
(gamma-ray energies ~ 2.7 Mev) :was found to be 363~; 4 micro
curies per milliter. The percent of the total activity due
to the presence of each ~isotope .identified itl the order stated
above is 10.2%, 9.0%, 47.4%, 18.6%, and 4.4%. The source~!'.t"/'
the remaining 10.4% of the t6talactivity were not identified.
j'
2330
TABLE OF CONrENTS
Section Page
1. Introduction 11
2. Equipmenta. Scintillation detector) enclosure and 11
preamplifierb. Power supplies 12c. Multj-Channel Pulse Height Analyz~r 12d. Gas~anple bottles 13
3. EquipnEnt Calibrationa. Gas bottle volume 13b. Counting efficiency 17c. Channel vs. Energy relationship for
Multi-Channel Analyzer 18d. Peak-to-Total Ratio 18
4. Proceduresa. Gas sampling 19C'b. Obtaining garmna-ray spectrum 20c. Determination of half-lives 21d. Activity determination 21
5. Resultsa. Qualitative resultsb. Quantitative results
6. Conclusions 33
c7• Acknowledgements 34
8. Bibliography 36
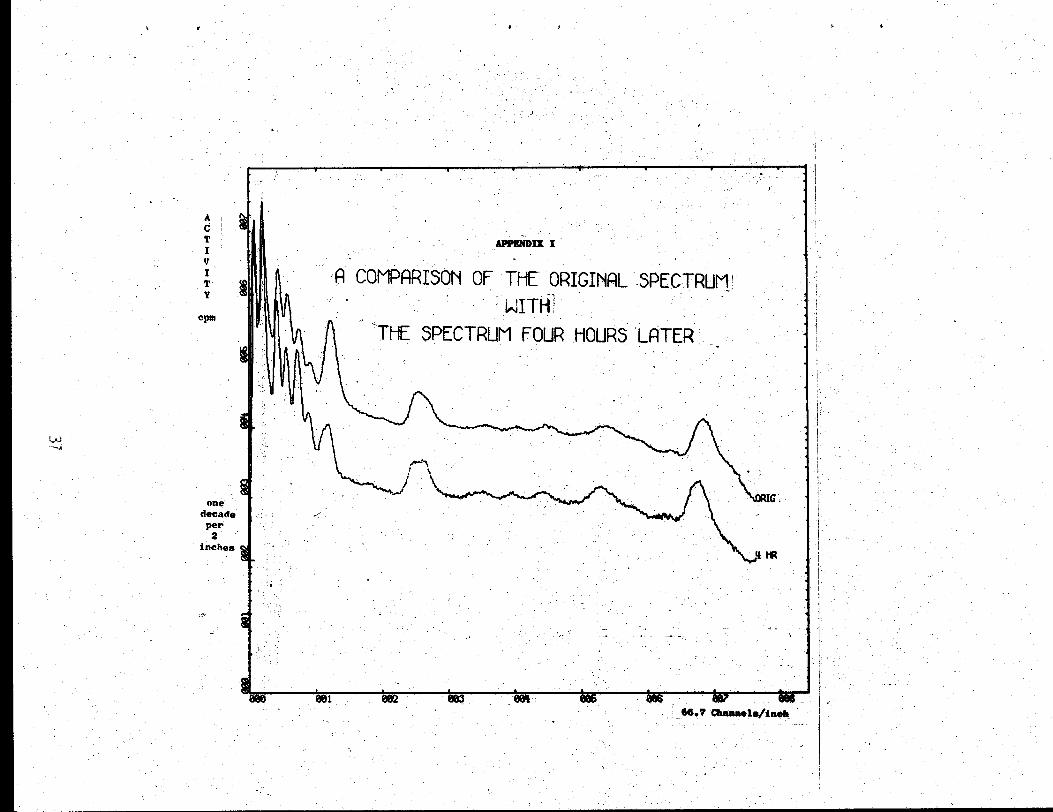
APPENDIX I Comparisons of the Original Ganma-ray 37Spectrum with Spectrums Four and FourteenHours Later
APPENDIX II Decay Curves for Observed Photopeaks
APPENDIX III Ganma-ray Spectrum Assigned to EachIdentified Isotope
APPENDIX IV Energy vs. Channel Number Curve for 14March 1966
3
39
48
54

LIST OF TABLES
Table Pagei·-
I. Photopeak Energies andlfalf-1ives 25
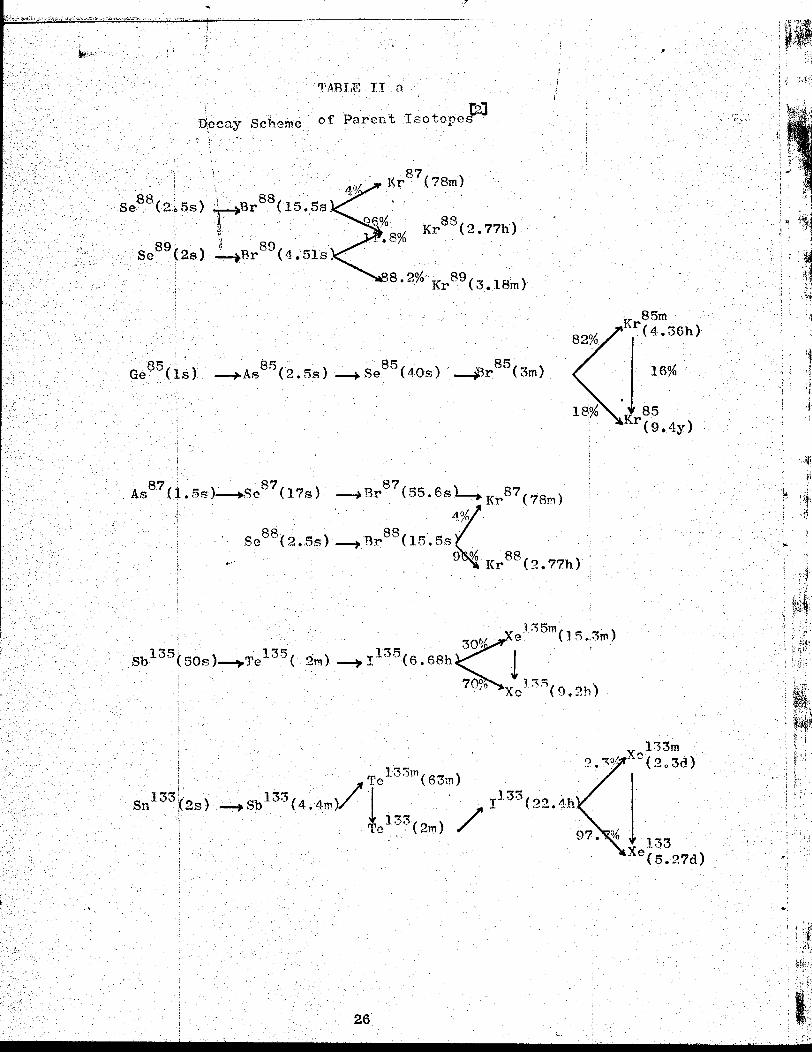
IIa. Decay of Parent Isotopes 26..
lIb. Decay Schene of Identified Isotopes 27
III. Ganma-rays Emitted by Radioactive Nuclei 29
N. Activity Associated with Each Photopeak 31
v. Activity Associated with Each Identified 32Radioactive Isotope
•
•
5

LIS!' OF ILLUsrRATIONS
Figure Page
l. Block Diagram of Scintillation Detector 14and Pulse Height Analyzer
-. 2. Diagram of ~le Bottle and Photanultipl1er 15Tube with NaI(Tl) Crystal .
3. Block Diagram of Reactor Gas Handling 16System
7

..
Synbols
ci
D
w
No
Aw
ta
t
E
Aop
Np
Pp
v
TABLE OF SYMOOLS AND ABBREVIATIONS
Activity
Disintegration rate
'!henna! Neutron Flux
Thermal cross-section
Weight of foil
Avogadros mnnber
Atomic weight
Disintegration constant
Activation time
Efficiency
Activity withinphotopeak at time sample was taken
Number of disintegrations counted within a photopeak
Peak-to-Total Ratio
Vo11.Mle
S2 sample variance
s Standard deviation'!:
.,·i STP
Au
Co
Cs
Hg
Standard Temperature (0° Centigrade) and Pressure(1 atmosphere)
Gold
Cobalt
Cesium
Mercury
9

I
K
Xe
Zn
Iodine
Krypton
Xenon
Zinc
10

1. Introduction
Gas is generated in the rods and core of the AGN-201
reactor at the United States Naval Postgraduate School during
operation of the reactor. After reactor shut-down, the quantity
of the gas builds up from the fissio~ products. The gas increases
the internal pressure in the reactor core and must be removed
periodically so that the gas pressure in the core and rods does,
not exceed 5 psig. [1:(1 This is normally done when the reactor
has been shut down for approximate1y two days, at which time
the gas still contains radioactive elements.. To know what these
elements might be, this study was undertaken to determine the
identity and concentration of the radioactive elements in the
reactor gas approximately two hours after peak power operations.
The study was made by obtaining from the reactor core via the
gas manifold, a IIEasurable quantity of gas in a container
suitable for insertion in a. well-type scintillation detector.
The gamma spectrum was obtained on a 512 channel pulse height
analyzer and a qualitative and quantitative analysis was made
on the gamma spectrum.
2. Equipment
a. Scintillation detector, enclosure, and preamplifier
A N~I(Tl) crystal, 3" in diameter by 3" high, with a Well 0.781"
in diameter by 2.0" high was used. The crystal was an integral
part of a Harshaw Type l2SW12-W3 scintillation detector. Iri
assembly, the crystal was directly attached to the photomulti
plier tube and both completely encased in .032" thick aluminum. [3]
The scintillation detector assembly was connected toa
11
cathode-follower type preamplifier. The signal from the
preamplifier was fed directly to the internal amplifier of
a 512 channel pulse height analyzer. The scintillation
detector and preamplifier were mounted within a 22" by 22"
by 28" box enclosures of lead brick lined inside by copper
and cadmium plates. A 4" by 6" access port and plug permitted
the exchange of active sample containers.
b. Power Supplies
The high voltage for the photomultiplier tube was furnished
by a Hamner Model N40l High Voltage Power Supply . '!he preamp-
lifier power was supplied by a stabilized power supply unit of
a Hamner Model N302 Non-overload Lineae Amplifier. '!he amplifier
section of this unit was not used.
c. Multi';'Channel Pulse Height Analyzer
A Nuclear Data 512 Channel pulse height analyzer Model
ND-180 FMR was used. This assembly consisted of an analog-to
digital converter With internal linear amplifier and live
titter, a 512 channel (106 capability per channel) parallel
-binary coded decimal ttemory system, and a read out control.
Associated equipment used with this assembly included Inoscilloscope, Teletype printer, and an X-Y plotter. The
pertinent specifications quoted by the manufacturer in the
instruction manual for this equipment are as follows: [7]
Stability: 0.2% long term stability.
Live Timer Accuracy: Better than 0.5% at pulserate up to 5000 cpm.
Integral Linearity: Better than 0.25% full scale.
12

·-::>
Differential Linearity:Bett~r than 2% over top98% of measl.lI'emnt range.
Figure 1 shows the relationship of the above equipment in
block diagram form.
d. Gas sample bottles
Gas sample bottles were made of alUPl1num,each with a
volUllE of about 3.5 ml. 'lhebottles w~~ des~ to fit
snugly in the well of the scintillation detector and to confine
. the gas within the bottle as deep as possible in the W'ell.
'lh1s wasdorie by ~lllng out form one end a section of
aluminum round to form.a d~cup, then, fitting an aluminum
"plug within this cup to leave a· reservoir for the gas. in the
bottom ofthe cup. A small hole was drilled through the
center of the plug to pennit the· fillirig of the reservoir.
The exposed end of the plug was tapped and a valve fitted to
this end. '!he plug was then bonded to the cup and the. entire
assembly made gas tight. .Theshape and dimensions of the
gas bottles are as indicated in. Figure 2 along with the
d1rDerisions of the photomultiplier tube and crystal assembly.
3. Equipment Calibration
a. Gas bottle volUllE. The volume· of each gas bottle
was determined by filling it with distilled water, recording.
the weight before and after fillln,g; the difference 1nweight
in grams being the volume inlJl11limetersC '!he bottles were E-Afilled by connecting them to an assembly of valves and tubing,
evacuating the entire assembly with· a vacuum P'tlllP, and then
allowing the vacuum to fill the entire assembly with water.
13

/
FHJJ1RE .1
Teletype.
Printer
3
Counts
Ferrite
Core
Memory
Digital' .
1---1 To Analog,C:onvert.r
.Write
BLOCK DIAGRAM OF SCIlI1TILLATION DETECTOR Is1and
PULSE HEIGHT ANALYZER
L
Add DataSUb-rae _R....e_g...i ...s'-t....e_r_.....
Channelnucrber '
Address
Sealer'
Digital
To Analog
Condrter
Plotter. '~-
Lead
~..-"."Power
81lPply
Bigb-Volt.-Power
,' ..erY~t~laria _ply""---- Photomu.ltiplier
~"I....J..Ib--r1t 1;Ul)e.Preamplitiej(j .
14

FIGURE 2
GAS SA""lPLE BOTTLE
'1
""""IIII
'I
"IIII
IIIIII
""II",IIIII
II I 2 ~Ol_"IIII
'II II ,"" .... -''- - -of
}-0.65"1
TYPE: 12S\V12-W3
Crystal size - 3" dia. x 3" hgto
DIMENSIONS: (in inches)
CRYSTAL WELT,
A B C w
0781 2.000 2.046 f)·l')6
Reservoir ---- _Volumo: 3/835
i.OOl ro1
PHOTOMULTIPLIER TUBEwjlth
NaI(Tl) CRYSTAL C31::3.250" .125"
W
-r--r":----+--."='L
t--Ill[
15

; 0.
Manifold
R"eduCi~Valve ,." @
Ni tragen :Tank "~
Prc:=;sure
I__ .J
. r-Gas- -1
I
v-z.-~-:-- Mercury. Manometer
Tube
Core.Tank
G-H Chamberttt/'"
16
+-t..... Pressure Swi tch
..... - -.- -.-
~AtmosphereSamplingTube
·FIGlTRr.-: :;
of Heact0t: Gas. Hfmdling System(l'Q
----_ ........ --
To Building ExhaustL.._--'......---'~_--:._-~ Fen on Roof
./.f\nxi Ii P1r~' Gas·® I r Sa!""pUng Tube
}-;..~---~---L--r-r---L--7~TI-~
..-J-- Pressure Re] ease. .. I Valve""
I
tInside.Reactor
Shi-eldI i- - - -~:_. -
outs~!b~aot6i r---
~! I

This procedure insured that no air bubbles or pockets were left
within the bottles when they were filled with water. The
weighing was done on an analytical balance to± 0.0005 grams
yielding a possible accuracy in volume of ± 0.001 milliters . ..-+-
Since there were other uncertainties in determining the volume
by this method, it was estimated that the volume was accurate
~ to ± 0.01 milliters. X
b. Counting efficiency. Two samples of gold foil, each
weighing about 30· milligrams were weighed to± 0.0005 grams.
One was· irradiated in the reactor within a ·<5admium cover for
60 minutes at 20 watts. The second was irradiated in an
identical positioD for the same time at the same power level
but without the cadmium cover. The activities of the
activated foils were determined using an aluminum sample
holder identical in size and shape to the gas bottles but
with the plug removable so that the gold foil could be centered
within its reservoir. 'Ihe activity of the cadmium covered
foil was subtracted from the activity of the bare foil
yielding the activity (~, ) due to the activation of the bare
foil by thermal neutrons .
From the relationship D =
0 =6t =w =No =
the disintegration rate ( D ) of the activated gold (Au198)
was calculated; where
thermal neutron flux level of reactor at 20 watts [~
thermal cross section for AJ197 (98.8 barns)
weight of gold foil in grams
Avogadros number (6.023 x 10²³ atoms per mole)
17

==
=
Atomic weight of gold (197.028 grams per mole)
disintegration constant for Au198 (1.7848 x 10⁻⁴per min.)
activation tine
il'~': ~-:':'.~
: ..',~..~..:.';": '. ;jt.~~ ; :('M
, .t
t = time lapse between activation and counting
The efficience ( E ) of the entire counting assembly was
then detennined from the relationship E = q/D
c. Channelvs.Energy relationship for the multichannel
analyzer. Using Cs137, I13l , Zn65 , Co60, and Au198 ; a curve
was plotted using the following gamma.-;ray photopeak energies
2.50, 1.33, 1.17, 1.114, 0.663, 0.51, 0.411, 0.364, 0.080,
0.069, and 0.032; all in MeV. This was done at periodic
tines while counting each gas sample. The Channel vs. Energy
curve was found to be linear at energies above approximately
0.3 MeV but slightly non-linear below this energy. In
addition, the energy associated with a particular channel
varied linearly with the gain setting on the internal amplifier.
d. Peak-to-Total ratio. A Peak-to-Total ratio curve
paralleling that in Appendix II of Heath [q was plotted using
Au198, Cs137, and Zn65 samples, counted in the aluminum sample
holder. To dete~ne the activity in the photopeak, the
counts in the channels within the photopeak were normalized
by fitting th~ir natural logarithms to a quadratic by theI
.~
method of lip.st squares. The total activity was determined) ~ ,
by s urrming the counts in each spectrum up to and including
those channels within the photopeak. The activity in
photopeaks other than the major photopeak for each sample
was subtracted from the total. More points on this curve
18
«
were desired but neither active oractivatible materials
were available.
4. Procedure
a. Gas Sampling. Gas samples were drawn from the
reactor gas manifold approximately two hours after peak
power operations. 'Ibis time delay was chosen to permit the
build up of the gas in the core and to sample the gas while
its components of half-lives of the order of several hours
or more were still of sufficient activity to permit analysis.
'!he gas sampling was done in the following steps:
1. A sample bottle was attached to the Auxiliary Gas Sampling
Tube of the manifold.
2• With the va;Lve to the reactor core closed, the bottle,
manifold tubing and GM chamber were evacuated to the atmosPt'ti'?re.-<~~4:,~!j/;:;<;' <'~:...:
using a vacuum ptnnp until a maximum vacuum was noted on the
manometer.
3. Using the vacuum in the GM chamber, new gas was drawn into
the manifold by opening theyalve to the reactor core; the
valve on the gas bottle being ;glosed. 'Ibe valve to the
reactor core was then closed and the gas in the manifold was
drawn into the GM chamber. This step was repeated several}.;.
times until certain the gas in the<manifold was new gas from;'i':,.'
the core and not old gas from the tubing connecting the
manifold to the core.
4. The valve to the evacuated gas bottle was then opened and
the new gas in the manifold was permitted to fill the gas
bottle. 'Ibe pressure of this gas was adjusted, using the
19
vacuum :Ln the GM. chamber> to a vacuum of about one or two
centimeters of Hg. The pressure was recorded and the valva
on the gas bottle closed.
5. If more than one sample was to be drawn on the same
day, a second bottle was attached to the manifold and steps
3 and 4 above were repeated.
b. Obtaining the Gamna.-ray Spectrum. As soon after
drawing a sample as was possible, usually about one minute,
the bottle was placed in the well of the scintillation detector
and a ten minute 11ve-time count was made at the desired gain
setting. The multi-channel analyzer permitted the adjustment
of gain so that gamna-rays of energies up to about 3 MeV
could be counted. It was noted in preliminary runs that there
were no significant gannna.-ray photopeaks of energies above
about 2.7 MeV. It was also noted that after about 24 hours,
there was no significant ganma activity above 1.0 MeV and
that increasing the gain by a factor of two exactly halved
the energy per channel relationship. 'lherefore counting
was done utilizing coarse gain settings of IIlll and "2 11
while the fine gain setting was held at 1110.0". Counting
at a coarse gain setting of 112 11 gave better definition to
the several photopeaks of energies below 0.40 MeV while
counting at a coarse gain setting of 111" permitted the
counting of all significant gamma. activity in newly obtained
samples.
After a count was made, backgrolmd was removed by
putting the analyzer Inthe "subtract" mode and again counting
20

•
for ten minutes live-time, but with no sample in or near
the detector. After background was removed, the data in
the analyzer memory was printed out and plotted by hand
or with the X-Y plotter. (The plots included in the
appendixes were made utilizing the CDC 1604 computer.)
After the initial count was made, succeeding ten minute
counts were made at one hour intervals for about six to
twelve hours, then at about six hour intervals for 48 hours
and then daily for about two weeks.
c. Determination of half-lives. 'Ihe half-lives of
the component sources of each photopeak were determined in
one of two ways.
1. 'Ihe count in the channel having the maximum
count for a particular photopeak was noted, its channel
number and corresponding gamma-ray energy obtained. A
semi-log plot of counts vs. time was made and graphically
analyzed to deternline the half-lives of the components.
2. By use of the CDC 1604 computer, the photopeaks
of one sample were normalized and the total count within the
peak determined. rlhis total count was plotted in the same
manner as above. No significant differences were noted· in
the results obtained by this more involved procedure than
by the first procedure.
d. Activity determination. It was noted that the
response of the detector to gamma-rays of a particular energy
produced a gamma spectrum of a particular shape. 'Ihat 1s, in
addi.tion to the photopeak, a particular shape was observed
21
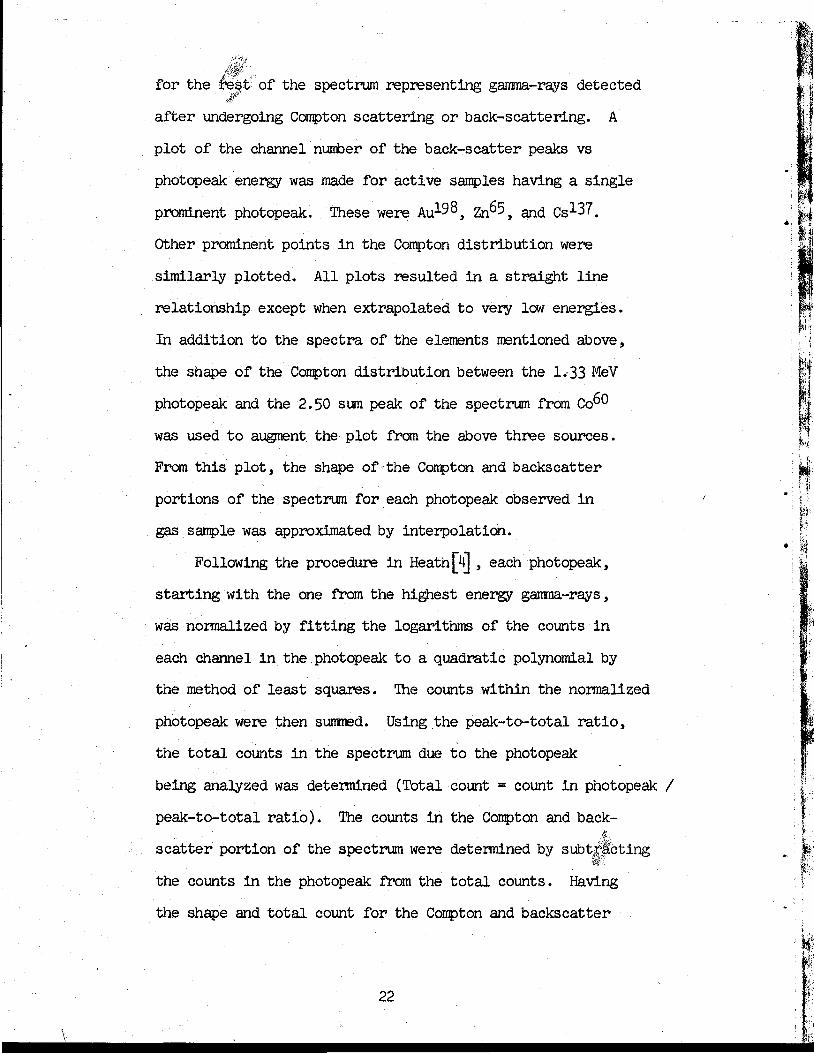
after undergoing Compton scattering or back-scattering. A
plot of the channel number of the back-scatter peaks vs
photopeak energy was made for active samples having a single
prominent photopeak. These were Au198, Zn65 , and Cs137.
Other prominent points in the Compton distribution were
of the spectrum representing gamma-rays detectedfor the
similarly plotted. All plots resulted in a straight line
relationship except when extrapolated to very low energies.
In addition to the spectra of the elements rrentioned above,
the shape of the Compton distribution between the 1.,33 MeV
photopeak and the 2.50 sum peak of the spectrum from C060
was used to augment the plot from the above three sources.
From this plot, the shape of,the Compton and backscatter
portions of the spectrum for each photopeak observed in
gas sanple was approximated by interpolation.
Following the procedure in Heath[~ , eachphotopeak,
starting with the one from the highest energy gamma-rays,
was normalized by fitting the logarithms of the counts in
each channel in the photopeak to a quadratic polynomial by
the method of least squares. The counts within the normalized
photopeak were then surmned. Using .the peak-to-total ratio,
the total counts in the spectrum due to the photopeak
being analyzed was determined (Total count = count in photopeak: /
peak-to-total ratio). The counts in the Compton and back-/#,~
scatter portion of the spectrum were determined by subti;~cting~i
the counts in the photopeak from the total counts. Having
the shape and total count for the Compton and backscatter
(I
, \~.
t,II'- l!~
~,:-:
~';'~-
\
22

portion of the spectrum,· a particular count was assigned
to each channel within that portion of the spectrum. '!he
entire spectrum thus determined for the photopeak being
analyzed was subtracted from the composite spectrum,
channel by channel. '!he next photopeak was then normalized
and similar calculations and approximations made for the
Compton and backscatter portion of its spectrum.
'!he total activity at STP was detenmneq for each
photopeak and for the entire spectrum utiliZing the
relationship
where
An estimate of the standard deviation of the activity thus
determined-was made utilizing the relationship
+ s2t + s2Vt 2 v2 )
5. Resu1ts~ A total of 13 gas samples were taken on five
different days, all from one to three hours after peak pO\'J'er
operation (1000 watts). No qualitative difference were
observed in the gamma spectra. No significant quantitative
difference were observed.
a. Qualitative results. '!hirteen significant photopeaks
23

were observed in .the raw spectrum and two more were unmasked
in the removal, by channel f'or channel subtraction, of' the
more prominent photopeaks and their associated Compton and
backscatter spectra. The spectrum obtained on 14 March
and spectra of the same sample after four and 14 hours decay
have been included for comparison as Appendix I. The
measured half-lives ,of the photopeaks together with the
channel number of the center channel in each photopeakand
its corresponding energy in MeV are tabulated in Table I.
Also included in this table is the identified source for
each photopeak, determined on the basis of half-life and
photopeak energy using the tables of E. der Mateosien and
M.Mc Keown[6]. The finding here are in agreement with those
of ,D. E. Hawkins at Los Alamos who concluded
The radioactive gaoeous effluents released from the
reactor stack were found to consist of the following
noble gases: Kr85m, Kr87 , Kr88 , Xe133 , and Xe135 .[2]
For each sample, the counts in the photopeaks one and
two were observed to increase for approximately 20 hours
after the sample was drawn, and to decrease with a half
life consistent with that tabulated for Xe133• The growth
is believed to be due to the decay of the parent isotope
1133 with a half-life of 22.4 hours, as is indicated in
the decay schemes for the parent isotopes tabulated in
Table II. None of the gannna rays associated with the
decay of I 133 could be found in the spectrum and a 20
hour half-life was not observed anywhere except in the
growth of photopeaks one and· two. Decay curves for each
24
! '1'~'i, !
It...'....•'•.'••.'•.....:..•• • ••/1'0,
r", ~~."i:.;
"', .. ~.i,..•.'.'Ii1O:~
. {~.~

TABLE I
Photopeak Energies and Half-lives
CenterPhotopeak Channel Energy Half-life Source
1 6 0.030±.002 Growth 21±2hrs Xe133
t 2 15 0.08l±.001 Decay 127±4hrs Xe133
3 30 + ... + Kr85m0.148-.002 4.5..... 2hrs
4 39 0.190±.002 3.0±.3hrs Kr85
5 51-48 0.249±.002 9.1±.5hrs Xe133
60±t1rs Xe133m
6 62 0.300±.005 4.2±.2hrs ~5m
7 82 0.400±.005 1.2±.2hrs Kr874.5±.2hrs
8 124 0.610±.010 Undetermined Xe135
9 170 0.86±.015 2.7±.15hrs Kr88..
10 238 1. 22:f:. 02 2.7:f:0.2hrs Unknown
11 270 1.40±.02 2.8±0.2hrs Unknown
12 298 1.5S±.02 2. 70±.15hrs Kr88
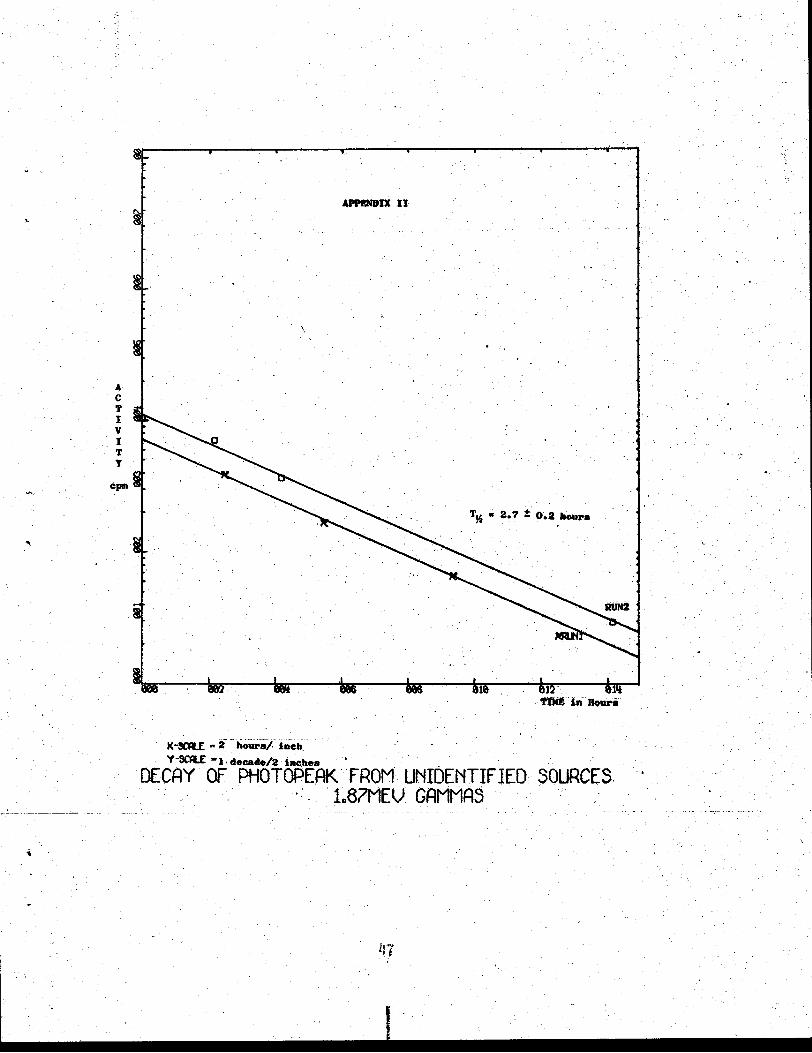
13 359 1. 87±.02 2.7:f:0.2hrs Unknown
14 420 2.20±.02 Undetermined Kr88
15 458 2.40±.02 2.90±.15hrs Kr§8'",
25
"'I,
'1
';·j"f,'
, ;> '.~.
' ..',. ~:)
•
IE 85m,r(4.36h)
,j.• 16%
85Kr(9.4y)
L
105me (l!') •. 3m)
11 :<;;)( '.)Xc· 9.2h
I<r87(78rri)
26
'1'I'BL~j II a .
of Parent IsotopeP"]
.~ 89·-iBr (4.515

TABLE lIb Ij
[HUDecay Schemes of Identified Isotopes' .
Xe135m(16m)
0.53 MeV 0.233. MeV
--........--;..-,-O. 081MeV'------.,.....,-0.61 MeV
97%
135x, (9.1h)
-_~~---lIt-0Cs 33
-----...3-...:r-.0
Cs135
~ "'------""T"T"" 2. 95lwleV
70% ------rx-+_ 0.85
----__r+-z.. 0.405
--~-:::-.....:I~-0Rb
87
87Kr (78m)
0.150
o
0.513 MeV( 9 -7)6 •..xl0 1'1
99+%
,q.305 MeV
77%
85m )Kr (4.4hI
23%
i~ ;,~. :
-:------r=L++ 0 0 85
23%
--,-.,--1-:&+ 0 .191
--,-.:L...+---If---l- 0 •028 or O. 163
-------1:~.&-.....x.O
Rb88
27

To obtain more accurate·half-lives and more certain
28
a "spectrum stripping" procedure'to remove the spectrum of
Kr88 frOm the raw spectrum would have to be employed
utilizing an active sample of isotopically pure Kr88.
Several of the lesserphotopeaks of the isotopes
at all times masked byadjacent photopeaks.
identification of the sources for photopeaks 8 through 15
the known isotopes used as references to determine the
shape of the Compton spectrum. Photopeaks 8 and 14 were
peak 9 at times appeared to be two photopeaks of nearly
AppendixII. Data on the decay of photopeaks 8 and 14 was
not obtained in that· these photopeaks were masked by adja-
the same energy and half-life as can be seen in the spectra
in APpe~x I. The same may be true of photopeak 15.
At times it appeared that an additional photopeak of
approximately 2. 55 'ev gammas was masked by photopeak 15
and its decay curve paralleled that of photopeak 15. r.Ihe
sources forphotopeaks 10, 11, and 13 could not be identified
and it is possible that one or all may be distinctive poirlts
in the Compton spectrum of photopeak 15, although no similar
distinctive points were observed in the Compton of any of
photopeak except photopeaks
cent photopeaks; yet it was concluded that these photopeaks
were due to ga.rrrna-rays from the decay of Xe135 and Kr88
respectively.
Photopeaks 1, 2, 3, 4, and 5 were'well defined but
the remaining photopeaks were not. In particular, photo-


identified could not be found as is indicated in Table III.
It is assumed that these peaks .were masked by the more't:'~., I
prominent photopeaks.
As can be seen from Table V, the most significant
and the reactor core was reduced to atmospheric pressure prior
; l'": i/O
! {.i ';
t·~.;..
These results are summarized''i;.. ,C;;~~-
each photopeak calculated.
day (14 March 1966) was as follows:
From 1441 to 1442 at 1000 watts1512 1513 1000 watts1538 1539 1000 watts1558 1559 1000 watts1637 1658 100 watts
Gas sample taken 1800.
The reactor was not operated on the previous day (13 March)
contribution to the total activity of the reactor gas two
hours after high power operation is from the isotope Kr88,
the activity of Which accounts for approximately half the
in Table N and Table V. A sample drawn after a peak Jj~~~~1<fi"'-
operation on 14 March 1966 was selected for quantitative
analysis. The Energy vs. Channel Number Curve for 14 March
is included as Appendix N. Prior reactor operation that
to reactor operation on 14 March 1966.
b. Quantitative results. The spectrum was broken
down into 15 photopeaks and theactiv1ty associated with
compared with the original spectrum in the gr'aphs included
as Appendix III.
1!\LX~1
'!he spectra assigned to each identified ~~otope are~::~
total activity. At about two hours after high power
operation the activity due to the presence of Xe133 is
still increasing and continues to increase for about 20
30

31
'.fABLE IV
Activity Associated with each·Photope~
Photo- Energy Peak-to- Count Act1,.V1tyPeak MeV Total in Micro-
Ratio 10 min. curie~~.x 10-
• 1 0.030 .99 858,700 27.6 ± 4.5
2 0.081 .98 1,],88,700 39.1 ± 5.8
3 0.148 .925 813,700 28.4 + 3.8
4 0.19 .99 634,900 23.2 ± 2.9
5 0.23&0.25 .81 362,600 14.4 ± 1.7
6 0.30 .15 198,800 8.5 * 0.9
7 0.40 .65 656,700 32.5 ± 3.2
8 0.61 .505 35,000 2.2 ±0.2
9 0.86 .375 213,600 18.4 ± 1.5
10 1.22 .295 33,000 3.6 ±0.3
11 1.4 .265 25,800 3.1 ±0.2
12 1.55 .245 40,400 5.3% 0.3
13 1.87 .210 202,400 31.1 ± 1.5
14 2.19 .185 115,100 . +20.1 ... 0.9
15 2.40 .170 481,900 104.5 ± 4.4
Entire SpectrumAt time drawn 11,156,157 363 * 3.4
Four Hours later 5,692,58lt 183 ± 1.7
Fourteen Hours later 3,481,355 112 %1.1
iII--------------------

TABLE V
Activity Associ~t~dwith~ach Identified Radioactive.: . Isotope ....
Activity %Total Activitymicro-curies at time sampleper ml xIQ-3 was drawn
Kr85m 3 and 6 36.9 ± 4..7 10.2
Kr87 7 32.5 ± 3.2 9.0
Kr88 4, 9, 12, +!: 14 and 15 172. - 10 47.l.j
Xe133 ~.p.nd 2 66.7 ± 10.3 18.l.j
xe133m ~'t 5 0.7 :l:: 0.2 0.2
xe135 " ·r ? and 8 15.9 ± 1.7 4.4
Unknowns 10, 11, and 37.8 :l:: 2.0 10.413
32

hours at which time it has approximately doubled•. 'Ibis
increase combined with the decrease ~ activity from the
shorter half-life components!t results in the activity due
to the presence of Xel33 becoming the most significant
activity of any duration.
'Ibis was concluded by C. C. Grissan for this reactor
in that
~rom the absolute counting rate it is determined
that the activity of the gas ranges from 1. 7xlO-l to
1. 3xlO-2 miero-curies per ccof gas at approximately
70°F and 70cm of Hg for the gas which ranges in
age from 12 to 48 hours. Of this amount, the
maximum activity due to the presence of any radio
active iodine is less than 0.2% of the totai acti\l'1ty.
At 48 hours approximately 70% of the activity is due
to the presence of Xel33and its isomer andapproxi-.~;
"mately 30% of the acti\l'1ty occurs as a rgsult of
Xel35 being present ~{}]
6. Conclusions
An analysis of thegamna spectrum of samples of
reactor gas drawn at approximately two hours· after peak
power operation of t~ reactor resulted in the identification
of the sources of the gamna activity. The most actively
decaying radioactive isotopes present are Xel33, Xel 35,
Kr85m, Kr87, and Kr88. Based on quantitative calculations
for a sample drawn at two hours after peak power operation,
+tl}e total activity is 0.363 - 0.004 micro-curies per milliliter.
33

Of this total, Kr88 contributes 0.172,! .010. micro-curies
per milliliter or about ,47% of the total activity. Xe133.' ..• • > L_,_ .. ". .
contrj,butes 10674 ! ~Ol05 mi,9:t:'o-curies per milliliter or0,'- :'. .i _.,' . - ,_ ,_' '_ -" '~
about ...18%'iof'the..,tR~a1··~cYi\dty •.. :.! Kr~?ID,con~ribut~<i. ..0.. 03q9;
± .0047 micro-curies per milliliter or apout 10.2%. Kr87. . '. I .
contrib:u,tedO.0325. ±.. OQ32 micro-curies per milliliter-'- ~ .. " .' .". . ", ' - ,.' - . ..-.' ., . "
or about 8.9%. Xe135 contributed 0.0159 ! .0017 micro-
curies per,milliliter. ora,bout 4.4% of the total activity., ," ..." ;
In addi,tio~ct;;he .sources of significant points in the gamna',~ . ..~ " '. . .. ,..', ' _.
spectI'UIll~~.:1.2,1.4, and L87,Mevcou1~ not be id~,mtified.- .' ~.' ,', / .. ,',.: " - .
'!hese were', tre9-ted as photopeaks and th.eir combined actiyity
was 0.0378 ± ~0020 ,micro-curie~ per milliliter or,~bout:(:
10.4% of. the, total activity •
.Amore reliab1equantitativeanalysis and. breakd0i'{rl
of th~gamma. spectI,'UITlcan be made utilizing computer tech-
niques' such as those of Strickfadenand Kloepper.[91 Tl1eir; '. f' .~\-:
computer program was not readily.adaptab.le to toe CDC 1604• "-' .". -." , .• j -, ....
and was not used in this analys~s. '!he g~neral techniques
of their program for approximating the Compton distributi.0n
were utilized but the .ca1culations carried out by h~d.
7. Ackp.qvlledgements...
:~:r:. wOlliltd ,like to th~ .the~membe:r'S of the Reactor
Operating Conmi"ttee who assis.tedinthis study; Pr>ofessors•. '•. ' • 0" . ,_ _.,'..' .• c..
E. A. Milne, G•. W.Rodeback, andW,W.H"awes and Mr. H. L.
McFarland for their timely' advic::e and assistance in setting
upeq¢Pment and obtaining radioactive materials. I would
.lj;keyothanknw advisor. for~is counseling and assistance
34

throughout the entire study.
I wish to acknowledge the assistance of my wife, Helen,
who helped in the organization and typing of this report and
who assisted greatly in the tedious plotting and calculating
necessary to break down the gamna spectrum into its components.
35

BIBLlOORAPHY
1. Grissom, C. c. Analysis of Radioactive Gas Generatedby the AGN-20l Reactor at the United States NavalPostgraduate Schoo.; Thesis. 1965
>·r·l~
2. Hankins, D. E.Radioactive Gaseous Effluents from aHomogenous Reactor. Los Alamos Scientific Laboratory.Research Report LAM8-2937; TID-4500. November, 1963.
3. Harshaw Chemical Company, Scintillation Phosphors,2nd ed. 1962. .
4. Heath, R. L. Scintillation Spectrometry Gamma-RaySpectrum Catalogue. Phillips Petroleum Co., AtomicEnergy Division. July, 1957
5. Johnson, N. R., E. Eichler and G. D. O'Kelley. Techniqueof Inorganic Chemistry, v. II. Interscience, 1963.
6. Mateosian, Der E. and M. McKeown. Table of Gamma-RaysEmitted by Radioactive Nuclei. Brookhaven NationalLaboratory. Associated Universities, Inc. May, 1960.
7. Nuclear Data, Inc. Instruction Manual. Models ND-180FM and ND-181 F.M. 1965.
8. Perry, R. E. Absolute Neutron Flux of the AGN-201Reactor. Thesis P 345. United States Naval PostgraduateSchool. . 1964.
9. Strickfaden, W. B. and R. M. Kloepper. :rEM 704 Programsfor Unfolding Complex Ganma-Ray Spectra... Los AlamosScientific Laboratory. Research Report LA-2461; TID-4500.14 March 1961.
10. Strominger, D., J. M. Hollander, and G. T. Seaborg.Reviews of Modem Physics. v. 30, no. 2, part II.American Institute of ,Physics. April, 1958: 652-653;710-711.
11. United States Naval Postgraduate School. Operation andAdministration of Nuclear Reactor Facility. .PostgraduateSchool Instruction, 9890.1. 31 October 1962.
36
onedecadeper
2inches
:G:
: .&4."CIuuI~~./in.1t
. .,
APPENDIX I
B"
·8 COMPARISON OF ·THE" ORIGINRL .SPECTRUI'1!WITH}
'THE SPECTRUM FOUR HOURS 'LATER
eel
II
ACTIVITy
~ ,'..,
Cpll

IG
lq~OO6
'~;'::'.
/'
APPENDIX I
.1J!\?COMPRRISON OF THE ORlGlNRL SPECTRUM
tilTH!~rHE3PECTRUM 14: HOURS LRTER
.\'onej
decadeL''. per \'.:.. 2 I,.inches .:'I,·,
I
ILI .
!
.I.
f.rI
wco

APPINDIX II
-·-----,---~-·~--·-'---.,---7
K·SClU·~_o...../incJa· ....y~:bU:·"ldeead.hinchea ..
DECAY OF PHOTOPEAKS ONE AND TWO~_'.__ ._...._~_.. __.eD~3~"0~08_1MElJ .~AMM~~_ FRQM ..~.~~ 13_~ ~_.__.__
39

APPENDIX II
'.~
. \
'";,
PP3: . T}2' = 4.• 5 .t. ,0.2 hQurs
008
l<-mE·:ahours!ii1c~Y-SCA..E -1.Wa1tcil:de!2 i~Ches, .
DECRY OF PHOTOPEAKS /THREE AND SIX-"- .e~1~i=~a3.e5~MEIJ.GAtlt18Q..f80M KR85M
40
I.

ACT
.1V1T
.y
APPENDIX 11
\
PP4: T,," ~.O • O.3houra
I(~SCR£ .2 ho.urs/inch
Y-3CA.E -1 decade/2 inches·
DECAY OF PHOTOPEAks 12 AND q1..55 AND .. 19MEV. GAMMAS FROM KR88
J' -. . -. - "•. , ,,-
__ L._._........•......•_ _ •.....................••.........

APPENDIX II
. \
133m . +Xe I t~ = 60 -. 5 hours
l( -SCA.E _'O,hour-~/iri¢h~T:-:::'· .
. •. ,(-SCA.E· -1:!h,cade/2 \inche$' ..
DECRY Of~ PHOTOPEAK FIlJE 0oQ33MElJ FROM XE 133M00250MElJ fROM XE135
.42

"
ACTIVITy
I .
APPENDIX 11
~ . \
~
I(-SCA.E ..abours/illcb ..V~SCA.E '-I decade/! lllcbe~.~. .
DECAY OF PHOTOPEAK SEVEN0ol.f0MEV GAMMAS fROM KR87
. ~3

-
, + 'T~ = 2.70 - 0.15 hours
PPI5: T~ ~ 2.90 ~ 0.15 hours,
APPENDIX II
l(-SCIl.E = 5 hours/in,ch'
"-SCALE, = i decade/2 inches
DECAY OF PHOTOPEAKS 15 AND 92al± RND 0a85MElJ GAMMAS FROM KR88
44

..
~ ~T,IVITY
CPIlI
APPENDIX II
TJi = 2.7 :0.2 hour's
l<-SCA.E.2 hours/inch
..,. -SCA,,( • 1 decade/2 inChes
DECAY OF PHOTOPEAK FPOM UNIDENTIFIED SOURCES,la2MElJ GAMMAS

APPENDIX II
AC
~ ~VITY
epm
010
X-SCALE - 2 hours/inch'Y"SCALE -I' deeade/2 inches
DECAY OF PHOTOPEAKFROM UNIDENTIFIED SOURCESloY: MEV GAMMAS
46
ACT1VI
·T
Y
CJlIII
~IXII
. \
K-sau .2 -hcn.rsj. inch.
Y-saLE -1. de_de/2 inches
.DECAY OF PHOTOPEAK fROM UNIDENTIfIED SOURCES.lD87MEV GAMMAS
, .
.. .

APPENDIX III
ii;;.~
IG
R65·007 _-.:-. __!!J06
10 Chiuinels/inch00600500ll00:1002€l81
~-G~MMA-~j=)[CTRUM RND KP8SM.LOMPGNENT
800
ACTIVJTY
~I
~I
2
.oneilEicArtener -
.. !lpm
. _. in('h<,!" ~I
.. 't ~
/~

-!=\,.0
Ii
ACorTVITY
cJlm
onedecade
lJer2
inches
\'

Ie
2.40MEV
cpm
AC1'"..~VI
-TY
'01o
one(lec",ieper
2
inches ~I APPENDIX III
GAMMA SPECTRUM AND KR88 COMPONENT
eee 001 002 003 00Ii 005R66
006 "El07~"66.7 Channels/inch"
,!'\ "t

. onedecadeper
2inches ...!
i
-.,
\JlI-'
.. •
ACTIV.ITY
Cpllil
Ii,/
r
./.
APPINDIX~lI

- .... -,;'Ii;
\.J1I\)
ACTIVI'J'Y
~'"
~ORIG.
cpm ~i
011f ~16
20 Chanliels/in:ch
0.610. MEV
01')010 .008006OOI!
APPENDIX III
002
GAMMA SPECTRUM><E135-><E133M COMPONENTS
~Ionerlc-c(lrleper
2Inches
( .'" "",j
fill 'I

• >. • .. ~
\J1W
ACTIVITY
epm
onedEleade
f).or2
inches
I.
/'
AJ'I»BNDIX III
REACTOR. GAS.GAMMA SPECTRUM f.
WITH SPECTRUM Of:IDENTIFIED > COMPONENTS:
,> ,
! .> I>

<.
...
INITIAL DISTRIBUTION LIST
No. Copies
2
2
20
3. Prof John D. RigginDepartment of PhysicsU. S. Naval Postgraduate SchoolMonterey, California
4. LCDR Rudolf 'lbeodore Andrew Breddennan, USN 1USS HORNE (DIn-3D)Fleet Post OfficeSan Francisco, California 96601
1. Defense Documentation CenterCameron Station',>,Alexandria, Virginia 22314
2. LibraryU. S. Naval Postgraduate SchoolMonterey, CalH'ornia
r"~':
55
l.·, ..
7 •• NO. O. ,,&••eleven·
UnclasSified
7 •• "FOTA'" NO. 0 .. p.ota54 .
Security Classification
U. S. Naval Postgr'aduate SChool
DOCUMENT CONTROL DATA .. R&D(SoCurity cl.aailication 01 tillo, body ol.batt.ct.nd Induing annot.'ion mu"t bo_tered whall the 0"'''.'' '0:»""'0 :C1II..1I~d)
,UNCLASSIFIED
t.O'lIGINATING A.C'tIVI"!'V (CotpO,.'O author) zo. REPO.R"( S~-cUR'TY'C 1..•••' ..IC.TION
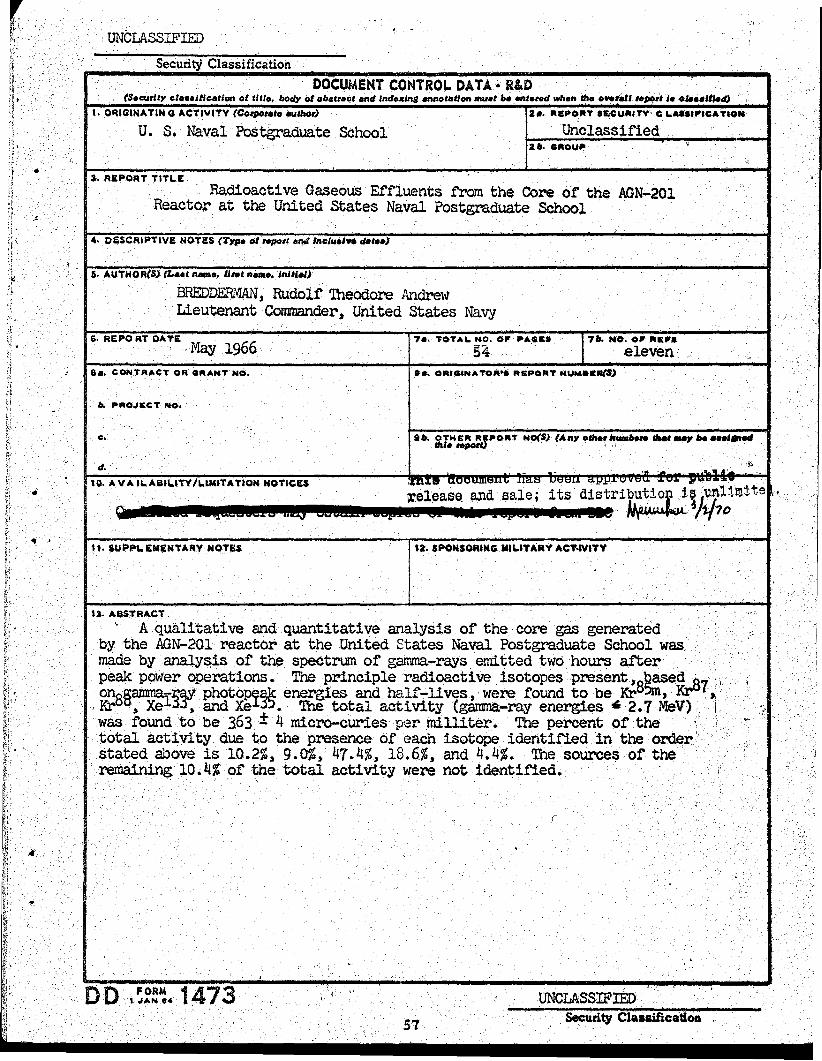
Radioactive Gaseous Effluents from the Core of the AGN-201Reactor at the United States Naval Postgraduate School
", PRO.t&C;T NO.
5. AUTH.OR(S) (I.••, namo. II,., II.... Inlllal)
:8REDDERMAN, RUdolf Theodore AndrewLieutenant Commander, United States Navy
aa. t::ON.""ACT 0" CilRANTNO.
3. REPORT "rITLE
6. REPORT OATE M 66. ray 19
It
c. tb. OTNER "'PORT No(S) (All)!' olho.. lI....".,."'atMaJ!' be ...,..."till. ropoI'C} ., . , ;
Security Cl.liaification
('
UNCLASSIFIED
t2. SPOKSORINGMU..ITARV ItC'NVITV
57
I'
\r.eleas'e. and sale ; its distri~?-tl.;OO¥li~ lunltl\1ite •6600' 64123 CJ It 245£ bACia .e~ "/f/70
t3. ABSTRACT
A qualitative and quantitative analysis of the core gas generatedby the AGN-201 reactor at the United States Naval Postgraduate School was
. made by analys,isof the spectrum ofgamma-rays emitted two hours afterpeak power operations. The principleradioact1ve isotopes present'8~e~.A7:'on8§amma-~a.v photO~ak en~es and half-lives,' we!'e found to be Kr Jill, .,KrV. ~.Kr :. XelSj~ and Xe 3~•. The total activity (garrma-ray energies ~ 2.7 MeV),!was f()UIldto be 363 ± 4 micro-curies permilliter. The percent of the "total activity.··due to the presence of. each isotope identified in the order'stated above is 10. 2~:. 9. 0% ~ 47. 4~ ~ 18.6%~ and !J. 4%. The sources of· the .•~ 10)-1% o:f'~etotalactivity were not identified.
oD i~~~~4 1473

!~{.,
.~
Seeurity, ClassificationUNCLASSIFIED
L.INK A
________---- • It
"All distribution of thia report ia controlled. Qualified DOC uoers shall request through
"Qualified requesters may obtain cople.of tbAareport from DDC"
"Foreign announcement and dissemination of thisreport by DDC is not authorized. tI
"U. S. Government agencies May obtain copies ofthis report directly from DDe. 'Other qualWed ODeusers' shall requestthrouih
----------------------- ."
to----------_......._-------_.(5)
(2)
(3)
(1)
imposed by security ciassiCicati~n, usi~'standard stafemel1tasuch as:
xc the report has beep furni'shedto the Offic:e of TechnicalServices, Department of Commerce,for sale to the public, indicate thisfactilnd enter the price, if kno~.,11. SUPPLEM~NTARY NOTES: Uae for additional explanatory notelM
12. SPONSORING MILITARY ACTIVIT\,: Enter the name ofthe departmentsl project office or laboratorysponaoring (paY'"ing for) the research and deve1optl1ent. Include addtealM
13. ABSTRACT: ·Enter an abstract givini a brief aJld factualsummary of the document indicative of the report, even thouibit may also appear eillewhere in the body of (he tecbnical re-. •port. If additiol1al sp~ce is required, a continuation sbee.t shall
.be. attached.
Itis highly desit'ilble.that the abstract of cl..aiCiedreport.be unclassified. Each paragraph of the abstract shan end withan indication of the military security claasification of the information in the paragraph, represented as (TS). (S). (C), or (U)~
There is no limitation on the length of the abstract. However, the suggested length is from 150 to 225 worda.
14. KEY WORDS: Key words are technically meaningful term.or short phrases that characterize a report and may be used a.index· entries for cataloging the report. Key words must beselected so that no security classification i8 required. IdenU-'fiers,such as equipment model designation, trade name, militaryproject code name, geographic location, may be used as keywords but will be followed by an indication of technical context. The assignment of links,' tQ1e., and weipta 1. optional.
,t~¥r;,~~~~=~=~\:uashallrequestthtough
INSTRUCTIONS
Security Classification
FORMt JAN 04.
U'NCLASSIFIED'
1. ORIGINATING ACTIVITY: Enter the name and addressof the contractor, sUbcontractor, grantee, Department of Defenseactivity or other organization (corporate author) issuingthe report.
2a.REPORT SECURITY CLASSIFICATION: Enter the overall .security clas'i1if'ication of· the report. 'Indicate Wliether"Restricted Data" is included. :Marlcing is to be in accordance with appropriate security regulations.
26. GROUP: Automatic downgrading is specified in DoD Directive 5200.10 and Arll'led Forces Industrial Manual. Enterthe group number. :Also, when applicable, show that optionalmarkings. have been usedfo~~u~~'ized. .
3.REPORTTI1"LE:Enter the complete report ..title in all('opital lctt~rs. Titles in all cases should·be unclassified.II 1.1 m~:aninli'.rul title cannot be selected without classification, ol'iowtitle classification in all capitals in parenthesisimmediately following the title.
4. DESCRIPTIYENQTES: If appropriate, enter the type ofreport, e.g., interim, progress, summary, annual, or final.Give the inclus.ivtt dates when a specific reporting period i.covered. .
S. AUTHOR(S):Enterthe name(s) 'of author(s) as shown onOf it', the report. Entel' last name, first name, middle initial.Ie military, show rank and'branch of service. The name ofthe principal author is an absolute minimum requirement.
6. REPORT DATE; Enter the date of the report as day. '.month. year; or month. year. If more than one date appears .on the report,' use date of publication.
78. TOTAL NUMBER OF' PAGES: The total page countshould follow normal pagination procedures; 1. e.,. enter thenumbet of pagescontaining,inforination.
7b. NUMBER OF REFERENCES: Enter thetot~numberofreferences Cited in the report.
8~. CONTRACT OR GRANT NUMBER: If appropriate, enterthe applicable number of the contract or grant under whichthe report was written.
8b, Sc, & Sd. PROJECT NUMBER: Enter the appropriatemilitary department identification, such as project number,8\l.bproject number, aystem numbers, task number, etc.
9a. 'ORIGINATOR'S REPORT NUMBER(S): Enter the official'report number by which the document will be identifiedand controlled by the originating activity. This number mustbe unique to this report.9b. OTHER REPORT NUMBER(S): If the report has beenlIsslgn~<1 any other report numbers (either by the ori~ln.tor
or by the sPOllsor),also enter this number(s).
10. AVAlLABILITY/LIMITATION NOTI<::ES: Enter any lim:itationsonfurtherdissemination of the report, I'>thei than those