Embed Size (px)
Citation preview
RADIOACTIVE WASTE WAGEMENT AT
OAK RIDGE RATIONAL LABORATORY
Compiled and edited b y F. N. Browder
Principle Contributions
BY H. H. Abee, Health Fhysics Division F. 3T. Rrowder, Chemical Technology Division K. E. Cower, Health P h p i c s Oivision D. M. Davis, Health Physics Division W. G. Stockdale, Chenrical. Technology Division E. J. Witkowski, Operations Division
3 4 4 5 6 0 3 6 3 2 3 6 0

-2-
ABSTRACT
The collection, treatment, d i sposa l , and monitoring of radio- a c t i v e wastes ( sa l id , liquid, and gaseous) a t Oak Ridge National Laboratory are described i n d e t a i l , I l l u s t r a t i o n s af f a c i l i t i e s , maps, and t a b l e s of data on waw‘te volumes and radionucl ides d i s - charged t o the environment a r e i.ncluded. ‘The philosophy and hZs%ory of waste management a r e discussed. The r epor t c o n s t i t u t e s a n etralit- a t i o n of waste management, a t OREL, concluding that the low degree of rad ioac t ive contamination of t h e air and water by ORNL docs not represent a hazard to t he l o c a l environment or population,
T h i s report, was prepared for t h e public heaxings on i n d u . s - n ~ i a l . rad ioac t ive waste d i sposa l before t h e Joi>c, Comtnit’kee 03 Atom5.c Energy, Congress of t h e UnFted Stktes, Jan tmry 28 through Febmary 3 , 1959 *
s - - .

-3-
Table of Contents
C . History of Waste Managemen-i; a t ORNI, . . . . . . . . . . . . . . . . . . . . . . . . . 11. Current Handling and Disposal Methods for Liquid Wastes ---I-----
A . Stream Bo. I, "Highly Radioactlve" Liquid Chemical Waste ---- B. Stream XJo. 2 , Liquid uranium Waste ---------I----------------
C . Stream No. 3 , Process Waste Mater . . . . . . . . . . . . . . . . . . . . . . . . . . . D . Wastes Dische.rged Direc t ly t o Creeks --- - -- - - --- - - - - - - -- - - - - -
Current Handl ing 8,nd Disposal Methods for Gaseous Wastes ------- 111.
IV . Current Handl ing a ~ d Disposal Pile-bhoc?.s foz I_ S o l i d Wastes ---------- V. Surveys aad, Studlee I of Was33 3isposa?- Effectiveness --------------
A. Monitoring f 0:- A i r -borse C o z h n i n a t i o n --- --- - -- --- -- - - - -- - -- E. LiquY. Waste Ivlonitoring for Wtzter Contamination -------------
Page 4
4
8
13
13
16
18
23
25
33
36
47
55
55

L i s t of F L w e s
Fig. No. Page
Location Sketch Map,ORNL A r e a Sturface Drainage, ORNL-LR-Dcag. 2&05 --- I. 5
2. Simplif ied ORNL Radioactlve Waste Disposal F l o w e h e e t , ---------------- 7
3 ORNL SimpLifieC L i q u i d Waste Disposal Flowshea-t, ORNL-LR-Dwg. 542Z3 -- 14
4. Dry Well and Waste Col lec t ion Tank I n s t a l l a t i o n , ORm-LR-Dwg. 29939 -- ’ J-5
ORNL-LR -DWg e 28461
5. ORMI, Waste Disposal Area, Photo 15898 -------------------------------- 17
6. Flow D i a g r a m of Process Waste: System, ORNL-LR-Dwg. 28406 -I----------- 21
7 . Process W a s t e Treatment P lan t , ORUL-!,Fi-Dwg, 15692 . . . . . . . . . . . . . . . . . . . . 22
8. C e n t r a l Gas Disposal Area, ~ h o t o ~.1400 . . . . . . . . . . . . . . . . . . . . . . . . . . . . . . . 28
9. Cent ra l G a s Disposal Area, Photo 11599 . . . . . . . . . . . . . . . . . . . . . . . . . . . . . . . 29
10. Centra l Gas Disposal Area , Photo a1598 - - - - - - - - - - - - - - - - - - - - . = - - - - - - - - = - - 3@
39 11 a ORNL Local.. AFT ,MonFtor i ng S t a t ?on, P hu t o 421 39 - - - - - - - - - - - - - - -- -$ c- - - - - - - 12. ORNL Porlmeter and Remote Air Monitoring Sta t ion , Photo 19663 -------- 40
13. ‘ORNL Pal:-out Sedimentation Tray , Photc 1,3465 . . . . . . . . . . . . . . . . . . . . . . . . 41
14, Tennessee V a l l e y Map of Observstion Locat ions O~MY-LR-DJ~ . l 3Ol6 - - - - 5 1
L i s t of Tables -- T a b l e Do. Page
I. Y e a r l y Volumes and Radioactjvit? of Discharges of Liquid Wastes ------ 10
11. Air Act iv i ty Measiired by Cont5nucjua Ai:, M O X I ~ ~ Q T S ...................... 4s
t o W b i t e Oak Creek at, ORRL, 1..5)50-1-957
I11 P a r t i c l e Cozcen-sratLoq Meadxrec? by CmtF-idoiis A i r Monitors -----------a- h6
IV. Calcula ted Val.ues of Radioacti;lr. Gon5arn‘Lnirztion Diachs rged - ------- - - - ’ = 53 t o Streams

-4-
RADIOACTIVE WASTE MANAGEMENT.
At
OAK RIDGE NATIONAL LABORB'ilORY
I. Introduction
A. General Description
O a k Ridge National Laboratory (OFWL) is a nuclear research and development center operated for the U. S. Atomic Energy Commission by Union Carbide Nuclear Company. The Laboratory employs a total of lc,OOO people at two s i tes , X-10 and Y-12, near O a k Ridge, Tennessee. This report describes the management of wastes from the major radioactive operations at the X-10 site.
The main X-10 area is approximately one mile long by one-half mile w$de. Its numerous buildings house laboratories, chemical processing pilot plants, radiOisOtGpe production plants, nuclear reactors, and supporting service facil- ities. Waste collection facilities are located near the center of the main area, and a waste disposal area is situked approximately one mile west of the main area. Figure 1 shows the arrangement of the ORNzi X-10 site.
Radioactive wastes are collected and treated according to their physical states (solids, liquids, and gases), components before the wastes are discharged to the environment,the wastes a r e further classified into the following types f o r separate collection and tyeatment:
To simplify the removal of radioactive - 1. "Highly rsdioactive" liquid chemical waste: 7,000 gallons per day, 0.001 - 0-02 curie* per gallon, the "hottest" waste at ORNL, which is not highly radioactive compared t o high-level wastes at nuclear production plants;
2.
3 . Mildly contaminated prccess waste Jater - 7OO,OOO gallons per &y, 9.1 to 1.0 microcurie* per gallon;
Liquid uranium waste (very small volume, moderate radioactivity);
4. Solid waste (variable radioactivlty) ;
5. Reactor cooling air (high radioactivity) ;
6.
'7. High-radioa.ct~-vity off -gas
Cell- and hood ventilation air (low radioactivity);
*"he curie is that uantity of any radioactive nucl ide which disintegrates at the rate of 3.7 x ld % disintegrations per second. T h i s is the unit of radio- active substance equivalent to 1. gram of radium. A m;lliciirie is 0.001 curie; a microc-iirje is 1 x 10⁻⁶ curie.

.
Fig. 1 . Location S k e t c h Map, ORNL Area Surface Drainage.

-6-
!khese wastes are descr ibed i n greater d e t a i l below. Figure 2 diagrams the man- agement of these wastes (according t o the above number sequence) and shows t h a t a f t e r t reatment t o reduce t h e l e v e l s of r ad ioac t iv i ty , Liquid wastes a r e d i s - charged t o t h e Clinch River and gaseous wastes a re discharged through t a l l s tacks t o t h e atmosphere. S o l i d wastes are buried i n t h e ground.
B Waste Management Philosophy
The goal of rad ioac t ive waste management a t Oak Ridge Nat ional Laboratory i s t o dispose of t he wastes as s a f e l y and as economically as poss ib le . A t p resent t h e following approach t o t h i s goal i s being taken:
1. To confine t h e major por t ion of long-lived f i s s i o n products from a l l types of waste i n tanks o r i n t he ground, where they w i l l become chemically a t tached t o the s o i l ;
2. To d i l u t e law-level wastes i n t h e atmosphere and t h e sur face water drainage system. The d i l u t i o n f a c t o r s ava i l ab le i n these media are used t o reduce the concent ra t ion of long-lived strontium-90 and ces ium-137 t o t h e maximum permissible concentrat ions s e t by t h e National Committee on Radiat ion Pro tec t ion and the I n t e r n a t i o n a l Commission on Radiological P ro tec t ion ; l
3. To monitor t h e waste streams before and after discharge i n order t o follow t h e success of t h i s program.
The d i sposa l of r ad ioac t ive waste i n t o the ground i s considered t o be an A number of experiment as w e l l as an expedient so lu t ion t o a l o c a l problem.2
loca l condi t ions permit t h i s ground d i sposa l experiment t o be rua wi th apparent skfety:
F i r s t , t h e Laboratory 5s i so l a t ed by d is tance (12 miles t o t h e neares t com- munity) and b y p a t r o l s t h a t keep the publ ic from po ten t i a l ly hazardous areas, A b u i l t - i n f a c t o r of s a f e t y f o r t he publ ic i s achieved by t h e f a c t t h a t the neares t downstream consumer of Clinch River water i s another nuclear p l an t ( the Oak Ridge Gaseous Diffusion Plant--Item 3 i n F ig . 1) i n t h e Oak Ridge Control Area, which continuously monitors i t s water supply f o r its own pro tec t ion .
Second, t h e Levels of r a d i o a c t i v i t y and t h e volumes of waste from t h e re- search and development operat ions a t t h e Laboracory a r e lower b y a t least 1,000 times than those a t nuclear production s i tes such as Hanford and Savannah River .
Third, i n t he waste dLsposal a r e a the re i s 5 large formation of Conasauga sha le containing c lays which have a considerable abi l - i ty Lo capture and hold r ad ioac t ive components of waste while allowing the waste water t o seep through. The shale provides an inexpensive and e f f e c t i v e means of d i sposa l for most of t he Laboratory 's l i q u i d and s o l i d rad ioac t lve wastes. The sha l e p i t s are described i n Sect ion 11, A. Both surface ai?d ground water^ from t h e main X - 1 0 a r e a and t h e waste d i sposa l area f low t o a n a t u r a l baszn drained by W h i t e Oak Creek, w h i c n empties i n t o t h e Clinch River w i t h i r i t r ie OFLK Ridge Control k e a . ihis r e s t r i c t e d drainage provides a means 0.1 sti id2inc< t h e Lateral. movement o f any rcd ioac t ive seepage from t h e waste disposal. a r e a .
r i

(u
I h
I
.- . -.
. .. . . .
.. . . .
r-
d-
1
3
-
m
Q'
J
r
LT 0
I- o
r
E 3
--
I I
-- _J
J

-3 -
Gne of the unique factors i n dea l ing w i t ! z r ad ioac t iv i ty i s t h a t it cannot be .strayed. No process has y e t been developed t f 2 speed U J ~ (ur s l n w down the emna- -01-1 of' particles and r ays frorn rad ioac t ive atoms; t i m e i s the only agency capable
destroying r ad ioac t iv i ty . This l'a,ct presents t he l a r g e quant i ty producer of idioact tve waste with tuo a l te r t ia t rves f o r disposing of' i t :
1. Rendering t h e rad ioac t ive waste harmless by d i l u t i n g it and d isburs ing it until t h e concentrat ion of t he rad ioac t ive components i s too low t o be hazardous; or
2. Separat ing t h e rad ioac t ive components from t h e wzste, concentrat ing them t o 8 convenient volume,and s to r ing them u n t i l time can destroy them by natura?. decay.
i e waste management philosoplng. a t Oak Ridge National Laboratory has been t o fol- 3w t h e f i r s t a l t e r n a t i v e f o r large volumes of low-act ivi ty waste and t h e second l t e r n a t i v e or h igher -ac t i v i t y wastes.
Responsibi l i ty f o r segregating, co l lec t ing , t r ea t ing , aud disposing o f all sdioact ive wastes s ince t h e beginning of t h e Laboratory has been delegated t o he Operations Division, which must a l s o measure and record a l l rad ioac t ive con- minat-ioiz as it is discharged t o t h e environment. Responsibi l i ty f o r studying he ef fec t iveness of rad ioac t ive waste disposal i n t he environment by means of trem s<mpling and sixveys and r e spons ib i l i t y f o r reporting the degree of con- ax ina t ion i n these streamsklave been delegated to the Health Pfiysics DivisiGn. he sr?rjara';i? delegat ion of these resToi i s ib i l i t i es provides an independent check n methods cs.C operat ion and. analysis ai i t l on concentrations bein3 released t o the nvi.ronment . liesearch 3:iCl ileveloprnent e f f o r t s on tias'ie l;:xn I:.'; and disposal. r e carr icr l . c:r,o:,?era?,ivel.y by t h e C5.cmic:Lil Teclmg?-o;y and I!ee ?l iysics Divisions.
;.. 'The present s i z e of t h e LaboraLoFf and the scope of i t s T~TGTli have been
>i~stjr.j<. cia ~ J a s t e ~janag:ernent a< ~;PJG' --- -
eachect by- a series of' cxpansions. The means of' handling t h e considerable 1-iantiti.es o r irasttr: prciduce? 'sy t h e processes perfoi-med. ai; thr? Lzboratory hap: 2d. to ! IC c'ostnged from time to t i m e t o keep pace v i t h t h e EX: Xiing program.

Addit ional decontamination of the rad ioac t ive supernatant by decay was gained by rece iv ing and holding waste i n one of t h e la rge s torage tanks f o r @s long a time as possible while decanting t o t he s e t t l i n g bas in from another tank containing aged Taste. T h i s procelure allowed s u f f i c i e n t time for much shor t - l i ved (ana hence more in tense) r a d i o a c t i v i t y t o decay before t h e waste w a s discharged t o t h e creek. iodice-131, 28-d.ay cerium-1-41> 33-houy cerium-143, 41-day ruthenlum-103, 12.8-day barium-140, and 40-hotc lan$hanum-d+C a
The i so topes removed by t h i s proce2ure were 8-day
Thus t h e 7,000 gal-lons per day of highest a c t i v i t y waste a t ORNL was given a p r e c i p i t a t i o n s tep , about one month holdup for decay, t r i p l e s e t t l i n g ( i n the tanks, t h e s e t t l i n g bas in , and i n the l ake behind the dam), and about 500,000 t o 1 average d i l u t i o n i n the Clinch River . It was ca lcu la ted a t t h a t time t h a t a maximu.m 5 c u r i e s per day of mlxed fiss;ion products could be discharged safely i n t o t h e lake, and fo r several years t h i s c r i t e r i o g was used. An average a c t i v i t y discharge of 284 cu r i e s per years considerably below t h i s l e v e l , hes been main- t a ined t o da t e (see Table I). throlugh a cont ro l led na tu ra l drainage basin was continued until. June, 1949. This method of d i sposa i had been cozsidered adequate as a temporary msasure, but t h e agreement upon more s t r i n g e n t t o k r a n c e s necess i ta ted a n improvement.
This method of d i sposa l by d i l u t i c n and discharge
From LTune, 1949, u n t i l June, 1954, The highly actixae l i qu id chemical waste was concentrated by evaparatioa i n a pot-%ype evaporator Fnsteed of being de- c a n t d and d i l u t e $ i n the 1. Ire, During t h a s period t h e evaporator processed a
a c t i v e concentrate t h a t were s to red i n t h e concrete tanks. The water bo i l ed off from t h i s . %ask container? an average of only 0.014% of t h e rad ioac t ive contam- i n a t i o n enkering t h e evaporator Tbe e f f ec t iveness of the evaporator i s demon- s t r a t e d b y the ft..c-t. %hat rluring t h e per iod of i t s opera t ion only 14.5 cmies per year came froin t h e eveporator, al though a n average of 320 b e t s curies per year was discharged t o t h e creek fzom t h e Laboratory. The remaining contam- i n a t l o n came from process waste water and from acc iden ta l discharges (ma in ly leak ing waste pipes a n t valves) . The evaporator was taken oxt of s e rv i ce i n June, 1954, af'ier t h e f i rs t 1,000,000-gallon experirnexlxl ground d i sposa l p i t had been 'Ln opera t ion for two years . Since that . time t h e p i t s 'nabre receive6 a l l t h e highly r a d h a c t i v e l i q u 2 d chem5.ca2. iqaate.
t o t a l of 11,650,000 gal?-ons E- , reduciag this volume t o 432,000 gallois 6f rad io-
In 1950 t h e Lsboratoq b725 again g rea t ly eii2anded i n s i z e and scope of opera t ion . The waste systems kfe;ne expanded +,o handle %he increased waste volumes and levels of r a d i o a c t i v i t y , waste types werc? devised t o aid t h e toll-ection a n d segregat ion of l i q u i d waste. Underground stalxiless steel. Tanks to monitor separa te ly the highly a c t i v e cbemlczl waste and the l l q u t d uraPSum raaste were installed near each bui ld ing o r a r e a t h a t Zs a sourc? of either t y p e sas tc . The t anks p e r a i t sampli-ng and rneasuement of .,:as+,? volumes and ra tes of accumiLh,tLon from eac-t- saurce.
Monitoring systems fo r a11 three l i q u i d

t
I Table I
YEARLY VOLUME3 AND RADIOACTIVITY OF DISCMGES OF LIQUID WASTES
TO WHITE O M CREM AT O m , 1950-1957a
-~ ~-
Gross Beta Activity, Per Cent of Gross Beta Act iv i ty Iden t i f i ed curies with Specif ic Radionuclides
Tota l TRE -
S e t t l i n g Retention Volume,
Year gal Basin Pond Total (-Ce> ce RU Zr CS I Sr Nb Ba CO
1951 297.6 169 3 1-72
195% 268.2 411 87 4%
I P 0
I
2.6 0.8 2.6 8.5 0.2 27.6 1.0 0.8 --I 1953 239.4 289 140 429 53.1
--- 1954 164.3 237 17 254 34.6 19.1 0 . 5 1.0 20.3 0 . 5 23.3 0.4 0.3
--- 1955 210.6 213 54 267 30.3 14.7 3 . i 0.6 31.6 0.2 18.7 0.6 0.2
1956 260.7 253 20 273 24.4 12.3 2.0 0.5 42.1 0.1 15.1 1.0 0.2 2.2
1957 2'72.3 (combined) 189 85.8 4.4 1.0 10.2 36.5 0.0 18.0 0.7 0.0 1.8
P
a. Volume of s e t t l i n g basin e f f luen t measured in weir box with l i q u i d level f l o a t recorder. of radioactivity,continuous proport ional samples of the e f f luen t are composited for da i ly gross beta measure- ments and monthly radiochemical separat ions and analyses.
For determincttion
b . Trivalent rare ea r ths exclusive of cerium.

4
- bl-
The monitoring scheme i n s t a l l e d for process waste w t e r cons i s t s of weirs mounted i n manholes i n t he underground sewer sysbem t h a t c o l l e c t s t h i s waste. These weirs permit measurement of t he waste voiume from each source and propor- t i o n a l sampling of t h e waste f o r determination of' t h e rad ioac t ive contamination.
For gaseous wastes E 250-foot s tack, f i l t e r houses, biowers, underground ducts,and an e l e c t r o s t a t i c p r e c i p i t a t o r were added t o e x i s t i n g f a c i l i t i e s .
I n 1951 t h e f i rs t experimental ground disposal pi% was b u i l t . A l a r g e r (1,000,000 ga l lons capac i ty) p i t was b u i l t i n 1352, and -two more 1,000,000-gallon p i t s were b u i l t i n 1955. tank a rea to the d isposa l p i t area were instal le iF i n 2954 t o rep lace a tank t ruck previously used t o t r anspor t l i q u i d waste.
A pump a,nd a 2.-1/2-aile-lmg p ipe l ine fron t h e c o l l e c t i o n
Between 1952 and 1957 a m e t a l recovery process reclaimed approximately 130 tons of uranium from l i q u i d uranium waste co l l ec t ed over t h e years i n the o r i g i n a l waste s torage tanks. The waste *om t h i s recovery process was sent t o t h e highly rad ioac t ive l i q u i d waste system for evaporation o r d isposa l to p i t s .
The lake behind t h e dam on White Oak Creek w a s drained i n 1955 fo r t h e following reasons:
1. TQ
2. To
3 . To
4. To
5. To
6. To
perform necessary maintenance work 011 %he dam f a c i l i t i e s ;
destroy and dispose of tine aquatic species i n the Lake;
avoid a t t r a c t i n g and har3oring raigra.tory wildfowl;
pyoviae add i t iona l safeguards by incrensing r e t e n t i o n p o t e n t i a l ;
facil i tate and improve controL of a c t i v i t y r e l e a s e s ;
p e r n i t modification of sections of k h e l ake a rea for research use.
The stream now f l o w s through the lake bed and through a s l u i c e i n the dam, which can be closed t o impound contaminated water when the ? e d a r i s e s . A bypass has been proposed t o car ry t h e stream f low a ~ o u n d the d-=m when R need a r i s e s t o i m - pound wa%er, but $h is proposal has ilot been camieii out bo d&te, A con.tinuous sampler and a r a d i a t i o n monitor (submerge6 Lr? R container through which strean water is c i r c u l a t e d ) have. been InstaLl.ed a t t h e dem T>e m n i t o r cas detec'c e ''slug'd of r ad ioac t iv i ' q and can sound an alarm, but iC, i s considered a. stop-gap instrument u n t i l a b e t t e r one can be developed-
Studies of wildlife Ln the k k e were mde between 1950 and 19.53 5 and i n l.9566:7 t o determine some ecologica l e f f e c t s of rad ioac t ive contamination. Agr icu l tura l crops a r e being grown i n the contmiinated mud of t he l ake bed t o study uptake of r a d i o a c t i v i t y by plan-ts819
In 195'7 a waste water treatment. plarit was [email protected]+,ed and put in.'m operaption. The f u m t i o r , of t h i s p lan t i s t o reduce -the I.evel. cf sadioac<;ive conternination Ln the l ow-ac t iv i ty process waste water disithei*ged tc; White O& Creek. automatic divers ion valve i s currently (Sai-iuap:/
A n 1959) operat ing t o feed t h e

- 12 .-
Gntire process waste water flow t o r ad ioac t iv i ty i n t h e waste exceeds below the s e t point , t he automatic p l a n t and t o the creek through the
the treatment p l an t whenever the l e v e l of a given po in t . When the a c t i v i t y l e v e l i s valve d i v e r t s t he waste around the treatment s e t t l i n g b a s i n .
A multicurie f i s s i o n product p i l o t p lan t was completed i n 1957 t o recover strontium-90, cesium-137, and other valuable radioisotopes from high-ac t iv i ty Liqu-id wastes. T h i s p i l o t p lan t . should be most valuable f o r t r e a t i n g extremely high-level waste from fu tu re processes planned for %he Laboratory.

I
-. 3.3 -
11. Current Handling and Disposal Methods for Liquid Wastes
A. Stream No. 1 (Fig. 2): ii2gh.l.y Radioactive" Liquid Chemical Waste 11-
The term "higbiLy r ad ioac t ive" i s appl ied t o the 7,OOO-gallon pes day l i q u i d chemical waste stream a t O a k Ridge !Va+,ional Laboratory only because t h i s stscaxt has the highest l e v e l of r a d i o a c t i v i t y of any waste a t the Laboratory. However, compared t o highly act-ive wastes ( 'containing 80 t o 5200 c u r i e s per gallon'') at production s i t e s , chis ORNL s t r e a n i s nzisnamed, because i - b s concen%ra",on of' rad io- a c t i v e componer-ts i s normally between 0.001 and O a 0 2 curie per gallon. In 1957 some experimectal operat ions (Thorex) produced wastes having activity l e v e l s as high as 2 curies per gallon when accepted in to t h e wsste system, but the t o t a l volume of these wastes w a s less t h a n l , O O O ga l lonsa developmen% nature of the Laborz$ory br ings about f requent changes i n the prc- cesses t h a t produce waste, t h e mste composition i s not cons i s t en t . Larger volumes and higher r a 6 i o a c t i v i t y levels axe expected fi-ora fu-kire operat ions. main radioisotopes a r e usua l ly cesim-137, ruthenium-106 - -rhodium-E06, strork.ium-90 - - yttrium-90, and t r i v a l e n t r a r e e a r t h elemen-ks. Strontium, cesium,azd t r i v a l e n t rare e a r t h s consti txte the inajor f r a c t i o n of r a d i o a c t i v i t y on an average dis in- t e g r a t i o n per minute basis. rad ioac t ive s o l i d s i n the waste.
Because tine research and
The
Sodium and n i - tmte account f o r abou'c 70% of the non-
The handling of highly rad ioac t ive l i q u i d cSemical we-ste i s i l l u s t r a t e d i n Figs . 2 and 3, which a r e simplified % w s h e e t s of t h e Eabo,-a,tcqyPs wes'ce systemsG The main sources of t h e l i q u i d chemical waste & r e chemical processing p i l o t p l an t s . Radioisotope production facil i t ies and r e s e w c h labora%ori,es produce wastes of smaller volume ar,d lower a c t i v i t y l eve l . The s p e c i a l f i s s i o n product kr66i;es shown i n t h e upper r i g h t corner of Fig. 3 a r e recovered and consey~en '~1y d.c no% ccntri- . bute d i r e c t l y t o 5hhe waste strecull. . * .
Highly radioac-hive liquid chemical was-ke i s discharged from process vessels i n labora tory and p i l o t plant c e l l s i n t o "hot" &-aim, vhich axe skair i less steel p ipes leading to underground s t a i n l e s s s t ee l monitoring tanks. 19 of these 500 t o 400C-gaJ. capaci ty tanks in se rv ice ( icc luding tank W - 1 , Fig. 3); t h e i r total . capaci ty i s approximate2.y 34,000 gal. main cont r ibu tor t o permit grzvity f l o w t o the 'cad<. The func t ion of 5bese moni- t o r i n g -tanks i s t o c o l l e c t t h e waste m d t o provicle a meens of saapl ing it md- Of measuring i t s volume. The tmAs pi.ovide %he Operations DZvFxion wi2h a means of checking or, w a s Q e cun-tribueors for r a t e or" w a s t e produe-tim and t o be sure each type waste g e t s i n t o its proper system fo r t s e z t m m l ; before disposal. Eech tank has connections t o the 5ighi.y r ad ioac t ive c;iemical mste system arrd Lo t h e process waste water system t o give a choice of Lreakuent dependicg on composition, r a d i o a c t i v i t y i e v e l and o the r cons idera t ions*
The;*@ a r e now
Ecch -:enlr is loca ted near iC,s
Figure 4 shows the buri.zS_ d e t a i l s of .the mocitoring -banks. Each tank i s
Liquid 12 the sump i s anchored t o a concrete saucer tha-t slopes toward a s w . m e s ~ m p collects ground water seepage m-d any 1iqu.Fd- that leaks from the tank. sagpled perio3ically for radioact i - , r i ty t h o u g h E "dzy w e l l " t o de-:?-mlne whether the tank has ieakec!. abandomd. after leaks were di8cove::eii in t h i s rm-ine~. Eceeuse ms t cf ihcse leaks weye caused by acirl Corrosion. of ?he tanks, caust ic soc3a i o n e u t r a i i z e in?r;ms'.ng a c i d waste i s now a.ddei tri each tmk. No leaks have been discDvered s i n e ?.his proceciurr was s r,arted.
Dwing tk-e past 15 ye&-s t h r e e 2 a r h were emptied and

-1 4-
.
5 J J J 1 i J
,A J A A A
n
Fig. 3. ORNL Simplified Liquid ;Plcste Disposal Flowsheet.

-1 5- ....... __ .. .- - ..... .- ........................ ......... .- . ._l_l..~_
UNCLASSIFIED ORNL-LR-DWG 2992
LIQUID LEVEL
8" VITRIFIED PIPE
6
--._ ....... ~
4 .
D .
A .
- - - I ' XI' XI' SUMP '.--CONCRETE SAUCER
............. ... I__
Fig. 4. Dry Well and Waste Col lect ion Tank Instaliation.

-16-
Each tank i s equipped with a f loa t - type volume gauge, which shows on a board above p o u n d the quant i ty of waste i n the tank. Although t h e rate of waste accumulation i n a l l l9 monitoring tanks i s continuously recorded at 8 c e n t r a l s t a t i o n by a telemeter ing system, a waste system operator visits each tank every four hours t o check t h e waste volumes l e s t a tank overflow beca-Jse of a f a i l u r e i n t h e te lemeter ing system.
When a monitoring tar& becomes f i l l e d , t h e operator switches on a self- priming, packless -pump t o t r a n s f e r t he w a s t e t o one of t h e t h r e e 170,OOO-gallon concrete s torage tanks i n the s torage farm ccnCrally loca t ed i n t h e main X - 1 0 opera t ing area. These tanks r e s t on concre%e ssucers t h a t d r a i n t o 8 system of dry w e l l s f o r leak de tec t ion sirnilm t o those of t h e monitoring tanks. c e n t r a l s torage tanks a lso have volume gauges, samplers and an underground system of t r a n s f e r l i n e s t h a t permit t r a n s f e r of t he wastes from one tank t o another.
The funct ion of t he c e n t r a l s torage tanks i s t o provide temporary s torage
The
f o r the highly r ad ioac t ive l i q u i d chemical waste while the shor t - l i ved radio- i so topes decay (see sec t ion I, C ) . t o accommodate normal accumulation f r o m Laboratory operat ions even during ocuasianal shutdown and repair of pumping equipment. c e n t r a l s torage tanks approximately a mile and a ha l f through a 2-in. dia under- ground s t e e l p ipe t o t h e d isposa l p i t s .
These tanks provide adeqpate surge capaci ty
Wastes are per iod ica l ly pumped fram t he
The waste p i t s a r e th ree i,000,000-gal open c a v i t i e s bulldozed i n the e a r t h i n a l o c a t i o n chosen f o r remoteness frorn t h e Labor~tory , the type s o i l , and t h e f a c t that underground SLraiarsge is toward White Oak Creek.2,11a shale , has t h e property of removing and r e t a i n i n g most of t h e r ad ioac t ive components while t h e waste water and c e r t a i n nomizdioactive chemicals seep through it toward White O a k Creek. F;as%e enters p i t Bo. 3 , which overf4ows through a valved ;?ipe t o p i t No. 2, which overflows s M l a r 1 y t o pit No. G. Figure 5 i s an eerial photo- graph of t h e waste d isposa l a r e a showing t h e p i t s i n t h e foreground, t h e creek, and i n t h e upper left corner a pm'~ of t h e m & n X-10 -ea. The p i t s a r e each 1.5 f b deep w i t h s i d e s s loping a t an angle of 30 . Their t o p dimensiom are 210 f t by 100 f't. The p i t s are covered with wire screen t o prevent access t o wild l i f e . The w a s t e discharged i n t o the p i t s i s sampled and analyzed f o r rad io iso topes and s t a b l e chemical ions, and the movement of these ma te r i a l s i n t h e soil. and i n t h e seepage i n t o the creek i s monitored by %he Heal-ich Physics Division. radioisotopes detec ted Tn t h e seepage t o t iate are ru-bkenium-106, c o b d t -6% and- antimony-125. average 23 c u r i e s per year . 106 seeped from the p i t s , but only 60 c w l e s of ruthenium-106 were de tec ted passing White O a k Dam. increase of 20% over 1956; i n 1958 52,800 cu r i e s were discharged, an increase of 25% over 1957. processing ti.';. the Hot P i l o t P i a n t . By t he end of 1958 t h e t o t a l of a11 wastes discharged t o t h e p i t s s ince the start of this prac t i ce was 11,703,000 ga l lons containin; 167,000 curies (at t F m e of d i scharge) .
The s o i l , Comsauga
The only
By t h e en6 of 1956 t h e seepage of ru%henium-l06 vas estimated 'GO
In 1957 samples ind ica ted 200 c u r i e s of ruthenium-
I n 1957 a t o t a l of 41,900 curies was discharged t o the p i t s , an
These increases were 6ue maiily to higher r a d i a t i o n l e v e l s i n
B . Stream N o . 2 (Fig. 2 ) ; Liquid Uranium Waste
The quant i ty of l i q u i d iu-anim waste i s much less than i d G was e a r l i e r i n the history of the Labora'cory, as it is now prodliceil a t a maximum rate of only 100 gallons per week. In t h e sense ~liai; it is act-mlly a so lu t ion of reusable uranium

1
-1 7-
0
E Q

-18-
contaminated with f i s s i o n products, t h i s i s not a true waste. It i s co l lec ted and s tored temporarily p r i o r t o treatment f o r recovery of the uranium. Between 1952 ant3 1957 approximately 130 tons of uranium were recovered. The separated f i s s i o n products a r e discharged t o t h e highly rad ioac t ive chemical waste system. Figures 2 and 3 i l l u s t r a t e t he handling of l i q u i d uranium waste.
The l i q u i d usaniuzn waste from the various cont r ibu tors i s co l l ec t ed separately from other l i q u i d waste by m e a m of a system of seven monitoring tanks (total spa- c i t y 7,500 ga l lons) , similm i n all respec ts t o those described above for the highly radioact ive l i q u i d chemical waste. uranium waste, which flows by g rav i ty t h o u g h spec ia l stainless steel dra ins from t h e source f a c i l i t i e s t o the tanks. The waste volumes i n t h e tanks are recorded a t the c e n t r a l s t a t i o n by t h e previously described te lemeter ing system, and a waste system operator checks the tank gauges every four hours t o prevent overrlows. vas t e from full tanks i s pumped t o t h e c e n t r a l tank farm, where th ree l70,OOO- gallon and two 42,500-gallon un&erground concrete tanks s to re it u n t i l enough has accumulated t o waxrant ru in ing t h e uranium recovery f a c i l i t y .
Each buried tank serves a source of l i q u i d
The
C . Stream No. 3 (Fig. 2 ) : Process Waste Water
The sources of process waste water a r e equipment cooling systems, f l oo r drains , decontamination pad dra ins , s torage canals , laboratory sinks, and discharges from low a c t i v i t y operations. wastes except sewage and storm water, ye t it i s t h e most; d i f f i c u l t t o manage be- cause of i t s combination of r ad ioac t iv i ty and l a r g e volume. The 7OO,OOO gallons per day o€ t h i s waste make cur ren t basis. The waste i s col lected, sampled and discharged t o the creek con- t ipuously. system t o the other l i q u i d waste systems.
It i s the l e a s t rad ioac t ive of all Laboratoiy l i q u i d
storage impract ical and necess i t a t e disposal on a
Figures 2 and j i l l u s t r a t e t h e r e l a t i o n of t h e process waste miter
The process waste system sometimes serves as an emergency %am" system. Much of the rad ioac t ive contanination put through t h i s system i s a r e s u l t of equipment failure, human e r r o r , o r accidents that muse a misdirect ion of con- tamination from the higb?ly a c t i v e chemical. waste system. Whenever unusually high l e v e l s of r ad ioac t iv i ty occur, an e f f o r t i s made t o d ive r t the rad ioac t ive por t ion t o the high ec",vity l e v e l sys'iem as soon as poss ib le . A network of 6- in . t o jO-in.--himeter v i t r i f i e d c lay pipes c o l l e c t s arrd conveys the process w a s t e rmter by g ~ u . - i t y flow t o a c e n t r a l monitoring point near t h e i n l e t t o the l,5OO,OOO-gallon s e t t l i n g basin, where the volume of f l o w is measured and sampled continuously. The smi3les a r e co l lec ted every four hcurs and analyzed for gross beta a c t i v i t y . The process waste -water co l l ec t ion system is divided i n t o severa l sec t ions , each of which i s served by a s t r a t e g i c a l l y located monitoring s t a t i o n . Each s t a t i o n i s a concrete manhole i n which a r e mounted SL V-notch w e i r , a w a t e r l e v e l recoi-der f o r 2etermining volume of' flow and a finger-type p'mp for co l l ec t ing samples whose v o l m e s a:re proport ional t o t h e flow. a t t h e central m o n i b r i n g station rises t o about 150 c/m/m.l* o r g rea t e r , the sowce
When the r ad ioac t iv i ty l e v e l

-19-
' responsible for t he jncretwe caa be loca ted by r e f e r r i n g :o t h e monitoring samples, and correc3ive a c t i o n can be t a k e n t o minimize discharges of rad io iso topes through t h i s low-level system. Wi%h a new treatment p l a n t available, process waste water can be temporaril? held and. t r e a t e d t o reduce the l e v e l of a c t i v i t y . The t reatment p l a n t i s descri3ed. i n more d q t a i l below.
The y e a r l y volumes and r a d i o a c t i v i t y of the process waste water during t h e years 1950 t o 1957 ase summarized in Table X. The to2;al volume of flow has ranged from abou.5 165 -Lo 298 a i l l i o c gallons per year f o r ai3 average of 7GO,OOO gal lons per day, The l e v e l of gross beta ac%ivj . ty 3orrnall.y ranges from l e s s than f i f t y +,o s e v e r a l hundred c / m / m l w i t h occasioiml t r r n s i e n t 1eCrels above LO00 c/rn/rnl, de- pending upon opera t ing condit5or.s i n t he LaboraLory. The f o w t h column i n Table I, headed "Retention Pond," r e f e r s t o a small voluae of drainage from the monitoring pads underneath and from the s o i l around t h e underground waste s torage tanks i n t h e central tank farm. This pond previously served 3s a TnonitoTFilg poin t for t h e de t ec t ion and rneasuzemerit of any leakage i n t h e highly Pedioactive l i qu id chemical and l i q u i d uranium waste p ip ing and s to rage sys tems, The r e t e n t i o n pond stream h a s been in te rcepted and i s now pumped t o t h e equal iza t ion bas in of t he new'process waste t reatment p l a n t . The t o t a l gross beta a c t i v i t y of discharges t o White Oak Creek from t h e process waste water system and t h e r e t e n t i o n pond has ranged from 172 t o 498 curies per year. Despj-te a hundred-fold increase In levels of rad io- a c t i v i t y i n t h e opera t ions a t ORNL s ince 1951, Table I shows t h a t t h e a c t t v i t y l e v e l s i n discharges t o t h e creek have not increased proportionably. The 3-957 low of 189 cur i e s WES achieved b y a reduct ion i n the freqr:ency of acc iden ta l r e - leases, constant po l i c ing of process waste streams, and opera t iox of t h e process waste water %reatmen$ p l a n t , The waste discharged from t h e c o l l e c t i o n system is anrma.ll> cles:? w i t h very i i t t l e
from about 2.0 t o 11.5.
L e s s than 100 c u r i e s veye discherged i n 1958.
. suspended matzer; bu'c i% varies wildel,y i n a c i d i t y UT? n X a l i n i t g , t h e pH ra.nging
The flow of t b e e f f luen t froa t h e s e t t l i n g basin is ncasuxez a t a weir 'irox near the po in t 05 discbzrge to the creek, a36 composite s a m ~ l e s a r e co l l ec t ed by a Trebler propor t iona l sszm-pler + RadiockemLcal analyses of thesc samples f o r f i t re years (1953-1957) are summarized is Table Y- The Chemical, rad ioac t ive , an6 phys ica l prope2ties of t h e waste dj-scharged from t h e s e t t l i n g basin may be i n - f luenced by sedimenta<tion i n t h e bas in o r by heavy grow-khs of algae, both of which are cazpihle of c o x e n t r a t i n g r a d i o a c t i v i t y .
12, l..3> lb Process Waste Water Trea'ioei?t Plant --- Increases in t h e chem5cel p rocesshg operatfacs a?d ic, t h e i r m d i o a c t i v l t y
levels at ORNL dz r ing seve ra l recznt years increased the vo?_ume and a c t i v i t y l e v e l of' process waste water discharged t o the creek, as shosm i n Table I. On s e v e r a l occasions su-rveys revca.led 5ha.t t h e l e v e l of T a d i o a c t i v i t ~ t n t he CLinch River for s h o r t pe r iods exceeded t h e reconmended average c o x e a t r a t i o n l i m i t f o r un iden t i f i ed rad ionucl ides . -- These inciderrZs emphasized the need f o r a tseat- men% planr. t o reduce 1 , ' ~ l e v e l of r a d i o a c t i v i t y I n t h e process waste water. The 1.os.1 leve l r : of rad50ac4;ive d i s c h a r g e i l T 1957 and. 1958 ?emonatrate %hat t h e t reatmeai , plant oi;eratio,i plus monitoring ef Yorts w i t b i n the Laboratory have
1
beer? S U C C E : E ~ ~ ' U ~ .

-20-
p lan t s tud ie s ind ica ted that t h e process waste water treatment p lan t should be designed to use a hor izonta l flow, lime-soda wacer sof'tening process with pro- v is ion fo r d%ernat i .ve use o f phosphate coegulatioa t o e f f e c t strontium removal and the add i t ion of c lay t o increase t h e reaovai o f cesium.
The p lan t , completed i n August of 1957, is Located near t h e c e n t r a l m n i t o r i n g and d ivers ion s t a t i o n a t t h e o u t l e t of t h e process waste .water c o l l e c t i o n system (Fig. 1). It has a design capaci ty of 500,000 gal lons pe r day, and provis ion has been made fo r f u t u r e ex-pansior, t o doublo t h i s capacity. treatment of w a s t e , the plant i s designed t o give spcciaJ- treatment t o waste con- t a i n i n g abnormally high concentrat ions o f radioisotopes caused by accidental or emergency r e l eases .
I n add i t ion Lo the rout ine
Figure 6 i s a diagram of t h e f a c i l i t i e s fo r treatment and disposal of process waste water . When t h e inlet valving is operated manual ly, t h e plant; rece ives d 3 . process waste water flowing between 8:oo a a . and 8:oo p.m., the perlod when most of t h e contamina5ed discharges occur. of l a r g e volumes which might not need decm%minQ%ialis=nd 12) the pas' fb le bypassing of a c t i v e wastes at night . which, in response t o submerged Geiger-Mueller tubes, permits low level wastes t o bypass t h e p l an t but; d i v e r t s i n t o the equal iza t ion bas in a l l wastes whfch contain a greatey concentrat ion of r a d i o a c t i v i t y t h a n , ra predetermined amount . l 5 700,000-gal capaci ty equalization bas in serves t o minimize f luc tua t ions i n t h e composition of the p lan t i n f l u e n t and %o supply was% to the treatmen+, p l an t as needed.
This method results 19 (1) the treatment
?"herefore, an automatic d ivers ion valve was provided
The
Figure 7 i s a cu$-away view of the process waste water tretzbment; p l a n t . Uniform flow rate through the pZm% i s maintwiced by two 3ZO-gpm centrifugal pumps drawing from t h e equa l i za t ion basin.. Two g?a.aimetri.:: feeders apply slurries of lime and soda ash to the f l e s h m i x e r which has a detenzion time of 1.5 minutes. (A t h i r d feeder i s wallable f o ~ clay, trimdim phosphate, e t c , , as need5d. 1 The three coagulation bas ins i n series, providing 33 minutes of slow mixing, are followed by 2 hours s e t t l i n g i n a 12 x 70 x 8 fi; deep b a s k o The effluen% is discharged t o tkte cyeek, It can be recycled through t h e p l an t f o r add i t iona l t reatment , &-though t h i s has not yet been st%,emp:,ed t o date.
The sludge t h a t p rec ip i t a%es i n the s e t ~ l h g @inamber contsins the rad io- isotopes removed front the waste. A shudge scrqes; operating continuousky moves it along %he concrete bci;t,m of %be ser;%9Prig ehamber into hoppers a% %he deep end of the chambero V&ves pennit the sludge t o d ra in from the hoppers t o a 16,000 -gallon conmete tank. fcr short. -time stmage before d i sposa i e
t y y e pumps l i f t t h e sludge t o a parytly shielded tank t ruck , which t r a n s p o r t s it t o the d i sposa l p i c s fo r highly r ad ioac t ive chemical wastee2 A part of t h e sludge can be recycled through t h e treatment p l an t when +;his is des i r ab le .
TWO plunger -
The nzech8nica.l equipment; i s designed t o a l l o w maintenance without dra in ing the chambers, thus u t i l i z i n g the waste wcsker 3 s a sh ie ld Go p ro tec t personnel f r o m exposure 50 radialt ior, f r o m xhe rad ioac t ive sediments i n t h e chambers.
I3urin.g the f i r s t 11 montkis o f o p e m ~ i o i l 5 3 to 8 3 of the gross be t a a c t i v i t y was removed by a s ingle pass of t he waste thrcrugin the treat,ment process . removal of strontium-90, considered tc? be ?he r o s t hazardous component, ranged
The

-21 -
PUMPING STATION
I I
!
. .. /., - I\? L i J tN i . . -
MO'UIlGRlNG 2YI:ROL BUILDING I
ATION
I F2q;2 SLUDGE FiETIJRN
PROCESS-
STnTlON WlTd CONTINUOUS 1 PIIOPOHTIObIAL SAMPLER /
Fig. 6 . Flow Diagram of Process Waste System.

-22-

-23 -
from 66 t o 87% f o r monthly per iods and has been as high as 94s dur ing ope week. The t r i v a l e n t r a r e e a r t h elements were removed as e f f i c i e n t l y as the strontium; about 17 c u r i e s of strontium and 15 cu r i e s of t o t a l rare e a r t h s were removed from t h e process waste duriEg t h i s period. Cesium removal has been low because c lay has not been added t o t h e process on a continuous ba6is , but during one week 30 ppm of a l o c a l c lay increased cesium removal from 1.69 t o 55s. (A commercial SbWCe
of a similar c lay suitable for continuous use has been loca ted . ) The opera t ing experience t o da t e i n d i c a t e s t h a t t h i s f a c i l i t y w i l l fulfi l l t h e primary purpose of increas ing t h e s a f e t y f a c t o r i n cont ro l of rad ioac t ive waste re leased t o t h e Clinch River.
D. Wastes Discharged Di rec t ly t o Creeks
There a r e seve ra l comparatively minor sources of radfoac t ive waste not included i n the main ORNL liquid waste con t ro l systems l i s t e d i n Fig. 2 because of remote loca t ion or o the r conside-rations. most of which i s monitored before r e l e a s e from t h e source f a c i l i t y t o t h e nea res t creek. These sources are:
Normally these sources produce low a c t i v i t y w a s t e ,
The Low I n t e n s i t y T e s t Reactor (LITR)* Two r e t e n t i o n ponds ca tch the primary coolant (water) when t h e r eac to r i s drained or when it leaks coolant . from i r r a d i a t i o n experiments i n the r e a c t o r a l so i s discharged t o these ponds. of t h e r a d i o a c t i v i t y i s caused by sodium-24, which decays r ap id ly . p e r i o d i c a l l y drained t o a branch of White Oak Creek only seer t h e water radio- a c t i v i t y has decayed t o t h e ex ten t t h a t a s c i n t i l l a t i o n counter reads lower than 100 gross beta and @lamma counts per mlaute per m i l l i l i t e r . i t s higher a c t i v i t y waste t o a monitoring tank i n t he h ighly r ad ioac t ive chemical
Cooling water Most
The ponds a r e
The LITR can discharge
. waste system previously described.
The Oak R i Q e Research Reactor (OM). The LITR r e t e n t i o n ponds a lso ca tch ' '
r e a c t o r water drainage from the Efwarmff sump i n t h e ORR bui ld ing . wastes can be handled through t he same noni tor ing tank t h a t se rves -the LTTR.
Higher l e v e l
The Homogeneous Reactor T e s t (m) . The HRT f a c i l i t i e s are loca ted i n Meltoa Valley across a high r idge from the main X - 1 0 area (Fig. 5 ) . excavated i n Conasauga sha le near the r eac to r bu i ld ing rece ives r e a c t o r s torage- canal water and c e l l shiel t i water when these chambers are drained. The pond over- flows t o Melton Branch, a tribG-Lary of White Oak Creek (Fig. 1). The capac i ty of t h e pond equals the w t i r e volume of all the EFRX building cells, which m e f i l l e d with water t o s h i e l d personnel when r e p a i r s t o equipment i n the c e l l s are reqv.ired. The l e v e l of r a d i o a c t i v i t y i n the water should normally be qu i t e low. I n the event t h e a c t i v i t y level i s high enough t o make discharge t o the pond undesirable , t he water c m be drained t o a 12,000-gallon s t a i n l e s s s t e e l tank bur ied near t h e pond. Af te r concentrat ion by an evaporator t h e s waste c a ~ be hauled i n shielded c a r r i e r s t o the highly rad ioac t ive waste disposal p i t s previously descr ibed. evaporator e f f luent can be 1-ecycled o r discharged t o t h e pond.
A r e t e n t i o n pond,
The
The A i r c r a f t Reactor Test (ART), The ART f a c i l i t i e s axe loca ted away Proila the w i n ORNL area arid near ehe EF$-siite i n Melton Valley. are not now i n use, they can be use& f o r rad ioac t ive operat ions. Drains i n t h f r eac to r bu i ld ing l ead t o a swnp from which l o w l eve l waste cmi be pumped to a r e t e n t i o n pond. Thls pond i s excaveted i~ %he shale nesr Melton Branch aboiit 300 yards from the r eac to r biiildirig. t h e pond.
Although the f a c i l i t i e s
N o pmvl s ion has been made t o dra in o r to overflow
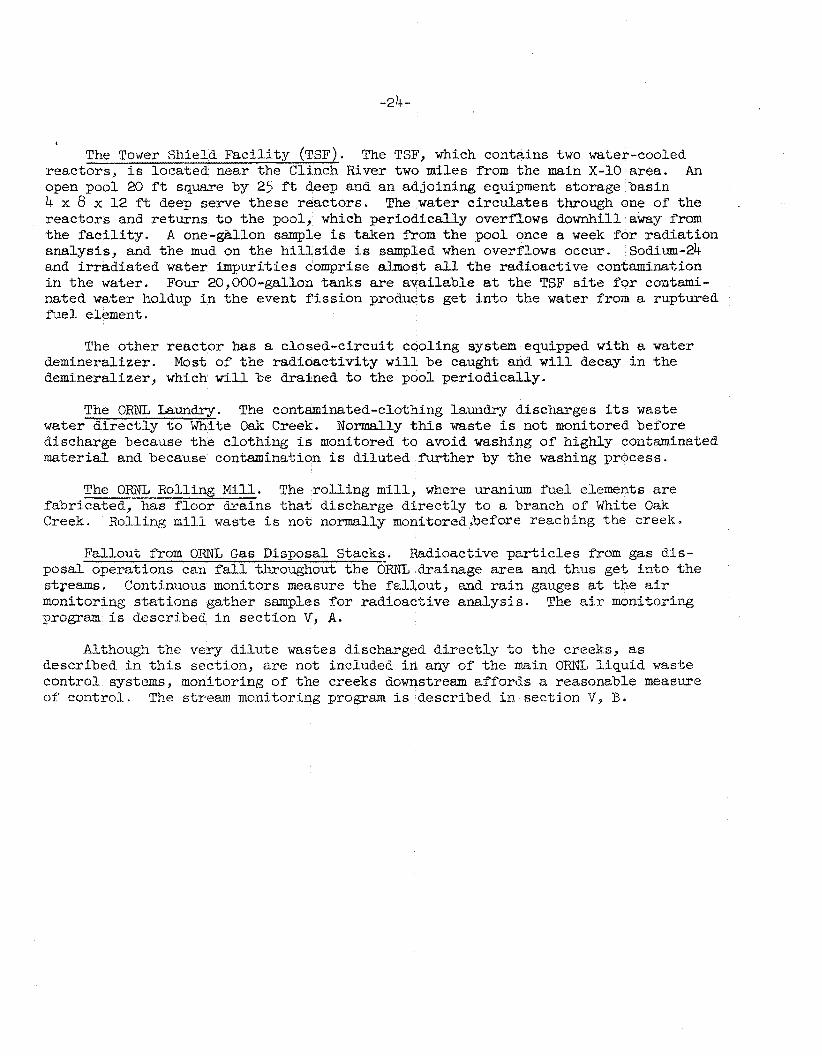
The Tower Shield Facility (TSF). The TSF, which contains two water-cooled reactors, is located near the Clinch River two miles from the main X-10 area. An open pool 20 ft square by 25 ft deep and an adjoining equipment storage basin 4 x 8 x 12 ft deep serve these reactors. The water circulates through one of the reactors and returns to the pool, which periodically overflows downhill away from t h e facility. A one-@ion sample is taken from the pool once a week for radiation analysis, and the mud on the hillside is sampled when overflows occur. Sodium-24 and irradiated water impurities camprise almost a , l l the radioactive contaminst,ion in the water. nated water holdup in the event fission products get i n to the water f r o m a ruptured fuel element.
Four 20,000-gallon tanks are avai1EtbI.e at the TSF site for cor&&-
The other reactor has a closed-circuit cooling system equipped with a water demineralizer. demineralizer, which will be drained to the pool periodically.
Most of the radioactivity will be caught and will decay in the
The ORNL Laundry. The contaminated-clothing laundry discharges its waste water directly to White O a k Creek. Normally this waste is not monitored before discharge because the clothing is monitored t o avoid washing of highly contm-inated material and because contamination is diluted m t h e r by the washing process.
The ORNL Rolling Mill. The rolling mill, where uranium fuel elements are fabricated, has floor drains that discharge directly to a branch of White O a k Creek. Rolling mili waste is not normally mon.itored,hefWe reaching t h e creek*
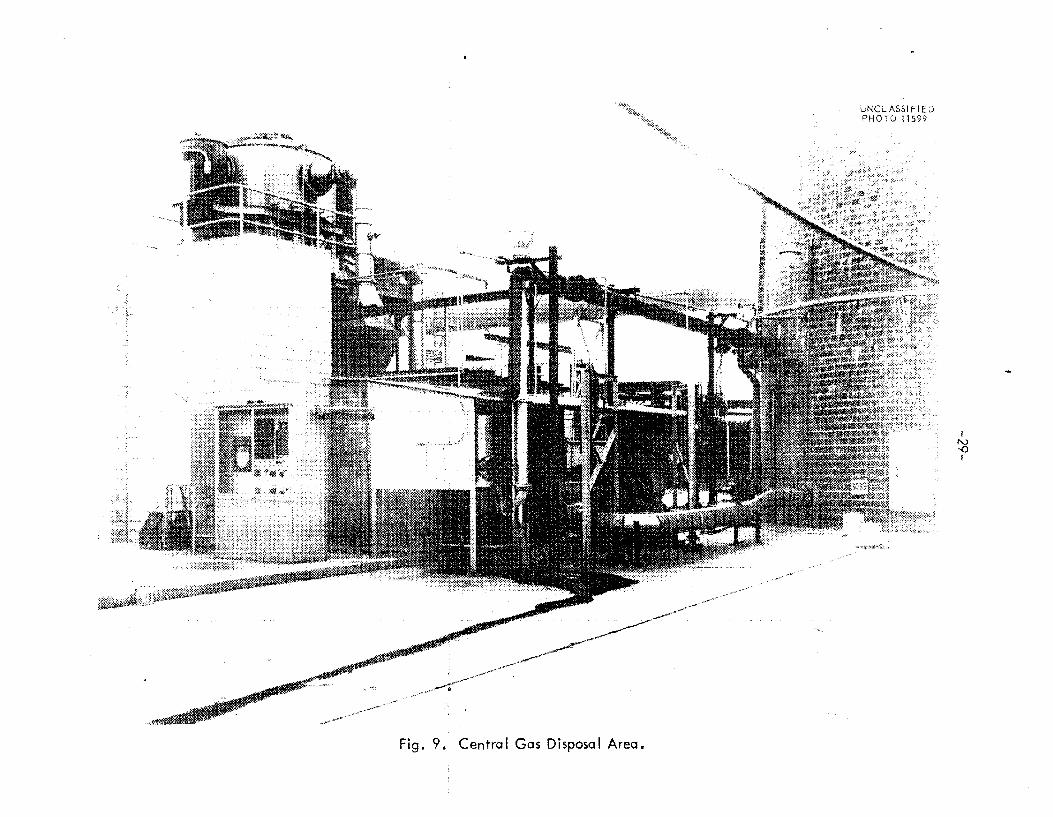
Fallout from O-TWL Gas Disposal Stacks. Radioactive particles f r o m gas &Is- posal operations can fall throughout the ORNL drainage area and thus get into the streams. Continuous monitors measure the fallout, aad rain gauges at the air monitoring stations gather samples for radioactive analysis. program is described in section V, A.
The air monitoring
Although the very dilute wastes discharged directly %o the creeks, as described in this section, are not included in any of the main ORlvz liquid waste control systems, monitoring of the creeks downstream affords 8 reasonable measure of control. The stream monitoring propam is described in section V, B.
-25-
111. Current Handling and Disposal Methods f o r Gaseous Wastes
Air contaminated with radioisotopes cons t i t u t e s t h e g rea t e s t volume of rad ioac t ive waste but n o t necessar i ly t h e g r e a t e s t hazard created by t h e operation of nuclear reac tors and associated chemical processes and labora tor ies . Basically, t h e r e a r e th ree general types of air..borne contaminants. The nature of t he hazard involved and the technology required f o r i t s elimination d i f f e r f o r each type:
1. Radioactive noble gases, xenon, krypton, e t c . , which a r e chemically i n e r t , do not cons t i t u t e a ser ious hazard a t ORNL ana are cont ro l led by re leas ing t h e contaminated a i r from ta l l s tacks f o r d i l u t i o n by the atmosphere. (400 cur ies per b y of argon-41 are discharged) .
P . Chemically reac t ive gases, such as 12, are cont ro l led by adsorption equipment (usua l ly caus t i c scrubbers ) loca ted i n t h e process areas.
3. Radioactive s o l i d and l i q u i d p a r t i c l e s suspended i n air are cont ro l led e f f e c t i v e l y by f i l t e r s and e l e c t r o s t a t i c p r e c i p i t a t o r s .
AL1 a i r t h a t has a p o s s i b i l i t y of becoming contaminated i s exhausted t o t he atmosphere from th ree tall stacks f o r d i spersa l . Standards f o r s a f e discharge a r e s e t and released waste gases a r e monitored by t h e OWL Health Physics Division The a i r passing through t h e s tacks i s continuously sampled and analyzed, and t h e f a l l o u t i s continuously checked a t 1.7 loca t ions within seven miles of the Labora- to ry . One s t a t i o n (Berea, Kentucky) i s about 120 miles away. The volumes of a i r and t h e i r flow p a t t e r n s through the bui ldings are cont ro l led t o minimize t h e amount t h a t has a p o s s i b i l i t y of becoming contaminated. q u a n t i t i e s of a i r surrounding process equipment i s avoided by designing t h e equipment t o be air-bight and by operating a l l process under a negative pressure. The air-borne r ad ioac t iv i ty relehsed during processing i s thus caught i n a r e l a t i v e l y small amount of air, ca l l ed "vessel off-gas", which i s t r e a t e d before r e l ease . ven t i l a t ion gas," thus has a s m a l l p o s s i b i l i t y of becoming contaminated and is handled on a d i f f e r e n t basis from the vesse l off-gas. These methods o f handling t h e la rge quan t i t i e s of a i r passing through the Laboratory f a c i l i t i e s sharply reduces t h e amount of' a i r requir ing t reatment before discharge.
Contamination of l a rge
The a i r surrounding t h e vesse l i n concrete ce l l s , designated " c e l l
The types of a i r handled a t ORNL and whether or not each i s treated before discharge can be b r i e f l y summarized as follows:
Office Vent i la t ion: S ix changes o f a i r pe r hour, without treatment;
Laboratory Vent i la t ion: Minimum of ten changes of a i r pe r hour, without t reatment ;
Laboratory Hood. Vent i la t ion : M i n i m u m of 50 f e e t pe r minute face ve loc i ty f o r adequately designed hoods, w i t h provis ions f o r the i n s t a l l a t i o n of a f i l t e r i n t h e discharge duc-'; when necessary. I n addition, each hood is ec-juipped with t w o vacuum systems, ' ~ 1 - l ~ - f i r s t system w - i t h 10 inches of water vticuwn t o draw gases from vessels ?ont,ai ning high l e v e l s of r ad ioac t iv i ty and t h e second system with 70 inches el' rnerctzry vacuum to be used for so lu t ion t ,ransfers and o the r

-26-
high vacuum 3ppl icat ions. The a i r from both these vacuum systems i s co l lec ted and t r e a t e d as vessel off-gas before being discharged t o t h e atmosphere.
Ce l l Vent i la t ion : M i n i m u m possible air flow; each c e l l i s he ld a t a reduced pressure (up t o 1 i n , of water vacuum) so t h a t a i r leakage w i l l Se inward. The a i r drawn from c e l l s where the re i s a high r i s k of i t s becoming contaminated (usua l ly c e l l s containing p i l o t p l a n t o r experimental equipment) i s f i l t e r e d . A l l c e l l ven t i l a t ion a i r i s discharged from t h e tall s tacks f o r d i spe r sa l t o t h e atmosphere.
Vessel Off-gas: Minimum poss ib l e a i r flow i n a system with a vacuum o€ 40 inches of water for d i s so lve r and process vesse l off-gas l i n e s . t h i s vacuum system i s t r e a t e d before discharge.
The a i r from
Reactor Cooling Air: All a i r used i n cooling a r eac to r i s f i l t e r e d .
A i r Cleaning F a c i l i t i e s
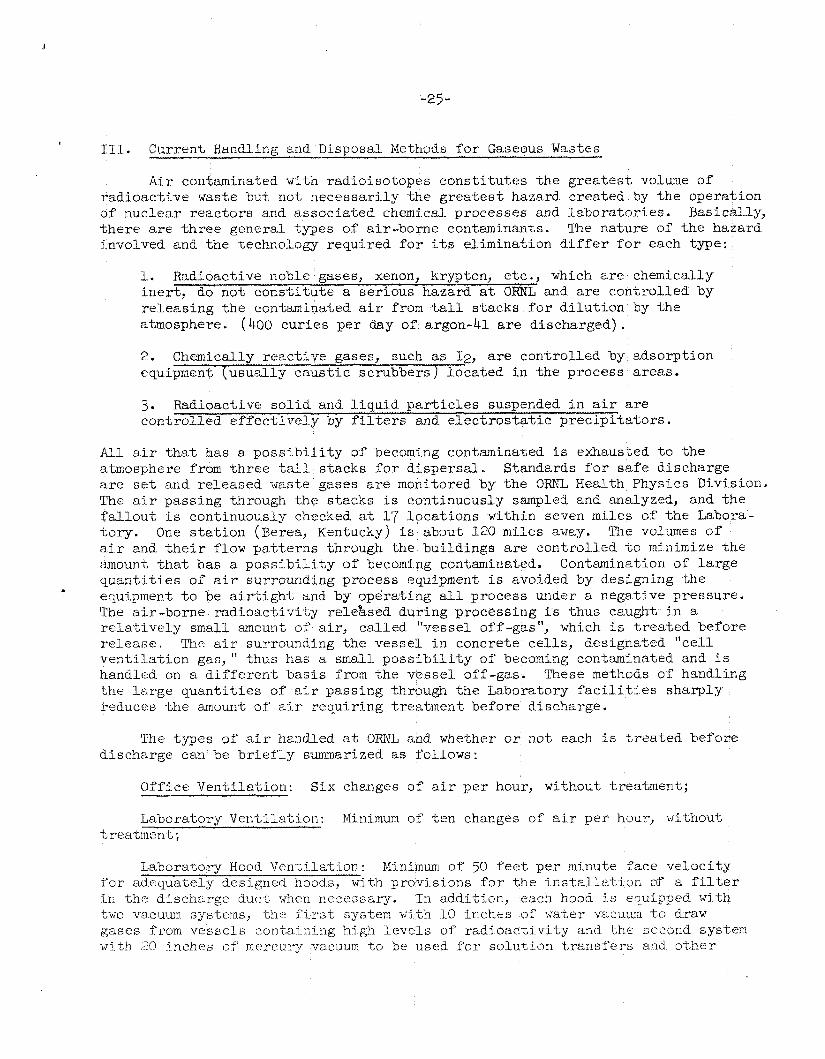
A c e n t r a l gas d isposa l f a c i l i t y has been es tab l i shed a-t O a k Ridge National Laboratory t o clean t h e rad ioac t ive contaminated a i r from t h e chemical processing a reas and t o dispose of it t o the atmosphere.
Vessel Off-gas F a c i l i t i e s ; Stream No. 7 (Fig. 2): The a i r from t h e vessel off-gas system i s moved by high speed s ta inless s t e e l exhausters through staiiiless s t e e l ducts and co l l ec t ed a t t h e c e n t r a l gas d isposa l f a c i l i t y . Reactive gases, such as Fodine, are removed by caus t i c scrubbers i n t h e processing bui ldings before t h e a i r en te r s t h e ducts. e l e c t r o s t a t i c p r e c i p i t a t o r followed by a f i l -cer i d e n t i c a l i n performance with those dgscribed below f o r t h e Graphite Reactor. This system has a capaci ty of 2000 cubic fee t of a i r p e r minute and c o l l e c t s gas from a l l radioisotope production vessels, off-gas from hoods, and ven t i l a t ion a i r from dry boxes. The cleaned a i r i s d i s - charged t o t h e atmosphere through a 250 f t stack. A proposed cleaning system t o handle an expected increase of 4000 cubic f e e t p e r minute of contaminated a i r i s in a prel iminary design stage. This new system w i l l handle highly rad ioac t ive gases from t h e O a k Ridge Research Reactor ( O R R ) experiments as well as from f u t u r e expansions of t he chemical processing Hot P i l o t P l a n t . A caus t i c scrubber plus high e f f i c i ency f i l t e r s w i l l probably be t h e cleaning equipment used.
The a i r i s cleaned by passing it through a C o t t r e l l
. -- .- 0 -
The C o t t r e l l p r e c i p i t a t o r i s of t h e exposed-”;be type, containing twenty- t h r e e 8 - i n . -di& tubes 12 f t i n length, fabricate?. of No. 111 gauge s t a i n l e s s s t e e l . Those p a r t s of t h e p r e c i p i t a t o r t h e t come i n contact with corrosive gases t o be cleaned a r e constructed of type 347 s t a i n l e s s s t e e l . sys ten i s s t a i n l e s s s teel wire Longitudinally centered through each co l l ec t ing e lec t rode , suspended from porce la in in su la to r s and held t a u t by porce la in weights at t h e bottom.
The discharge e lec t rode
The p r e c i p i t a t o r i s equipped with a continuous water-flush system. Nozzles Ia-e provided at t h e top o f each tube i n such a. manner t h a t a continuous film of water is mai.ntai.ned on the inner surface of t h e i;u.be. In add i t ion , a water- s p m y system i s loca ted a-t t he extreme top t o f a c i l i t a t e washdowns. The w a t e r lis collecked i n ii catch tank and rec i rcu la ted t o -i;he p r e c i p i t a t o r , When t h e a c t i v i t y l e v e l or tlne ac id content ( N O and Nk+ art? :pre:;e!it, i n t h e f-gas ) becomes high,

t he water i s discharged to a monitoring Lank i n =he highly radioact ive l i q u i d chemical waste system.
0 Tht p r e c i p i t a t o r i s designed t o apera+,e at a maximum temperature of 200 F
?ad a negative p re s sc re of 60 iriches water a t a flow of 2000 cubic f e e t p e r 1.1 , n u t e m The water flush sys ;em operak ; a,, 3 $9 6 gal lons p e r minute pe r tube.
The e l e c t r i c a l design voltage i; :51,000 vo l t s , 25 kilovolt-amperes and operates on l cb -vo l t s 3-pk:ase ~ O - C Y C ~ ~ czlrren-5 to t h e power pack, p r a c t i c e the p r e c i p i t a t o r operates on 52,OOG ~ 0 1 % ~ and a eurren'; of 1-30 r r i i l l i -
amperes e
I n a c t u a l
F i l t e r e d Ce l l Ven-LiLation F a c i l i t i e s ; Stream No. 6 (Fig. 2): Vent i la t ion a i r from radiochemical processing a reas i s co1lezt;ed at t h e centxal gas d isposa l f a c i l i % y through steel and concrete dvlcts, by high capacity, l ow vacrm exhaus$ers, cons i s t s of a bank of F iberg las f i l t e r s backed by high e f f i c i ency paper f i l t e r s and i s e s s e n t i a l l y a miniature of the Graphite Reac%or f i l t e r house described below. An add i t iona l f i l t e r bank, similar i n f i l t e r i n g d e t a i l , has j u s t been con- s t r u c t e d i n another a rea %o f i l t e r c e l l a i r from t h e Hot P i l o t P l a n t . All c e l l v e n t i l a t i o n a i r i s dispersed by a 2@0-ft-s%acko
The a i r i s moved through t h e duets The c e l l v e n t i l a t i o n cleaning f a c i l i t y
Unf i l te red Cel l and Bsou Vensila-:ion F a c i l i t i e s ; Stream --- No. 6 (Fig. 2): A system of s t e e l and concrete &uc:ts collec+> ven';ilaticn a i r from labora tory hoods and experimental cells i n which t he p a s s i b i l i t y of a i r contamination i s s l i g h t . This air i s dispersed t9 -,he atmospherr via a 20C:-~cot s tack without prel iminary cleaning. High capacity, l o w vacz1.m e,uhaGsters move the a i r -through t h e ducts.
---__y
Figure 8 is- a photograph of t he cen'i,ral gas rliapcsal! area. To %he r i g h t behind t h e concrete bar r icade i s %he €il-';er br-znk fcr the c e l l ven5i la t ion system. Ln t h e l e f t foreground a r e 'he main exham? fans , Figure 9 i s a pho5ograph of t h e smie area showing the ';op of the Co , s re l l precipitator and the stainless s t ee l discharge l i n e -Lo tho s-zack. Figure 10 i s a photograph of the p r e c i p i t a t o r dGring construct ion,
I n addi t ion t o t h e main central ?a: L l i ' , y 7 several small a i r - c l ean ing f i l t e r s zrt? loca ted a t isolated- experimental. raaiocherni2al. i n s k l l a t i o n s . Except f o r one u n i t i n which a graded f i l k r - f i b e r x~i'b dcve1opP.d a* Hanfcrc; i s used, t,hese a r e minature r e p l i c a s of the Graphite Rears-hr f i l -ke r i n s t a l l a t i o n (J
ORNL Graphite Reac:;ar Cooling Air; Stream No. 5 (F ig . 2): For cleaning t h e coo l ing a i r from t h e nircclear rea;:tor, considerat ion 7rlas given to s e v e r d methods i 11 cl11.d.i n g cy cl on e s ep arato r s and e l e c -t ro s-t a,<-, i. r, p r e c ip it at,o r s ,(
se l ec t ed as the method 'GO be :is.zd after ext;e-c.siirc? li.!;er.a*,ure research and con- s u i t a t i o n with s p e c i a l i s t s i n atr c lean ing pro1,ler;;s > Tie short;-lived rad ioac t ive gsses a r e not, removed from 'the air tiefoi-e dLsi:h.urge -to %??E atmosphere, The f i l t e r housci F G a l a rge reinforced concrek. st>?,i.ci-crc? ctompcsed of foiir i d e n t i c a l cells, t~zc'n. (:onta.lcing a roughing f i14x :c anii EL p' s h i q f'L.t;ero The a i r from the
3omwzrd. through the roughifig f.Yj.+ier, then hor izonta l ly i,hrol;ytl -2,hti p o ~ ~ i . s l i f ~ n g fi.?L-;e~+ i n t o the e x i t 3ir duct . 1r70 -IXLS, o p e r a t i n g i n p a r a l l e l a5 a. nega s:siA.t*e 01' 50 -in water gauge
_u--
Fi 15rat i on w a s
,rL,
60, 090 ~ . ; ' ~ l i c fee-? pyr. 1n j .m a i r ':,o a %OO --f~, s k c k . The expected

UNCLASSI F !E 0 PHOTO 11600
I h) CD
I
Fig. 8. Central Gas Disposal Area.

-30-
Fig. 10. central Gas Disposal Area.

dust, l o a d w a s less than 900 grams p e r day of p a r t i c l e with a m a x i m u m diameter of 600 mii'rons, a l a r g e numbel. of them being i n t he submicron range. designed e f f i c i ency of t h i s house exceeded ';PJ.9 p e r cent for p a r t i c l e s down t o 0.3 micron i n s i z e .
The
The roughin6 - 1 - J L L ildard cornrnerci - I_ C ~ L ~ I -:)oc!-c-'c i'Lltc.cs7 each pocket containinL two layers of' 1 /2- in . - thick graded submicron g l a s s fj bers packed t o a denvi ty of 0.6 pound p e r cubic f o o t . e f f i c i ency paper u n i t s developed f o r the AEC. removd ef f ic iency of 9ga5$ a t 0.3 micron p a r t i c l e size.
The pol i sh ing f i l t e r s a r e high These f i l t e r s have a p a r t i c l e
All access t o t h e f i l t e r s i s through removable roof slabs which provide a method f o r remote maintenance. A canal l oca t ed acro$s t h e f r o n t of t h e f i l t e r house provides 2 receptac le f o r t h e dust-laden f i l t e r s when the f i l t e r medium i s being renewed. Precautions a r e t a k e n t o seal d l fi l ters in place i n s t r u c t u r a l s t e e l frames t o ensure aga ins t leaks and bypassing of t h e f i l t e rs .
Maintenance of t h e f i l t e r house i s p r a c t i c a l l y nonexistent except for per iod ic renewal of t h e f i l t e r media, The average l i f e of the r o u a i n g f i l t e r s is t w o years and of the pol i sh ing f i l t e r s t w o and one-half years . The roughing f i l t e r s are changed, one c e l l a t a time, a t approximately six-nonth i n t e r v a l s when t h e pressure drop across t he f i l t e r house approaches or exceeds 8 inches water gauge. a r e washed down, removed, and s to red i n t h e canal. The f i l t e r media are removed from t h e pockets arid buried i n t h e so l id waste d isposa l area, and t h e pockets are reloaded for t h e nex t change.
The f i l t e r s
The po l i sh ing f i l t e r s are all changed a t the same t i m e when t h e pressure drop across them approaches 5 inches water gauge. t h e f i l t e r s axe,sprayed with s t r i p coat ing before they are remqed from t h e bui ld ing f o r bu r i a l .
To confine t h e dust, both s ides of
-
Homogeneous Reactor T e s t (HRT) Reactor OOrf-gas? The off-gas from t h e HRT is z 1/2 l i t e r p e r minute stream of owgen sa tu ra t ed with water vapor and containing s m a l l q u a n t i t i e s of xenon and k w t o n isotopes. cool ing t h e gas t o -30°F. on e bed of ac t iva t ed carbon u n t i l t hey have decayed t o a very low a c t i v i t y l e v e l . The oxygen c a r r i e r gas i s discharged t o t h e stack.
?"ne water vapor i s removed by The xenon and krypton i so topes a r e adsorbed and he ld
Four carbon beds a r e i n s t a l l e d i n p a r a l l e l a t t he HRT. Only two of these beds are expected t o be used a t any given time; one bed i s a spare and tk four th bed serves t h e processing p l an t . of 1 - i n . pipe, 40 f t of 2- in , pipe, and 60 ft of G-in, pipe. bed a r e f i l l e d with about 410 pounds of ac t iva t ed charcoal- p e l l e t s . submerged i n water ( f o r cool ing) i n a n underground pit,
Each bed cons i s t s of 40 f t of 1/2-in. pipe, 40 ft The pipes f o r each
The beds are
The off-gas from t h e r eac to r passes first through cold t r a p s which f r eeze o u t l,he ~ X C C S S wzter vapor. The dry gas then passes through a long, empty t h r e e - i n c h pipe. The transit time through t h i s p ipe i s iLbout hr, long enough f o r t h e :nost act ivt . isotopes to decay. The gas then g(je6 to t he carbon beds where t h e xenon and k r n t o m are adsorbed on t h e carbon srid held long enough (about 13 days f o r tn+> k r y p t o n and 210 days f o r t he xenon) f o r :ill but t h e kxypton-85 activity

- 32-
t6 decay away. 'The a c t i v i t y discharged t o t h e stack i s expected t o be about 6 cur ies per day of krypton-85.
Oak Ridge Research Reactor (ORR) Off-gas: Off-gas from experiments connected ~ L t l i t h e OZiR i s discharged i n t o t h e Laboratory vessel off-gas system, vhere it is
cleaned ?%?fore discharge t u t he atmosphere. This cleaning system has been described ibove . -
The ORB building i s equipped with a spec ia l a i r removal system f o r use i n the event a catastrophe r e s u l t s i n a re lease of f i s s i o n products within t h e building. On ac t iva t ion by a monitoring system located within t h e ORR building, a l l doors, viiidows, etc., a r e closed; t h e normal bu i ld ing ven t i l a t ion system i s shut down; and a 5OOO cfm emergency exhaust system i s s t a r t ed . This emergency exhaust system i s designed t o maintain t h e ORR bui ld ing under a negative pressure of 0.3 i n . of water as long as required. a i r through the bui ld ing w a l l s w i l l be inward and w i l l be exhausted under control led conditions for cleaning prior t o atmospheric discharge via a 25O-f t stack located a t t h e c e n t r a l gas d isposa l area. Cleaning of t h e exhaust a i r i s accomplished by f i l t r a t i o n f o r p a r t i c l e removal and scrubbing with caus t i c so lu t ion i n a packed t o w e r f o r iodine removal. Upon ac t iva t ion of t h e exhaust system, the caus t i c scrubbing system i s s t a r t e d automatically.
This negative pressure ensures t h a t all Leakage of

-33-
TV. Current Hanlding and Dispostil Methods f o r So l id Wastes-; Stream No. 4 (Fig. -2)LLD
Oak Ridge National Laboratory not only produces quan t i t i e s of radioact ive s o l i d wastes but &so serves as t h e maJor d isposa l s i t e f o r such wastes from Argonne National Laboratory, K n o l l s Atomic Power Laboratory, Mound Laboratories, B a t t e l l e Memorial I n s t i t u t e , General E l e c t r i c Company i n Evansdale, Ohio, and o the r o f f - s i t e i n s t a l l a t i o n s . Radioactive s o l i d wastes from these sources occupy approximately h a l f t h e b u r i a l ground space-cur ren t ly being used a t OFWL.
Nearly all t he s o l i d wastes rout ine ly produced a t ORNL cons is t of t r a s h such as paper towels, glassware and o ther expendable i t e m s contaminated w i t h radioact ive mater ia l s . Occasionally contaminated concrete and wood and l a rge pieces of equip- ment tha t cannot be economically salvaged by decontamination methods must be buried. contain minor quan t i t i e s of rad ioac t iv i ty , probably about 1$ of t h e t o t a l disposed o f by t h e Laboratory. Accurate de te rmina t ion of t h e cu r i e s handled i s impossible, because t h e wastes a r e a nonuniform mixture of many kinds o f materials.
Compared t o t h e l i q u i d wastes previously described, t h e s o l i d wastes usua l ly
I n co l l ec t ing contaminated s o l i d wastes t h e prime considerat ions a r e personnel s a f e t y and preventing t h e spread of contamination. Ordinary galvanized garbage cans are used in s ide bui ldings as s o l i d waste co l l ec to r s , These "hot cans" a r e painted 5 d i s t i n c t i v e yellow color and marked with a rad ia t ion symbol to d is t inguish them from waste cans used f o r uncontaminated t r a sh . Hot cans a r e le&-proof and f i t t e d with s u i t a b l e covers t o prevent t h e spread of contamination during handling. Frequent rout ine monitoring of t h e w a s t e can areas i s conducted t o be sure that, accumulation of materials does not produce rad ia t ion l e v e l s t h a t will be hazardous. . Specia l leak-proof Dempster Dumpsters are used t o c o l l e c t l a r g e r volume wastes. Placed a t convenient l oca t ions outs ide c e r t a i n bui ldings these a r e also dis t inc t l ive ly marked f o r contaminated t r a s h co l l ec t ion only.
Personnel who handle radioact ive s o l i d wastes a r e provided with proktective clothing--cover-alls , shoes o r boots and c lo th o r rubber covered gloves--to prevent contamination o f personal c lo th ing and body pa r t s . Exposure above p re - sc r ibed l i m i t s r equi res assignment t o o ther work u n t i l t h e weekly average exposure falls below maximum peimissible l i m i t s . -?here ari i n h e l a t i o n hazard ex is t s , personnel are provided with f i l t e r - t y p e Assault Masks, A rad ia t ion survey i s made before moving mater ia l s t o determine the rad ia t ion l e v e l s present and to e s t a b l i s h working t i m e f o r prevention of personnel exposure i n excess of maximum permissible l i m i t s . Where rad ia t ion levels are sGf f i c i en t ly high t o preclude handling the mater ia l s manually, remote handling by cranes o r behind sh ie lds i s prac t iced . An example of t h i s type h2ndling i s t h e removal of "hot" d i r t r e s u l t - ing from a l i q u i d waste spill o r break i n E Liquid waste l i n e t o t h e tank farm. A l l personnel are monitored with f i lm badges and dosimeters t o measure t h e i r rad ia t ion exposure.
Handling of wastes froiri nutside ageneics p m s e n t s a number of problems and requires t h e use of a var ied number. md -iype of' persountl. A t one time the ~ u t s i d e agencies were riot required Lo I d i A n i , i fy thc composition o f mater ia l s shipped to ORNP, as waste. However, afte:- awerii l inc idents i n handling urikriown hazardous chemicals, t he shippers have beet required t o descr ibe % h e i r s o l i d wastes i n wr i t ing before they arc acc-pred. Kateri:;l s shipped by c c m e r c i d

-34-
c a r r i e r m u s t be packaged i n such a way that they can be e a s i l y h a n a e d and so shielded that they vi11 meet U. S. In te rs ta te Commerce Commission regulat ions f o r shlpment of rad ioac t ive materials. Wastes shipped i n s m a l l l o t s by t ruck nay require only one o r two laborers t o unload -the materials a n d a hea l th phys i c i s t t o monitor t h e operation. t ruck i n t o t h e b u r i a l p i t .
These wastes are dumped d i r e c t l y from t h e
Large shipments which a r r i v e by rail are surveyed t o d e t e r m i n e the rad ia t ion levels involved before unloading and t r a n s f e r t o t h e b u r i a l groxnd. conkainers are found, necessary precautions must be taken t o prevent t he spread of contamination during unloading and t r a n s i t t o t h e burial si te.
If broken
After completion of t h e b u r i a l operation, men, equipment and vehicles are checked and decontaminated as necessary, and replacing sec t ions of t h e Eloor o r o ther p a r t s of a Vehicle. Vehicles cannot be released t o a publ ic c a r r i e r f o r commercial t r anspor t of o ther mater ia l s u n t i l s a t i s f a c t o r i l y decontaminaCed.
This nay even necess i t a t e t e a r i n g out
Waste so l id s a t ORNL are noxmaJly transported t o t h e b u r i a l s i%e by a grcup o f spec ia l t rucks used only f o r t h i s purpose, These t m c k s a r e d i s t i n c t i v e l y marked and f i t t e d with leak-proof beds t o prevent t h e spread of contamination during transit. t o provide pro%ection f e r t h e crew aga ins t d i r e c t rad ia t ion , loading of t h e mater ia l s a r e monitored by H e a l t h Physics personnel and the crew i s advised as t o t h e rad ia t ion l e v e l s involved and the maximum t r a n s i t t i m e allowable to prevent, undse exposure.
A l e a d s h i e l d is placed between t h e can a d t h e bed of t h e t m c k The pickup and
Espec ia l ly ho-t; o m a t e r i d s require spec ia l precautions. This may consis k only of the addi t ion of more sh ie ld ing -tu0 t he “hot” truck, but i n some cases a crane I s used t o reduce %he radiat;ion hazard to t h e transport crew.
Radioactive s o l i d wastes a r e cu r ren t ly buried i n a Conaszmga sha le fonnatior? i n the waste d isposa l a rea of Melton Valley near t h e h ighly a c t i v e l i q u i d chemical waste disposal pits (Fig. 5 ) . Where weathered, t he shale i s soft and lends f‘c- s e l f to easy excavation with power shovels or similar equiprncnt. b u r i a l s i t e i s s”,af‘fed during the work day with only a heavy equipment opera%or who d igs and b a c k f i l l s t h e burial p i t s .
Moraally -the
Alpha : ~ ~ - - t a a i n a t e d wastes and. beta-gamma contamina’ced wastes a r e handle?. and buried separa te ly , mately 15 by 15 feet deep. by about a foot of earth. t h e ea r th i n t h e hole. The concrete i s followed by an addi5ional t w o or more f e e t o f e a r t h t o f i l l -‘;he hole to surface level. The use Qf concrete i s a p re - caution to prevent anyone from inadver ten t ly digging i n t o the long-lived p1uf;onimn.- contamina-ten alpha w a s t e s at some fu tu re da te e
Alpha contaminated wastes are buried i n holes approxi- The waste mater ia l s are placed i n t h e hole and covered
inches of concl-ete i s -iAen pou.red over Approximately 8
Was.te materials con’;:uniziat,ed by ‘ b e t a -gamma activit ,y from fission pro&dc%s a r e buried in -trenches approximately 10 f e e t xide by 1s; fee% deep, Iwhi-ch a re dug c o r q l e t e l y a c m n s t h e % u r i a l s i t e . Beginning at one end -the wasi,es a r e d:unped into t h e %rench. When t h e S:irs+; p o r a o n of the t rench i s filled, %he wastes are

-35-
covered by three or more feet of ea r th depending on the a c t i v i t y of t h e wzstes. This dumping and back- f i l l i ng procedure continues toward t h e o ther end of t h e t rench u n t i l it is completely f i l l e d .
I n spec ia l cases where very s m a l l , extremely ac t ive w a s t e mater ia l s m u s t be disposed of , auger holes approximately 1 foot i n diameter and 1-5 f e e t deep a r e d r i l l e d i n t he b u r i a l s i t e and t h e materials dropped i n t o t h e hole. This pro- cedure i s used pr imar i ly to l i m i t t he rad ia t ion exposure t o personnel during %he back- f i l l i ng operat ion*
The b u r i a l s i $ e i s l a i d off i n g r i d sec t ions t o f a c i l i t a t e e f f i c i e n t use cf t h e e n t i r e area. Records a r e kept of t he type and quankity of mater ia l s buried, a n d t h e i r l oca t ions are marked on t h e p l o t map.
L i t t l e information i s ava i lab le r e l a t i v e t o t h e contamination of ground wa-ber by leaching o r o the r means. However, t h e loca t ion of t h e s i t e i s such that, the d i r ec t ion of ground water flow i s toward White O a k Creek and the Clinch River i n t o which low-level l i q u i d wastes have keen released almost s ince the beginning of t h e p ro jec t . The b u r i a l s i t e i s completely fenced t o prevent unauthorized en t ry and marked With rad ia t ion s igns to warn personnel of t h e p o t e n t i a l hazard.
Burial has been used a t O a k Ridge National Laboratory as a means of disposal f o r s o l i d . wastes s ince the beginning o f operations. To da te four b u r i a l s i tes have been used. The e a r l i e r burial. s i tes w e r e r e l a t i v e l y small and located with- o u t b e n e f l t o f geological exploration. I n two cases surface erosion yas a problem, s ince t h e s i tes were loca ted on t h e s ide of a h i l l , A5 each s i t e w a s f i l l e d , it was abandoned. The s i t e used p r i o r t o t h e present area w a s %he l a r g e s t of -:he e a r l i e r s i t e s , comprising approxirnsllely 7 acres , It w a s used f o r a l i t t l e over 5 years berore being f i l l e d a t an average a n n u d b u r i a l ra%e of 1-1/2 acres. curren t b u r i a l r a t e i s of the order of 5 acres p e r year. This is &I increase i n t h e r a t e of b u r i a l s i t e consump5ion by a f a c t o r o f 3 i n t h e last Sell years , The increase may be a t t r i b u t e d pr imar i ly t o t h e increased xse of ORNL b w i a i f a c i l i t i e s by outs ide agencies f o r the disposal o f %hei r s o l i d w a s - k s . A t present, there a re 25 o r more outside agencies using these f a c i l i t i e s . The present b u r i a l s i t e is' a r e l a t i v e l y f l a t , c leared area 01' approximately 30 acres, l and adjacent t h a t can be used for expansion i n fu tu re years.
. The
add i t iona l wooded wi?z

-36-
V : Surveys and Studies of Waste Disposal Effect iveness
The r e l ease of waste materials, e i t h e r gaseous or l i qu id , t o t h e environment places c e r t a i n r e s p o n s i b i l i t i e s upon the r e l eas ing agency e The r e l eas ing agency must safeguard t h e h e a l t h and well-being of i t s employees; it must pro tec t t he publ ic hea l th and property i n both the immediate and long-term aspects ; and f i n a l l y , it must assume r e s p o n s i b i l i t y t o i t s own management with regard t o legal implicat ions assoc ia ted w i t h waste r e l e a s e s e I n order t o discharge such respons%- 'o i l i t i es , t h e Laboratory must necessar i ly c o n t r o l and evaluate i t s waste releases The O R E Health Physics Divis ion performs t h i s du ty by maintaining, wi th in pre- scr ibed l i m i t s , concentrat ions of rad ioac t lve wastes re leased by t h e Laboratory and by monitoring t h e surrounding area t o prevent hazardous condi t ions t h a t might arise from accumulations or reconcentrat ions of rad ioac t ive material. Several systems are employed t o monitor for air-borne contamination and water eontamiastkono
A. Monitoring for Air-borne C.ontamination
Atmospheric contamination and fa l l -cut i n t h e genera l environmenk .me moni- to red by t h e fol lowing methods:: monitored continuously f o r t h e purpose of prevent ing excessive discharges of radio- a c t i v i t y t o t h e atmosphere f o r extended periods; (2) samples are co l l ec t ed a t a number of s t a t i o n s by passing air continuously through f i l t e r paper from which air contamination may be evaluated; (3) f a l l - o u t i s monitored b y means of g u m paper f a l l - o u t t r a y s located a t a l l sampling s t a t i o n s ; (4 ) background measurements are made a t many loca t ions t o determine the gradual increase i n background r a d i a t i o n and t o de t ec t d a i l y f luc tua t ions i n background, In additbon, fall-o9.t is monitored by c o l l e c t i n g r a i n water samples.
(1) t h e three off-gas s t acks i n the. X - 1 0 mea are
Each air sampling method y ie lds s l i g h t l y d i f f e r e n t information re la t ive t o the nature of t h e air -borne contaminationo Stnce the f i l t e r sampling equipwnt i s located in s ide louvered enclosures , t h e heavier p a r t i c l e s s e t t l e t o t h e ground without being co l l ec t ed on t h e f i l t e r s , This type sampls contains only p a r t i c l e s which might be considered of breathable s i z e . The fa l l -out t r a y s c o l l e c t t h e heavier p a r t i c l e s as w e l l as the l i g h t p a r t i c l e s and thus present %\.le t o t a l fal l- out p i c t u r e . The background measurements i nd ica t e t h e r a d i a t i o n from contaminated s o i l and from rad ioac t ive gas such as natural radon or reactor-produced argond4L0 R a i n water samples conta in both f a l l - o u t and "rain-out" and give: information on t h e soluble and t h e insoluble f r a c t i o n s of t h e rad ioac t ive contamination.
1. Stack Monitoring
Continuous s t ack monitors a r e i n s t a l l e d on t h e s tacks a t t h e i so tope Area, Hot P i l o t P lan t , and Graphite Reactor. The equipment a t the isotope stack con- s is ts of a conventional W i n e motor blower u n i t which draws air from t h e stack gas stream through a mi l l ipore f i l t e r , A t t he Hot. P i l o t P l a n t stack the sample i s drawn from the s t ack stream through a mi l l ipore f i l t e r by means of a steam j e t arrangement. The sample a t t h e Graphite Reactor is drawn from t h e duct down- stream from t h e f i l t e r house and uses t h e pressure d l f f e r e n t i a l across t h e f a n t o draw t h e sample through Bollingsworth-Vose (H- V , ) ' (0 f i l t e r paper, Mounted i n a s h l e l d e d box just below t h e W, V. 'IC0 f i l t e r paper is a Geiger-Muller ( G o M.) tube which monitors t h e a c t i v i t y collected on t b e f ' j 1 . w ~ ~ The coun+,irag rate i s recorded on a n Es t e r l i ne Angus recorder ,

-3%-
The f i l t e r s are changed da i ly a t each s tack and eva lua ted €or p o s s be ta and gross alpha a c t i v i t y . The d a t a presented below represent samples covering a minimum of one month following i n s t a l l a t i o n . gross be t a and gross alpha a c t i v i t y and t h e highest average value for any 24-how period from each s tack axe presented.
Average concentrat ion values f o r
Concgntration of Radioact ivi ty i n Stack Eff luents
Stacks
H o t P i l o t P l an t Isotope Area Graphite Reactor
Gross Beta
Highe6t average 1. pc/cc 9.lxlo-’ pc/cc 9 . 5 ~ 1 0 - ~ pc/cC per 24 hours
Average fox 3.2XlO-’ . p / c c 9.3xlO-” ,uc/cc 3 .%lo-’ pc/cc period
Gross Alpha
- 11 Highest average 1 . 5 ~ 1 0 ~ ~ ~ pc/cc 5.5~10 pc/cc I. 3 ~ 1 0 ~ ~ pc /cc per 24 hours
Average for 2 .4x1OCL1 pc /cc 2.6~10 pc /cc 3 .4x1O-l4 pc /cc period
- 11
. B . The average values l i s t e d i n t h e t a b l e may be considered probable normal
opera t ing l e v e l s . When concentrat ions of a c t i v i t y i n t h e s tacks exceed these v a h e s , the values found must meet the t e s t s e t f o r t h by t h e following expressiozl:
Cb x lo-* ca x l o - 2 \ 3 i + 2 1
C = gross alpha concentrat ion i n steclr effZuent a
Cb = gross be ta concentrat ion i n stack e f f l u e n t
WCb = breathing zone MPC ( m a x i m u m permissible concentrat ion) f o r grcss be ta a c t i v i t y
l@Ca = breathing zane MPC for gross a l p h a a c t i v i t y
T n c ma.ximum ground concentrat ion per u i i i t discharge rate from each ORNL s t a c k f o r v a r y i n g weather condi t ions has been ca icu ia t ed by AXyers and Purdy on the basts of Sutton’s equatians.lr The data inci icate a probable minimum di1ut j .m

f i x t o r of t h e order of 10 3 fo r each s t ack , Since a la rge segment of the Labora- t o ry population w i l l be involved i n a i r -borne contamination from s tack discharge, any uncontrolled exposure from t h i s source should not exceed one-tenth t h e maximum permissible concentrat ion (MPC) a
reduced by a f ac to r of t e n wi th the r e s u l t t h a t LOe2 rather than 10-3 appears i n t h e above eq*uation. The f a c t o r of 3 i s appl ied because t h e r e are three s tacks which are monitored and evaluated separa te ly . The f a c t o r of 3 i n the equation obviates t h e p o s s i b i l i t y of each s t ack continuously discharging s u f f i c i e n t ac t iv - i t y t o create concentrat ion of one-tenth MPC .,
Consequently, t h e d i l u t i o n f a c t o r of LO3 has been
It should be emphasized %hat the above equation was developed t o determine If a n a c t i o n poin t f o r f i e l d inves t iga t ion and subsequent co r rec t ive measures.
t h e left-hand s ide of t h e expression i$ greater than one, bu t less than ten, the condi t ion i s inves t iga ted . I d e n t i f i c a t i o n of s p e c i f i c i so topes and considerat ion of t h e i r p a r t i c u l a r MPC values may reduce the quant i ty of the left-hand s ide t o an acceptable value. I f t h i s is not t he case, remedial a c t i o n is taken. Should t h e value of t h e left-hand side exceed ten , remedial a c t i o n i s t a k e n immediate12 and followed by a n inves t iga t ion ,
2 . A i r Sampling and Fa l l -ou t Col lec t ion
a. F i l t e r - type A i r Monitors. A i r samples are co l l ec t ed a t a l l s t a t i o n s ( loca l , perimeter. and remote) by passing air continuously through H. V. 70 f i l t e r paper. A t t h e l o c a l s t a t i o n s t h e a c t i v i t y co l l ec t ed on t h e f i l t e r i s continuously monitored by means of a Geiger-Muller tube and logri thmic count rate meter, t h e readings being recorded on a Speedomax recorder (Fig. 11). counting rates are telemetered v i a telephone l i n e s t o the area monitoring con t ro l laboratory where they are recorded on a twelve-point Speedomax recorder; each &at ion reading is pr in ted once every twelve minutes, The one-minute i n t e r v a l between s t a t i o n p r in t ings i s necessary t o compensate f o r the-s low- t ime constant inherent i r , the logc i thmic rate meter c i r c u i t The perimeter and remote s t a t i o n s contain no monitoring and recording equipment (Fig. 12) Under normal condi t ions of air contamination, the f i l t e rs are removed once each week. When air eontamin- a t i o n i s s ign i f i can t , more frequent changes are necessary. The cha r t s from the recorders i n the l o c a l s t a t i o n s a re changed normally a t i n t e r v a l s of approximately three days. An hourly t abu la t ion i s made of the counting rate of t he a c t i v i t y 03
each f i l t e r , Where air contamination i n s i g n i f i c a n t q u a n t i t i e s i s encountered and t h e h a l f - l i f e of t h e a c t i v i t y i s long i n comparison w i t h t h e c o l l e c t i o n time, a n ind ica t ion of t,he ccncent ra t ion of a c t i v i t y i n t h e air can be obtained from the r a t e of increase i n a c t i v i t y on t h e f i l t e r , A f t e r removal, all f i l t e r s a r e brought t o the monitoring laboratory for analysis,
I n addi t ion , t he
b. Gummed Paper Fa l l -out T r a y s Radioactive f a l l - o u t i s sampled by means of sedimentation t r a y s or frames, each cons is t ing of an aluminum frame ( ins ide demensionuc 12 in . x 22 i n e ) t.o which i s a f f ixed a cellophane sheet gummed on one s i d e (Fig. 13) . The frame w t t h t he gummed paper i s placed on a hor izonta l s h e l f a t tached t o the air monitoring s t a t l o n . The gummed surface 2s exposed i n an upward d i r e c t i o n so t h a t any paz t i cu la t e matter which fa l ls upon t h i s gummed surface becomes f i r m l y €ixed,
Fa l l -ou t samples are c o l l c c t e d at all s t a t i o n s , Duplicate s e t s of f a l l - o u t frames are maintained; while one .;el: 9s in Dhe f i e l d f o r c o l l e c t i o n of p a r t k l e s ,
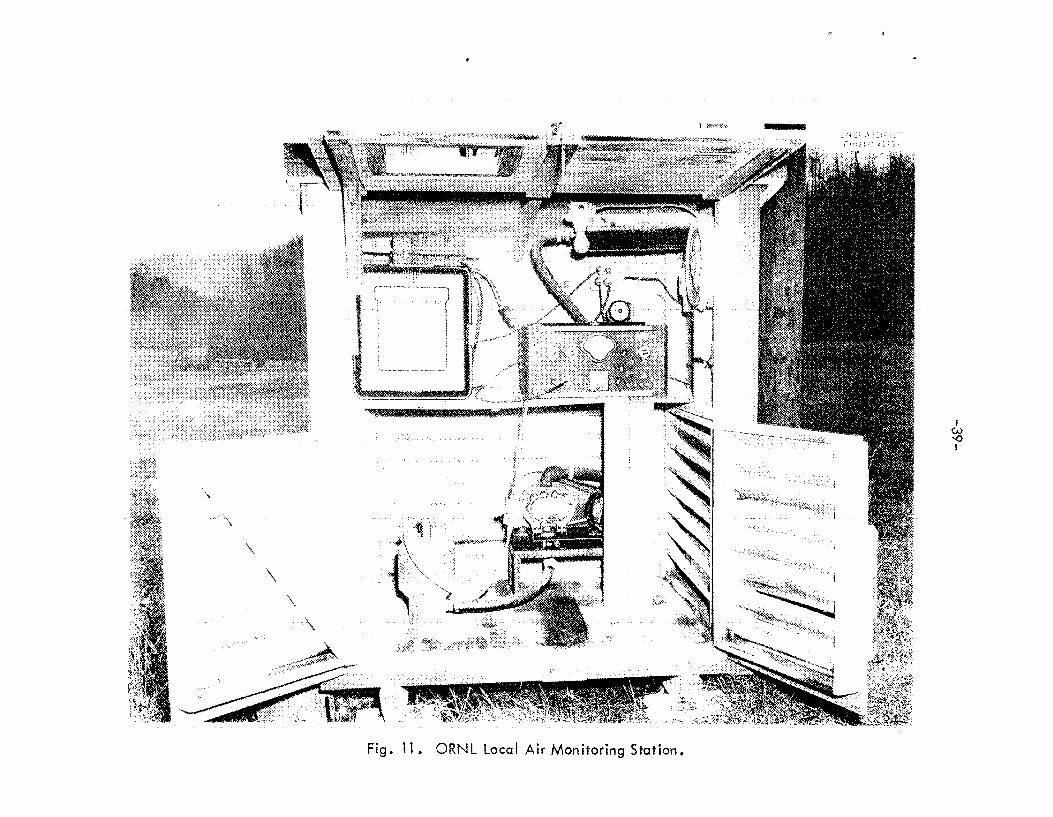
-39-

-40-

w
0 2 r
- LP-
I

-42 -
t h e other set i t 3 i n t h e labora tory f o r processing and ana lys i s , changed normally once each week and t ranspor ted i n a special box which keeps them separated during t r a n s i t
Frame8 axe ex-
c e Rain-out Samples Rain-out measurements are made by c o l l e c t i n g rafn- fall in 3O-in, x 30-in. trays loca ted a t a l l perimeter and remote s t a t ion8 and one of t h e l o c a l s t a t i o n s . The c o l l e c t i o n t r a y eerves as t h e roof of t h e monitoring s t a t i o n (Fig. 12). A l l r a i n co l l ec t ed is drained from the bottom of t h e t r a y i n t o a polyethylene container i n s ide t h e s t a t i o n o The depth of water i n t h e container is measured t o determine t o t a l r a i n f a l l from a c a l i b r a t i o n curve. Samples are co l l ec t ed normally once each week. The water i n the container is shaken and one l i t e r of t h e homogeneous mixture Fs taken t o the monitoring laboratory for procesa- ing. The remainder of t h e water is discarded. The c o l l e c t i o n trays and t h e con- t a i n e r s are cleaned a t per iodic i n t e r v a l s t o prevent bui ldup of contamination f'rorn previous rains.
d Analy t ica l Methods. I n t h e labora tory continuous air monitoring f i l t e r s are mounted on 14-in, x l7-in. cardboards; for autoradiographing. f i l t e rs are mounted on each cardboard wi th t h e c o l l e c t i n g surface of the f iL te r f ac ing away from t h e cardboard. i n d i r e c t contac t wi th a shee t of 14-in. x 1'7-in. Kodak Blue Brand X-ray f i l m f o r an exposure time of 24 hours. contac t during exposure .,
Twelve
The mounted f i l ters are placed i n t h e dark room
The f i l m and f i l t e r s are weighted t o asswe complete
The gummed papers are covered with a shee t of rubber hydrochloride, cut from t he f a l l - o u t frame;and mounted on a 14-in. x l7-in. cardboard f o r autoradiograph- ing, which follows the technique out l ined above for continuous air monitoring f i l t e r s .
With t h e use of a l i g h t table and the unaided eye , films are analyzed for r ad io -pa r t i cu la t e s by counting t h e number of p a r t i c l e images appearing on t h e f i l m s . I n add i t ion t o counting t h e number of p a r t i c l e s , some measwe of each p a r t i c l e ' s a c t i v i t y i s obtained by c l a s s i f y i n g each p a r t i c l e according t o image diameter i n t o one of s eve ra l p a r t i c u l a r s i z e ranges, The c l a s s i f i c a t i o n is accomplished by comparing image s i z e s wi th ca l ib ra t ed image s izes prepared from known pa t i c l e s .
f o r s tudy and comparison wi th previous data and norms,
Four arbitrary order of magnitude s i z e ranges are: < lo5 d/24 hr, 105 - 10 8 d/24 hr, 106 - 107 d/24 h r , > 107 a/$+- hr . The r e s u l t s are t abula ted
Following autoradiography, t h e continuous air monitoring f i l t e r s are counted f o r gross beta a c t i v i t y t o determine t h e average concentrat ion of r a d i o a c t i v i t y i n t h e air sampled. To evaluate the a c t i v i t y on the sample: the f i l t e r is a f f ixed t o the ins ide w a l l of a 1-in,-diameter aluminum cyl inder , which is placed i n a counter having a G . M. tEbe posi t ioned along t h e a x i s of t he cy l inder , The sample i s counted t o determine t h e t o t a l a c t i v i t y i n terms of plc/sample, The average air concentrat ion i n p c / c c i s determined by d iv id ing the t o t a l a c t i v i t y per sample by t h e volume of air sampled.
The gummed papers are each folded i n t o a small square, placed i n a c ruc ib l e , and ashed i n a muffle furnace. The ash i s t r ans fe r r ed t o a stain]-ess st?eei counting d i s h using a technique of t r a n s f e r as fol lows:
* d = d i s in t eg ra t ions ,

1. Spray t h e bottom of the counting d i s h with a w e t f i l m of ac ry l i c r e s i n ?
2. w e t r e s i n coat ing. Use a spatula, t o d i sperse t h e ash evenly over t he dish.
3 . Dry under a heat lamp. The resin bond, when thoroughly dry, provides a secure bond f o r r e t a i n i n g the ash-
Transfer t h e a sh t o t h e counting dish by sp r ink l ing t h e ash onto the
.After drying, the samples a r e counted i n a gas-flow proport ional counter t o determine the gross beta a c t i v i t y o From these c o m t s , t h e f a l l - o u t of gross be ta a c t i v i t y i n terms of p c / s q f t i s determined.
Rain water samples are vacuum-filtered through Whatman 42 f i l t e r paper t o remove t h e insoluble f r a c t i o n of t h e a c t i v i t y . The f f l t m t e i s placed i n a 1500. m l beaker and concentrated by evaporation on a hot p l a t e t o approximately 50 m l . ac id and d i s t i l l e d water) and evaporated t o a f e w ml. s t a i n l e s s s t e e l counting d i s h and evaporate6 t o dryness under a heat lamp. i s taken t o scrub down.the walls of the beakers during each transfer. f i l t e r , containing t h e res idue or insa luble f r a z t l o n of t h e a c t i v i t y , i s placed in a cruc ib le and ashed i n a muffle furnaceo Tine a sh is then t r ans fe r r ed t o a s ta in less s t e e l counting d i s h using the method described fcr transfer of gummed paper ash.
The concentrate i s then transferred t o a 100-mL beaker (using n i t r i c T h i s is t r ans fe r r ed t o a
Care Each
A l l samples of both t h e soluble and insol.?ible f ract- ions are munted i n a gas- flow-type propor t iona l counter t o determine t h e gross bet~a a c t i v i t y e r e su l t s , t h e concent ra t ian of a c t i v i t y i n rain-olrt i n terms of plcice 1 s ca lcu la tnedo
Whene s&ni f i can t ly high a c t i v i t y is encoui3ered, a n attempt i s made to ident5-
Prom these
f y t he s p e c i f i c rad io iso topes and t o determine t h e i r probable sourceo are subjected t o gamma spectrometry measurements and radiochemical. ans1yais by t h e Analytical Chemistry Divis ion t o i d e n t i f y the rad ioac t ive cons tz tuents ~ I‘d:
addi t ion , t h e e f f e c t i v e half- l i fe and d i s t r i b u t i o n of products i n the sample are s tudied t o d i f f e r e n t i a t e between ORNL-originated a c t i v i t y and possfble contamina- t i o n from weapons t e s t s .
The samples
e . Evaluation and Effec t iveness of A i r Sampling. From t h e air monit.or- in@; samples it is poss ib le t o determine t h e genera l l e v e l of air and m i l oon- %amination i n t he area, t h e source of s p e z i f i c contamfmt5.cn probLems,and khe improvement achieved over the years by b e t t e r zon-kaminatidn c o n t r o l S h o d d the rad ioac t ive contamination reach a l e v e l t h a t f s 8 s i g n i f i c a n t f ract ion of allow- ab le limits, inves t iga t ions i n t o the source of the contamination are made and remedial ac t ions taken immediately, Examples of such ins tances are the t i m e s when uranium oxide p a r t i c l e s (alnd later prctactixium p m t i c l e s 1 were f o m d t o be f a l l i n g out on t h e X-10 area, Znvest,igations l ed t o t h e SOLU”CB of t.he p a r t i c l e s ? and t h e processes producing t h e p a r t i c l e s were stopped until . c.orre:- t i v e measures had been completed, The remedial a c t i o n requi.red i n the case of t he uranium oxide particles was additional f i l t r a t i o n of t h e off-gas sys t em a n d a program f o r rou t ine scanning of t,bc Graphit.e Reactor fo r defec t ive f ueZ elements. I n addi t ion , t o prevent t h e p a r t k l e s a l ready o n t h e area from hecoru- ing air-borne and thus increas ing the breathing hazard, t he roofs and roadways i n t h e area were washed ana t h e barJ‘en m e a s witbin t he X-IO area sown w i t h grass ,

An ind ica t ion of' t he e f f ec t iveness of the ai: monitoring p r o s a m f o r t hc X - l G a r e a is the f a c t that the averagc air contamination value f o r 1957 was l e s s than O . l $ o f the maximum permissible concentration f o r continuous exposure. The maximum concentration measured 'was 1'70% of t h e maximum permissible concen- t r a t i o n . However, t h i s concentration continued for only a shor t period of t i n e ; and, therefore , t h e concentration averaged over a period of one week d id not ex- ceed t h e maximum permissible f o r t h a t per iod.
To determine t h e a i r contarnination i n newby populated a reas , samples have been co l lec ted continuously a t s t a t i o n s from 10 t o 120 miles from OFPILO A l - though t h e a c t i v i t y l e v e l s have not been considered hazardous, the acce lera ted programs a t ORNL necess i t a t e continuing vigilance. The number and the e f f i c i ency of monitoring s t a t i o n s within an approximate 30-mile rad ius oP t he Laboratory are being increased.
f. Summary Ddta from A i r Sampling and -11-out Collect ion. -
(1) Local Area. Average a i r contamination f o r 1957 i n the X-LO area, determined from measurements rrade by t e n continuous air mcmitors, was 0.1% of t he IWC. Tne maximum weekly average measured by a s ingle a i r monitor w a s b . O $ of t h e M P C . In no per iod d i d the weekly average of a c t i v i t y concen t r a t im exceed the maximum permissible concentrat ion. Table XI SI-tows t h e average and maximum contamination over t he las t 9 years . The weekly average number of radio- a c t i v e p a r t i c l e s per 100 cu f+ of ai- sampled was 4.2. of rad ioac t ive p a r t i c l e s for one week w a s 54.9. and maximum number of p a r t i c l e s over t he past 9 years..
The m a x i m u m concentration measured was 170% of t h e MPC.,
The max-imun number Table 1::: shows t h e average
Gwnrned paper f a l l -ou t t r a y measurement gave a weekly average. mlue *The highest t o t a l weekly f a l i - o u t f o r a
me average number of f o r 1957 of' 4,O x 10-3 pc/ft2). s ing le co l l ec t ion s t a t i o n was 8 .4 x LO-* pc / f t2 . rad ioac t ive p a r t i c l e s per sq f t per week w a s '(27. The maximum number of p a r t i c l e s f o r any one week tias 22,146.
The weighted average value f o r radioaci;&ve contamination i n r a i n water, collect,eci a t one s t a t i o n only, w a s '1.6 x 10- t r a t i o n -in any one week w a s
~ . l c / cc . ?he maximum concen- x 10-O vc/ccn
(2) m e d i a t e Ewi rons (Within AEC Controlled k e a ) Average a i r contamination levels f o r 1957 i n t h e immediate environs, determined by measurements a t seven monitoring s t a t ions , w-ac 0.02% of t ~ l e M P C . m u n wrek ly average f o r a s ing le monitor was 2.39% of the MPC. The weekly ave:*ag:c number of p a r t i c l e s per 1000 TU f t o f sir sampled was 2-0 and t h e m a x i m i m number for one week was 20.2.
The m a x i -

4
Year
19 49
1950
1951
1952
1953
1954
1955
1?56
1-957
-
A i r Activity Measured by C o r i t i n u x s A i r Monitors
Local Area Max. Average
2100.0 210 0
2040.0 180.0
1050.0 170 e 0
782.3 29-0
4407.3 46.4
203,183 0 5 478.4
2968.6 49.4
804.7 27.9
5607 e 0 52.3
Perirneter Area Max LI Average
7.0
14.8
Remote Area Average -*I
Max
43, .l
47.3
l O " 2
9.0

r n - r .iAdLE III
Year
19 50
1951
1352 ,
1953
195h
1956
Par-t;id.es Per 1000 c-a ft
L x a l A r e s
5 r 4 0,2
1'7.0 0-6
22.,0 0.6
A, 4
6 3

The j;eig$ted average value for. raoiodct?-ve contamination i n r a i n water was 8.1 x 1C-1 ,uc/cc. The r i l a x i m t m cor'ce:j'ci.ai;ioi3 for one veek vas 5 .I. x 10-6 pc/cc .
(3) "ncrnote Areas (Oatside k&C Cari";rol!-ed l-_lll--l-.l Area) . At. present , t h e LaSora- -...- t o r y i s onera t ing axe monf:Lorisg s t a t i o ~ i c i r ~ s 5 d e %he AEC cOi>trQlled area approximately 120 miles from ORNL. The a w r a g c contamlnatioa for 1957 measxred by hh?'.s s t a t io r , SJBS O.Ol'$ of MPC. ?he mnxlmun fsr one week was 0.05% of MYC. sampled wa,s 1.9 and t h e innx~-mu-rc nmibei- fo r o x week was 2.5.8.
The we2kl.y averege ncaber of par-ticies per 7,000 CI; f t of air
Gummed paper fall-out t r a y mecLsvxeincn'fis gave a. t ieekly average value of 2 4.7 x pc/ft2.
The average number of radioactive p.rtLcl.es per sa_ ft was 69.2. number f o r m e %reek w a s 2330.
The highest total, weekly f a l l - o u t was 2.1 x 10⁻³ p.c/ft . The m a x i m u m
3. Background Measurements - Contamination of t h e grounti in the I & w - : a t ~ ~ ~ area I s rnoaltored by means ~ J P
'cackgound measureaen-Le at some 50 loeai-,iona. ca l ib ra t ed scaler, (2. M. tube, n c d a porla13l.c 60i:--:.re,hut Fairbanks -Morse generator power su-oply. A pick-up t rxck is csed i o s:?a;.,spw'i i b e eqnipnerl from stazion t o station. W l l k the eqv.iomert"t on the t:?uck, t he G. M. ti?Se i s mowrte6. In a fixed positiorz a t the e:id of a, 2-L-1. y1 2-Sr. %iirriuer extniiding PoPizo2tal.l.y from t he bed of tne t n x k . .A ~ o i h n ~ 3 .?a!.;e:: ai; each s.;e",iu:i a r d 'ihe Tesu'i";s cor lvcrkd t o m r / t i . . *
The zc~-j,:-pme-nt used cms i s t s of a
- . .
R.. Stream. Moni'corLng

w e l l and Stevens water l e v e l or head recorder , The waste stream is sampled by a Trebler Proport ional sampler equipped with a revolving dipper so shaped t h a t ind iv idua l d ips c o l l e c t a volume proport ional t o the flow through t h e weir a t the time of each dipping. The sampler i s equipped with a timer t o l i m i t t h e number of d ips per hour, thereby l imi t ing t h e sample t.o a volume s u i t a b l e for handling and acalysis . .
Grab samples are co l lec ted d a i l y a t stream stat ions on Melton Branch and White Oak Creek (F ig , 1). t h e a c t i v i t y detected i s fzom t h e Laboratory proper or from t h e Melton Valley area (Sect ion 11, D)$ A t White Oak Dam, located downstream from t h e confluence of W h i t e Oak Creek and Melton Branch (Fig. l), continuous samples are col lec ted f o r d a i l y a n a l y s i s .
These samples are used primar$ly t o determine whether
b. Analy t ica l Methods. Four types of samples arc processed i n the monitoring laboratory. F i r s t , those t aken from t h e s e t t l i n g bas in and White Oak Creek a r e evaluated for gamma a c t i v i t y t o determine submersion exposure. a l l of t hese are checked for gross beta a c t i v i t y , Third, composite samples of both s e t t l i n g basin and White Oak Creek e f f l u e n t are analyzed radiochemically each week for plutonium content. and White Oak Creek e f f l u e n t are analyzed radiochemically each month f o r s p e c i f i c long-lived fission products.
Second,
Fourth, composite samples of both s e t t l i n g basin
Submersion exposure i n terms of rnr/hr gamma a c t i v i t y for s e t t l i n g bas in and W h i t e Oak Creek i s determined a5 follows:
Samples are put i n t o lh--5xo-diameter stalnless steel. zont.ainers t o a . depth of approximately 12 i n . and cou-n%ed by a ca l ib ra t ed G . M. t u ' be en- c losed i n a water - t igh t brass cyl inder placed along t h e axis of t h e con- t a i n e r . The w a l l th ickness of t h e b ra s s tube around t h e G. M. tube i s s u f f i c i e n t t o cu% o u t a l l beta a c t i v i t y , for background and t h e a c t i v i t y i n mr/hr ca lcu la ted .
The counts ob%ained are corrected
The be ta a c t i v i t y i s determined by evaporating a n aliquot; of t he sample t o dryness i n a n aluminum counting d i s h a n d coun3ing i n a standard end- window counting se t -up , The ne t counts per minute obtzined are converted t o LO$ geometry a n d t he b e t a a c t i v i t y i n uc/cc ca lcu la ted . of beta a c t i v l t y re leased is calcu2ateG f ro% the flow measurements a t t h e s e t t l i n g bas in and White Oak C r e e k and from masurements of the specific concentrat ion of a c t i v i t y i n t h e effluent; ,
T h e t o t a l curies
From t he d a i l y samples, a weekly and month2.y compoeite i s prepared for more d e t a i l e d ana lys i s for plutonium and long-lived f i s s i o n products. The weekly composite samples are analyzed f o r plutonium t o evaluate the alpha a c t i v l t y 6 i s - charged. The monthly composite samp?Les a r e concentrated and s e n t t o the Analy-tj-cal Chemistry D i v i s i o n for analysis for long-l ived f5sssion products by standard radio- chemical procedures. The elements analyzed are st ront ium, cerium, ruthenium, iodine, zirconium, trivalent rare ea r ths niobium, barium, and cobal-f;,
From t h e analytical r e s u l t s , t h e f r a c t i o n of the t0'ca.t beta a c t i v i t y ccq- pr ised by each long-lived isotope i s detcrained. A weighted MPC value f o r t h e mixtLzl.e is calculated by the foi-mula:

f i - - mcmix fi r. &q-
where
f i = f-raction of t he t o t a l beta each isotope represents
MPCi = MPC value f o r each Isotope
The ca lcu la ted c o n c e n t ~ a t i o r ~ ir. t h e Clinch River is compared t o t h i s ddeighted MPC value as a measwe of t h e hazard e x i s t i n g .
c . CalculGtions. The submersion exposure t o gamma r a d i a t i o n is calcu- l a t e d by rnultj-plying the ne t counts per m i t e obtained wi th t h e ca l ib ra t ed G. M. tube by the appropr ia te conversion f a c t o r . ?Y
I n order t o ca l cu la t e the quanti-by of beta a c t i v i t y re leased , a knowledge of t h e flow and s p e c i f i c concentrat ion from a given source i s necessary. concentrat ion i s obtained by analysis es previously descr ibed. case of t h e s e t t l l n g basia, ks obtained from a continuous recording of head i n t h e weir box and a ra t i i lg table for the w e i r . by summing t h e flows of Whi’ce Oak Creek and Melton fjranch, measured above White Oak Lake bas in , and mult iplying by a c o r x c t i o n f a c t o r based on Tun-off areas ’co . correc’i for t h e inflow between t h e gauging s t a t i o n s and o u t f a l l i n t o t h e Cl inch R i v e r , The flows i n t h e two creeks are supplied by t h e U. S. Geological S u r v e y , Smface Waters Bj:e>ach, E n d =re obta ized from steam gauging measurements and con- tinu.ous recora ings of cyeek stage. beta concentrat ion of a c t i v i t y i n t h e e f f l u e n t i s :
The s p e c i f i c The flow, I n t h e
Flow i n Whi te Oak Creek is obtzined
- P
The basic formula f o r determining the s p e c i f i c
The formula for t h z t o i a l c u r i e s of beta a c t i v i l y discharged is :
s x E’ u c, = I, 196

3
w her e
F = t o t a l flow f o r t h e period i n cc
106 = pc/curie
The concentrat ion of a c t i v i t y i n the Clinch R i v e r , wh ich i s t h e primary con- cern, is obtained by mult iplying t h e s p e c i f i c concentrat ion found i n White Oak Creek by a d i l u t i o n f a c t o r obtained from a r a t i o of the White Oak Creek f l o w t o t he Clinch River flow at the po in t of e n t r y , This ca lcu la ted concentrat ion i n t h e Clinch River assumes int imate mixing wi th White Oak Creek water upon e r r t ry of creek water i n t o t h e r i v e r .
The average d a i l y flow i n t h e Clinch R i v e r at the point of" en t ry of White Oak Creek i s determined i n t h e following manner, t o midnight) discharge flow from Norr is Dan f o r t h e day i n quest ion and the preced- ing day are averaged and subtracted from t h e 24-hour average (midnight t o midnight) Cl inch flow obtained a t t h e Scarboro gauge ( C l e 39.0) on the day i n quest ion t o determine t h e l o c a l inflow below Norris. This f i g w e is mult ipl ied by 435/3889 which i s t h e ratio of t h e drainage area above White Oak Creek (el, 20.8) t o t h a t above Scarboro gauge t o co r rec t for s ide drainage below Scarboro gauge, To de te r - mine t h e flow a t CIS 20.8 t h i s r e s u l t i n g amount i s added t o the average Nosr i s discharge prevlousxy subt rac ted
The 24-hou~ average (midnight,
d . Clinch River Monitorinq. Routine surveys of t he C l f n z h and Tennessee Rivers are conducted t o determine the ex ten t of d i spers ion of rad ioac t ive mater.iab. i n r i v e r sediment, t h e l e v e l s of r a d i a t i o n enccuntered, and t h e nonseqaent hazards t o humans. Per iodic measurements are required t o p red ic t t h e rate of buildup and, cdnsequently, t o determine the e f f ec t iveness of t h e 1iqu'i.d waste management program. Also, information i s obtained r e l a t i v e rad ioac t ive content of bottom sediment, i n t h e Teunessee River systems is 5ncreased
t h e e f f e c t bn f u t u r e i ndus t ry If t h e
"Cross-section" measurements w e taken every two miles i n t h e Clinch R i v e r and approximately every 10 miles i n t h e Tennessee River and i t s r e se rvo i r s (Fig. 14)" A cross-sect ion study cons i s t s of making r a d i a t i o n measurements of %he bottom sediment a c t i v i t y and co I le c t i ng s edime n t sample s a t pr e de t e r m i, ned I n t e r vals along t h e t r ave r se from one bank t o t h e o the r , Sampling points are Lccate? OD TVA navigat ion cha r t s and cross sec t ions taken acToss the r i v e r a t these points. Fi f ty - foo t i n t e r v a l s are used i n the Clinch River, but an average of t e n rea.liags and samples a r e taken per traver6e i n t h e Tennessee River and i n Watts Bar and Chickamauga Reservoirs.
A device ca l l ed a "flounder"20 L s used t o measure the gmma r a d j a t i o n cf t h e bottom sediments. The flounder cons i s t s of' twelve bat tery-operated G - M. tubes connected i n p a r a l l e l . Pulses from the G o M, tubes are pre-amplified and recorded on a bat tery-operated s c a l e r , t h e averagc? count being determined by t iming w i t h a s top watch. Samples of bottom sediment for laboratory analysis are obtained w i t h an Eckman dredge.
The gamma measurements made on t k e bo'ttom sediment ari= corrected f o r baek- ground and averaged for each cross s , ion . P l o t s of the average CC~J?% v s , r iver mile fa r t h e Clinch and Tennessee Rivers are made, Sediment sampks &re r a d k - chemically analyzed fo r the long-lived ~ ~ d i ~ ~ , ~ c t i vta soto opes present 02'

-51 - IJ N C L A S S I!' I ED
OR N L - L. R -0 WCv. I 30 1 4
Fig. 14. Tennessee Valley Map of Observation Locations.

A water sample i s ec l l ec t ed daily a t Centers Fer ry near Kingeton, TenP;dessee, and composited f o r a three-month period. The composite i s f i l t e r e d and t h e f i l t r a t e concentrated The res idue o r suspended s o l i d s and the concentrate are analyzed for fission products t o determine t h e Level and composition of the a c t i v i t y ex i s t ing i n t h e Clinch R i v e r .
From time t o time, f i s h from the public, waLerway are obtained and analyzed fox radic%:tivity, N o s i g n i f i 2 a n t l eve l s of' a c t i v i t y have been detected bm these f i sh .22 Samples of water from t h e rtver a t t h e Oak Ridge Gaseous Diffusion Plan t and a t Kingston, Termessee, t he aearest population, cen te r s downstream, have i n - d ica ted de tec t ab le smcuats of f i s s i o n products, b u t l e v e l s a r e we l l below those permitted f o r potable water. Gaseous Dfffusion'Plan' t is obtalned from t h e r iver a t a point approximately 8 miles below t h e o u t l e t o f White Oak Creek.
In f a c t , t h e drinking water for employees at the
e , S z l m m a q Data. The total curies of f i s s i o n products discharged fPom White Oak Creek t o t h e Cl inch R i v e r i n 1951 was 397. b e t a concentrat ion i n t h e Clinch River f o r 1957 was 0 - 9 x 10'1 pc/cc. i ng l i m i t of lo-? pc/cc @os$ b e t a a c t i v i t y i n t he Cl inch River w a s exceeded 28qb of t h e time during t h e yeax. t he past 10-yea r per iod, Table W presents radiochemical analpis d a t a f o r White Oak Creek e f f l u e n t f o r t h e past ?-year per iod ,
The weegly average gross The operat-
Table 3,' presents d a t a on l i q u i d waste re leased for
Radiochemical ana lyses of co2taminants I n t h e Clinch R i v e r shows a c t i v i t y TRE-.28*8$, Ce-3 -2$3, Ru-15 .0$, Zr-5.7$, f o r 1957 t o be t he following isotopes:
Cs-22.4$, 1-003$9 Sr-20.9, Cb-la@> Ra-O.k$, C ~ ? - 1 ~ 2 $ .
The concentrat ion of r a d i o a c t i v i t y i n the sediment of t h e C l i n c h River drops o'ff materially after t3he f i r s t 20 miles and approaches Sackgrouszd levels a t 1.50 miles. 18 t ims background (approximately 0,l m r / k r ) and was f a m d t o be located a t 12-8 miles belcq t h e o u t f a l l of White Oak Creek. A t 100 miles downstream the level. is approximately 2 t i m e s backsound and spec i f i c fission product.8 are de tec t ab le by s i l t ana lys i s ,
Th; ~ . i m u m average actiriit-y fcr a s ing le cross section i~ approximately
2, Core Hole Monitoring
Evaluation cf t h e effecz of l i qu id waste wi th r e g a x t o t h e underground water table i x l t he main X - 1 0 area, i n %he burial g m m d , and i n t h e area of t h e waste p i t opera t ion i s made by means of core ho2.e~ or monitor ing we:Lls. X - 1 0 area, measwerneiits of underground a c t i v i t y de tec ted b y core bole monitoring r evea l level.; t o be i n s i g n i f i c a n t . I n t h e waste p i t and h.wial gromd area, where most of t he dfispcsable high-level m s t e mater ia l s are sent: a c t i v i t y has been de tec t ed in t he monitoring wellss, but tt h a s been es tdbl i shed t h a t the cog- t a m i w n t i s primari1.y ruthenium-l06, fo r w h i c h t he maximum permissible concentra- tiotl ( M P C ) i n water is q u i t e high, over a hundred times h i g h e r than the MPC f o r strontium-90. Several surface seeps have developed ir, %ne p i t area9 but t h e locatiori of' t.heae area5 i s such t h a t the diirect?lor? of' g r o l ~ n d water f z ~ o w i s tovard. White OaK C r c e k ani t h e C l i n c h River dra inage basin i I .wt1zch l o w - l e v e l l i q u i d biasfes iiave been re leased and monj-tored siru t h e heqinrainp of %tie Laboratory
* By calculation,
I n tvle main
____I__x

-53-
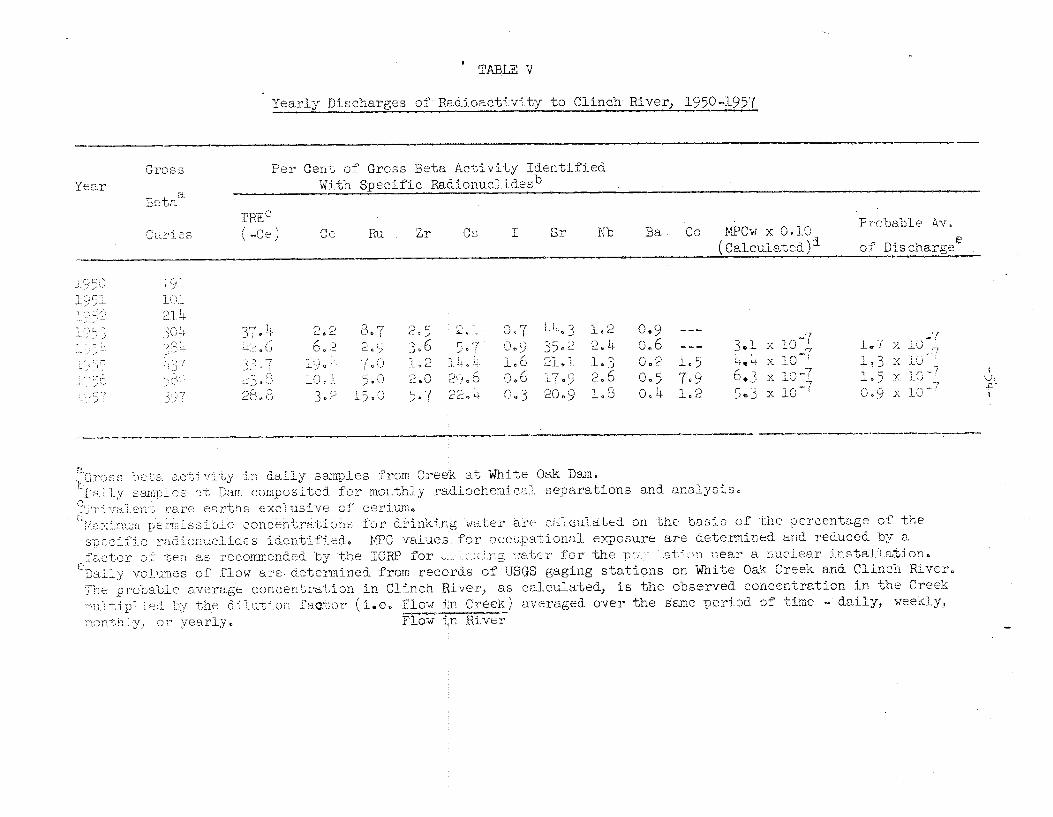

C Conclusions
In conclusion, Oak Ridge National Labcrratory i s cont r ibu t ing some rad ioac t ive materials t o t h e l o c a l environment, and continuing v ig i lance must be .maintained t o determine the nrtt.ure and ex%en+, of dispersion of these rad ioac t fve materials. Up t o t he present,? data co l l ec t ed from t h e current monitoring systems ind ica t e t h a t t h e a c t i v i t y re leased Ls belov t.he. maxlmum permSssFble l e v e l s recommended by the National Committee on Radiat ion Protection and t h e In t e sna t iona l Commission on Radiological Pro tec t ion air and water by ORNL does no% represent a hazard t o the l o c a l environment or population.
The low degree of rad ioac t ive contamination of the
V I . Acknowledaement
The authors express g r a t e f u l apprec ia t ion t o t h e fol lowing co-workers for information and a s s i s t ance i n t h e preparation of t h i s report : F , L. Cul le r , dr., W . K . Eis ter , K . 2 . Morgan, and Eo G . S t r u n e s s o f O a k Ridge Nat ional Laboratory and 0. We K o c h t i t z k y of t h e Tennessee Val ley Aiit’nority.

V I I , References
1,
2 .
3.
4.
5 .
6.
'7 .
8.
90
f b ) K . E.. Cowser and F . L o Parker {ORNL), "Soil. Dfspaeal cf Hafiloact.l.ve L i q u i d Wastes a t ORNL: Monitaring," H e a l t h Ph2sics, Vob, 1 (1958)
F r a n k N . Browder (ORNL), "LEquid Waste Disposal a t Oak HL3ge Iht!om:. L&- oratory2" I n d a s t r i a l arA Engbneeriqq Chemistry, Yol. 43, 30, "y (JaLs .I.C;S'c!
A, F. Iiupp, H. E. Seagi"enJ and E. J. W i t k o w s k i (OHWL), "Radiooct!.ve Wa5,t~ Disposal Operations" ;
Criteria and Techniques of Site Se lec t ion and
(a> " A n n m l Report for 1.954, OIWL-GF-55-1-212.

(a) Wastes in Operi F-CE? I ' p
E. J. 14itkoiiski, " U p r a c i n g Exper-ience i n t h e Disposal of Radioac t ive 1.0 j a
I)+. "Process Waste mate^ Treetume~i, Plant, Desig;? Cri ter ia acd Operational Data," Burns a,nd McDonell Ecgineering Comparl; , Kznsr?s City, Missoxri, ,'ob No. $5-15D.