Embed Size (px)
Citation preview

Radioactivity Monitoring of the Irish Environment 2008
RPII-01/10
M. Fegan
L. Currivan
A. Dowdall
O. Hanley
E. Hayden
K. Kelleher
S. Long
L. McKittrick
S. Somerville
J. Wong
D. Pollard
January 2010
RADIATION UNITS
Radioactivity is measured in units called becquerels (Bq). One becquerel corresponds to one radioactive disintegration per second.
When measuring radioactive discharges to the environment or referring to the content of radioactive sources used in medicine, industry and education, it is more usual to talk in terms of kilobecquerels (kBq), megabecquerels (MBq), gigabecquerels (GBq) or terabecquerels (TBq)
1 kBq = 1000 Bq 1 MBq = 1,000,000 Bq 1 GBq = 1,000,000,000 Bq 1 TBq = 1,000,000,000,000 Bq
Much lower concentrations of radioactivity are normally found in the environment and so the measurement is often reported in units of millibecquerels (mBq). There are one thousand millibecquerels in a becquerel.
1 Bq = 1000 mBq
Radiation Dose When radiation interacts with body tissues and organs, the radiation dose received is a function of factors such as the type of radiation, the part of the body affected, the exposure pathway, etc. This means that one becquerel of radioactivity will not always deliver the same radiation dose. A unit called ‘effective dose’ has been developed to take account of the differences between different types of radiation so that their biological impact can be compared directly. Effective dose is measured in units called sieverts (Sv).
The sievert is a large unit, and in practice it is more usual to measure radiation doses received by individuals in terms of fractions of a sievert.
1 sievert = 1000 millisievert (mSv) = 1,000,000 microsievert (µSv) = 1,000,000,000 nanosievert (nSv)
In RPII reports the term ‘effective dose’ is often referred to as ‘radiation dose’ or simply ‘dose’.
Collective dose is the sum of the radiation doses received by each individual in the population. This allows comparison of the total radiation dose received from different sources. Collective dose is reported in units of man sieverts (man Sv) or man millisieverts (man mSv).
Per caput dose is the collective dose divided by the total population. Per caput dose is reported in units of sieverts, or fractions of a sievert.

Radioactivity Monitoring of the Irish Environment 2008
Radioactivity Monitoring of the Irish Environment 2008
Contents
List of Figures
List of Tables
Executive Summary i
1 Introduction 1
2 Radioactivity in the Atmosphere 5
3 Radioactivity in Foodstuffs and Drinking Water 7
4 Radioactivity in the Marine Environment 8
5 Conclusions 15
6 Acknowledgements 16
7 References 17
8 Tables 19
9 Glossary of Terms 32
10 Radiation Quantities and Units 33
Appendix 1 – Screening Levels for Drinking Water 34

Radioactivity Monitoring of the Irish Environment 2008
List of Figures
Figure 1. Marine discharges of caesium-137 from Sellafield, 1953-2008 2
Figure 2. Marine discharges of technetium-99 from Sellafield, 1986-2008 3
Figure 3. Permanent monitoring network for radioactivity measurement 5
Figure 4. Off-shore sampling locations, 2008 8
Figure 5. Mean caesium-137 concentrations (mBq/l) in coastline seawater, 2008 9
Figure 6. Caesium-137 activity concentrations in seawater from Balbriggan, 1993-2008 10
Figure 7 Caesium-137 activity concentrations in seawater from locations N1-N6 in the Irish Sea, 1984-2008 10
Figure 8. Mean technetium-99 concentrations (mBq/l) in coastline seawater, 2008 11
Figure 9. Technetium-99 activity concentrations in seawater (mBq/l) from Balbriggan, 1995-2008 12
Figure 10 Mean caesium-137 activity concentrations in seaweed (Fucus vesiculosis, Bq/kg, dry) from Balbriggan, 1982 to 2008 12
Figure 11. Technetium-99 activity concentrations in seaweed (Fucus vesiculosis, Bq/kg, dry) from Balbriggan, 1989-2008 13
Figure 12 Committed effective dose to the typical seafood consumer, 1982-2008 14
Radioactivity Monitoring of the Irish Environment 2008
List of Tables
Table 1. Naturally occurring radionuclides in seawater 19
Table 2. Annual discharge limits (TBq) and actual discharges (TBq) from Sellafield to the Irish Sea, 2008 19
Table 3. Analytical techniques used in the determination of radionuclide concentrations, typical minimum
detectable activities and typical counting uncertainties 20
Table 4. Permanent monitoring network, 2008 21
Table 5a. Radioactivity in airborne particulates (low volume), Caherciveen, 2008 21
Table 5b. Radioactivity in airborne particulates (low volume), Clonskeagh, 2008 22
Table 5c. Radioactivity in airborne particulates (low volume), Cork, 2008 22
Table 5d. Radioactivity in airborne particulates (low volume), Galway, 2008 22
Table 5e. Radioactivity in airborne particulates (low volume), Glasnevin, 2008 23
Table 5f. Radioactivity in airborne particulates (low volume), Knock, 2008 23
Table 5g. Radioactivity in airborne particulates (low volume), Mullingar, 2008 23
Table 5h. Radioactivity in airborne particulates (low volume), Rosslare, 2008 24
Table 5i. Radioactivity in airborne particulates (low volume), Shannon, 2008 24
Table 6. Radioactivity in airborne particulates (high volume), Belfield (Dublin), 2008 24
Table 7. Committed effective dose due to inhalation of airborne caesium-137, 2001-2008 25
Table 8a. External gamma dose rates (terrestrial), 2008 25
Table 8b. External gamma dose rates (terrestrial), 2008 25
Table 8c. External gamma dose rates (terrestrial), 2008 26
Table 9. Radioactivity in milk, 2008 26
Table 10. Ingestion dose coefficients 26
Table 11. Committed effective dose from strontium-90, yttrium-90, caesium -137 in milk, 2008 26
Table 12. Maximum caesium-137 activity concentrations in a range of foodstuffs, 2008 27
Table 13. Gross alpha and gross beta activity concentrations in drinking water, 2008 27
Table 14. Marine monitoring programme 27
Table 15. Radioactivity in seawater, 2008 28
Table 16. Radioactivity in marine sediments, 2008 28
Table 17. Radioactivity in seaweed (Fucus vesiculosis), 2008 29
Table 18. Caesium-137 activity concentrations in fish, 2008 29
Table 19. Caesium-137 activity concentrations in shellfish, 2008 29
Table 20. Technetium-99 and plutonium-238, 239 and 240 activity concentrations in composite fish and shellfish, 2008 30
Table 21. Mean activity concentrations of artificial radionuclides in fish and shellfish landed at north-east ports, 2008 30
Table 22. Weighted consumption rates from habits survey 2008 30
Table 23. Committed effective doses from artificial radionuclides due to the consumption of fish and shellfish landed
at north-east ports, 2008 30
Table 24. Committed effective dose from selected artificial radionuclides due to the consumption of fish and shellfish,
1982-2008 31

Radioactivity Monitoring of the Irish Environment 2008 i
Executive Summary
This report presents the results of the environmental radioactivity monitoring programme carried out by the Radiological Protection Institute
of Ireland (RPII) during 2008. The RPII has routinely monitored levels of radioactivity in the Irish environment since 1982 and this is the latest
in the RPII’s series of environmental monitoring reports. The RPII reviews and updates its environmental programme annually so as to ensure
it remains relevant and continues to focus on the most important sources of radioactivity in the environment.
The principal aims of the RPII’s monitoring programme are:
n to assess the level of radioactivity to which the Irish population is exposed as a result of radioactivity in the environment.
n to study trends and establish the geographical distribution of contaminating radionuclides so as to better understand the long term
behaviour of artificial radioactivity in the food chain and the environment.
n to ensure that any increase in radiation levels resulting from an accidental release of radioactivity to the environment is detected and
assessed rapidly.
Exposure of the Population to RadioactivityThere are a number of different routes or pathways by which the public can be exposed to radiation. These include exposure by inhalation,
when radioactive material is breathed into the lungs, exposure through ingestion when radioactive material is consumed and direct or
external exposure from radioactive material.
Exposure to the Irish population from radioactivity in the environment is assessed by measuring the concentrations of radioactivity in food
and the environment and by combining this radioactivity data with food consumption rates and other habit data.
During 2008 radioactivity was measured in a wide range of food and environmental materials including: air, water, milk, seafood, foodstuffs
and complete meals.
The most significant source of artificial radioactivity in the Irish marine environment is the discharge of low level liquid radioactive waste from
the Sellafield Nuclear Fuel Reprocessing Plant on the north east coast of England. In order to assess the exposure arising from this source
extensive sampling of fish and shellfish landed at ports along the north east coast of Ireland is undertaken. The most exposed group of
individuals to discharges from Sellafield have been identified as commercial oyster and mussel farmers working along the north east coastline
and their families. Based on this data the radiation dose to a member of this most exposed group was assessed to be 0.4 µSv/y for 2008. This
dose may be compared with the average radiation dose to a person living in Ireland of 3950 µSv/y from all sources of radiation.
Man made radioactivity is also present in the terrestrial environment due primarily to residual global fallout arising primarily from atmospheric
testing of nuclear weapons in the 1950s and 1960s and releases from past nuclear accidents such as Chernobyl. Milk, because it is an
important foodstuff for infants and children and is known to concentrate long lived radionuclides such as caesium-137 and strontium-90, is
an important indicator of levels of artificial radioactivity in the terrestrial food chain. The estimated dose due to strontium-90 activity in milk
was estimated to be 0.55 µSv for 2008. This was for the most exposed age group, assessed to be infants, children under the age of one
year. It is very small compared to the background radiation. Radioactivity measurements on other foodstuffs confirm that levels of artificial
radioactivity in the Irish food-chain remain very low and that Irish foodstuffs are free from harmful levels of radioactivity.
The RPII monitors radioactivity in major drinking water supplies in rotation so that major supplies from each county are sampled at least
once every four years. During 2008 supplies from Carlow, Cavan, Clare, Cork, Donegal and Dublin were tested. Drinking water samples are
assessed for compliance with the radioactivity standards set out in the Drinking Water Directive. All drinking water samples tested during
2008 were found to be in compliance with the radioactivity standards set out in the Drinking Water Directive.

Radioactivity Monitoring of the Irish Environment 2008ii
The RPII programme also monitors airborne radioactivity through its network of on- and off-line samplers. External gamma dose rates are
also monitored. No exceptional activity was detected in outdoor air during 2008. The levels were consistent with those recorded in previous
years. For 2008 the average annual dose from inhalation of caesium-137 was estimated at 8.0 x 10⁻⁵ µSv.
Trends and Geographic distributionIn general the levels of radioactivity measured in air and terrestrial foodstuffs are very similar to those reported in recent years. This is to be
expected since these are influenced primarily by levels of residual global fallout which change very slowly.
Concentrations of radioactivity measured in the Irish marine environment are broadly similar to those reported in recent years and are
consistent with the general downward trend which has been observed over the last three decades. Figure A shows a radiation dose from
caesium -137 to the typical seafood consumer over the period 1982 to 2008.
Com
mitt
ed E
ffec
tive
Dos
e (μ
Sv)
Year
0
3
6
9
12
15
20082006200420022000199819961994199219901988198619841982
Figure A – Committed effective doses to typical seafood consumer from caesium-137, 1982-2008
In line with previous years the highest concentrations of Sellafield derived radioactivity in the Irish marine environment are found along the
north east coast. Concentrations measured south of Dublin are generally lower while concentrations measured along the south and west
coast are generally consistent with global fallout levels. Figure B shows the mean concentrations of the radionuclide caesium-137 measured
in coastal seawater during 2008.
While in general Sellafield discharges into the Irish Sea have been falling since the 1980s, discharges of the radionuclide technetium-99
increased sharply in 1994 due to changes in waste treatment at the plant. Discharges of this radionuclide peaked in 1995 and reduced
substantially after 2004 following the introduction of new waste treatment at the plant. These reductions in discharges have led to
reductions in technetium-99 activity concentrations in seafood landed at Irish ports and in the Irish marine environment. By 2008 levels
of technetium in the Irish marine environment had effectively fallen back to those observed in the early 1990s.

Radioactivity Monitoring of the Irish Environment 2008 iii
Balbriggan
Cahore
Salthill2
21
15
10
13
8
2
Ards
Portrush
Larne
Greenore18
Mountcharles2
Woodtown
Castletownbere
2
Figure B – Mean concentrations of caesium-137 measured in seawater during 2008.
Monitoring for accidental releasesThe RPII operates a national network of permanent monitoring stations which continuously assess the levels of radioactivity in the environment
through the collection of aerosol and rainwater samples and the measurement of ambient gamma dose rate. This network is designed to allow
a rapid assessment of environmental contamination to be made in the event of a radiological emergency. The locations of the permanent
monitoring stations are shown in Figure C. No abnormal levels of radioactivity were recorded at any of the stations during 2008.

Radioactivity Monitoring of the Irish Environment 2008iv
DublinBirr
Mullingar
Dundalk
Kilkenny
Kilmeadan
Shannon Airport
Galway
Kiltrough
Ballyrichard
Knock Airport
Clones
Malin Head
Belmullet
Cahirciveen
Rosslare
Cork Airport
Dublin Airport
Glasnevin
CasementBelfield
Clonskeagh
Drogheda
Figure C – Permanent monitoring network for radioactivity measurement
ConclusionThe data presented in this report confirm that while the levels of artificial radioactivity in the Irish environment are detectable they are low
and are continuing to decrease. They do not pose a significant risk to the human health of the Irish population.
Activity concentrations of radionuclides in airborne particulates were low and consistent with measurements made in recent years.
Radioactivity levels in milk, mixed diet and a wide range of foodstuffs were low and, for the majority of samples, below the detection limits.
All drinking waters tested for gross alpha and gross beta activities were found to comply with relevant national and EU standards for water
quality.
The doses incurred by the Irish public in 2008 as a result of artificial radioactivity in the marine environment are small when compared to
dose limits or to natural radiation doses received by the Irish public. The dose to the most exposed individuals, members of the oyster and
mussel farmers critical group was approximately 0.04% of the annual dose limit of 1000 µSv for members of the public from practices
involving controllable sources of radiation. These doses may also be compared with the average annual dose to a person in Ireland from
all sources of radioactivity of 3950 µSv.
In general, levels of artificial radioactivity in the Irish environment remain fairly constant and are broadly consistent with levels reported
previously. It must be emphasised that the levels of radioactive contamination present in the marine environment, do not warrant any
modification of the habits of people in Ireland, either in respect of consumption of seafood or any other use of the amenities of the
marine environment.

Radioactivity Monitoring of the Irish Environment 2008 1
This report presents the results of the environmental radioactivity monitoring programme carried out by the RPII in 2008. It is the latest
in a series of reports all of which are available on the RPII’s website www.rpii.ie.
The principal aims of the RPII’s monitoring programme are:
n to assess the level of radioactivity to which the Irish population is exposed as a result of radioactivity in the environment.
n to study trends and establish the geographical distribution of contaminating radionuclides so as to better understand the long term
behaviour of artificial radioactivity in the food chain and the environment.
n to ensure that any increases in radiation levels resulting from an accidental release of radioactivity to the environment is detected and
assessed rapidly.
Exposure to the Irish population from radioactivity in the environment is assessed by measuring the concentrations of radioactivity in food
and the environment and by combining this radioactivity data with food consumption rates and other habit data. The monitoring programme
involves the sampling and testing for radioactivity in air, drinking water, foodstuffs, fish, shellfish, seaweed, sediment and seawater as well
as the continuous measurement of external gamma radiation. The sample types and radionuclides measured are reviewed annually to ensure
that the aims of the monitoring programme continue to be achieved.
While the routine programme focuses primarily on artificial radionuclides in the environment, investigations of specific natural radiation
pathways are undertaken each year so as to improve the RPII’s overall assessment of doses to the Irish public. During 2008 the programme
included investigations into natural radioactivity in groundwater and thoron gas in indoor air. A comprehensive assessment of doses to the
Irish public was published by RPII in 2008 [Colgan et al., 2008].
Radioactivity in the EnvironmentRadioactivity from both natural and artificial origins exists throughout the environment. Natural radioactivity has been present since the
formation of the earth and is also formed in the earth’s atmosphere as a result of interactions with cosmic radiation. Inputs of artificial
origin have come from the testing of nuclear weapons in the atmosphere, accidents such as that at Chernobyl and the routine discharge
of radionuclides from nuclear installations. Once present in the environment, these radionuclides are available for uptake by fish, shellfish,
crops and animals and so make their way into the food chain.
Natural Radioactivity in the Environment
Natural radioactivity in the environment has two principal components, cosmic and primordial. Cosmic rays, originating in outer space, strike
the earth’s atmosphere generating a cascade of ionising particles. The intensity of cosmic radiation decreases with decreasing altitude and at
sea level accounts for approximately 10% of the total dose received by a typical member of the Irish public from all natural sources [Colgan
et al., 2008]. The interaction between cosmic radiation and atoms in the earth’s atmosphere produces a range of cosmogenic radionuclides
including beryllium-7 and hydrogen-3 (tritium).
At the time of the creation of the earth a range of long-lived radionuclides were present and many of these are still detectable. These
are collectively known as primordial radioactivity and include radionuclides of the uranium and thorium decay series. The most significant
contribution to human exposure due to primordial radioactivity comes from radon, which is a naturally occurring gas produced as a result
of the decay of uranium present in rocks and soil. Because radon is a gas it can seep up from the ground and may accumulate in buildings
giving rise to human exposure. Radon concentrations in Irish dwellings have been investigated extensively and the results reported by
Fennell et al., [2002]. A comprehensive study of natural radionuclides in Irish soil has been carried out by McAulay and Moran [1988].
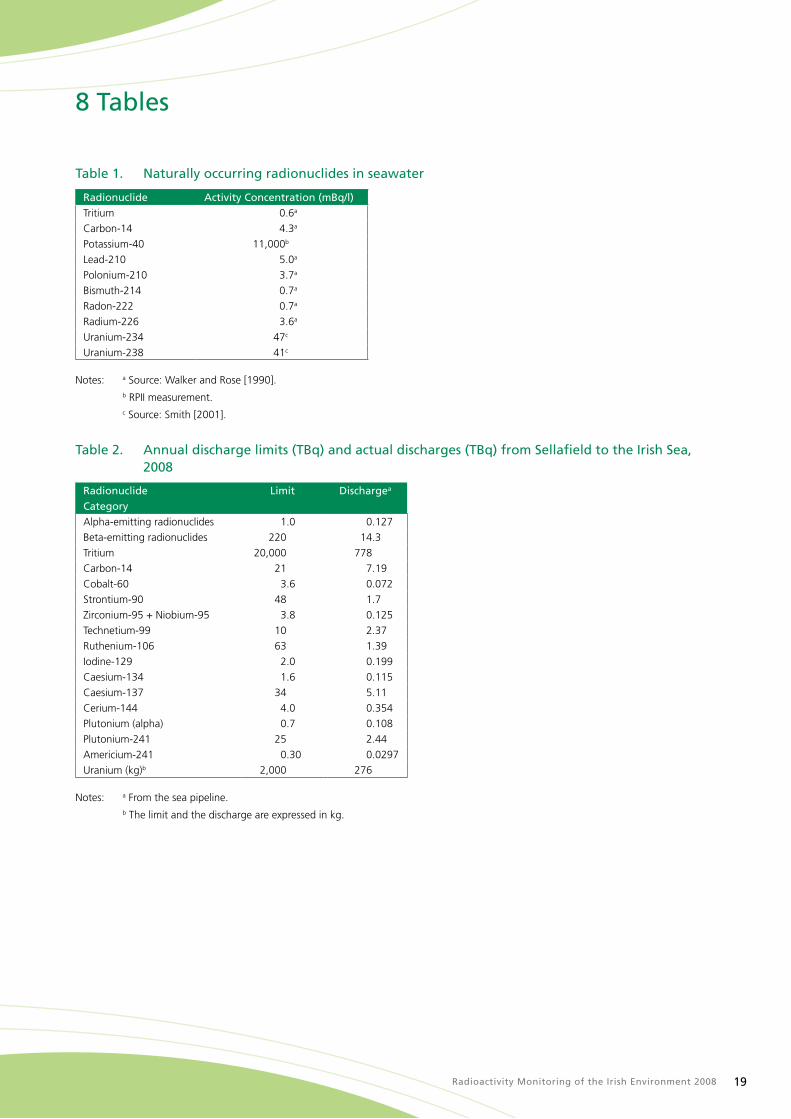
The activity concentrations of some of the naturally occurring radionuclides most commonly found in seawater are summarised in Table
1. Of these, polonium-210 is known to make the most significant contribution to radiation exposure through the consumption of marine
foodstuffs [Pollard et al., 1998].
Potassium-40, a naturally occurring radionuclide, is present in relatively large activity concentrations in the environment. However, it is
controlled by homeostatic processes in the human body [Eisenbud and Gessell, 1997] which means its equilibrium activity concentration is
normally independent of the amount consumed. Therefore, while the activity concentrations of this radionuclide in food are considerably
higher than many other natural radionuclides, its presence does not result in an increased radiological hazard.
1 Introduction
Radioactivity Monitoring of the Irish Environment 20082
Artificial Radioactivity in the Environment
More than 500 atmospheric nuclear weapons tests took place from 1945 until 1980, releasing artificial radioactive materials directly into
the atmosphere [UNSCEAR, 2000]. These included tritium, carbon-14, strontium-90, caesium-137, plutonium-238, plutonium-239 and
plutonium-240. The inventories and deposition patterns in Ireland of weapons-derived radionuclides have previously been published [Ryan,
1992; Ryan et al., 1993].
Past accidents at nuclear installations are another source of artificial radionuclides in the environment. Radiocaesium, for example, was widely
dispersed in the Irish environment and was found to be present in air, soil, vegetation and milk following the Chernobyl accident in 1986
[McAulay and Moran, 1989; Ryan, 1992; European Communities, 1998a].
During the routine operation of nuclear installations such as nuclear power plants and reprocessing plants, radioactive material can be
released to the environment. The most significant source of artificial radioactivity in the Irish marine environment is from the Sellafield nuclear
fuel reprocessing plant. The principal activities at Sellafield include fuel reprocessing, spent fuel storage, vitrification of high level radioactive
wastes, decommissioning of obsolete plants, fabrication of mixed oxide (MOX) fuel for nuclear reactors, storage of reprocessed plutonium
and, until 2003, the generation of nuclear power. These activities result in aerial discharges and the discharge of low-level liquid radioactive
waste into the eastern Irish Sea [Colgan et al., 2005]. These discharges are authorised within prescribed limits by the UK Environment
Agency. The quantities of various radionuclides discharged from Sellafield into the Irish Sea in 2008 are presented in Table 2.
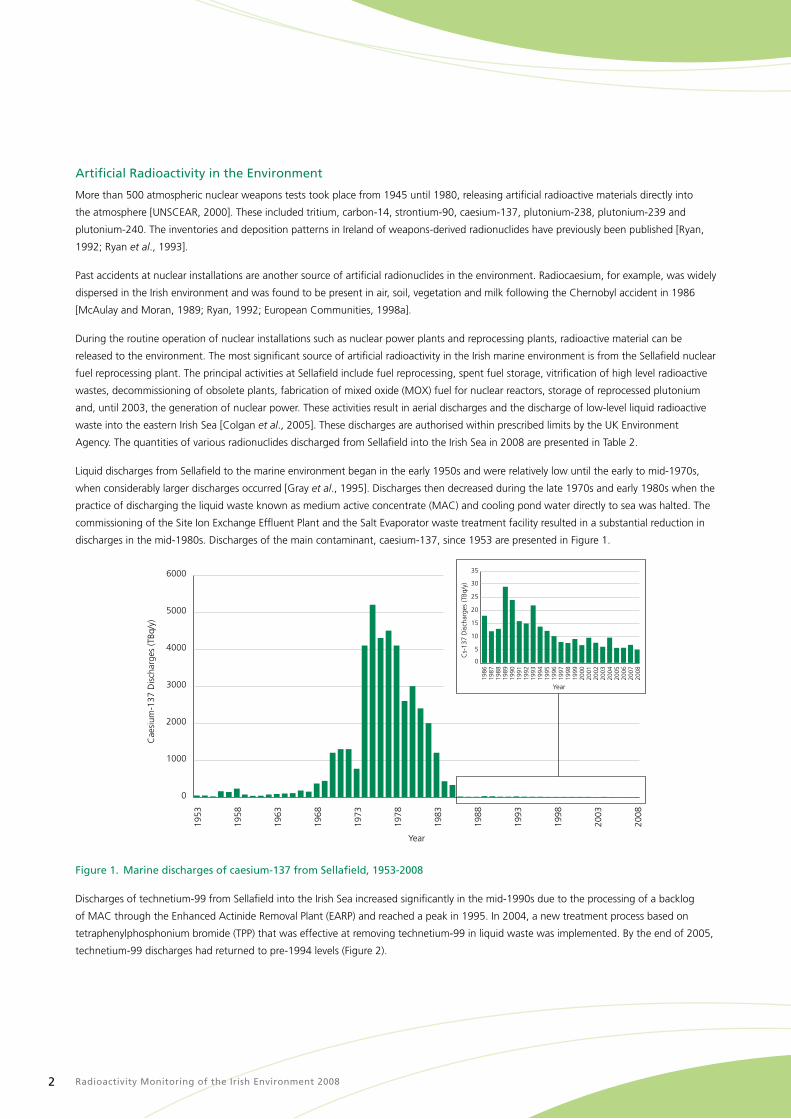
Liquid discharges from Sellafield to the marine environment began in the early 1950s and were relatively low until the early to mid-1970s,
when considerably larger discharges occurred [Gray et al., 1995]. Discharges then decreased during the late 1970s and early 1980s when the
practice of discharging the liquid waste known as medium active concentrate (MAC) and cooling pond water directly to sea was halted. The
commissioning of the Site Ion Exchange Effluent Plant and the Salt Evaporator waste treatment facility resulted in a substantial reduction in
discharges in the mid-1980s. Discharges of the main contaminant, caesium-137, since 1953 are presented in Figure 1.
0
1000
2000
3000
4000
5000
6000
1963
1968
1973
1978
1983
1988
1993
1998
2003
2008
1953
1958
Cae
sium
-137
Dis
char
ges
(TBq
/y)
Year
0
5
10
15
20
25
30
35
1986
1987
1988
1989
1990
1991
1992
1993
1994
1995
1996
1997
1998
1999
2000
2001
2002
2003
2004
2005
2006
2007
2008
Year
Cs-
137
Dis
char
ges
(TBq
/y)
Figure 1. Marine discharges of caesium-137 from Sellafield, 1953-2008
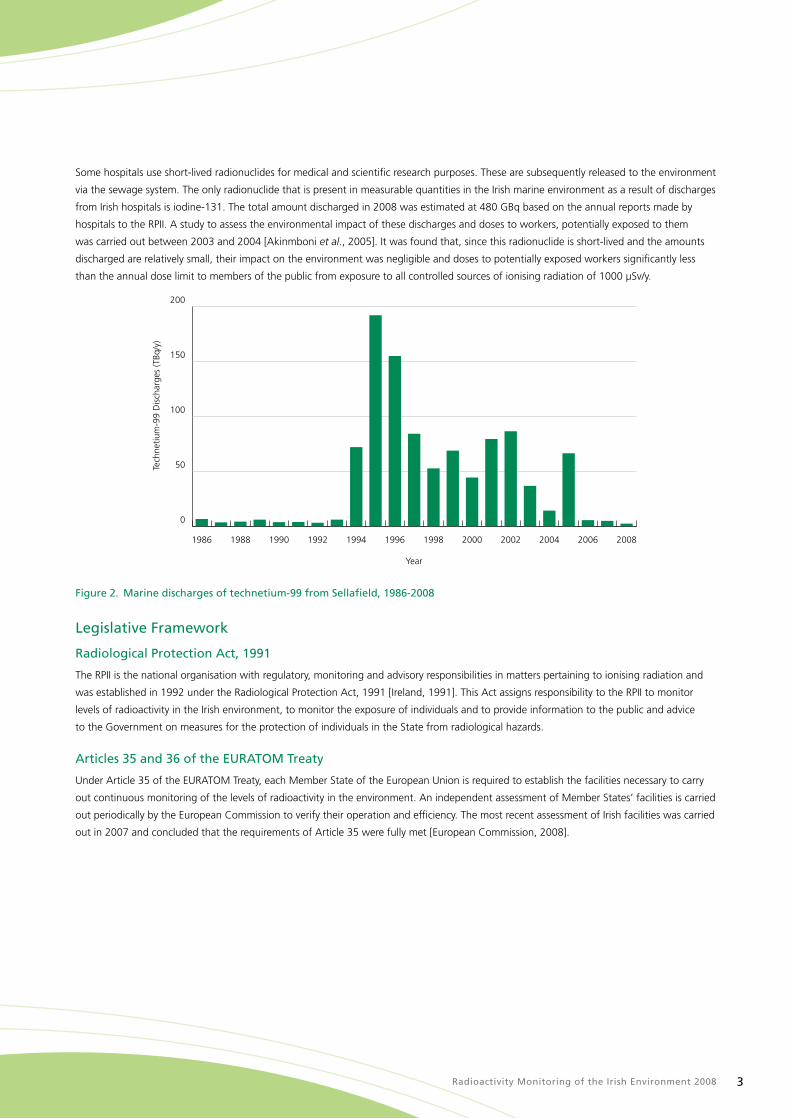
Discharges of technetium-99 from Sellafield into the Irish Sea increased significantly in the mid-1990s due to the processing of a backlog
of MAC through the Enhanced Actinide Removal Plant (EARP) and reached a peak in 1995. In 2004, a new treatment process based on
tetraphenylphosphonium bromide (TPP) that was effective at removing technetium-99 in liquid waste was implemented. By the end of 2005,
technetium-99 discharges had returned to pre-1994 levels (Figure 2).
Radioactivity Monitoring of the Irish Environment 2008 3
Some hospitals use short-lived radionuclides for medical and scientific research purposes. These are subsequently released to the environment
via the sewage system. The only radionuclide that is present in measurable quantities in the Irish marine environment as a result of discharges
from Irish hospitals is iodine-131. The total amount discharged in 2008 was estimated at 480 GBq based on the annual reports made by
hospitals to the RPII. A study to assess the environmental impact of these discharges and doses to workers, potentially exposed to them
was carried out between 2003 and 2004 [Akinmboni et al., 2005]. It was found that, since this radionuclide is short-lived and the amounts
discharged are relatively small, their impact on the environment was negligible and doses to potentially exposed workers significantly less
than the annual dose limit to members of the public from exposure to all controlled sources of ionising radiation of 1000 µSv/y.
Tech
netiu
m-9
9 D
isch
arge
s (T
Bq/y
)
Year
0
50
100
150
200
200820062004200220001998199619941992199019881986
Figure 2. Marine discharges of technetium-99 from Sellafield, 1986-2008
Legislative Framework
Radiological Protection Act, 1991
The RPII is the national organisation with regulatory, monitoring and advisory responsibilities in matters pertaining to ionising radiation and
was established in 1992 under the Radiological Protection Act, 1991 [Ireland, 1991]. This Act assigns responsibility to the RPII to monitor
levels of radioactivity in the Irish environment, to monitor the exposure of individuals and to provide information to the public and advice
to the Government on measures for the protection of individuals in the State from radiological hazards.
Articles 35 and 36 of the EURATOM Treaty
Under Article 35 of the EURATOM Treaty, each Member State of the European Union is required to establish the facilities necessary to carry
out continuous monitoring of the levels of radioactivity in the environment. An independent assessment of Member States’ facilities is carried
out periodically by the European Commission to verify their operation and efficiency. The most recent assessment of Irish facilities was carried
out in 2007 and concluded that the requirements of Article 35 were fully met [European Commission, 2008].

Radioactivity Monitoring of the Irish Environment 20084
In addition, Article 36 of the EURATOM Treaty requires that data arising from this programme be communicated periodically to the European
Commission. In fulfilment of this requirement, the RPII transmits the results of its monitoring programme to the Commission on an annual
basis. The Joint Research Centre at Ispra in Italy maintains a database of Member States’ environmental radioactivity measurements on behalf
of the Commission and publishes compilations of these data periodically in the EU Environmental Radioactivity Series [European Commission,
2009].
Commission Recommendation 2000/473/EURATOM [European Commission, 2000] on the application of Article 36 of the EURATOM treaty
gives specific guidance on the monitoring of the levels of radioactivity in the environment for the purpose of assessing the exposure of the
population as a whole. This Recommendation gives specific guidance as to the structure of monitoring networks, the media that should be
sampled, the types of measurement, the radionuclides to be monitored and the sampling frequencies.
Oslo Paris Convention
The Oslo Paris (OSPAR) Convention sets out a framework for international cooperation on the protection of the marine environment of the
North-East Atlantic. OSPAR (www.ospar.org) aims to achieve further reductions in artificial radioactivity levels in the marine environment
through the implementation of the OSPAR Radioactive Substances Strategy. All signatories to the Strategy are committed to progressive and
substantial reductions in radioactive discharges from their facilities. An essential part of this strategy is an effective monitoring programme
for concentrations of radioactive substances in the marine environment so that progress in achieving the OSPAR aims can be measured.
This is achieved through collaboration between the Contracting Parties in regular monitoring and assessment of radioactivity in the marine
environment. The RPII provides data to this programme annually from its marine monitoring programme.
Drinking Water Directive
Council Directive 98/83/EC [European Communities, 1998b] on the quality of water intended for human consumption, hereafter referred
to as the Drinking Water Directive, sets out limit values for microbiological, chemical and radioactivity parameters. The overall objective
of this Directive is to protect human health from the adverse effects of any contamination of water intended for human consumption.
Practical arrangements for assessing compliance with this Directive are set out in Appendix 1
Quality Assurance and ResultsThe RPII places a strong emphasis on quality assurance and reliability of data. Best practice is ensured by accreditation of test procedures,
through the Irish National Accreditation Board, to International Standard ISO/IEC 17025 [INAB, 2008]. Analytical techniques are validated
both through exchange of samples with other laboratories and through analysis of certified reference materials for proficiency testing. The
RPII’s laboratory participates in an active programme of intercomparison exercises, which provide independent evaluation of the quality and
robustness of analyses. During 2008 these included those organised by the International Atomic Energy Agency (IAEA), the National Physics
Laboratory (NPL) in the UK and the Norwegian Radiation Protection Agency (NRPA) in Norway. Details regarding the analytical techniques
used are given in Table 3.
All results quoted are decay corrected to the date of sampling, while bulked samples are decay corrected to the middle of the bulking period.
Seaweed samples, because of the variability in moisture content, are quoted on a dry weight basis while all other solid marine samples are
quoted on a fresh weight basis. Typical detection limits and uncertainties for each analytical technique are detailed in Table 3. Uncertainties
are calculated in accordance with the ISO Guide to the Expression of Uncertainty in Measurement [ISO, 1995]. Where calculated, mean
activity concentrations relate to samples with activities above the limit of detection.

Radioactivity Monitoring of the Irish Environment 2008 5
The Permanent Monitoring Station NetworkThe RPII continuously assesses the level of radioactivity in the environment through the collection of aerosol and rain water samples and the
measurement of ambient gamma dose rate at a network of permanent monitoring stations located throughout the country. This network is
designed to allow a rapid assessment of environmental contamination to be made in the event of a radiological emergency; a core objective
of the RPII’s monitoring programme. The location of the stations and the measurements undertaken at each are set out in Figure 3 and Table
4 respectively.
DublinBirr
Mullingar
Dundalk
Kilkenny
Kilmeadan
Shannon Airport
Galway
Kiltrough
Ballyrichard
Knock Airport
Clones
Malin Head
Belmullet
Cahirciveen
Rosslare
Cork Airport
Dublin Airport
Glasnevin
CasementBelfield
Clonskeagh
Drogheda
Figure 3. Permanent monitoring network for radioactivity measurement
Airborne Radioactivity
The RPII’s air sampling network includes both on-line and off-line aerosol samplers. With the on–line system radioactivity is measured on the
air filter at the site and the data is relayed directly to a central computer in the RPII offices in Clonskeagh while with the off-line system the
filters are transported to Clonskeagh for laboratory analysis. The on-line systems automatically correct for the natural radiation component
due to radon daughters and so the readings transmitted back to RPII are a direct estimate of the concentrations of airborne artificial
radionuclides. The network includes one high volume particulate sampler which allows ambient background levels of radioactivity in air to
be measured. During 2008, the RPII continued to upgrade its air sampling stations so that the network now includes 4 on-line and 8 off-line
stations.
Low volume particulates from the off-line stations were collected over a period of approximately one week by using a pump to draw air
continuously through a glass microfibre filter with a diameter of 47 mm. The volume of air sampled ranged between 500 and 1800 m3.
The glass microfibre filters were stored in a dust-free environment for five days before analysis to ensure that short-lived naturally occurring
radionuclides such as bismuth-214 and lead-214 had decayed below detectable levels prior to measurement. One filter from each monitoring
station was analysed each month for gross beta activity and the gamma emitting radionuclides caesium-137 and beryllium-7. Airborne
caesium-137 concentrations arise primarily from residual weapons fallout and aerial discharges from the nuclear fuel cycle, while beryllium-7
is a naturally occurring radionuclide and was measured for quality control purposes. The other filters were archived for analysis if required.
2 Radioactivity in the Atmosphere

Radioactivity Monitoring of the Irish Environment 20086
The activity concentrations in low volume airborne particulates measured at the off-line monitoring stations are presented in Tables 5a – 5i.
The activity concentrations measured in air in 2008 at these stations were consistent with the pattern of background radioactivity reported in
previous years [Fegan et al., 2008]. Continuous on-line gross alpha and beta radioactivity in air measurements were collected at Clonskeagh
in Dublin, Drogheda and Dundalk in Co. Louth and at Kilmeaden in Co. Waterford. No airborne artificial radioactivity was detected at any of
the on-line stations during 2008.
High volume particulate samples were collected at Belfield (Dublin) during 2008 over a sampling period of approximately four weeks per filter
with a typical airflow rate of between 2,000 and 2,500 m3/h. These filters were analysed by high resolution gamma spectrometry. The activity
concentrations of caesium-137 and beryllium-7 are given in Table 6. The data was consistent with measurements made in previous years and
with expected concentrations arising from global circulation of weapons test fallout [European Commission, 2009].
The radiation dose due to inhalation of airborne caesium-137 (as measured in high volume airborne particulates) was calculated using
committed dose coefficients set out in the Basic Safety Standards Directive [European Commission, 1996]. This was calculated to be
8.0 x 10⁻⁵ µSv, which is similar to the values reported in recent years (Table 7).
External Gamma Dose Rate
The external gamma dose rate at fifteen stations is recorded every minute and hourly readings are automatically transmitted to the RPII’s
database at its Clonskeagh office. This network is an important component of the RPII’s early warning arrangements for elevated levels of
radioactivity in the atmosphere. Recent data from each station can be viewed on the RPII website (www.rpii.ie/Monitoring-Stations.aspx).
Each station is fitted with an alarm which is triggered in the event of a high reading or technical failure.
The minimum and maximum external gamma dose rate readings for each month, at each of the fifteen stations around the Republic of
Ireland, are presented in Tables 8a – 8c. The ranges were similar to those reported in previous years. No abnormally high readings were
observed at any of the fifteen stations during the reporting period.
Rainwater
Rainwater was collected continuously at thirteen stations as indicated in Table 4 so that, in the event of an accidental release of radioactivity
into the atmosphere, concentrations in rainwater could quickly be assessed. There were no incidents during the reporting period that
warranted the analysis of these samples.
Natural Radioactivity in Air
The dose assessment of the Irish population published in 2008 had recognised that the data available on indoor levels of thoron and thoron
decay products in Irish homes was very limited [Colgan et al., 2008]. Thoron is a naturally occurring radioactive gas, with a short half life
of 56 seconds. It is produced from thorium-232, one of the radioactive elements found throughout the earth’s crust. Because of its short
half life penetration of thoron into houses from the underlying rock and soil is thought to be very limited and hence the principal source
of thoron in indoor air is building materials.
In order to improve the RPII’s overall assessment of doses to the Irish public from all sources of radiation, a national population weighted
survey of thoron in indoor air in Irish homes was commenced during 2008. This national survey is being undertaken in collaboration with
University College Dublin and the National Institute of Science in Japan. Homes in Cork, Dublin, Galway and Limerick were chosen to be
representative of major population centres and major house types. When complete, findings will be published and will be available on the
RPII website.
Radioactivity Monitoring of the Irish Environment 2008 7
3 Radioactivity in Foodstuffs and Drinking Water
Foodstuffs
The Commission Recommendation 2000/473/EURATOM advises the routine measurement of radioactivity in milk and mixed diet.
Measurement of caesium-137 and strontium-90 in milk is advised as these radionuclides may concentrate in milk in the event of an
accidental release of radioactivity. Milk is also of particular importance as a foodstuff for infants and children.
Sampling of milk was conducted monthly at four processing plants covering a wide geographic area. Samples were bulked quarterly
and analysed for strontium-90 and caesium-137.
Table 9 presents the results of measurements of radioactivity in composite milk samples for 2008. In all cases where strontium-90 and
caesium-137 were detected in samples the activities were less than 1 Bq/l. It should be noted that, because of the difference in analytical
techniques, the detection limit for strontium-90 is lower than that for caesium-137 (Table 3).
Ingestion doses were calculated using age-dependent dose coefficients [ICRP, 1996] (Table 10). Milk consumption rates were obtained from
two sources: the North/South Ireland Food Consumption Survey [NSIFCS, 2001] was used for adults while the 1993 UNSCEAR report on the
Sources and Effects of Ionizing Radiation [UNSCEAR, 1993] was used for infants. Based on these, the mean full-milk consumption for an
adult male and an infant in Ireland is 178 kg/y and 120 kg/y, respectively.
The committed effective dose to infants and adults from the consumption of milk was estimated for strontium-90 and caesium-137.
In calculating the dose for strontium-90 it is assumed that its daughter product yttrium-90 is in equilibrium. The calculated dose for
consumption of milk is dominated by strontium-90 as can be seen in Table 11. The category, infants (children under the age of one year),
received the highest estimated strontium-90 dose of 0.55 µSv.
During the reporting period, 10 samples of complete meals (mixed diet) were collected from restaurant facilities in Cork, Dublin, Galway and
Drogheda Co. Louth and analysed for gamma emitting radionuclides. Samples of grain from the main areas of production were supplied
by the Department of Agriculture Food and Fisheries and analysed by RPII for gamma emitting radionuclides. In addition a range of meat,
dairy and miscellaneous food types were analysed for gamma emitting radionuclides as part of the product certification programme. The
maximum caesium-137 concentrations measured in mixed diet, grain and product certification samples during 2008 are presented in Table
12. All other radionuclides were below the limit of detection.
Drinking Water
The RPII has monitored radioactivity in drinking water supplies since 1982. This monitoring has focused primarily on major surface drinking
water supplies serving large populations. Currently the RPII routinely measures samples from major water supplies in rotation so that supplies
from every county are sampled approximately every four years. Major supplies are defined here as supplies serving a population of 10,000 or
greater or the largest supply in a county.
Where possible, drinking water was sampled at the point at which the treated water was released into the distribution network. Drinking
water samples were acidified with nitric acid as soon as practicable after sampling to minimise the adsorption of radioactivity on the walls
of the sample container. Samples were evaporated to dryness and analysed for gross alpha and gross beta activities respectively.
Drinking water samples were assessed for compliance with the radioactivity parameters set out in the Drinking Water Directive using
the WHO methodology [WHO, 1993] as described in Appendix 1. This methodology sets screening limits based on gross alpha and beta
activities. The results of measurements for the RPII’s routine monitoring programme of major supplies are presented in Table 13. In 2008
supplies from Carlow, Cavan, Clare, Cork, Donegal and Dublin were tested. For all supplies monitored in 2008, the measured radioactivity
concentrations were below the screening levels for gross alpha and gross beta. Consequently, these drinking water supplies are considered
to be in compliance with the radioactivity standards set out in the Drinking Water Directive.
In Ireland the majority of drinking water (83.7%) originates from surface water (i.e. rivers and lakes) with the remainder originating from
groundwater (8.8%) and springs (7.5%) [EPA, 2009]. At present there is no comprehensive national picture concerning radioactivity in
groundwater supplies or private wells in Ireland. To address this, the RPII has commenced a national survey of radioactivity in groundwater
supplies. During the course of this study, approximately 220 groundwater supplies will be assessed for compliance with the radioactivity
parameters set out in the Drinking Water Directive by RPII while the Environmental Protection Agency (EPA) will measure chemical parameters
including uranium for the same groundwater supplies. It has been shown previously by Sequeira et al., [1999] that uranium may dominate
the total alpha activity concentration in Irish groundwater supplies. Therefore using the EPA’s uranium data, the contribution from uranium
to gross alpha activity will be examined. When complete, the findings will be published and will also be available on the RPII website.

Radioactivity Monitoring of the Irish Environment 20088
Marine RadioactivityThe primary focus of the marine monitoring programme is to assess the radiation doses to the Irish population arising from discharges from
the Sellafield reprocessing plant and to assess the geographic and temporal distribution of artificial radionuclides in the marine environment.
The nuclides of greatest concern from a dosimetric point of view are caesium-137, technetium-99 and isotopes of plutonium. These
radionuclides are measured in seafood to determine the ingestion dose to the Irish public. Both technetium-99 and caesium-137 are measured
in seawater and seaweed to assess geographic and temporal trends. Caesium-137 is also measured in sediment samples from the Irish Sea.
Samples of a wide range of fish and shellfish species were collected from commercial landings at major Irish fishing ports and aquaculture
areas. Seawater and seaweed were also collected from coastal sites while seawater and sediment samples were taken at offshore sites in the
western Irish Sea using the Marine Institute’s research vessel, the Celtic Voyager. In collaboration with the Environment and Heritage Service,
Northern Ireland, three seawater samples from the north and north-east coast were collected from Portrush, Larne and Ards.
The range of samples collected at each location is given in Table 14 and the offshore locations are shown in Figure 4. The sampling frequency
for each site, which ranged from monthly to once every two years, reflects the resolution judged necessary to assess the population dose and
to identify important trends.
Initial preparation of fish and shellfish samples included cleaning and separation of the edible portion for analysis. Seaweed samples were
washed to remove all sediment and other extraneous material. Fish, shellfish, seaweed and sediment samples were then dried to constant
weight, pulverised and thoroughly mixed. Samples were analysed for caesium-137. Selected individual and bulked samples were analysed for
technetium-99, plutonium-238 and plutonium-239,240. Seawater (coastal and offshore) was analysed for caesium-137 and technetium-99
using techniques outlined in Table 3.
North Channel
Isle of
Man
N6
N2 N3
N1
N5 N4
Dublin
Sellafield
IRISH SEA
Figure 4. Off-shore sampling locations, 2008
Habits Survey
In 2008 the RPII commissioned a habits survey [Cefas, 2008] along the north-east coast of Ireland. The aim of this survey was to identify the
most important pathways by which people living in Ireland are exposed to ionising radiation as a result of discharges of radioactive materials
into the Irish Sea and to collect quantitative information on fish consumption, beach occupancy and other potential exposure routes to allow
realistic dose assessments to be made. This work was undertaken by the Centre for Environment, Fisheries and Aquaculture Science (Cefas).
4 Radioactivity in the Marine Environment

Radioactivity Monitoring of the Irish Environment 2008 9
Previously, no detailed surveys had been undertaken in the Republic of Ireland of habit data relevant to the assessment of doses to the
population from radioactivity in the marine environment. Instead, RPII dose assessments were made on the basis of assumed or estimated
data inferred from habits surveys undertaken elsewhere and from national average consumption figures. The RPII has previously reported
doses for two hypothetical or notional seafood consumers referred to as the typical consumer and the heavy consumer. The typical consumer
was intended to represent the dose received by an average seafood consumer while the heavy consumer represents a conservative estimate
of the dose to a high-rate consumer.
This habits survey area included the coastline from Clogherhead to Omeath in Co. Louth and commercial fishing ports north of Dublin. This
is the area in which the highest levels of radioactivity attributable to Sellafield are observed. Specifically, investigations were conducted into
the consumption of aquatic foods, the occupancy of intertidal areas, the handling of fishing gear and catch, the handling of sediment, the
occupancy in and on water, and any unusual exposure pathways.
The habits survey identified two critical groups, referred to as Group A and Group B. Group A were a group of commercial fishermen who
consume large amounts of fish and crustaceans (mainly prawns and crabs). Group B were commercial oyster and mussel farmers who
consume large amounts of molluscs.
Seawater
The results of the analyses of caesium-137 and technetium-99 in coastline and offshore (western Irish Sea) seawater are presented in Table
15. The mean activity concentrations of caesium-137 at each coastal location in 2008 (Figure 5) are in line with the previously established
geographical distribution of caesium-137 around the Irish coastline. The highest concentrations of Sellafield-derived caesium-137 are found
on the north-east coast which is consistent with the known water circulation patterns in the Irish Sea.
Balbriggan
Cahore
Salthill2
21
15
10
13
8
2
Ards
Portrush
Larne
Greenore18
Mountcharles2
Woodtown
Castletownbere
2
Figure 5. Mean caesium-137 concentrations (mBq/l) in coastline seawater, 2008

Radioactivity Monitoring of the Irish Environment 200810
80
70
60
50
40
30
20
10
0
Dec
93
Dec
94
Dec
95
Dec
96
Dec
97
Dec
98
Dec
99
Dec
00
Dec
01
Dec
02
Dec
03
Dec
04
Dec
05
Dec
07
Dec
08
Dec
06
Year
Cae
sium
-137
(mBq
/I)
Figure 6. Caesium-137 activity concentrations in seawater from Balbriggan, 1993-2008
Caesium-137 activity concentrations in seawater from Balbriggan between 1993 and 2008 are shown in Figure 6. The data reveals a
downward trend in the period 1993-2000, which reflects the reduction in caesium-137 discharges from Sellafield during this period (Figure
1). Since 2000, discharges have remained relatively constant and this is reflected in seawater activity concentrations measured between 2000
and 2008. It has been shown that remobilisation of historic discharges into the water column from sediments is now an important source
of caesium-137 in seawater from the western Irish Sea [Poole et al., 1997]. This may also help to explain the levelling off of caesium-137
concentrations observed in recent years. A similar trend is observed in caesium-137 activity concentrations in seawater at offshore locations
in the Irish Sea between 1984 and 2008 (Figure 7). The caesium-137 activity concentrations measured along the south and west coasts in
2008 are lower than those in the Irish Sea and are now close to global fallout levels. Concentrations in seawater from along these coasts
have remained similar since the mid-1990s.
Cae
sium
-137
(mBq
/l)
Year
N1
N2
N3
N4
N5
N6
0
50
100
150
200
250
300
350
200820062004200220001998199619941992199019881986
0
50
100
150
200
250
300
350
N6
N5
N4
N3
N2
N1
200820072006200520042003200220012000199919981997199619951994199319921991199019891988198719861985
Figure 7. Caesium-137 activity concentrations in seawater from locations N1-N6 in the Irish Sea, 1984-2008

Radioactivity Monitoring of the Irish Environment 2008 11
Balbriggan
Cahore
Salthill0.2
3
5
2
5
2
0.6
Ards
Portrush
Larne
Greenore5
Mountcharlesnd
Dunmore East
Castletownbere
0.5
Figure 8. Mean technetium-99 concentrations (mBq/l) in coastline seawater, 2008
The mean activity concentrations of technetium-99 in seawater from around the Irish coastline in 2008 are shown in Figure 8. The
geographical distribution is consistent with that of caesium-137 with the highest concentrations on the north-east coast. The mean annual
activity concentration at both Balbriggan and at Greenore in 2008 was 5 mBq/l.
Technetium-99 activity concentrations in seawater from Balbriggan for the period 1995 to 2008 are presented in Figure 9. It can be seen
from these data that activity concentrations at this site peaked in 1997 with a mean annual activity concentration of 45 mBq/l. Following
the implementation of the tetraphenylphosphonium bromide waste treatment process at Sellafield in 2004 there has been a reduction in
the discharges of this radionuclide and corresponding reductions in activity concentrations in seawater can be observed.

Radioactivity Monitoring of the Irish Environment 200812
1995
1996
Tech
netiu
m-9
9 (m
Bq/I)
1997
1998
1999
2000
2001
Year
70
60
50
40
30
20
10
020
02
2003
2004
2005
2006
2007
2008
2009
Figure 9. Technetium-99 activity concentrations in seawater (mBq/l) from Balbriggan, 1995-2008
Sediment
Caesium-137 activity concentrations in sediment samples collected at the off-shore sampling sites are shown in Table 16. These
measurements are consistent with the data reported for the same stations in recent RPII monitoring reports [Fegan et al., 2008]
Seaweed
The results for caesium-137 and technetium-99 activity concentrations in seaweed (Fucus vesiculosis) are given in Table 17. These results
are presented on a dry weight basis and an estimate of the fresh weight activity concentration may be obtained using the mean dry to
fresh weight ratio of 0.17 calculated for 2008 samples.
Figure 10 presents mean caesium-137 activity concentrations in seaweed sampled from Balbriggan between 1982 and 2008. These
data show that concentrations of this radionuclide in seaweed at this site have remained relatively constant since the mid-1990s.
0
50
100
150
200
250
20082006200420022000199819961994199219901988198619841982
Cae
sium
-137
(Bq/
kg, d
ry)
Year
Figure 10. Mean caesium-137 activity concentrations in seaweed (Fucus vesiculosis, Bq/kg, dry) from Balbriggan, 1982 to 2008
Radioactivity Monitoring of the Irish Environment 2008 13
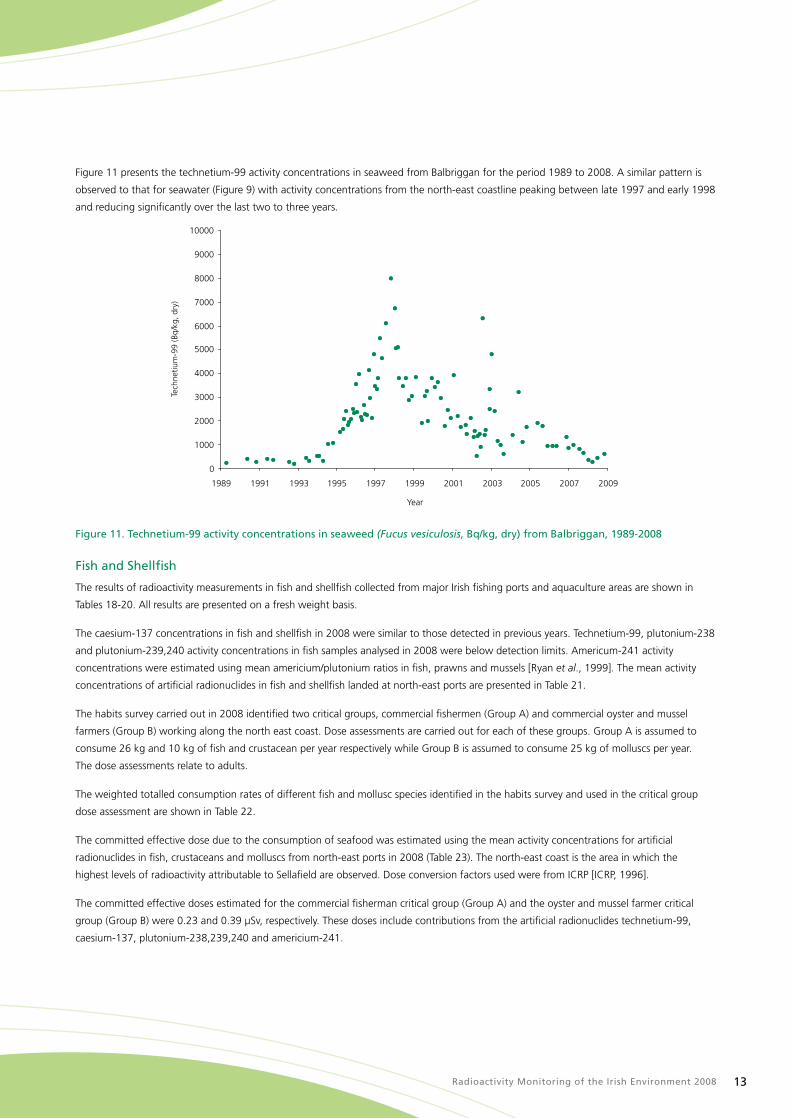
Figure 11 presents the technetium-99 activity concentrations in seaweed from Balbriggan for the period 1989 to 2008. A similar pattern is
observed to that for seawater (Figure 9) with activity concentrations from the north-east coastline peaking between late 1997 and early 1998
and reducing significantly over the last two to three years.
Tech
netiu
m-9
9 (B
q/kg
, dry
)
0
1000
2000
3000
4000
5000
6000
7000
8000
9000
10000
1989 1991 1993 1995 1997 1999 2001 2003 2005 2007 2009
Year
Figure 11. Technetium-99 activity concentrations in seaweed (Fucus vesiculosis, Bq/kg, dry) from Balbriggan, 1989-2008
Fish and Shellfish
The results of radioactivity measurements in fish and shellfish collected from major Irish fishing ports and aquaculture areas are shown in
Tables 18-20. All results are presented on a fresh weight basis.
The caesium-137 concentrations in fish and shellfish in 2008 were similar to those detected in previous years. Technetium-99, plutonium-238
and plutonium-239,240 activity concentrations in fish samples analysed in 2008 were below detection limits. Americum-241 activity
concentrations were estimated using mean americium/plutonium ratios in fish, prawns and mussels [Ryan et al., 1999]. The mean activity
concentrations of artificial radionuclides in fish and shellfish landed at north-east ports are presented in Table 21.
The habits survey carried out in 2008 identified two critical groups, commercial fishermen (Group A) and commercial oyster and mussel
farmers (Group B) working along the north east coast. Dose assessments are carried out for each of these groups. Group A is assumed to
consume 26 kg and 10 kg of fish and crustacean per year respectively while Group B is assumed to consume 25 kg of molluscs per year.
The dose assessments relate to adults.
The weighted totalled consumption rates of different fish and mollusc species identified in the habits survey and used in the critical group
dose assessment are shown in Table 22.
The committed effective dose due to the consumption of seafood was estimated using the mean activity concentrations for artificial
radionuclides in fish, crustaceans and molluscs from north-east ports in 2008 (Table 23). The north-east coast is the area in which the
highest levels of radioactivity attributable to Sellafield are observed. Dose conversion factors used were from ICRP [ICRP, 1996].
The committed effective doses estimated for the commercial fisherman critical group (Group A) and the oyster and mussel farmer critical
group (Group B) were 0.23 and 0.39 µSv, respectively. These doses include contributions from the artificial radionuclides technetium-99,
caesium-137, plutonium-238,239,240 and americium-241.

Radioactivity Monitoring of the Irish Environment 200814
To allow comparison with previous years, the doses calculated for the notional typical and heavy consumers previously reported in RPII
monitoring reports are also included here. The consumption rates for typical and heavy consumers were 40g and 5g of fish and shellfish per
day respectively (15 and 1.8 kg per year respectively) and 200g and 20g of fish and shellfish per day respectively (7.3 and 73 kg per year
respectively). For both the typical and heavy consumer, shellfish consumption was assumed to be divided equally between crustaceans and
molluscs and activity concentrations in prawns and mussels were considered to be representative of crustaceans and molluscs, respectively.
The committed effective doses estimated for the notional typical and heavy consumer groups are 0.09 µSv and 0.38 µSv, respectively. Dose
data for critical and notional consumer groups are summarised in Table 23.
It is noted that the doses received by members of the two critical groups identified in the habits survey fall within the range previously
estimated by the RPII on the basis of notional consumer groups. The annual committed effective dose to the notional typical seafood
consumer for the period 1982 to 2008 is shown in Figure 12 and Table 24. It can be seen that annual doses have decreased steadily
over this period, reflecting the overall reduction in Sellafield discharges.
In 2008, the committed effective dose of 0.23 µSv to Group A consumers is less than 0.03% of the annual dose limit of 1000 µSv for
members of the public from practices involving controllable sources of radiation [Ireland, 2000.] The dominant contributors to this dose
are caesium-137 (55%) and technetium-99 (27%).
The annual committed effective dose of 0.39 µSv to Group B consumers is less than 0.04% of the annual dose limit to members of the
public of 1000 µSv. The dominant contributors to this dose are plutonium-238, 239, 240 (62%) and americium (20%). The higher dose
to this group may be attributed to the relatively high dose coefficients for plutonium-238, 239, 240 and americium-241.
These doses may be compared with those attributable to the presence in seafood of the naturally occurring radionuclide, polonium-210,
which were estimated to be 32 µSv for the notional typical consumers [Pollard et al., 1998].
0
3
6
9
12
15
20082006200420022000199819961994199219901988198619841982
Com
mitt
ed E
ffec
tive
Dos
e (µ
Sv)
Year
Figure 12. Committed effective dose to the typical seafood consumer, 1982-2008

Radioactivity Monitoring of the Irish Environment 2008 15
5 Conclusions
During 2008, the RPII implemented a comprehensive programme of monitoring radioactivity in the Irish environment, which included
the measurement of radioactivity in a wide range of foodstuffs and environmental matrices.
Activity concentrations of radionuclides in airborne particulates were low and consistent with measurements made in recent years. No
abnormal external gamma dose rates were observed at any of the continuous monitoring stations.
All drinking waters tested were found to comply with relevant national and EU standards for water quality. Radioactivity levels in milk,
mixed diet and a wide range of foodstuffs were low and, for the majority of samples, below the detection limits.
The consumption of fish and shellfish from the Irish Sea continued to be the dominant pathway by which radioactive contamination
of the marine environment resulted in radiation exposure of the Irish population.
During 2008 a habits survey was conducted along the north-east coast of Ireland. The aim of this survey was to identify the critical pathways
by which people living in Ireland are exposed to ionising radiation as a result of discharges of radioactive materials into the Irish Sea. Two
critical groups were identified: commercial fishermen who consume large quantities of fish and crustaceans and commercial oyster and
mussel farmers who consumes large amounts of molluscs. The estimated annual committed effective doses to members of these two groups
were 0.23 µSv and 0.39 µSv, respectively.
The doses incurred by the Irish public in 2008 as a result of artificial radioactivity in the environment are small when compared to national
dose limits or natural radiation doses received by the Irish public. The dose to the most exposed individuals, members of the oyster and
mussel farmers critical group was approximately 0.04% of the annual dose limit of 1000 µSv for members of the public from practices
involving controllable sources of radiation. These doses are small in comparison with the dose received (32 µSv ) by the notional typical
consumer due to the presence of the naturally-occurring radionuclide, polonium-210, in seafood. They may also be compared with the
average annual dose to a person in Ireland from all sources of radioactivity of 3950 µSv.
In general, levels of artificial radioactivity in the Irish environment remain fairly constant and are broadly consistent with levels reported
previously. It must be emphasised that the levels of radioactive contamination present in the marine environment, do not warrant any
modification of the habits of people in Ireland, either in respect of consumption of seafood or any other use of the amenities of the
marine environment.
In summary, the results of the 2008 monitoring programme show that, while the levels of artificial radioactivity in the Irish environment
remain detectable, they are low and do not pose a significant risk to human health.
Radioactivity Monitoring of the Irish Environment 200816
6 Acknowledgements
The authors gratefully acknowledge the assistance of the Department of Agriculture, Food and Fisheries and the Marine Institute. In
particular, the assistance of the Sea Fisheries Officers and the captain and crew of the RV Celtic Voyager is acknowledged.
The valuable assistance provided by the officers of Met Éireann in the operation of the permanent monitoring network and the collection of
air filter and rainwater samples is gratefully acknowledged.
Furthermore, the assistance provided by the Department of the Environment, Heritage and Local Government, the Department of Defence,
the National University of Ireland, Cork, Dublin and Galway, the Food Safety Authority of Ireland, local authorities and town councils,
commercial producers and the Health Service Executive in supplying and processing samples is acknowledged with gratitude.
The ongoing collaboration of the Environment and Heritage Service in Northern Ireland in providing samples is also acknowledged.
Finally, other RPII staff that provided analytical support and assistance in the preparation of this publication are also acknowledged.

Radioactivity Monitoring of the Irish Environment 2008 17
Akinmboni, R., McMahon, C.A., Long, S.C., Colgan, P.A., 2005. Environmental impact assessment of Iodine-131 discharged from hospitals
in Ireland’. In: Proceedings of the 3rd International Environmental Radioactivity Conference, Nice, October, 2005.
Baker, C.W., 1975. The determination of radiocaesium in sea and fresh waters. Technical Report No. 16. Lowestoft: Fisheries
Radiological Laboratory, Ministry of Agriculture, Fisheries and Food.
Cefas, 2008 An assessment of aquatic radiation pathways in Ireland, 2008 Environment Report RL 16/08 Cefas contract C3030 RPII
Colgan, P.A., Pollard, D., Hone, C., McMahon, C., McGarry, A.T., 2005. Report of the RPII visit to BNFL Sellafield RPII 05/01. Dublin:
Radiological Protection Institute of Ireland.
Colgan, P.A., Organo, C., Hone, C., Fenton, D., 2008. Radiation doses received by the Irish population RPII 08/01. Dublin: Radiological
Protection Institute of Ireland.
Eisenbud, M. and Gessell, T., 1997. Environmental radioactivity from natural, industrial and military sources. Fourth edition. Academic
Press.
Environmental Protection Agency, 2009. The Provision and Quality of Drinking Water in Ireland, Report for the Years 2007-2008.
Wexford: Environmental Protection Agency.
European Commission, 1996. Council Directive 96/29/EURATOM of 13 May 1996 laying down basic safety standards for the protection
of the health of workers and the general public against the dangers arising from ionising radiation. Official Journal of the European
Communities, L159, 29.6.1996, p 1-114.
European Commission, 2000. Commission Recommendation 2000/473/EURATOM of 8 June 2000 on the application of Article 36 of the
Euratom Treaty concerning the monitoring of the levels of radioactivity in the environment for the purpose of assessing the exposure of
the population as a whole. Official Journal of the European Communities, L191, 27.7.2000, p 37-51.
European Commission, 2008. Main Findings of the Commission’s Article 35 verification in Ireland. Irish National Monitoring
Network for Environmental Radioactivity. Reference of report: IE-07/03
European Commission, 2009. Environmental radioactivity in the European Community, 2004-2006. EUR 23950. Luxembourg:
European Commission.
European Communities, 1998a. Atlas of caesium deposition on Europe after the Chernobyl accident. EUR 19801 Luxembourg:
Office for Official Publications of the European Communities.
European Communities, 1998b. Council Directive 98/83/EC of 3 November 1998 on the quality of water intended for human consumption.
Official Journal of the European Communities, L330, 5.12 1998, p 32-54.
Fegan, M., Dowdall, A., Hanley, O., Hayden, E., Kelleher, K., Long, S., Smith, V., Somerville, S., Wong, J. Pollard, D., 2007. Radioactivity
monitoring of the Irish environment 2007. RPII 08/02. Dublin: Radiological Protection Institute of Ireland.
Fennell, S.G., Mackin, G.M., Madden, J.S., McGarry, A.T., Duffy, J.T., O’Colmáin, M., Colgan, P.A., Pollard, D., 2002. Radon in dwellings –
The Irish National Radon survey. RPII-02/1. Dublin: Radiological Protection Institute of Ireland.
Gray, J., Jones, S.R., Smith, A.D., 1995. Discharges to the environment from the Sellafield site, 1951-1992. Journal of Radiological
Protection, 15 (2), p. 99-131.
Harvey, B.R., Ibbett, R.D., Williams, J.K., Lovett, M.B., 1991. The determination of technetium-99 in environmental materials.
Aquatic Environment Protection: Analytical Methods Number 8. Directorate of Fisheries Research, Lowestoft.
ICRP, 1996. Age-dependent doses to members of the public from intake of radionuclides: Part 5. Compilation of Ingestion and
Inhalation Dose Coefficients. Annals of the ICRP, 26, ICRP Publication 72. Oxford: Pergamon Press.
7 References

Radioactivity Monitoring of the Irish Environment 200818
INAB, 2008. D1 Directory of accredited organisations, Dublin: The Irish National Accreditation Board.
Ireland, 1991. Radiological Protection Act, Number 9 of 1991. Dublin: Stationery Office.
Ireland, 2000. Radiological Protection Act, 1991 (Ionising Radiation) Order, 2000, Statutory Instrument No. 125 of 2000. Dublin:
Stationery Office.
Ireland 2007. European Communities (Drinking Water), (No 2) Regulations, 2007, Statutory Instrument No. 278 of 2007. Dublin:
Stationery Office.
ISO, 1995. ISO guide to the expression of uncertainty in measurement. International Standards Organisation, Geneva.
McAulay, I.R. and Moran, D., 1988. Natural radioactivity in soil in the republic of Ireland. Journal of Radiation Protection Dosimetry,
Vol. 24, p. 47-49.
McAulay, I.R. and Moran, D., 1989. Radiocaesium fallout in Ireland from the Chernobyl accident. Journal of Radiological Protection,
Vol. 9, (1), p. 29-32.
NSIFCS, 2001. North/South Ireland food consumption survey, 2001. Irish Universities Nutritional Alliance and the Food Safety Promotion
Board.
Poole, A.J., Denoon, D.C. and Woodhead, D.S., 1997. The distribution and inventory of 137Cs in sub-tidal sediments of the Irish Sea.
Radioprotection-Colloques, 32 (C2), p. 263-270.
Pollard, D., Ryan, T.P. and Dowdall, A., 1998. The dose to Irish seafood consumers from Po-210. Radiation Protection Dosimetry, 75 (1-4),
p. 139-142.
Ryan, T.P., 1992. Nuclear Fallout in the Irish Terrestrial Environment. Ph.D. Thesis, Dublin: University College Dublin.
Ryan, T.P., Mitchell, P.I., Sanchez-Cabeza, J.A., Smith, V and Vives i Batlle, J., 1993. Distribution of radioactive fallout throughout Ireland.
In: Science, Green Issues and the Environment: Ireland and the Global Crisis. (Eds. D.D.G. McMillan, C.O’Rourke, D.J. Fry and H.D.
McMillan), p. 276-283.
Ryan, T.P., Dowdall, A.M., Long, S., Smith, V., Pollard, D. Cunningham, J.D., 1999. Plutonium and americium in fish, shellfish and seaweed
in the Irish environment and their contribution to dose. Journal of Environmental Radioactivity, 44 (2-3), p.349-369.
Sequeira,S., Pollard, D., smith, V., Howett, D., Hayden, E., Fegan, M., Dowdall, A., Brogan, C., O’Colmáin, M., Cunningham, J.D., 1999.
Environmental Radioactivity Surveillance Programme, 1997 and 1998. RPII-99/2 Dublin: Radiological Protection Institute of Ireland.
Smith, K.J., 2001. Natural radionuclides as tracers of scavenging and particulate transport processes in open ocean, coastal and
estuarine environments. PhD Thesis, National University of Ireland, Dublin,
UNSCEAR, 1993. Sources and effects of ionizing radiation. UNSCEAR 1993 Report to the General Assembly, with Scientific Annexes.
New York: United Nations.
UNSCEAR, 2000. Sources and effects of ionizing radiation. UNSCEAR 2000 Report to the General Assembly, with Scientific Annexes.
New York: United Nations.
Walker, M.I. and Rose, K.S.B., 1990. The radioactivity of the sea. Nuclear Energy, 29 (4), p. 267-278.
WHO, 1993. Guidelines for drinking water quality. Geneva: WHO.
Radioactivity Monitoring of the Irish Environment 2008 19
Table 1. Naturally occurring radionuclides in seawater
Radionuclide Activity Concentration (mBq/l)Tritium 0.6a
Carbon-14 4.3a
Potassium-40 11,000b
Lead-210 5.0a
Polonium-210 3.7a
Bismuth-214 0.7a
Radon-222 0.7a
Radium-226 3.6a
Uranium-234 47c
Uranium-238 41c
Notes: a Source: Walker and Rose [1990].b RPII measurement.c Source: Smith [2001].
Table 2. Annual discharge limits (TBq) and actual discharges (TBq) from Sellafield to the Irish Sea, 2008
Radionuclide Limit Dischargea
CategoryAlpha-emitting radionuclides 1.0 0.127
Beta-emitting radionuclides 220 14.3
Tritium 20,000 778
Carbon-14 21 7.19
Cobalt-60 3.6 0.072
Strontium-90 48 1.7
Zirconium-95 + Niobium-95 3.8 0.125
Technetium-99 10 2.37
Ruthenium-106 63 1.39
Iodine-129 2.0 0.199
Caesium-134 1.6 0.115
Caesium-137 34 5.11
Cerium-144 4.0 0.354
Plutonium (alpha) 0.7 0.108
Plutonium-241 25 2.44
Americium-241 0.30 0.0297
Uranium (kg)b 2,000 276
Notes: a From the sea pipeline.b The limit and the discharge are expressed in kg.
8 Tables

Radioactivity Monitoring of the Irish Environment 200820
Table 3. Analytical techniques used in the determination of radionuclide concentrations, typical minimum detectable activities and typical counting uncertainties
Measurements Sample Types Analytical Techniques Typical Minimum
Detectable Activities
Typical
Counting
UncertaintiesCs-137 Foodstuffs High resolution gamma spectrometry
using high purity germanium detectors
0.5 Bq/kg
(5 h count)
15% or better
Cs-137 Air filters
(Belfield)
High resolution gamma spectrometry
using high purity germanium detectors
1 x 10⁻⁷ Bq/m3
(7 day count)
15% or better
Cs-137 Milk High resolution gamma spectrometry
using high purity germanium detectors
0.3 Bq/kg
(24 hour count)
15% or better
Sr-90 Milk Radiochemical separation followed by
liquid scintillation counting
0.02 Bq/l (2 h count) 40%
Gross beta Air filters Gas flow proportional counting 0.05 mBq/m3 (2 h count) 10%
Gross alpha
Gross beta
Drinking water Evaporation and gas flow proportional
counting
5 mBq/l (24 h count)
5 mBq/l (24 h count)
40%
30%
Gamma dose rate Ambient Continuous monitoring station 10 nSv/h 15% (Cs-137)
Cs-137 and other
gamma emitting
radionuclides
Fish, shellfish and
seaweed
High resolution gamma spectrometry
using high purity germanium detectors
1.0 Bq/kg (I-131)
0.3 Bq/kg (Cs-137)
15% or better
Cs-137 Seawater Radiochemical separation techniques
in accordance with the method
described by Baker [1975] followed by
high resolution gamma spectrometry
0.8 mBq/l 12% or better
Tc-99 Fish, shellfish,
seaweed and
seawater
Radiochemical separation techniques
in accordance with the method
described by Harvey et al. [1991]
followed by beta spectrometry using a
gas flow proportional counter
0.1 Bq/kg 30% or better
for fish
10% or better for
remainder
Pu-238,
Pu-239,240
Fish and shellfish Radiochemical separation techniques
followed by alpha spectrometry using
silicon surface barrier detectors
0.001 Bq/kg 15% or better

Radioactivity Monitoring of the Irish Environment 2008 21
Table 4. Permanent monitoring network, 2008
Sampling Location Sample TypesBallyrichard, Co. Wicklow. External gamma dose rate
Belfield, Co. Dublin Airborne particulates (high volume sampler)
Belmullet, Co. Mayo Rainwater
Birr, Co. Offaly External gamma dose rate, rainwater
Cahirciveen, Co. Kerry Airborne particulates, external gamma dose rate, rainwater
Casement, Co. Dublin External gamma dose rate, rainwater
Clones, Co. Monaghan External gamma dose rate, rainwater
Clonskeagh, Co. Dublin Airborne particulates, external gamma dose rate, rainwater
Cork Airport, Co. Cork Airborne particulates, external gamma dose rate, rainwater
Drogheda Co. Louth Airborne particulates
Dublin Airport, Co. Dublin Rainwater
Dundalk, Co. Louth (2 sites) Airborne particulates ,external gamma dose rate
Galway, Co. Galway Airborne particulates
Glasnevin, Co. Dublin Airborne particulates
Kilkenny, Co. Kilkenny External gamma dose rate, rainwater
Kilmeadan, Co. Waterford Airborne particulates, external gamma dose rate
Kiltrough, Co. Meath External gamma dose rate
Knock Airport, Co. Mayo Airborne particulates, external gamma dose rate
Malin Head, Co. Donegal External gamma dose rate, rainwater
Mullingar, Co. Westmeath Airborne particulates, rainwater
Rosslare, Co. Wexford Airborne particulates, external gamma dose rate, rainwater
Shannon Airport, Co. Clare Airborne particulates, external gamma dose rate, rainwater
Table 5a. Radioactivity in airborne particulates (low volume), Caherciveen, 2008
Month Activity Concentration in Air (Bq/m3)Gross Beta Cs-137 Be-7
Jan 1.5 X 10⁻⁴ nd 5.42 X 10⁻³
Feb 7.8 X 10⁻⁴ nd 5.47 X 10⁻³
Mar 1.3 X 10⁻⁴ nd 4.76 X 10⁻³
Apr 3.0 X 10⁻⁴ nd 5.06 X 10⁻³
May 3.8 X 10⁻⁴ nd 4.35 X 10⁻³
Jun 2.0 X 10⁻⁴ nd 3.34 X 10⁻³
Jul 1.2 X 10⁻⁴ nd 2.95 X 10⁻³
Aug 1.1 X 10⁻⁴ nd 2.73 X 10⁻³
Sep 1.2 X 10⁻⁴ nd 2.84 X 10⁻³
Oct 1.2 X 10⁻⁴ nd 2.28 X 10⁻³
Nov 1.2 X 10⁻⁴ nd 2.14 X 10⁻³
Dec 1.3 X 10⁻⁴ nd 1.98 X 10⁻³
Note: nd = not detected (sample analysed but radionuclide below detection limit).

Radioactivity Monitoring of the Irish Environment 200822
Table 5b. Radioactivity in airborne particulates (low volume), Clonskeagh, 2008
Month Activity Concentration in Air (Bq/m3)Gross Beta Cs-137 Be-7
Jan 1.1 X 10⁻⁴ nd 3.21 X 10⁻³
Feb 6.7 X 10⁻⁴ nd 4.87 X 10⁻³
Mar 1.5 X 10⁻⁴ nd 4.13 X 10⁻³
Apr 2.4 X 10⁻⁴ nd 2.91 X 10⁻³
May 4.0 X 10⁻⁴ nd 4.79 X 10⁻³
Jun 1.8 X 10⁻⁴ nd 3.18 X 10⁻³
Jul 1.3 X 10⁻⁴ nd 3.06 X 10⁻³
Aug 1.2 X 10⁻⁴ nd 2.51 X 10⁻³
Sep 1.3 X 10⁻⁴ nd 2.08 X 10⁻³
Oct 1.1 X 10⁻⁴ nd 1.96 X 10⁻³
Nov 1.1 X 10⁻⁴ nd 2.69 X 10⁻³
Dec 1.8 X 10⁻⁴ nd 2.09 X 10⁻³
Note: nd = not detected (sample analysed but radionuclide below detection limit).
Table 5c. Radioactivity in airborne particulates (low volume), Cork, 2008
Month Activity Concentration in Air (Bq/m3)Gross Beta Cs-137 Be-7
Jan 1.1 X 10⁻⁴ nd 4.18 X 10⁻³
Feb 1.6 X 10⁻⁴ nd 1.88 X 10⁻³
Mar 1.3 X 10⁻⁴ nd 4.11 X 10⁻³
Apr 2.7 X 10⁻⁴ nd 3.96 X 10⁻³
May 3.1 X 10⁻⁴ nd 2.34 X 10⁻³
Jun 1.4 X 10⁻⁴ nd 3.27 X 10⁻³
Jul 1.5 X 10⁻⁴ nd 3.34 X 10⁻³
Aug 1.4 X 10⁻⁴ nd 1.90 X 10⁻³
Sep 1.2 X 10⁻⁴ nd 2.83 X 10⁻³
Oct 1.1 X 10⁻⁴ nd 1.84 X 10⁻³
Nov 1.7 X 10⁻⁴ nd 3.55 X 10⁻³
Dec 2.0 X 10⁻⁴ nd 3.30 X 10⁻³
Note: nd = not detected (sample analysed but radionuclide below detection limit).
Table 5d. Radioactivity in airborne particulates (low volume), Galway, 2008
Month Activity Concentration in Air (Bq/m3)Gross Beta Cs-137 Be-7
Jan 1.6 X 10⁻⁴ nd 2.09 X 10⁻³
Feb 3.1 X 10⁻⁴ nd 2.44 X 10⁻³
Mar 1.0 X 10⁻⁴ nd 2.58 X 10⁻³
Apr 1.6 X 10⁻⁴ nd 2.60 X 10⁻³
May 2008 system removed from network
Note: nd = not detected (sample analysed but radionuclide below detection limit).
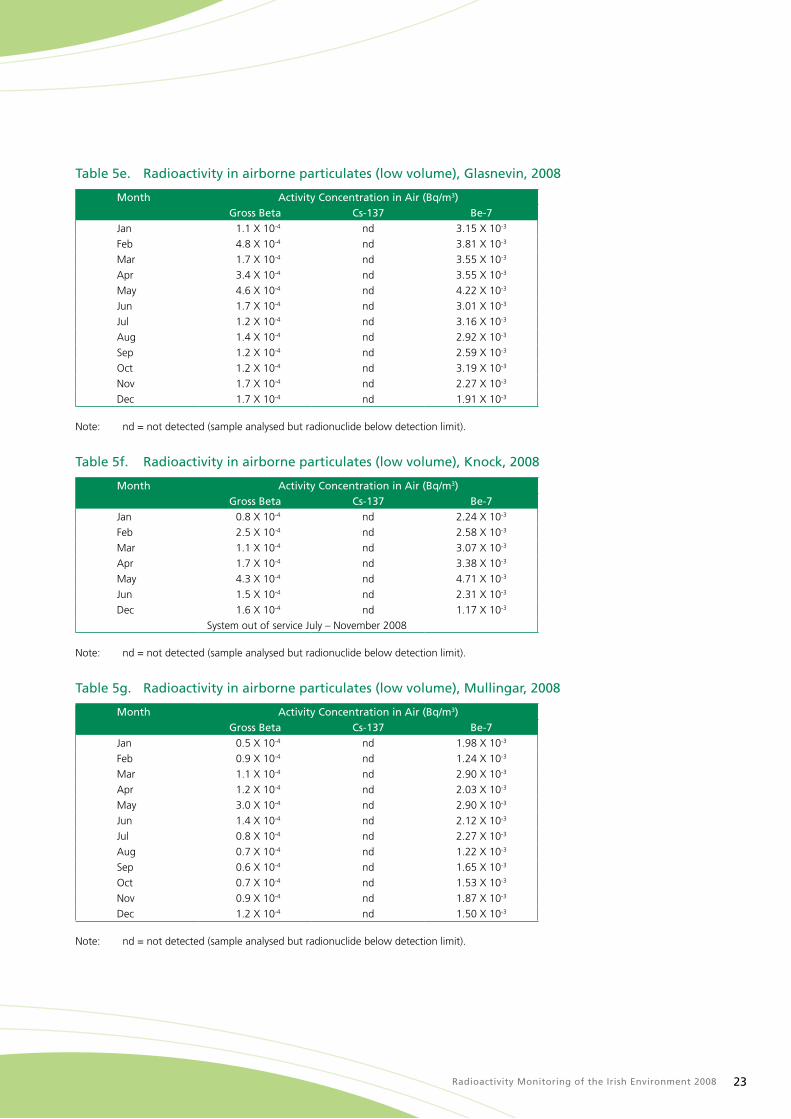
Radioactivity Monitoring of the Irish Environment 2008 23
Table 5e. Radioactivity in airborne particulates (low volume), Glasnevin, 2008
Month Activity Concentration in Air (Bq/m3)Gross Beta Cs-137 Be-7
Jan 1.1 X 10⁻⁴ nd 3.15 X 10⁻³
Feb 4.8 X 10⁻⁴ nd 3.81 X 10⁻³
Mar 1.7 X 10⁻⁴ nd 3.55 X 10⁻³
Apr 3.4 X 10⁻⁴ nd 3.55 X 10⁻³
May 4.6 X 10⁻⁴ nd 4.22 X 10⁻³
Jun 1.7 X 10⁻⁴ nd 3.01 X 10⁻³
Jul 1.2 X 10⁻⁴ nd 3.16 X 10⁻³
Aug 1.4 X 10⁻⁴ nd 2.92 X 10⁻³
Sep 1.2 X 10⁻⁴ nd 2.59 X 10⁻³
Oct 1.2 X 10⁻⁴ nd 3.19 X 10⁻³
Nov 1.7 X 10⁻⁴ nd 2.27 X 10⁻³
Dec 1.7 X 10⁻⁴ nd 1.91 X 10⁻³
Note: nd = not detected (sample analysed but radionuclide below detection limit).
Table 5f. Radioactivity in airborne particulates (low volume), Knock, 2008
Month Activity Concentration in Air (Bq/m3)Gross Beta Cs-137 Be-7
Jan 0.8 X 10⁻⁴ nd 2.24 X 10⁻³
Feb 2.5 X 10⁻⁴ nd 2.58 X 10⁻³
Mar 1.1 X 10⁻⁴ nd 3.07 X 10⁻³
Apr 1.7 X 10⁻⁴ nd 3.38 X 10⁻³
May 4.3 X 10⁻⁴ nd 4.71 X 10⁻³
Jun 1.5 X 10⁻⁴ nd 2.31 X 10⁻³
Dec 1.6 X 10⁻⁴ nd 1.17 X 10⁻³
System out of service July – November 2008
Note: nd = not detected (sample analysed but radionuclide below detection limit).
Table 5g. Radioactivity in airborne particulates (low volume), Mullingar, 2008
Month Activity Concentration in Air (Bq/m3)Gross Beta Cs-137 Be-7
Jan 0.5 X 10⁻⁴ nd 1.98 X 10⁻³
Feb 0.9 X 10⁻⁴ nd 1.24 X 10⁻³
Mar 1.1 X 10⁻⁴ nd 2.90 X 10⁻³
Apr 1.2 X 10⁻⁴ nd 2.03 X 10⁻³
May 3.0 X 10⁻⁴ nd 2.90 X 10⁻³
Jun 1.4 X 10⁻⁴ nd 2.12 X 10⁻³
Jul 0.8 X 10⁻⁴ nd 2.27 X 10⁻³
Aug 0.7 X 10⁻⁴ nd 1.22 X 10⁻³
Sep 0.6 X 10⁻⁴ nd 1.65 X 10⁻³
Oct 0.7 X 10⁻⁴ nd 1.53 X 10⁻³
Nov 0.9 X 10⁻⁴ nd 1.87 X 10⁻³
Dec 1.2 X 10⁻⁴ nd 1.50 X 10⁻³
Note: nd = not detected (sample analysed but radionuclide below detection limit).
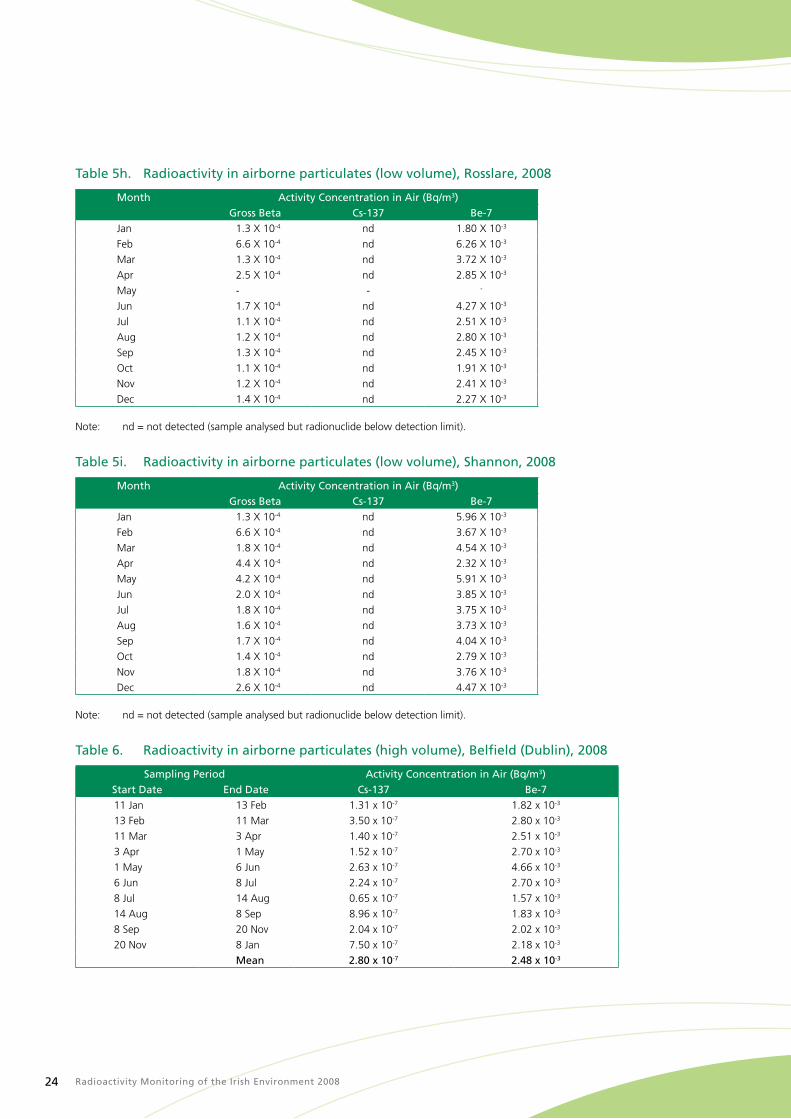
Radioactivity Monitoring of the Irish Environment 200824
Table 5h. Radioactivity in airborne particulates (low volume), Rosslare, 2008
Month Activity Concentration in Air (Bq/m3)Gross Beta Cs-137 Be-7
Jan 1.3 X 10⁻⁴ nd 1.80 X 10⁻³
Feb 6.6 X 10⁻⁴ nd 6.26 X 10⁻³
Mar 1.3 X 10⁻⁴ nd 3.72 X 10⁻³
Apr 2.5 X 10⁻⁴ nd 2.85 X 10⁻³
May - - -
Jun 1.7 X 10⁻⁴ nd 4.27 X 10⁻³
Jul 1.1 X 10⁻⁴ nd 2.51 X 10⁻³
Aug 1.2 X 10⁻⁴ nd 2.80 X 10⁻³
Sep 1.3 X 10⁻⁴ nd 2.45 X 10⁻³
Oct 1.1 X 10⁻⁴ nd 1.91 X 10⁻³
Nov 1.2 X 10⁻⁴ nd 2.41 X 10⁻³
Dec 1.4 X 10⁻⁴ nd 2.27 X 10⁻³
Note: nd = not detected (sample analysed but radionuclide below detection limit).
Table 5i. Radioactivity in airborne particulates (low volume), Shannon, 2008
Month Activity Concentration in Air (Bq/m3)Gross Beta Cs-137 Be-7
Jan 1.3 X 10⁻⁴ nd 5.96 X 10⁻³
Feb 6.6 X 10⁻⁴ nd 3.67 X 10⁻³
Mar 1.8 X 10⁻⁴ nd 4.54 X 10⁻³
Apr 4.4 X 10⁻⁴ nd 2.32 X 10⁻³
May 4.2 X 10⁻⁴ nd 5.91 X 10⁻³
Jun 2.0 X 10⁻⁴ nd 3.85 X 10⁻³
Jul 1.8 X 10⁻⁴ nd 3.75 X 10⁻³
Aug 1.6 X 10⁻⁴ nd 3.73 X 10⁻³
Sep 1.7 X 10⁻⁴ nd 4.04 X 10⁻³
Oct 1.4 X 10⁻⁴ nd 2.79 X 10⁻³
Nov 1.8 X 10⁻⁴ nd 3.76 X 10⁻³
Dec 2.6 X 10⁻⁴ nd 4.47 X 10⁻³
Note: nd = not detected (sample analysed but radionuclide below detection limit).
Table 6. Radioactivity in airborne particulates (high volume), Belfield (Dublin), 2008
Sampling Period Activity Concentration in Air (Bq/m3)Start Date End Date Cs-137 Be-711 Jan 13 Feb 1.31 x 10⁻⁷ 1.82 x 10⁻³
13 Feb 11 Mar 3.50 x 10⁻⁷ 2.80 x 10⁻³
11 Mar 3 Apr 1.40 x 10⁻⁷ 2.51 x 10⁻³
3 Apr 1 May 1.52 x 10⁻⁷ 2.70 x 10⁻³
1 May 6 Jun 2.63 x 10⁻⁷ 4.66 x 10⁻³
6 Jun 8 Jul 2.24 x 10⁻⁷ 2.70 x 10⁻³
8 Jul 14 Aug 0.65 x 10⁻⁷ 1.57 x 10⁻³
14 Aug 8 Sep 8.96 x 10⁻⁷ 1.83 x 10⁻³
8 Sep 20 Nov 2.04 x 10⁻⁷ 2.02 x 10⁻³
20 Nov 8 Jan 7.50 x 10⁻⁷ 2.18 x 10⁻³
Mean 2.80 x 10⁻⁷ 2.48 x 10⁻³
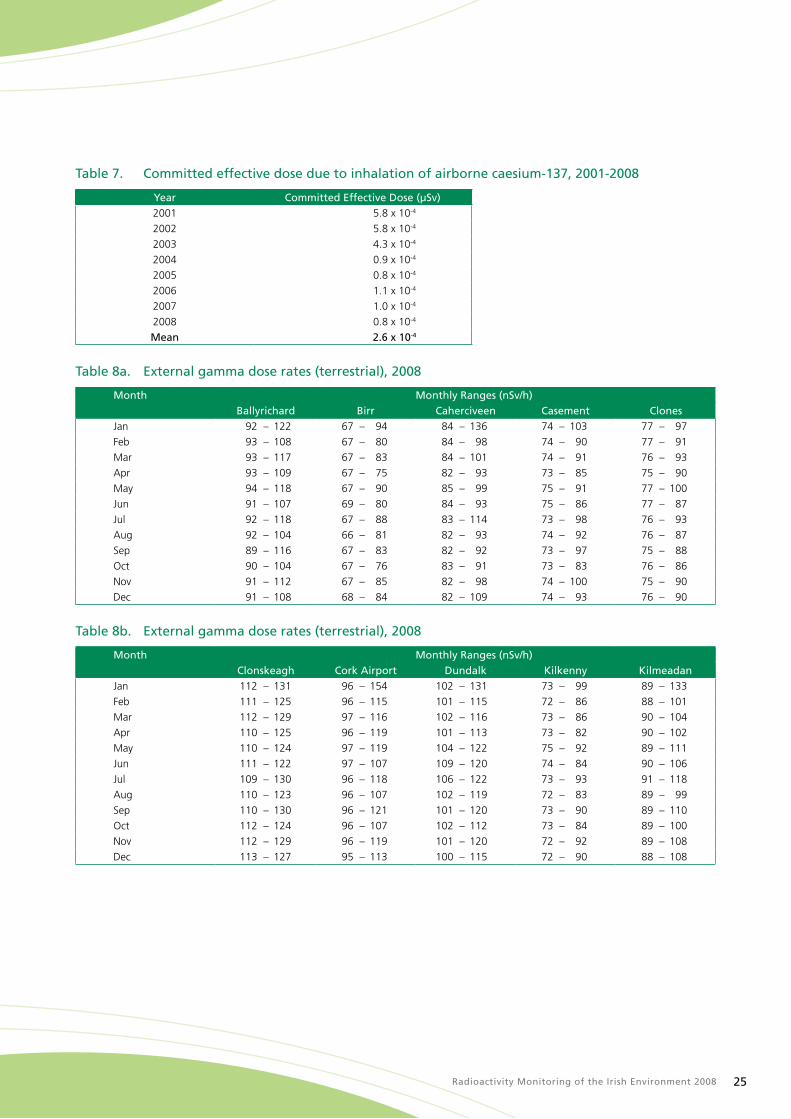
Radioactivity Monitoring of the Irish Environment 2008 25
Table 7. Committed effective dose due to inhalation of airborne caesium-137, 2001-2008
Year Committed Effective Dose (µSv)2001 5.8 x 10⁻⁴
2002 5.8 x 10⁻⁴
2003 4.3 x 10⁻⁴
2004 0.9 x 10⁻⁴
2005 0.8 x 10⁻⁴
2006 1.1 x 10⁻⁴
2007 1.0 x 10⁻⁴
2008 0.8 x 10⁻⁴
Mean 2.6 x 10⁻⁴
Table 8a. External gamma dose rates (terrestrial), 2008
Month Monthly Ranges (nSv/h)Ballyrichard Birr Caherciveen Casement Clones
Jan 92 – 122 67 – 94 84 – 136 74 – 103 77 – 97
Feb 93 – 108 67 – 80 84 – 98 74 – 90 77 – 91
Mar 93 – 117 67 – 83 84 – 101 74 – 91 76 – 93
Apr 93 – 109 67 – 75 82 – 93 73 – 85 75 – 90
May 94 – 118 67 – 90 85 – 99 75 – 91 77 – 100
Jun 91 – 107 69 – 80 84 – 93 75 – 86 77 – 87
Jul 92 – 118 67 – 88 83 – 114 73 – 98 76 – 93
Aug 92 – 104 66 – 81 82 – 93 74 – 92 76 – 87
Sep 89 – 116 67 – 83 82 – 92 73 – 97 75 – 88
Oct 90 – 104 67 – 76 83 – 91 73 – 83 76 – 86
Nov 91 – 112 67 – 85 82 – 98 74 – 100 75 – 90
Dec 91 – 108 68 – 84 82 – 109 74 – 93 76 – 90
Table 8b. External gamma dose rates (terrestrial), 2008
Month Monthly Ranges (nSv/h)Clonskeagh Cork Airport Dundalk Kilkenny Kilmeadan
Jan 112 – 131 96 – 154 102 – 131 73 – 99 89 – 133
Feb 111 – 125 96 – 115 101 – 115 72 – 86 88 – 101
Mar 112 – 129 97 – 116 102 – 116 73 – 86 90 – 104
Apr 110 – 125 96 – 119 101 – 113 73 – 82 90 – 102
May 110 – 124 97 – 119 104 – 122 75 – 92 89 – 111
Jun 111 – 122 97 – 107 109 – 120 74 – 84 90 – 106
Jul 109 – 130 96 – 118 106 – 122 73 – 93 91 – 118
Aug 110 – 123 96 – 107 102 – 119 72 – 83 89 – 99
Sep 110 – 130 96 – 121 101 – 120 73 – 90 89 – 110
Oct 112 – 124 96 – 107 102 – 112 73 – 84 89 – 100
Nov 112 – 129 96 – 119 101 – 120 72 – 92 89 – 108
Dec 113 – 127 95 – 113 100 – 115 72 – 90 88 – 108

Radioactivity Monitoring of the Irish Environment 200826
Table 8c. External gamma dose rates (terrestrial), 2008
Month Monthly Ranges (nSv/h)Kiltrough Knock Airport Malin Head Rosslare Shannon Airport
Jan 84 – 111 73 – 93 67 – 90 75 – 108 77 – 102
Feb 82 – 95 73 – 88 68 – 83 75 – 86 77 – 92
Mar 83 – 100 70 – 90 68 – 89 76 – 92 73 – 104
Apr 84 – 93 72 – 84 68 – 79 75 – 96 76 – 86
May 86 – 102 73 – 99 69 – 82 77 – 104 77 – 101
Jun 87 – 103 72 – 102 71 – 93 75 – 89 78 – 95
Jul 86 – 102 71 – 91 69 – 88 75 – 95 77 – 111
Aug 86 – 97 71 – 88 69 – 84 75 – 85 77 – 91
Sep 84 – 104 70 – 92 67 – 85 75 – 90 77 – 94
Oct 84 – 95 70 – 82 68 – 83 75 – 85 77 – 88
Nov 83 – 101 70 – 92 68 – 84 74 – 92 75 – 89
Dec 80 – 101 70 – 92 68 – 105 74 – 93 75 – 92
Table 9. Radioactivity in milk, 2008
County Activity Concentration (Bq/l)Jan - Mar Apr–Jun Jul–Sep Oct–Dec
Sr-90 Cs-137 Sr-90 Cs-137 Sr-90 Cs-137 Sr-90 Cs-137Cavan 0.02 nd nd nd 0.02 0.10 0.02 nd
Cork 0.03 nd nd nd 0.02 nd nd nd
Dublin nd nd nd nd nd nd 0.01 nd
Roscommon nd nd nd nd 0.02 nd 0.03 0.09
Note: nd = not detected (sample analysed but radionuclide below detection limit).
Table 10. Ingestion dose coefficients
Nuclide Category Dose Coefficient a
(Sv/ Bq)Cs-137 Infant 2.1 x 10⁻⁸
Cs-137 Adult 1.3 x 10⁻⁸
Sr-90 Adult 2.8 x 10⁻⁸
Sr-90 Infant 2.3 × 10⁻⁷
Y-90 Adult 2.7 × 10⁻⁹
Y-90 Infant 3.1 x 10⁻⁸
Tc-99 Adult 6.4 × 10⁻¹⁰
Pu-238 Adult 2.3 × 10⁻⁷
Pu-239 Adult 2.5 × 10⁻⁷
Pu-240 Adult 2.5 × 10⁻⁷
Am-241 Adult 2.0 × 10⁻⁷
Note: a Source: ICRP [1996].
Table 11. Committed effective dose from strontium-90, yttrium-90, caesium -137 in milk, 2008
Radionuclide Category Annual Dose (µSv)Sr-90 Infant 0.55
Adult 0.10
Y-90 Infant 0.07
Adult 0.01
Cs-137 Infant 0.0003
Adult 0.000195

Radioactivity Monitoring of the Irish Environment 2008 27
Table 12. Maximum caesium-137 activity concentrations in a range of foodstuffs, 2008
Sample Type Number of Samples Max Cs-137 (Bq/kg, fresh weight)
Number of Samples Above Detection Limit
Beef/Pork/Lamb 20 3.34 1
Dairy products 295 1.85 3
Mixed diet samples 10 0.41 2
Grain 56 nd 0
Miscellaneous foodstuffs 227 nd 0
Note: nd = not detected (sample analysed but radionuclide below detection limit).
Table 13. Gross alpha and gross beta activity concentrations in drinking water, 2008
County Supply Sampling Date Activity Concentration (mBq/l)Gross Alpha Gross Beta
Carlow Rathvilly Sep nd 71
Cavan Cavan Jul 16 154
Clare Ennis Jul 58 142
Cork Lee Road Jul 9 82
Inniscarra Oct nd 81
Donegal Bundoran Aug nd 56
Letterkenny Aug 7 51
Lough Mourne Aug 19 61
Pollan Dam Aug 22 59
Rosses Regional Aug 14 52
Dublin Ballyboden Aug 21 67
Ballymore Eustace Aug 18 58
Leixlip Aug 38 110
Roundwood Aug 15 64
Notes: nd = not detected (sample analysed but radionuclide below detection limit).
Table 14. Marine monitoring programme
Sampling Location Sample Types Sampling FrequencyBalbriggan, Co. Dublin Seawater, seaweed Monthly, Quarterly
Cahore, Co. Wexford Seawater, seaweed Biannually
Carlingford, Co. Louth Shellfish Quarterly
Castletownbere, Co. Cork Seawater, seaweed Biennially
Clogherhead, Co. Louth Fish, shellfish Quarterly
Greenore, Co. Louth Seawater, seaweed Quarterly
Howth, Co. Dublin Fish, shellfish Quarterly
Killybegs/Mountcharles, Co. Donegal Fish, seawater, seaweed Annually, Biennially, Biennially
Kilmore Quay, Co. Wexford Fish Annually
Galway/Salthill, Co. Galway Seawater, seaweed Biennially
Woodtown, Co. Waterford Seawater Biennially
N1–Irish Sea, 53:25N 6:01W Seawater Annually
N2–Irish Sea, 53:36N 5:56W Seawater Annually
N3–Irish Sea, 53:44N 5:25W Seawater Annually
N4–Irish Sea, 53:52N 5:14W Seawater, sediment Annually
N5–Irish Sea, 53:53N 5:33W Seawater, sediment Annually
N6–Irish Sea, 53:52N 5:53W Seawater, sediment Annually

Radioactivity Monitoring of the Irish Environment 200828
Table 15. Radioactivity in seawater, 2008
Sampling Location Month Activity Concentration (mBq/l) Tc-99 Cs-137
Greenore Jan 4 16
Apr 5 17
Jul 6 20
Oct 4 18
Mean 5 18Balbriggan Jan 6 nm
Feb 3 16
Mar 8 14
Apr 5 17
May 4 17
Jun 14 18
Jul 4 19
Aug - -
Sep 4 17
Oct 4 12
Nov 4 11
Dec 4 12
Mean 5 15Cahore May 3 11
Sep 1 4
Mean 2 8Woodtown Aug 0.6 2
Castletownbere Aug 0.5 2
Salthill July 0.2 2
Mountcharles July nd 2
Portrush July 2 10
Larne July 5 13
Ards July 3 21
Irish Sea – N1 Aug nm 13
Irish Sea – N2 Aug 2 12
Irish Sea – N3 Aug nd 18
Irish Sea – N4 Aug 5 9
Irish Sea – N5 Aug 6 20
Irish Sea – N6 Aug 5 18
Note: nm = not measured.
nd = not detected (sample analysed but radionuclide below detection limit).
Table 16. Radioactivity in marine sediments, 2008
Sampling Location Month Cs-137 Activity Concentration (Bq/kg, dry weight)
Irish Sea – N4 Aug 20.84
Irish Sea – N5 Aug 27.85
Irish Sea – N6 Aug 15.66
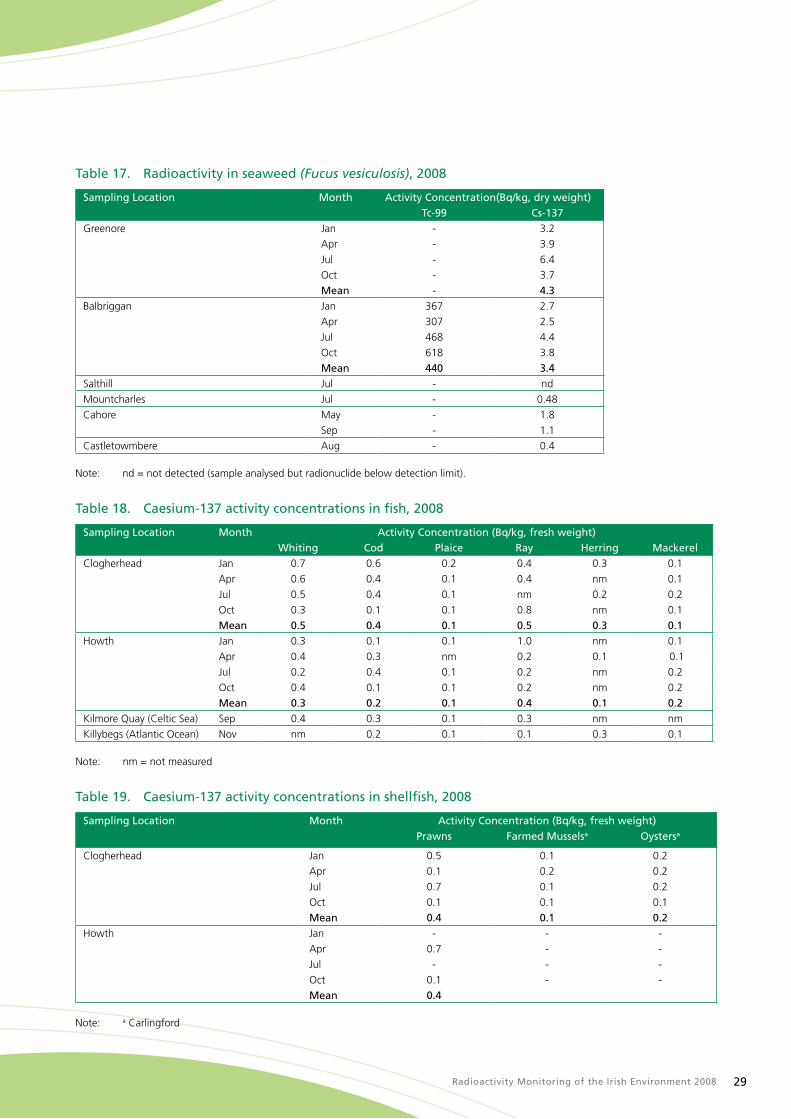
Radioactivity Monitoring of the Irish Environment 2008 29
Table 17. Radioactivity in seaweed (Fucus vesiculosis), 2008
Sampling Location Month Activity Concentration(Bq/kg, dry weight)Tc-99 Cs-137
Greenore Jan - 3.2
Apr - 3.9
Jul - 6.4
Oct - 3.7
Mean - 4.3Balbriggan Jan 367 2.7
Apr 307 2.5
Jul 468 4.4
Oct 618 3.8
Mean 440 3.4Salthill Jul - nd
Mountcharles Jul - 0.48
Cahore May - 1.8
Sep - 1.1
Castletowmbere Aug - 0.4
Note: nd = not detected (sample analysed but radionuclide below detection limit).
Table 18. Caesium-137 activity concentrations in fish, 2008
Sampling Location Month Activity Concentration (Bq/kg, fresh weight)Whiting Cod Plaice Ray Herring Mackerel
Clogherhead Jan 0.7 0.6 0.2 0.4 0.3 0.1
Apr 0.6 0.4 0.1 0.4 nm 0.1
Jul 0.5 0.4 0.1 nm 0.2 0.2
Oct 0.3 0.1 0.1 0.8 nm 0.1
Mean 0.5 0.4 0.1 0.5 0.3 0.1Howth Jan 0.3 0.1 0.1 1.0 nm 0.1
Apr 0.4 0.3 nm 0.2 0.1 0.1
Jul 0.2 0.4 0.1 0.2 nm 0.2
Oct 0.4 0.1 0.1 0.2 nm 0.2
Mean 0.3 0.2 0.1 0.4 0.1 0.2Kilmore Quay (Celtic Sea) Sep 0.4 0.3 0.1 0.3 nm nm
Killybegs (Atlantic Ocean) Nov nm 0.2 0.1 0.1 0.3 0.1
Note: nm = not measured
Table 19. Caesium-137 activity concentrations in shellfish, 2008
Sampling Location Month Activity Concentration (Bq/kg, fresh weight)Prawns Farmed Musselsa Oystersa
Clogherhead Jan 0.5 0.1 0.2
Apr 0.1 0.2 0.2
Jul 0.7 0.1 0.2
Oct 0.1 0.1 0.1
Mean 0.4 0.1 0.2Howth Jan - - -
Apr 0.7 - -
Jul - - -
Oct 0.1 - -
Mean 0.4
Note: a Carlingford
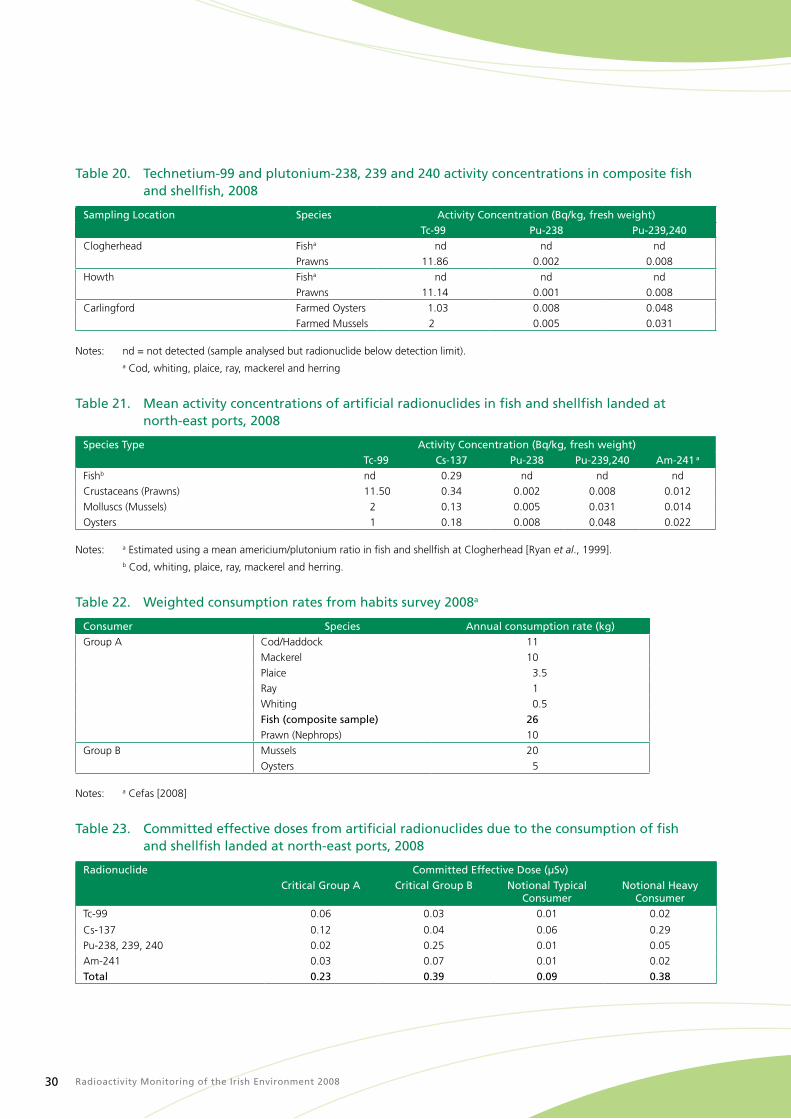
Radioactivity Monitoring of the Irish Environment 200830
Table 20. Technetium-99 and plutonium-238, 239 and 240 activity concentrations in composite fish and shellfish, 2008
Sampling Location Species Activity Concentration (Bq/kg, fresh weight)Tc-99 Pu-238 Pu-239,240
Clogherhead Fisha nd nd nd
Prawns 11.86 0.002 0.008
Howth Fisha nd nd nd
Prawns 11.14 0.001 0.008
Carlingford Farmed Oysters 1.03 0.008 0.048
Farmed Mussels 2 0.005 0.031
Notes: nd = not detected (sample analysed but radionuclide below detection limit). a Cod, whiting, plaice, ray, mackerel and herring
Table 21. Mean activity concentrations of artificial radionuclides in fish and shellfish landed at north-east ports, 2008
Species Type Activity Concentration (Bq/kg, fresh weight)Tc-99 Cs-137 Pu-238 Pu-239,240 Am-241 a
Fishb nd 0.29 nd nd nd
Crustaceans (Prawns) 11.50 0.34 0.002 0.008 0.012
Molluscs (Mussels) 2 0.13 0.005 0.031 0.014
Oysters 1 0.18 0.008 0.048 0.022
Notes: a Estimated using a mean americium/plutonium ratio in fish and shellfish at Clogherhead [Ryan et al., 1999].b Cod, whiting, plaice, ray, mackerel and herring.
Table 22. Weighted consumption rates from habits survey 2008a
Consumer Species Annual consumption rate (kg)Group A Cod/Haddock 11
Mackerel 10
Plaice 3.5
Ray 1
Whiting 0.5
Fish (composite sample) 26Prawn (Nephrops) 10
Group B Mussels 20
Oysters 5
Notes: a Cefas [2008]
Table 23. Committed effective doses from artificial radionuclides due to the consumption of fish and shellfish landed at north-east ports, 2008
Radionuclide Committed Effective Dose (µSv)Critical Group A Critical Group B Notional Typical
ConsumerNotional Heavy
ConsumerTc-99 0.06 0.03 0.01 0.02
Cs-137 0.12 0.04 0.06 0.29
Pu-238, 239, 240 0.02 0.25 0.01 0.05
Am-241 0.03 0.07 0.01 0.02
Total 0.23 0.39 0.09 0.38

Radioactivity Monitoring of the Irish Environment 2008 31
Table 24. Committed effective dose from selected artificial radionuclides due to the consumption of fish and shellfish, 1982-2008
Year Committed Effective Dose (µSv)Notional Typical Consumer
1982 13.80
1983 11.00
1984 9.40
1985 5.00
1986 3.80
1987 2.20
1988 1.40
1989 1.10
1990 0.94
1991 1.06
1992 0.74
1993 0.67
1994 0.51
1995 0.41
1996 0.34
1997 0.32
1998 0.32
1999 0.30
2000 0.26
2001 0.27
2002 0.17
2003 0.16
2004 0.17
2005 0.24
2006 0.16
2007 0.16
2008 0.09

Radioactivity Monitoring of the Irish Environment 200832
Absorbed Dose
Quantity of energy imparted by the ionising radiation to unit mass of matter such as tissue. It is measured in grays (Gy). One Gy produces
different biological effects on tissue depending on the type of radiation (alpha, beta or gamma).
Committed Effective Dose
Total dose gradually delivered to an individual over a given period of time by the decay of a radionuclide following its intake into the body.
The integration time is usually taken as 50 years for adults and 70 years for children.
Effective Dose
Weighted sum of the equivalent doses to the various organs and tissues. The weighting factor for each organ or tissue takes account of the
fractional contribution of the risk of death or serious genetic defect from irradiation of that organ or tissue to the total risk from uniform
irradiation of the whole body. The unit of effective dose is the sievert (Sv).
Equivalent Dose
The quantity obtained by multiplying the absorbed dose by a factor representing the different effectiveness of the various types of radiation
in causing harm to tissues. It is measured in sieverts (Sv). One Sv produces the same biological effect irrespective of the type of the radiation.
Half-life
The time taken for the activity of a radionuclide to lose half its value by decay.
Radionuclide
An unstable nuclide that emits ionising radiation. The emissions may be either alpha, beta or gamma radiation.
Radiotoxicity
A measure of the dose per becquerel resulting from the ingestion of a particular radionuclide.
Secular equilibirum
Secular equilibrium occurs in a radioactive decay chain where the half life of the daughter radionuclide is much shorter than that of the
parent radionuclide. The quantity of radionuclide B builds up until the number of B atoms decaying per unit time becomes equal to the
number being produced per unit time; the quantity of radionuclide B then reaches a constant, equilibrium value
9 Glossary of Terms
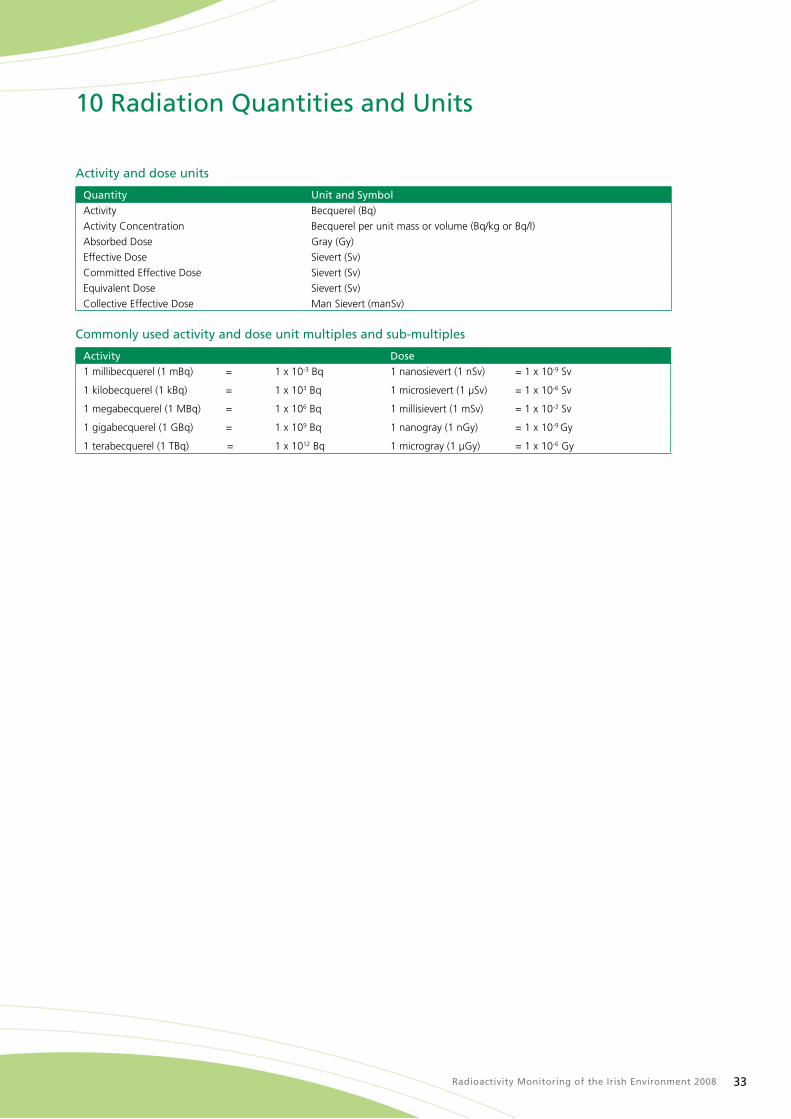
Radioactivity Monitoring of the Irish Environment 2008 33
10 Radiation Quantities and Units
Activity and dose units
Quantity Unit and SymbolActivity Becquerel (Bq)
Activity Concentration Becquerel per unit mass or volume (Bq/kg or Bq/l)
Absorbed Dose Gray (Gy)
Effective Dose Sievert (Sv)
Committed Effective Dose Sievert (Sv)
Equivalent Dose Sievert (Sv)
Collective Effective Dose Man Sievert (manSv)
Commonly used activity and dose unit multiples and sub-multiples
Activity Dose1 millibecquerel (1 mBq) = 1 x 10⁻³ Bq 1 nanosievert (1 nSv) = 1 x 10⁻⁹ Sv
1 kilobecquerel (1 kBq) = 1 x 10³ Bq 1 microsievert (1 µSv) = 1 x 10⁻⁶ Sv
1 megabecquerel (1 MBq) = 1 x 10⁶ Bq 1 millisievert (1 mSv) = 1 x 10⁻³ Sv
1 gigabecquerel (1 GBq) = 1 x 10⁹ Bq 1 nanogray (1 nGy) = 1 x 10⁻⁹ Gy
1 terabecquerel (1 TBq) = 1 x 10¹² Bq 1 microgray (1 µGy) = 1 x 10⁻⁶ Gy

Radioactivity Monitoring of the Irish Environment 200834
Appendix 1 – Screening Levels for Drinking Water
The Drinking Water Directive [European Communities, 1998b] on the quality of water intended for human consumption sets out standards
for radioactivity in drinking water. With regard to radioactivity, the directive sets parametric standards for tritium and total indicative dose
(TID) as set out below in Table 1. A TID of 0.1mSv/y represents less than 5% of the average effective dose normally attributable annually to
natural background radiation. This Directive has been transposed into Irish law in Statutory Instrument 278 of 2007 [Ireland, 2007]. Practical
arrangements for monitoring compliance with these standards are to be set out in Annexes to the Directive, which are currently being
finalised by the European Commission. In the absence of these Annexes, the RPII has applied the methodology for screening drinking water
as set out by the World Health Organisation recommendations on drinking water [WHO, 1993].
Table 1 – Parametric values for radioactivity from S.I. 278 of 2007
Parameter Parametric ValueTritium 100 Bq/l
Total indicative dosea 0.10 mSv/year
a Excluding tritium, potassium-40, radon and radon decay products. Assessment method will be set in the Annexes to the Directive
In accordance with the WHO scheme the recommended screening levels for gross alpha and gross beta activity are 100 and 1000 mBq/l,
respectively, while the level for tritium is 100 Bq/l. If the radioactivity concentrations of water supplies are below the screening values then
the water is considered to be in compliance with Statutory Instrument 278, which states that the dose arising from one year’s consumption
of drinking water should not exceed 0.1 mSv. Hence the drinking water is considered acceptable for human consumption and any action to
reduce the radioactivity is deemed unnecessary.
The WHO gross alpha screening level of 100 mBq/l is based on the conservative assumption that all of the alpha activity is due to Po-210,
which has the highest ingestion dose coefficient of the radionuclides considered by the WHO. However, it has been shown previously by
Sequeira et al., [1999] for Irish groundwater supplies that, where the gross alpha screening level of 100 mBq/l is exceeded, in most cases
the gross alpha activity measurement is dominated by uranium. As can be seen from Table 2, the ingestion dose coefficient for uranium is
approximately 25 times lower than for Po-210. Therefore, the approach taken by the RPII, where the grosss alpha activity exceeds 100 mBq/l,
is firstly to estimate the uranium activity concentration from the uranium concentration measured chemically. Where, on the basis of the
indicative dose due to uranium and the residual alpha activity with the uranium subtracted, it can be shown than no combination of alpha
emitters could result in a TID greater than 100 mBq/l, then the supply is deemed to be in compliance with the standard for TID.
Where it cannot be shown on the basis of the uranium measurements that the supply complies with the standard for TID then individual
radionuclide concentrations are determined as necessary and the dose arising from each component is calculated. It should be noted that in
accordance with the Drinking Water Directive the dose calculation should include contributions from all natural and artificial radionuclides
with the exception of tritium, potassium-40, radon and radon decay products. The methodology applied by the RPII assumes a consumption
rate of 2 litres per day
It is important to emphasise that the above requirements apply to routine operational conditions of existing or new water supplies. They are
not intended to apply to a water supply contaminated during an emergency involving the release of radionuclides into the environment. The
ingestion dose coefficients used to calculate indicative doses are set out below in Table 2.
Table 2 – Radiological data used to calculate indicatives doses for drinking water
Radionuclide Ingested Dose Coefficient for Adults
(Sv/Bq)1
Activity per radionuclide (mBq/l)
equivalent to 0-1 mSvPolonium-210 1.2 x 10⁻⁶ 117
Radium-226 2.8 x 10⁻⁷ 500
Thorium-232 2.3 x 10⁻⁷ 600
Uranium-234 4.9 x 10⁻⁸
Uranium-235 4.7 x 10⁻⁸ 3000
Uranium-238 4.5 x 10⁻⁸
Note 1 Source: ICRP,1996

Radioactivity Monitoring of the Irish Environment 2008 35

Radioactivity Monitoring of the Irish Environment 200836


Contact Us
Radiological Protection Institute of Ireland
3 Clonskeagh Square
Dublin 14
Ireland
Tel: 01 2697766
Fax: 01 2697437
Website: www.rpii.ie