Embed Size (px)
Citation preview
1
Radiometric age constraints for glacial terminations IX and VII
from aggradational sections of the Tiber River delta in Rome, Italy
Fabio Florindo1, Daniel B. Karner2, Fabrizio Marra1, Paul R. Renne3, Andrew P. Roberts4 and
Richard Weaver4
1Istituto Nazionale di Geofisica e Vulcanologia, Via di Vigna Murata, 605, I-00143 Rome, Italy
Tel.: +39 0651860383; Fax: +39 0651860397
2Department of Geology, Sonoma State University, 1801 East Cotati Avenue, Rohnert Park, CA 94985, U.S.A.
3Berkeley Geochronology Center, 2455 Ridged Road, Berkeley, CA 94720, U.S.A. and Department of Earth and
Planetary Sciences, University of California, Berkeley, CA 94720, U.S.A.
4National Oceanography Centre, Southampton, University of Southampton, European Way, Southampton SO14
3ZH, U.K.
Abstract. Buried sedimentary aggradational sections deposited between 800 ka and 600 ka in the
Tiber River coastal alluvial plain have been studied using borecores from around Rome. 40Ar/39Ar
ages on sanidine and/or leucite from intercalated tephra layers and paleomagnetic investigation of
clay sections provide geochronological constraints on the timing of aggradation of two of these
alluvial sections, and demonstrate that they were deposited in response to eustatic sea level rise
caused by glacial terminations IX and VII. 40Ar/39Ar age data indicate ages of 802 ± 8 ka and 649
± 3 ka for glacial terminations IX, and VII, respectively, providing a rare test, beyond the range
of U-series dating for corals and speleothems (~500 ka), of the astronomically calibrated
timescale developed for oxygen isotope records from deep sea cores.
Key words: Glacial termination, sea level, 40Ar/39Ar, paleomagnetism, Tiber River delta
2
1. Introduction
In recent work [1-4], we have shown that glacio-eustatic forcing controlled deposition of
sedimentary sections in the alluvial plain of the Tiber River and its tributaries near Rome. Using
40Ar/39Ar ages of tephra layers intercalated with the sedimentary deposits and paleomagnetic
constraints, we demonstrated that coastal sedimentary sections of the Tiber River and its
tributaries were deposited during marine transgressions associated with glacial melting. We have
used the geochronology of middle Pleistocene alluvial sections to build an independent
chronology of glacio-eustatic cycles for comparison with orbitally-tuned deep-sea δ18O records.
The sedimentary record of each complete glacially forced sea level oscillation in a coastal
area is represented by fluvial incision caused by coastline retreat and lower sea level during
glacial periods, and rapid sedimentation in this incised valley caused by sea level rise in response
to deglaciation. Here we use the term ‘aggradational section’ to describe the alluvial sedimentary
package left in each incised valley following each glacial maximum. Generally, the aggradational
sections that we recognize in Rome are fining-upward sequences, with coarse-grained gravel and
sand, approximately 10 m in thickness, at the base of each section. This basal coarse-grained
deposit is followed by a thin sand horizon, which grades upward into a several meters thick silt
and clay layer. Using 40Ar/39Ar ages of intercalated tephra in these aggradational sections, we
demonstrated (using sequence stratigraphic terminology) that the coarse-grained deposit formed
as part of the lowstand systems tract, whereas the uppermost fine-grained deposits correspond to
the transgressive systems tract and early highstand systems tract [1-3].
The area around Rome (Figure 1) was the site of marine deposition throughout Pliocene
and early Pleistocene time. The first appearance of a Tiber River delta, on which a thick
succession of clastic sediments accumulated, occurred late in marine isotopic stage (MIS) 22,
with deposition of the transgressive sediments of the Monte Ciocci-Monte delle Piche Formation
(referred to as the paleo-Tiber 1 unit) (Figure 2) [4]. Three younger aggradational sections
(referred to as the paleo-Tiber 2, 3 and 4 units) (Figure 2), which were deposited in the time span
3
800-600 ka, have been identified west of Rome in the Ponte Galeria area, where the Tiber delta
prograded into the Tyrrhenian Sea [3]. Ages of tephra layers intercalated in the younger two
sections, combined with reversed polarity paleomagnetic data for the oldest aggradational
section, allowed Marra et al. [3] to correlate these aggradational sections to MIS 19, 17 and 15
(Figure 2), respectively.
During the last decade, several attempts have been made to correlate similar alluvial
sections in Rome with these coastal sections in the Ponte Galeria area (Figure 1) [5-8]. However,
limited outcrop data, tectonic deformation around Rome, and lack of geochronological
constraints prevented definitive correlation of these sections. We have used data from a large
number of wells to reconstruct the underlying stratigraphy. Recently, three 60-80 m rotary cores
(hereafter the PSA, VVM and INGV borecores, Figure 3a, b; see line of section in Figure 1) were
taken by standard rotary drilling techniques by the Istituto Nazionale di Geofisica e Vulcanologia
in key areas to provide samples for paleomagnetic analysis of clays and 40Ar/39Ar age analysis of
interbedded tephra horizons. These data refine our larger well log database from the Rome area,
which contains approximately 250 well logs.
We present here new 40Ar/39Ar and paleomagnetic data from the alluvial sections that were
deposited by the Tiber River around Rome between 800 and 600 ka, and we discuss the
paleoclimatic implications of the timing of aggradation of these sections. Using these new age
constraints, we correlate the sections beneath Rome with those that crop out west of Rome, in the
Ponte Galeria area.
2. Stratigraphic setting
Continental sediments around Rome unconformably overlie late Pliocene to early
Pleistocene marine clay of the Monte Vaticano Formation [9].
Continental sediments around Rome unconformably overlie late Pliocene to early
Pleistocene marine clay of the Monte Vaticano Formation [9]. Throughout the area, the oldest
4
aggradational section above the marine substrate is a single 6-8-m-thick gravel layer, which
grades upward into sand and clay. An exception to this general stratigraphy occurs in a NW-
striking basin (the paleo-Tiber graben; Figure 3a) NE of Rome, where repeated sections of
gravels and clays are present above a lowered substrate. The uppermost of these gravel horizons
laterally correlates with the single gravel horizon outside the graben.
This oldest aggradational unit is overlain by a several meters thick layer of yellow to white
sandy clay with abundant carbonate concretions. It is not clear whether this later sedimentary
deposit constitutes a new aggradational section correlated to the successive MIS 17, or it is
deposited in the late high stand of stage 19.
The basal gravel layer of the oldest aggradational unit deepens from north to south:
interpretation of borehole stratigraphies (Fig. 3b) suggests that it is fragmented into several
blocks that have a horizontal attitude. It was previously interpreted [5] that a single aggradational
section of the Paleo-Tiber was dislocated by differential vertical movement since its deposition.
Differently from this interpretation, chronostratigraphic investigations performed for this study
evidences that two different aggradational units, laterally embedded from north to south, are
erosionally above the Plio-Pleistocene substrate in the central-southern area of Rome.
In order to provide radioisotopic age constraints for these aggradational sections, we
sampled tephra layers from borecores, and separated potassium-rich mineral phases (sanidine
and/or leucite) for 40Ar/39Ar age analysis. In addition, clayey intervals, when suitable, were
sampled for paleomagnetic investigation. The occurrence of the Matuyama-Brunhes (M-B)
geomagnetic reversal (790 ± 2 ka, recalculated here from data of Singer and Pringle [10] to take
into account the revised ages of irradiation standards [11]) offers us the opportunity to use
paleomagnetic data to distinguish clay sections of MIS 19 versus MIS 17.
Tephra layers are not frequent in these sedimentary sections because the major explosive
activity in the volcanic districts of this region started after 600 ka [12]. However, six tephra layers
were recovered in five borecores (PT-S2, I-9, I-7, PT-S6, PT-S14; see Figure 4) drilled in the
5
paleo-Tiber graben. All of these tephra layers occur in the uppermost clay horizon. Two of these
tephra (from borecores PT-S2, PT-S6) were dated by Karner et al. [12] and yielded ages of 802 ±
3 ka and 783 ± 7 ka, respectively, based on the age of 28.02 Ma for the irradiation standard Fish
Canyon Tuff sanidine [11].
Another tephra layer was recovered in southern Rome from the INGV borecore (Figure
3b). Here, a single gravel horizon is present, unconformably overlying a Pliocene marine clay
substrate. On top of this gravel, a 1-m-thick pyroclastic-flow deposit was recovered. Above it, a
sandy deposit grades upward into lacustrine clay. A well-developed, oxidized soil on top of the
lacustrine clay separates it from the overlying volcanic succession. A pumice fall deposit at the
base of the volcanic succession has an 40Ar/39Ar age of 582 ± 1 ka [12] based on the age of 28.02
Ma for Fish Canyon Tuff sanidine, whereas deeper in the section, two samples from the
pyroclastic-flow deposit within the sedimentary section were dated [12] at 649 ± 4 ka and 656 ± 2
ka, respectively, also based on Fish Canyon Tuff sanidine. Based on the different radioisotopic
ages for the tephra layers dated from the northern (PT-S2, I-9, I-7, PT-S6, PT-S14 borecores;
Figure 4) and southern (INGV borecore) areas, it is apparent that the aggradational sections in the
two sectors (Figure 3) must correlate to different glacio-eustatic sea level rises, namely to MIS 19
and MIS 15, respectively.
In order to constrain further the correlation with marine isotopic stages and to resolve
conflict with previous chronostratigraphic interpretations [5,6], we drilled two new boreholes and
sampled other cores for 40Ar/39Ar age analysis of tephra layers and paleomagnetic assessment of
clay horizons. These included cores from the transition zone between the area where the multi-
layered gravel succession is present and the area where a single gravel horizon occurs at the base
of the aggradational section beneath Rome. In addition, we paleomagnetically investigated the
clay section deposited above the pyroclastic flow deposit dated at around 650 ka in the INGV
borecore.
6
Despite our investigation of many borecores drilled between the center of Rome and the
INGV borecore site, no tephra layers have been identified within sediments from this area. All of
the recovered tephra layers are from sedimentary successions in tectonically lowered sectors of
Rome. This suggests that rapid burial during syn-sedimentary subsidence preserved these thin
tephra horizons, whereas in other areas they were removed by fluvial erosion.
3. Methods
3.1 40Ar/39Ar geochronology
Volcanic material was sampled from six sediment cores. The tephra layer from the INGV
borecore is a massive, zeolitized, ash matrix-supported deposit, including mm-to cm-sized yellow
and grey scoria clasts, yellow pumice clasts, lava and tuff lithic clasts, and mm-sized leucite and
sanidine crystals. Petrochemical characteristics of this deposit are the same as those of several
other primary pyroclastic flow deposits erupted from the Monti Sabatini Volcanic District and
cropping out throughout Rome [12]. The material sampled in the five borecores to the north of
Rome included graded and well-stratified ash-fall deposits (samples PT2B-S2, PTS6-A, I9-B),
interpreted to be primary, massive tuffaceous horizons that indicated a sudden flux of volcanic
material into the Tiber River (samples I9-A, PT-S14), and highly concentrated volcaniclastic
sediment (samples I7-A, VVM-S1, VVM-S2). While the age data acquired for each of these
materials can be straightforward to interpret, application of these data to the chronostratigraphic
history of the Tiber River system must be done carefully to account for (possibly) significant
delays between eruption and deposition in the sedimentary system. While deposition of primary
ash falls is nearly instantaneous, the delay could be significant for reworked volcaniclastic
horizons. For those horizons, we rely on other data (e.g., stratigraphic consistency with other
well-dated key horizons) to support our age interpretations, but several samples can only be used
to provide minimum age constraints.
7
40Ar/39Ar analyses were made at the Berkeley Geochronology Center using facilities and
procedures similar to those described by Karner and Renne [1]. When possible, sanidine and
leucite phenocrysts were used for independent age analysis, but for some samples, only one
mineral phase was present. Mineral separates were cleaned in an ultrasonic bath of 7% HF for
approximately 60 seconds to remove adhered glass and to reduce surficial atmospheric argon
contamination. Leucite and sanidine mineral separates were placed in aluminum disks along with
the Alder Creek Tuff sanidine standard or the Fish Canyon Tuff sanidine standard (1.194 Ma and
28.02 Ma, respectively, Renne et al. [11]) and irradiated in the CLICIT facility at the Oregon
State University TRIGA reactor for approximately 30 minutes, where cadmium shielding is
employed to minimize the 40K(n,p)40Ar reaction caused by thermal neutrons [13].
Two fully automated microextraction-mass spectrometer systems were used for the
40Ar/39Ar analyses, as described by Karner and Renne [1]. The MAP1 system includes a 6 W
continuous Ar-ion laser for sample heating, and a Mass Analyzer Products (MAP) 215 90° sector
extended-geometry mass spectrometer for isotopic analysis. MAP-III includes a CO2 laser and a
MAP 215-50 90° sector extended-geometry mass spectrometer with electrostatic analyzer.
Background corrections were made from full system blanks, which were run between every three
unknowns. Released gases were scrubbed of reactive species using Zr-Fe-V and Zr-Al alloy
getters, and the remaining gases were then admitted into the mass spectrometer, where the Ar ion
beam currents were measured on an electron multiplier. Mass discriminations (1.006-1.010/amu
for MAP1, 1.007/amu for MAPIII), applied as a power law correction, were determined by
analysis of atmospheric argon from air pipettes. Argon isotopes were corrected using procedural
blanks; long-term blank values were regressed such that between-blank variance was propagated
as a component of uncertainty.
Single-crystal total fusion analyses were performed on each sample whenever possible.
However, some of the samples contained crystals that were too small to yield high-precision
single-crystal ages. In these cases, multiple-crystal total-fusion analyses were made. Additional
8
analyses were made on samples suspected of having xenocrystic contamination, in order to
improve the chance of resolving the youngest age population. Ages (Table 1) are calculated from
the error-weighted mean 40Ar/39Ar ratios [14]. The best age estimate for each sample is the error-
weighted mean age from the youngest statistically-consistent population of crystals, whereby the
individual measurements were required to be within 2σ of the error-weighted mean value for
inclusion in the best age calculation. This criterion was used to identify and eliminate xenocrysts
or alteration from the best age estimate. Ages are reported with 1σ analytical precision in Table 1.
We also report for the best ages the full errors that take into account the systematic age errors
inherent to the 40Ar/39Ar method (see [1]). The inclusion of systematic errors is necessary for
accurate comparison with the orbital chronologies used to date glacial cycles, and hence is
important for the paleoclimate interpretations made later in this paper. Some age data that we
reported previously [12] were reprocessed here, to assess whether they are from the same
population, or distinct populations, as those samples analyzed here. To make this comparison in
an unbiased way, we reprocessed those data from Karner et al. [12] using the same data reduction
method used for the new data. These ages therefore differ slightly from what we have reported in
our earlier publications, but are well within analytical precisions stated previously.
3.2 Paleomagnetism
Two clay sections to the north and to the south of Rome, for which radiometric age data
indicated ages respectively older and younger than the Matuyama-Brunhes reversal, have been
paleomagnetically investigated. Consolidated fine-grained horizons in the VVM, PSA (northern
sector) and INGV (southern sector) borecores were sampled by drilling conventional cylindrical
paleomagnetic samples (25 mm diameter x 22 mm height) using a gasoline-powered hand drill
with a water-cooled diamond bit. Fifty-one oriented discrete samples were collected from the
VVM (19 samples), PSA (12 samples) and INGV borecores (20 samples). The borecores were
9
not azimuthally oriented. All samples were oriented with respect to vertical to enable polarity
determinations on the basis of paleomagnetic inclinations.
The natural remanent magnetization (NRM) was analysed within the magnetically shielded
paleomagnetic laboratory at the Istituto Nazionale di Geofisica e Vulcanologia, Rome, using a 2-
G Enterprises (model 755) narrow-access pass-through cryogenic magnetometer, equipped with
in-line alternating field (AF) demagnetization capability. The NRM was stepwise AF
demagnetized at successive peak fields of 5, 10, 15, 20, 25, 30, 40, 50, 60, 70, 80, 90 and 100
mT. Samples from the VVM and INGV cores were also thermally demagnetized at steps of 30-
40°C from room temperature until the remanences became unstable. Demagnetization data were
examined using orthogonal vector component diagrams, stereographic projections and intensity
decay curves. Characteristic remanent magnetization (ChRM) components were determined from
principal component analysis using data from multiple demagnetization steps [15]. The maximum
angular deviation (MAD) was calculated to provide an estimate of the precision related to each
best-fit line. Data with MAD ≥ 10° were considered poorly defined and are not presented here.
Mineral magnetic analyses, based on magnetic coercivity and thermal unblocking characteristics,
were conducted on a set of representative discrete samples.
Sediment microtextures were investigated using 12 polished thin sections in order to
examine the magnetic mineralogy. A LEO 1450VP scanning electron microscope (SEM),
operated at 15 keV at the National Oceanography Centre, Southampton, was used for these
observations. Elemental analyses were obtained from energy-dispersive X-ray spectra generated
from point analyses (2-3 µm beam diameter) of individual mineral grains, or of clusters of grains,
using a Princeton Gamma Tech (IMIX-PTS) system.
4. Results
4.1 40Ar/39Ar geochronology
4.1.1 Northern sector
10
40Ar/39Ar ages are reported in Table 1. Only one (I9) of the five borecores that contained
clay deposits from the northern sector of the Tiber River contained two tephra layers (Figure 4),
which enables us to distinguish at least two eruptive events from the series of samples whose ages
are statistically indistinguishable (Figure 5). Visual inspection of these two deposits suggests that
both are primary deposits with significantly different petrographic characteristics.
Sample I9-B, the stratigraphically lower deposit, is a yellow ash with approximately 10%
by volume red to brown scoria lapilli. The deposit contains a basal horizon of grain-supported ash
consisting of yellow pumice, scoria, and crystals of leucite, sanidine, clinopyroxene, and rare
biotite. The deposit grades upward into a matrix-supported ash. The overall textural and
stratigraphic features of this layer indicates that it is a primary ash fall horizon. The combined
40Ar/39Ar age from both the leucite and sanidine crystal populations is 804 ± 5 ka.
Sample I9-A, which lies above I9-B, consists of fine-grained yellow ash with a minor
white to yellow pumice lapilli component. Sanidine is common, while clinopyroxene, biotite and
leucite are rare. Compared to sample I9-B, sample I9-A is not obviously graded, it has fewer
crystals, and does not contain scoria lapilli. Given the differences between this unit and I9-B, we
interpret I9-A to be from a distinct volcanic eruption, and that it probably was a pumice and ash
fall. Sanidine from sample I9-A yielded an 40Ar/39Ar age of 784 ± 7 ka.
Two additional tephra samples intercalated at different depths in the same clay horizon
from the northern sector of the Tiber River clay deposits were previously collected [12] from two
different borecores (PT-S2 and PT-S6, Figure 4). The ages of these two tephra are recalculated
here to be 802 ± 3 ka (lower), and 783 ± 7 ka (upper), respectively, which agree well with the
ages obtained for samples I9-B and I-9A. Finally, two samples from two other borecores (I-7 and
PT-S14; Figure 4) yielded ages of 799 ± 6 ka and 795 ± 5 ka, respectively. These ages are
indistinguishable (including systematic errors) from either the older or the younger ages from
borecore I-9, and do not provide any further constraint.
11
The number and ages of distinct eruptive events can be assessed by considering
stratigraphic evidence for two eruptions in borecore I-9, with their associated radiometric ages of
804 ± 5 ka and 784 ± 7 ka, along with ages from samples PT-2bS2 and PTS6-A (802 ± 3 ka, 783
± 7 ka) which displays clear features of a primary deposit. Combining the ages of these two
groups of samples yields ages of 803 ± 8 ka and 783 ± 10 ka (1σ, including systematic errors) for
the two eruptive events. Two samples of highly concentrated volcaniclastic material were also
collected from an aggradational section that lies unconformably above the older paleo-Tiber clay
deposit in borecore VVM (Figure 4). From bottom to top, these samples (VVM-S6 and VVM-S1,
Figure 4) yielded stratigraphically inconsistent ages of 554 ± 4 and 586 ± 5 ka, indicating
reworking.
4.1.2 Southern sector
We re-calculated the ages of two samples from core INGV (Figure 3b) consisting of a
massive yellow ash containing infrequent scoria lapilli, and a phenocryst assemblage that is
dominated by sanidine and black to green clinopyroxene [12]. Small, rounded sedimentary clasts
also occur in this sample, which indicate that some reworking of the underlying gravel layer
occurred during emplacement, as is expected in a pyroclastic flow. Out of 34 separate age
analyses, 27 of which were on single crystals and 7 of which included two crystals, only six
single crystal analyses were included in the best age estimate. The error-weighted mean age for
these six analyses is 649 ± 2 ka (1σ). By including the systematic errors, the age is 649 ± 3 ka
(1σ).
4.2 Paleomagnetism
4.2.1 Northern sector - PSA borecore
The magnetization of the sampled clay interval in the PSA core is complex and is
characterized by acquisition of gyroremanent magnetizations (GRMs) during AF
12
demagnetization at peak fields greater than 50-60 mT (Figure 6). This behaviour is related to the
ubiquitous presence of magnetic iron sulphide minerals (Figure 6 d, e), but, despite the fact that
the demagnetization behaviour is far from ideal, it is still possible to isolate a ChRM at peak
fields ≤ 50-60 mT. Samples from the lowermost portion of the PSA core (below ca 10.0 m a.s.l.)
have a clear reversed polarity magnetization (Figure 6a, b), which indicates that this portion of
the core is older than the M-B boundary, in agreement with the 40Ar/39Ar ages obtained in the
nearby borecores where tephra layers intercalated in the clay have been dated at 804 ± 5 and 783
± 7 ka (Figure 4b). The dominance of normal polarity between 10 and 17.58 m a.s.l (Figure 6a) is
probably indicative of remagnetization during the Brunhes Chron (see discussion below).
4.2.2 Northern section - VVM borecore
The sampled clay intervals in borecore VVM have consistently stable magnetizations, as
indicated by both AF and thermal demagnetization results (Figure 7a-c). This permits
development of a clear polarity sequence. A reversal boundary is recorded in the VVM core at
14.2 m a.s.l. 40Ar/39Ar ages (Figure 4b) suggest that this reversal occurs too low in the sequence to
mark the position of the M-B boundary. While the clay section that lies above the gravel layer in
borecore PSA has reversed polarity in the lower part of the studied interval, the same clay section
in the VVM borecore has a normal polarity magnetization. We therefore conducted detailed
mineralogical investigations to verify whether the apparent mismatch between the 40Ar/39Ar ages
and the variable position of the observed normal to reversed polarity transition (which might
otherwise have been interpreted to indicate the M-B boundary) can be explained by a late
diagenetic remagnetization.
Thermal demagnetization of the studied samples indicates a major unblocking at 300-
400°C (Figure 7b), which is consistent with the presence of greigite (Fe3S4) (e.g. [16]) or
monoclinic pyrrhotite (Fe7S8) (e.g. [17]. AF demagnetization of replicate samples from the same
stratigraphic horizons results in acquisition of a GRM at peak fields above 50-60 mT, parallel to
13
the last axis along which an AF was applied (Figure 7c). GRM acquisition is common in single
domain (SD) magnetic grains, particularly in magnetic iron sulphides such as greigite (e.g. [18,
19], for which SD-like behaviour is commonly documented [16]. Confirmation of the SD nature
of the magnetic iron sulphide grains is provided by a typical first-order reversal curve (FORC)
diagram for these sediments (Figure 7f), which is similar to those for other greigite-bearing
sediments [20]. Finally, we have unequivocally demonstrated the presence of greigite by back-
scattered electron imaging (e.g., Figure 7d, e). The sediments contain patches of iron sulphide
aggregates that contain spherical (circular in cross-section) pyrite framboids made up of
reasonably large (~1 µm) pyrite octahedra. Many of these patches of iron sulphides also contain
less regularly shaped aggregates of much finer-grained greigite crystals. These greigite grains
appear to be responsible for the magnetization of the studied sediments and the close packing of
the grains is responsible for the substantial magnetostatic interactions evident in the vertical
spread of the FORC distribution (Figure 7f). All samples subjected to paleomagnetic analysis
provide evidence for a magnetic iron sulphide (e.g., Figure 6b, c) and all of the polished sections
investigated using the SEM contain greigite. No other magnetic iron sulphides were documented.
In most cases, greigite occurs in aggregates of the type shown in Figure 6d. Such
occurrences give little clear microtextural evidence about the timing of greigite formation (except
that it grew after the nearby pyrite framboids). Overgrowth of euhedral pyrite on early diagenetic
pyrite framboids is common in these samples (e.g., Figure 6e), which indicates prolonged
exposure to pore water sulphide with evolution of pore waters over time [21]. Some samples
provide more direct evidence that these sediments were remagnetized. In these cases, pyrite
nodules with dimensions of 0.5-1 mm are observed (e.g., Figure 7d). The centers of these nodules
are made up of microcrystalline pyrite, which are surrounded and overgrown by amorphous
gypsum (CaSO4.H2O) (Figure 7d). It is not clear whether these nodules grew during early
diagenesis or during later sulphidization. Variable corrosion of the edges of the pyrite nodule in
Figure 7d, and the halo around this nodule, indicate a fluid-rock interaction and suggest that the
14
gypsum grew as a result of reactions involving the underlying pyrite. Iron sulphides, which are
evident as bright regions in electron backscatter, appear to have grown even later on the outer
edges of the gypsum (Figure 7d). A close-up view of the boxed area in Figure 7d is shown in
Figure 7e, which demonstrates that these later-formed sulphides include coarser-grained pyrite
and finer-grained greigite. Microtextural evidence for the growth of this greigite after gypsum
provides evidence for a late diagenetic growth that can explain the observed remagnetization (see
[22] for more details).
In the Tiber River sediments, gypsum only occurs in association with pyrite nodules and
the sulphate in the gypsum appears to have been derived from the sulphide in the pyrite. For this
sulphate to sulphide reaction to occur, pyrite must undergo oxidation (see [22] for details). The
Tiber River clays were deposited in a brackish environment [5] under anoxic conditions that were
suitable for pyrite formation. These sediments are likely to have undergone oxidation by
percolation of oxic pore waters during deposition of the intercalated gravels. Oxidation of pyrite
nodules is therefore likely to have occurred during periods of lowered sea level. A later return to
anoxic conditions during a later marine transgression would have given rise to conditions where
sulphate in the gypsum could react with available iron to form late diagenetic greigite and pyrite,
as observed in Figure 7e (the relevant chemical reactions and mineralogical transformations are
given by [22]). The late diagenetic formation of greigite in these sediments appears to be a direct
result of non-steady state diagenesis that was driven by major changes in pore water conditions
associated with large amplitude sea level changes. Late diagenetic remagnetizations involving
greigite are being increasingly documented (e.g. [22-26], which suggests that greigite can be a
paleomagnetically problematical mineral. Overall, our SEM observations provide a solution to
the apparent contradiction between high precision 40Ar/39Ar ages and paleomagnetic
determinations because they confirm that the clays have been remagnetized as a result of late
diagenetic greigite growth. In this case, the 40Ar/39Ar ages provide a more robust indication of the
depositional age of the Tiber River sediments.
15
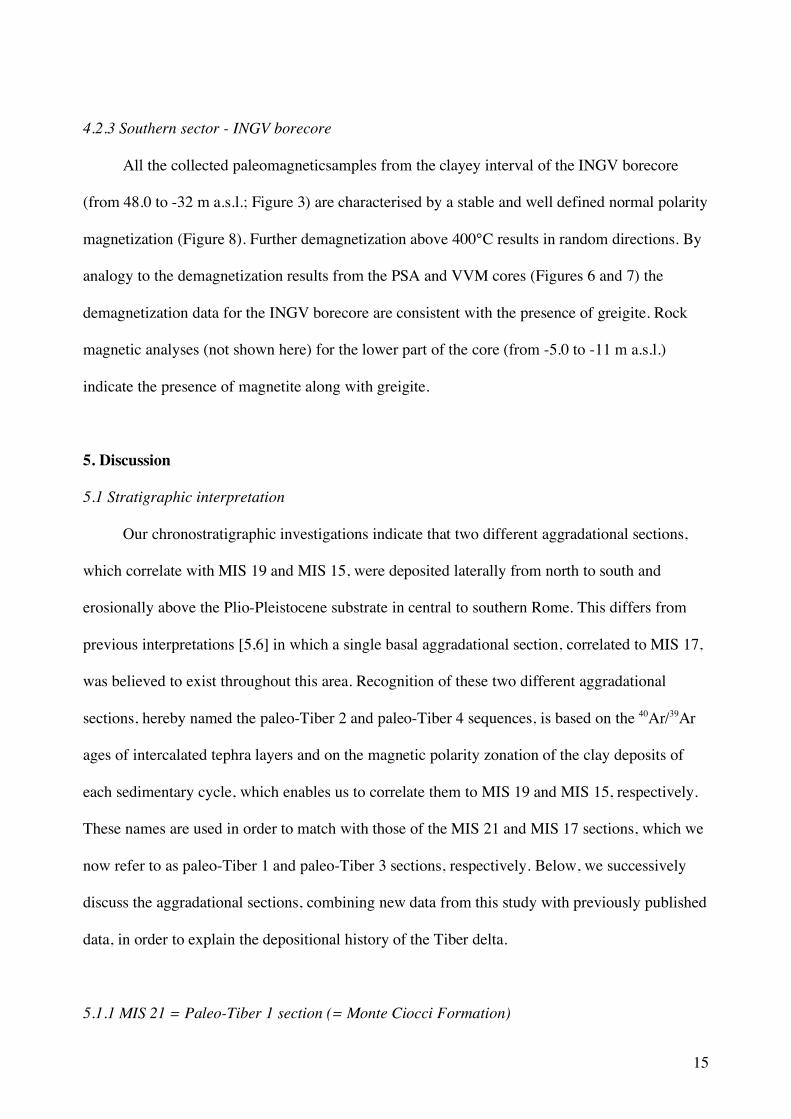
4.2.3 Southern sector - INGV borecore
All the collected paleomagneticsamples from the clayey interval of the INGV borecore
(from 48.0 to -32 m a.s.l.; Figure 3) are characterised by a stable and well defined normal polarity
magnetization (Figure 8). Further demagnetization above 400°C results in random directions. By
analogy to the demagnetization results from the PSA and VVM cores (Figures 6 and 7) the
demagnetization data for the INGV borecore are consistent with the presence of greigite. Rock
magnetic analyses (not shown here) for the lower part of the core (from -5.0 to -11 m a.s.l.)
indicate the presence of magnetite along with greigite.
5. Discussion
5.1 Stratigraphic interpretation
Our chronostratigraphic investigations indicate that two different aggradational sections,
which correlate with MIS 19 and MIS 15, were deposited laterally from north to south and
erosionally above the Plio-Pleistocene substrate in central to southern Rome. This differs from
previous interpretations [5,6] in which a single basal aggradational section, correlated to MIS 17,
was believed to exist throughout this area. Recognition of these two different aggradational
sections, hereby named the paleo-Tiber 2 and paleo-Tiber 4 sequences, is based on the 40Ar/39Ar
ages of intercalated tephra layers and on the magnetic polarity zonation of the clay deposits of
each sedimentary cycle, which enables us to correlate them to MIS 19 and MIS 15, respectively.
These names are used in order to match with those of the MIS 21 and MIS 17 sections, which we
now refer to as paleo-Tiber 1 and paleo-Tiber 3 sections, respectively. Below, we successively
discuss the aggradational sections, combining new data from this study with previously published
data, in order to explain the depositional history of the Tiber delta.
5.1.1 MIS 21 = Paleo-Tiber 1 section (= Monte Ciocci Formation)
16
The geochronological and stratigraphic evidence suggest that no section corresponding to
MIS 21 exists beneath central Rome. It is probable that the only remnants of this oldest
aggradational section are those found at about 55 m a.s.l. to the west of the Tiber River Valley
(Monte Ciocci and Gianicolo Hill localities; Figures 1, 2).
5.1.2 MIS 19 = Paleo-Tiber 2 section (= Ponte Galeria Formation 1 (PG1))
Figure 4b is an enlargement of the inset box in Figure 3a, and is a summary of the
stratigraphic, geochronological and paleomagnetic data from borecores on which we base the
correlation of the first (oldest) aggradational section in central Rome to glacial termination IX at
the beginning of MIS 19. As discussed above, the tephra layers recovered from borecores PT-S2,
PT-S6, PT-S14, I-7, and I-9 were deposited by at least two different eruptions dated at 803±8 ka
and 783±10 ka, respectively. No tephra layers were found in the clay deposits in two of the
borecores (VVM and PSA) on which paleomagnetic analysis was performed (Figure 4b).
However, stratigraphic correlation of the cores shown in Figure 4b shows that the clay horizon
between the upper gravel layer and the sandy clay layer with carbonate concretions is deposited
during the same chronostratigraphic event.
Based on radioisotopic and paleomagnetic data, we relate the deposition of the investigated
clay section to the marine transgression associated with glacial termination IX, which, based on
the obliquity-tuned benthic δ18O stack in Karner et al. [27], occurred at 795 ± 3 ka. Thus, the
aggradational section of basal gravel and the overlying clay section in central-northern Rome
correlate to MIS 19. This sequence must therefore be considered synchronous with the Ponte
Galeria 1 formation in Ponte Galeria (Basal Conglomerate and Helicella Clay, sensu Conato et al.
[28]. Following this, we interpret the entire multi-layered gravel and clay succession that fills the
paleo-Tiber graben to correlate with the single gravel horizon in the center of Rome and in Ponte
Galeria. Thus, following Marra and Rosa [5], the paleo-Tiber graben fill is interpreted to have
17
been influenced by syn-sedimentary tectonics (see Figure 9b), rather than being the result of
repeated episodes of channel and fill deposition.
5.1.3 MIS 17 = Paleo-Tiber 3 section (= Ponte Galeria Formation 2 (PG2))
The Ponte Galeria 1 formation in Ponte Galeria is followed by a second aggradational
section, the Ponte Galeria 2 formation, which has been correlated to MIS 17 [3]. The Ponte
Galeria 2 formation has basal gravel and sand that was deposited in a littoral environment [3] and
an upper portion of lagoon to littoral clay (“sand and gravel with frequent cross-lamination” and
“Venerupis senescens clay” of Conato et al. [28]). A volcaniclastic layer within the gravel at the
base of the Ponte Galeria 2 aggradational section in Ponte Galeria yielded an 40Ar/39Ar age of 758
± 4 ka (age re-calculated by Karner et al. [12] from data in Marra et al. [3]), which allows
correlation of the start of Ponte Galeria 2 deposition to the sea level lowstand of MIS 18.
However, petrographic features of this volcaniclastic layer, including substantial mixing with
clastic sediment, suggest significant reworking, and thus we interpret this age to be a maximum
age estimation for glacial termination VIII (i.e. the termination cannot be older than 758 ± 4 ka).
We suggest that the correlative inland portion of the Ponte Galeria 2 section in Rome is
represented by the sandy clay deposit with carbonate concretions that unconformably overlies the
grey clay of the paleo-Tiber 2 section. We therefore propose to name it the paleo-Tiber 3 section.
The absence of this deposit in southern Rome, where a younger aggradational section (correlated
to MIS 15) is present (Figure 3b), supports this interpretation. The sandy clay deposit with
carbonate concretions was already interpreted as a distinct aggradational section (paleo-Tiber 2b
unit) by Marra and Rosa [5] based on the unconformable contact with the lower gray clay and
based on gravel locally at its base. However, the lack of geochronologic age constraint and
having correlated the underlying aggradational section to MIS 17 caused them to interpret it as
having been deposited during MIS 15.
18
5.1.4 MIS 15 = Paleo-Tiber 4 section (= Santa Cecilia Formation)
We interpret that a younger aggradational section is present in southern Rome (Figure 3b)
and correlate it to MIS 15, based on the 40Ar/39Ar age of 649 ± 2 ka for a tephra layer in the INGV
core from southern Rome (Table 1, Figure 3b). The clay deposit recovered in the INGV borecore
has normal magnetic polarity, in agreement with radiometric age of the tephra at its base. We
have tentatively located the northern margin of this younger aggradational section in cross-
section of Figure 3b based on the lack of the sand with carbonate concretions unit in the
southernmost boreholes.
Previous correlation of the first aggradational section in Rome to MIS 17 was based on
paleomagnetic investigation of a borecore taken near the Colosseum [6] in which the clay has
normal polarity (COL in Figure 3b). The mineral responsible for the magnetic signal in the
Colosseum core is magnetite; therefore it is unlikely that the magnetization is a later diagenetic
remagnetization. Therefore, in Figure 3b we have attributed the sediments beneath the Colosseum
to the Paleo-Tiber 4 unit.
5.2 Paleoclimate implications
In order to discuss the paleoclimatic significance of the Tiber River aggradational sections,
we need to establish the relationship between the timing of their deposition and sea level changes
caused by glacial cycles. We begin by comparing glacial termination I with Holocene deposition
in the Tiber River delta. In Figure 9, we show the geographic distribution, lithostratigraphy and
calibrated 14C ages [29-31] of these deposits. The Holocene Tiber River sediments contain a
single gravel horizon at the base of the aggradational section. The top of this horizon uniformly
decreases in elevation throughout the fluvial channel and in the coastal plain (Figure 11). The
gravel grades upward into sand and clay. 14C ages of peat within the alluvial deposit indicate that
clay deposition began between 14,697-14,330 ka Cal BP and 12,949-12,645 ka Cal BP [F.
Bozzano, unpublished data). These 14C ages demonstrate that the gravel at the base of the
19
aggradational section in the Tiber River channel and coastal plain was deposited primarily
between the last glacial maximum (~19 ka [32]) and the glacial termination (~14 ka [33]). Thus,
we interpret that the onset of deposition of the fine-grained portion of the aggradational section
coincided with the last glacial termination, in response to sea-level rise. The lower portion of this
fine-grained section was rapidly deposited, as indicated by 14C ages (approximately 90% of the
clay was deposited in this locality by 8.5 ka). This also indicates that sea level had risen to -7 m
from its present elevation by 8.5 ka, in good agreement with coral records of sea level [31, 33].
Other 14C ages from borecores within Rome in a tributary of the Tiber River (the Velabrum
[34]) more thoroughly document inland Holocene aggradation. Similar to data from the coastal
plain and the main fluvial section, these data indicate that most of the aggradation occurred by
about 8 ka, after which sedimentation significantly slowed.
Using this Holocene analogue, ages of volcanic layers interbedded with older aggradational
sections of the Tiber River can help to date past glacial terminations. In particular, ages of tephra
layers that occur at the transition from coarse- and fine-grained sedimentation are interpreted to
date the glacial termination. While other features of an aggradational section, such as thickness
and depositional environment, may be influenced by the amplitude of the glacial signal and by
local tectonic movements, the sharp transition from coarse- to fine-grained sedimentation in these
sections is unequivocally controlled by the significant change in base-level at the glacial
termination. We assign the ages from tephra layers from the transition from coarse- to fine-
grained portions of two different aggradational sections to glacial terminations IX and VII,
respectively. These ages, considering the full errors (analytical and systematic errors) are as
follows:
1) Glacial Termination IX: 802 ± 8 ka (1σ). This is the age of the primary tephra layer at the base
of the finer-grained portion of the paleo-Tiber 2 sector in borecore PT-S2, which is precisely at
the transition from coarse-to fine-grained sedimentation;
20
2) glacial Termination VII: 649 ± 3 ka (1σ). This age is for the primary tephra layer at the top of
the basal gravel horizon of the paleo-Tiber 4 sector recovered in the INGV borecore. Again, the
position of this tephra at the transition from coarse- to fine-grained sedimentation provides an
excellent age for the timing of termination VII.
When compared to ages for a suitable deep-sea oxygen isotope curve (i.e., the low latitude
stack of Bassinot et al. [35]) that is tuned to obliquity, precession and eccentricity, it is apparent
that the Tiber River ages pre-date the ages of glacial terminations predicted from such an
astronomical calibration (Figure 10). Similar to other terrestrial proxies of climate oscillations [2,
36, 37], the disagreement between our radioisotopically based records and full orbital time scales
might be interpreted to suggests that the Milankovitch template does not provide accurate ages
for all glacial terminations. Previous constraints from tephra layers intercalated in the paleo-Tiber
sedimentary sections [2, 38] for glacial terminations III, V, and VI showed better agreement with
the ODP Site 806 obliquity-tuned timescale [39], rather than with the Site 806 record when it was
tuned to the Milankovitch template [40]. In the same way, the timing of glacial terminations IX
and VII predicted from an obliquity-tuned tropical benthic stack [27] is in better agreement with
the ages from the paleo-Tiber sections (Figure 10). Nevertheless, it is our opinion that a larger
number of independent evidences should be added to these observations in order to support the
notion that not all glacial terminations are caused by the same climate forcing signal.
6. Conclusions
Aggradational sections of the Tiber River flood plain were deposited in response to glacio-
eustatic sea level change at each glacial termination since the mid-Pleistocene climate transition.
By means of stratigraphic data, paleomagnetic investigation, and 40Ar/39Ar ages of tephra layers,
we have better identified and constrained the ages of two sedimentary sections that were
deposited during MIS 20-19 and MIS 16-15 (~800-600 ka). Sedimentary features and 14C
geochronology from available literature for the modern Tiber River fluvial channel and alluvial
21
plain deposits demonstrate that the sudden transition from a basal coarse-grained (gravel) to an
upper fine-grained (clay) deposit is coincident with the timing of the glacial terminations. Based
on these data, we estimate the ages of glacial terminations IX and VII to be 802 ± 8 ka and 649 ±
3 ka, respectively. These ages pre-date those predicted by tuning models that use a full-insolation
(i.e. eccentricity, obliquity and precession) tuning target, while they are in better agreement with
alternative tuning of δ18O records (e.g., obliquity-tuned time scales). Far from being an evidence
for rejecting Milankovitch’s theory, we believe that these data contribute to keep the discussion
about calibration methods of the δ18O curve alive.
Acknowledgments
We thank Leonardo Lombardi for suggestions and discussions concerning study of the Paleotiber
underneath Rome and Carlo Rosa for invaluable contributions to the stratigraphic study of the
boreholes and years of common study in the field. Reconstruction of the buried geology of Rome
would had not been possible without the expert contributions of: Francesca Bozzano, Angelo
Corazza, Vittorio Federici, Renato Funiciello, Maurizio Lanzini, Massimo Lenoci, Marcello
Martinelli, Maurizio Martino, Pietro Nigro, Roberto Salucci, and Claudio Succhiarelli. We thank
Richard Pearce for assistance with the SEM at the NOCS. DK thanks the Ann and Gordon Getty
Foundation and the Folger Foundation for partial support of this work.
22
References
[1] D.B. Karner, P.R. Renne, 40Ar/39Ar geochronology of Roman province tephra in the Tiber
River Valley: age calibration of Middle Pleistocene sea-level changes, Geol. Soc. Am.
Bull. 110 (1998) 740-747.
[2] D.B. Karner, F. Marra, Correlation of fluviodeltaic aggradational sections with glacial
climate history: a revision of the classical Pleistocene stratigraphy of Rome, Geol. Soc.
Am. Bull. 110 (1998) 748-758.
[3] F. Marra, F. Florindo, D.B. Karner, Paleomagnetism and geochronology of early Middle
Pleistocene depositional sequences near Rome: comparison with the deep sea δ18O climate
record, Earth Planet. Sci. Lett. 159 (1998) 147-164.
[4] D.B. Karner, F. Marra, F. Florindo, E. Boschi, Pulsed uplift estimated from terrace
elevations in the coast of Rome: evidence for a new phase of volcanic activity? Earth
Planet. Sci. Lett. 188 (2001a) 135-148.
[5] F. Marra, C. Rosa, Stratigrafia e assetto geologico dell’area romana, in “La Geologia di
Roma. Il Centro Storico”, Mem. Descr. della Carta Geol. d’It. 50 (1995) 49-118.
[6] F. Florindo, F. Marra, A revision for the Middle Pleistocene continental deposits of Rome
(Central Italy): paleomagnetic data, Ann. Geofis. 38 (1995) 177-188.
[7] S. Milli, Depositional setting and high-frequency sequence stratigraphy of the middle-
upper Pleistocene and Holocene deposits of the Roman basin. Geol. Rom., 33 (1997) 99-
136.
[8] G. Giordano, A. Esposito, D. De Rita, M. Fabbri, I. Mazzini, A. Trigari, C. Rosa, R.
Funiciello, The sedimentation along the Roman coast between middle and upper
Pleistocene: the interplay of eustatism, tectonics and volcanism - new data and review, Il
Quaternario, 16 (2003) 121-129.
[9] F. Marra, M.G. Carboni, L. De Bella, C. Faccenna, R. Funiciello, C. Rosa, Il substrato
Plio-Pleistocenico dell’area Romana, Boll. Soc. Geol. Ital. 114 (1995) 195-214.
23
[10] B.S. Singer, M.S. Pringle, Age and duration of the Matuyama-Brunhes geomagnetic
polarity reversal from 40Ar/39Ar incremental heating analyses of lavas, Earth Planet. Sci.
Lett. 139 (1996) 47-61.
[11] P.R. Renne, C.C. Swisher, A.L. Deino, D.B. Karner, T.L. Owens, and D.J. DePaolo,
Intercalibration of standards, absolute ages and uncertainties in 40Ar/39Ar dating, Chem.
Geol. 145 (1998) 117-152.
[12] D.B. Karner, F. Marra, P. Renne, The history of the Monti Sabatini and Alban Hills
volcanoes: groundwork for assessing volcanic-tectonic hazards for Rome, J. Volcanol.
Geotherm. Res. 107 (2001b) 185-219.
[13] N. Tetley, I. McDougall, H.R. Heydegger, Thermal neutron interferences in the 40Ar/39Ar
dating technique, J. Geophys. Res. 85 (1980) 7201-7205.
[14] P.R. Renne, K. Deckart, M. Ernesto, G. Féraud, E.M. Piccirillo, Age of the Ponta Grossa
dike swarm (Brazil) and implications for Paraná flood volcanism, Earth Planet. Sci. Lett.
144 (1996) 199-211.
[15] J.L. Kirschvink, The least-squares line and plane and the analysis of palaeomagnetic data,
Geophys. J.R. Astron. Soc. 62 (1980) 699-718.
[16] A.P. Roberts, Magnetic characteristics of sedimentary greigite (Fe3S4), Earth Planet. Sci.
Lett. 134 (1995) 227-236.
[17] M.J. Dekkers, Magnetic properties of natural pyrrhotite. II. High- and low-temperature
behaviour of Jrs and TRM as function of grain size, Phys. Earth Planet. Inter. 57 (1989)
266-283.
[18] I.F. Snowball, Gyroremanent magnetization (GRM) and the magnetic properties of greigite
bearing clays in southern Sweden, Geophys. J. Int. 129 (1997) 624-636.
[19] L. Sagnotti, A. Winkler, Rock magnetism and paleomagnetism of greigite-bearing
mudstones in the Italian peninsula, Earth Planet. Sci. Lett. 165 (1999) 67-90.
24
[20] A.P. Roberts, C.R. Pike, K.L. Verosub, FORC diagrams: a new tool for characterizing the
magnetic properties of natural samples, J. Geophys. Res. 105 (2000) 28,461-28,475.
[21] R. Raiswell, Pyrite texture, isotopic composition and the availability of iron, Am. J. Sci.
282 (1982) 1244-1263.
[22] A.P. Roberts, R. Weaver, Multiple mechanisms of remagnetization involving sedimentary
greigite (Fe3S4), Earth Planet. Sci. Lett. 231 (2005) 263-277.
[23] F. Florindo, L. Sagnotti, Paleomagnetism and rock magnetism in the upper Pliocene Valle
Ricca (Rome, Italy) section, Geophys. J. Int. 123 (1995) 340-354.
[24] W.T. Jiang, C.S. Horng, A.P. Roberts, D.R. Peacor, Contradictory magnetic polarities in
sediments and variable timing of neoformation of authigenic greigite, Earth Planet. Sci.
Lett. 193 (2001) 1-12.
[25] H. Oda, M. Torii, Sea-level change and remagnetization of continental shelf sediments off
New Jersey (ODP Leg 174A): magnetite and greigite diagenesis, Geophys. J. Int. 156
(2004) 443-458.
[26] C.J. Rowan, A.P. Roberts, Magnetite dissolution, diachronous greigite formation, and
secondary magnetizations from pyrite oxidation: Unravelling complex magnetizations in
Neogene marine sediments from New Zealand, Earth Planet. Sci. Lett. 241 (2006) 119-137.
[27] D.B. Karner, J. Levine, B.P. Medeiros, R.A. Muller, Constructing a stacked benthic δ18O
record, Paleoceanography, 17 (2002) 10.1029/2001pa000667.
[28] V. Conato, D. Esu, A. Malatesta and F. Zarlenga, New data on the Pleistocene of Rome,
Quaternaria 22 (1980) 131-176.
[29] F. Bozzano, A. Andreucci, M. Gaeta, R. Salucci, A geological model of the buried Tiber
River valley beneath the historical centre of Rome, Bull. Ang. Geol. Env. 59 (2000) 1-21.
[30] G. Belluomini, P. Iuzzolini, L. Manfra, R. Mortari, M. Zalaffi, Evoluzione recente del delta
del Tevere, Geologica Romana 25 (1986) 213-234.
25
[31] K. Lambeck, F. Antonioli, A. Purcell, S. Silenzi, Sea-level change along the Italian coast
for the past 10.000 yr, Quaternary Science Reviews 23 (2004) 1567-1598.
[32] E. Bard, B. Hamelin, R. Fairbanks, U-Th ages obtained by mass spectrometry in corals
from Barbados: sea level during the past 130,000 years, Nature 346 (1990) 456-458.
[33] E. Bard, B. Hamelin, M. Arnold, L. Montaggioni, G. Cabioch, G. Faure, F. Rougerie,
Deglacial sea-level record from Tahiti corals and the timing of global meltwater discharge,
Nature 382 (1996) 241-244.
[34] A.J. Ammerman, J. Miller, S. Ramsay, The mid-Holocene environment of the Velabrum in
Rome, Società Preistoria Protostoria Friuli-Venezia Giulia, Trieste, Quaderno 8 (2000) 9-
20.
[35] F.C. Bassinot, L.D. Labeyrie, E. Vincent, X. Quidelleur, N.J. Shackleton, Y. Lancelot, The
astronomical theory of climate and the age of the Brunhes-Matuyama magnetic reversal,
Earth Planet. Sci. Lett. 126 (1994) 91-108.
[36] I.J. Winograd, T.B. Coplen, J.M. Landwehr, A.C. Riggs, K.R. Ludwig, B.J. Szabo, P.T.
Kolesar, K.M. Revesz, Continuous 500,000-year climate record from vein calcite in Devils
Hole, Nevada, Science 258 (1992) 255-260.
[37] K.R. Ludwig, K. R. Simmons, B. J. Szabo, I.J. Winograd, J.M. Landwehr, A.C., Riggs,
R.J. Hoffman, Mass-spectrometric 230Th-234U-238U dating of the Devils Hole calcite vein,
Science 258 (1992) 284-287.
[38] D. B. Karner, F. Marra, 40Ar/39Ar dating of Glacial Termination V and the duration of
Marine Isotopic Stage 11: in: Earth’s Climate and Orbital Eccentricity: The Marine Isotope
Stage 11 Question, Geophysical Monograph 137 (2003) pp. 61-66, American Geophysical
Union, Washington, D.C.
[39] W.H. Berger, T. Bickert, H. Schmidt, T. Wefer, Quaternary oxygen isotope record of
pelagic foraminifers; Site 806, Ontong Java Plateau: Proc. ODP., Sci. Res. 130 (1992) 381-
395.
26
[40] W.H. Berger, T. Bickert, G. Wefer, M.I. Yasuda, Brunhes-Matuyama boundary; 790 k.y.
date consistent with ODP Leg 130 oxygen isotope records based on fit to Milankovitch
template, Geophys. Res. Lett. 22 (1995) 1525-1528.
27
Figure Captions
Figure 1. Digital Elevation Map (DEM) of the Rome area, with lines of Figure 2 and 3a, b
sections.
Figure 2. Cross-section (horizontal not to scale) of the stratigraphy of the paleo-Tiber River
sedimentary sections in the Ponte Galeria area west of Rome (see location in Figure
1). Ages of intercalated tephra layers and paleomagnetically investigated clay sections
indicates correlation of these sections to MIS 21 through 15. Past sea level elevations
during sea level high stands for each MIS, as inferred from the elevations of high
stand systems tracts of the associated sedimentary deposits [3] are also shown.
Vertical displacement, which occurred after deposition, is estimated from elevation
estimates in Karner et al. [4].
Figure 3. Cross-sections of the alluvial stratigraphy of the Tiber River around Rome (see location
in Figure 1). Anthropogenic fill is omitted. a) SW-NE oriented cross-section across
the paleo-Tiber graben; a single gravel horizon on eroded Pliocene marine substrate is
present at the base of the Pleistocene transgressive deposits in the southwest, whereas
repeated successions of gravel and clay fill the graben to the northeast. The clay
horizon above the gravel indicates reversed geomagnetic polarity, which indicates that
deposition preceded the Matuyama/Brunhes geomagnetic reversal (see text) (790 ± 3
ka, recalculated here from data reported by Singer and Pringle [10]). b) SSE-NNW
oriented cross-section through central-southern Rome. A single gravel horizon is
present in this area. The clay horizon above the gravel has normal geomagnetic
polarity, which indicates deposition during the Brunhes Chron (see text). Ages of
intercalated tephra layers also confirm younger deposition for the clay in southern
Rome. The erosional surface separating the two sedimentary sections is tentatively
drawn in b) based on stratigraphic and paleogeographic (see text) evidence. The
detailed stratigraphy within the grey box is shown in Figure 4b.

28
Figure 4. a) Location of the drilled sites. b) Enlarged portion of the cross-section of Figure 3a,
showing the detail of the sedimentary sections studied from borecores and sampled for
paleomagnetic and radioisotopic age analyses. On the left side, PSA and VVM are the
borecores drilled for this study.
Figure 5. Ideograms (age probability diagrams, using 2σ error distributions) of the six samples
recovered from borecores in the sediment of the paleo-Tiber River north of Rome. The
existence of two tephra layers within the same core (I9-A and I9-B) indicates that at
least two eruptive events occurred.
Figure 6. Core PSA. (a) Stratigraphic plot of the ChRM inclination, and polarity zonation. (b, c)
AF demagnetization plots for two samples from a depth of 31.40 (normal polarity)
and 39.20 m (reverse polarity). The AF demagnetization data indicate acquisition of a
GRM at fields above 60 mT. For the vector component diagram, open (closed)
symbols represent projections onto the vertical (horizontal) plane. Samples are not
azimuthally oriented and declinations are reported in the laboratory coordinate
systems. (e, f) Representative back-scattered electron images of iron sulphide minerals
from polished sections. (e) Pyrite (P) framboids with circular cross-section, composed
of relatively large individual crystals, surrounded by less regularly shaped patches of
finer-grained greigite (G) crystals (sample from 37.3 m in core PSA). (f) Early
diagenetic pyrite framboid (center) that has been overgrown/recrystallized by later
euhedral pyrite (sample from 39.2 m in core PSA).
Figure 7. Core VVM. (a) Stratigraphic plot of the ChRM inclination, and polarity zonation.
Representative (b) thermal and (c) AF demagnetization data for replicate samples
from a depth of 54.24 m. The AF demagnetization data indicate acquisition of a GRM
at fields above 60 mT and the thermal demagnetization data indicate a major decay in
remanence intensity at 200-400°C, both of which are indicative of a magnetic iron
sulphide mineral. For the vector component diagram, open (closed) symbols represent
29
projections onto the vertical (horizontal) plane. Samples are not azimuthally oriented
and declinations are reported in the laboratory coordinate systems. (d, e)
Representative back-scattered electron images of iron sulphide minerals from polished
sections. (d) A pyrite nodule from a sample from 43.20 m, the surface of which has
been oxidized to form gypsum (Gyp). Later-formed pyrite and greigite are present
around the edges of the gypsum (box shows area of high-magnification image in (e)).
(e) High-magnification view of pyrite and greigite that has grown on the surface of
gypsum that formed via oxidation of the pyrite nodule shown in (d). (f) Representative
FORC diagram (smoothing factor, SF=4) for a sample from 32.50 m in core PSA,
which indicates the presence of a relatively high coercivity mineral (Hc = ~55 mT)
with significant magnetostatic interactions, both of which are typical of magnetic iron
sulphide minerals (cf. Roberts et al. [20]).
Figure 8. Core INGV. (a) Lithology, stratigraphic plot of the ChRM inclination, and polarity
zonation. (b) Representative thermal and AF demagnetization data for replicate
samples from -6.33 m a.s.l. (c) Representative thermal and AF demagnetization data
for replicate samples from -8.57 m a.s.l. For the vector component diagram, open
(closed) symbols represent projections onto the vertical (horizontal) plane. Samples
are not azimuthally oriented and declinations are reported in the laboratory coordinate
systems.
Figure 9. Paleogeography of the Tiber River delta, with distribution of the basal coarse-grained
sediments of three different aggradational sections deposited during glacial
terminations IX, VII and I. Remnants of the penultimate depositional cycle (MIS 5
Tyrrhenian Stage aggradational section) are also shown. Southwestward (seaward)
shifting of the position of the Tiber delta from the oldest aggradational section (Monte
Ciocci sequence; MIS 22-21) to the youngest one (Holocene section of the Tiber
River) indicates progradation induced by tectonic uplift of the coastal area. Cross-
30
section a): longitudinal profile of the Holocene sedimentary section of the Tiber River,
reconstructed from borecore data (A, B, C, C’, C”); section D is an estimated
thickness for the outer delta. Ages of intercalated peat levels indicate that aggradation
was coeval throughout the fluvial system and that the transition from the coarse-
(basal gravel) to fine-grained (clay) units was coincident with the last glacial
termination (~13.8 ka, [33]). Cross-sections b) and c) are equivalent profiles for the
first two aggradational sections of the paleo-Tiber River, with present elevation above
sea level, stratigraphic features and tectonic interpretations indicated.
Figure 10. Comparison of radioisotopic ages of glacial terminations IX and VII, interpreted from
the continental sedimentary record of the Tiber River (shadowed bars are the full
(systematic plus analytical) age errors), with two differently calibrated oxygen isotope
time-scales: the astronomically tuned low-latitude stack of Bassinot et al. [35]; and the
obliquity-tuned tropical benthic stack of Karner et al. [27]. Similar to the obliquity-
tuned tropical benthic stack, the Tiber River delta ages for glacial terminations appear
to pre-date the timing of glacial terminations predicted by the low-latitude stack (the
inflection point of the ascending portion of the isotopic curve between a glacial
maximum and the following high stand).