Embed Size (px)
Citation preview

TKK Radio Science and Engineering Publications
Espoo, March 2009 REPORT R 7
RADIOWAVE PROPAGATION AND ANTENNAS FOR HIGH DATA RATE MOBILE COMMUNICATIONS IN THE 60 GHZ BAND Thesis for the degree of Doctor of Science in Technology
Sylvain Ranvier Dissertation for the degree of Doctor of Science in Technology to be presented with due permission of
the Faculty of Electronics, Communications and Automation, for public examination and debate in
Auditorium S4 at Helsinki University of Technology (Espoo, Finland) on the 3rd of April 2009
at 11 o’clock a.m.
Helsinki University of Technology
Faculty of Electronics, Communications, and Automation
Department of Radio Science and Engineering

Distribution:
Helsinki University of Technology
Department of Radio Science and Engineering
P.O. Box 3000
FI-02015 TKK
Tel. +358 9 451 2261
Fax +358 9 451 2267
E-mail [email protected]
© 2009 Sylvain Ranvier and TKK
ISBN 978-951-22- 9810-5 (paper)
ISBN 978-951-22-9811-2 (electronic)
ISSN 1797-4364 (paper)
ISSN 1797-8467 (electronic)

AB
ABSTRACT OF DOCTORAL DISSERTATION HELSINKI UNIVERSITY OF TECHNOLOGY P.O. BOX 1000, FI-02015 TKK http://www.tkk.fi
Author Sylvain Ranvier
Name of the dissertation Radiowave Propagation and Antennas for High Data Rate Mobile Communications in the 60 GHz Band
Manuscript submitted November 3, 2008 Manuscript revised February 4, 2009
Date of the defence April 3, 2009
Monograph Article dissertation (summary + original articles)
Faculty Faculty of Electronics, Communications and Automation Department Department of Radio Science and Engineering Field of research Radio Engineering Opponent(s) Prof. Lluis Jofre and Prof. Thomas Zwick Supervisor Prof. Pertti Vainikainen Instructor Dr. Clemens Icheln
Abstract The 60 GHz MIMO systems are seen as some of the best candidates for the implementation of future high data-rate short range communications systems such as wireless personal area networks (WPAN). Although the performance of MIMO systems has been studied thoroughly theoretically and experimentally at lower frequencies like at 2 and 5 GHz, there is a clear lack of measurement data and experimental performance evaluations of MIMO techniques at 60 GHz. Furthermore, more effort is still needed in the design and evaluation of compact low cost 60 GHz antennas for communication applications. In the first part of the thesis, the first 60 GHz MIMO channel measurement system is presented. It is based on a previously developed 2 and 5 GHz sounder and frequency converters. This system uses virtual antenna arrays to create the channel matrix. A measurement campaign is reported. In order to improve the delay resolution, two other MIMO measurement systems are presented, based on an ultra wide band (UWB) sounder and a vector network analyzer (VNA). Those systems allow full characterization of the MIMO channel in the delay and angular domains. In the second part of this work, the performance of multi-antenna techniques is evaluated based on the measurement data obtained in the first part of the thesis. Three of the most promising multi-antenna techniques, namely MIMO, antenna selection MIMO, and beam steering, are analyzed and compared. The presented results indicate that the mutual information of the measured MIMO channel is quite close to that of the independent and identically distributed (i.i.d.) MIMO Rayleigh channel. Furthermore, in realistic conditions it is seen that MIMO-antenna selection often leads to lower mutual information than traditional MIMO with the same number of RF chains. Moreover, it is shown that when considering phase shifters with realistic losses, MIMO technique almost always outperforms beam steering technique. In the last part of the thesis a 60 GHz planar omnidirectional antenna is presented. This antenna is very suitable for communications applications since it has low profile and uses a metal layer only on one side of the substrate. Therefore, it can be manufactured easily and at very low cost. In addition, an advanced quasi full 3-D radiation pattern measurement system has been developed to evaluate probe-fed antennas. Very good measurement repeatability is reported. The radiation of the probe is analyzed and is seen to be the main limitation of the dynamic range of the measurement setup.
Keywords MIMO channels, millimeter wave measurements, antennas, communications
ISBN (printed) 978-951-22-9810-5 ISSN (printed) 1797-4364
ISBN (pdf) 978-951-22-9811-2 ISSN (pdf) 1797-8467
Language English Number of pages 60
Publisher Helsinki University of Technology, Department of Radio Science and Engineering
Print distribution Helsinki University of Technology, Department of Radio Science and Engineering
The dissertation can be read at http://lib.tkk.fi/Diss/2009/isbn9789512298112

VÄITÖSKIRJAN TIIVISTELMÄ TEKNILLINEN KORKEAKOULU PL 1000, 02015 TKK http://www.tkk.fi
AB
Tekijä Sylvain Ranvier
Väitöskirjan nimi Radiowave Propagation and Antennas for High Data Rate Mobile Communications in the 60 GHz Band
Käsikirjoituksen päivämäärä 3.11.2008 Korjatun käsikirjoituksen päivämäärä 4.2.2009
Väitöstilaisuuden ajankohta 3.4.2009
Monografia Yhdistelmäväitöskirja (yhteenveto + erillisartikkelit)
Tiedekunta Elektroniikan, tietoliikenteen ja automaation tiedekunta Laitos Radiotieteen ja -tekniikan laitos Tutkimusala Radiotekniikka Vastaväittäjä(t) Prof. Lluis Jofre and Prof. Thomas Zwick Työn valvoja Prof. Pertti Vainikainen Työn ohjaaja Dr. Clemens Icheln
Tiivistelmä
60 GHz:n MIMO-järjestelmiä pidetään eräinä parhaista vaihtoehdoista tulevaisuuden lyhyen kantaman ja suuren tiedonsiirtonopeuden tietoliikennejärjestelmien, kuten wireless personal area network (WPAN)-järjestelmien, toteuttamiseen. Vaikka MIMO-järjestelmien suorituskykyä on tutkittu perinpohjaisesti sekä teoreettisesti että kokeellisesti alhaisemmilla taajuuksilla, kuten 2 ja 5 GHz:llä, on 60 GHz:lla mittausaineistossa sekä MIMO-tekniikoiden kokeellisessa suorituskyvyn evaluoinnissa selviä puutteita. Lisätutkimusta tarvitaan myös tietoliikennesovelluksissa käytettävien pienikokoisten ja edullisten 60 GHz:n antennien suunnittelussa ja evaluoinnissa.
Väitöskirjan ensimmäisessä osassa esitellään ensimmäinen 60 GHz:n MIMO-kanavamittausjärjestelmä. Se perustuu aiemmin kehitettyyn 2 ja 5 GHz:n kanavaluotaimeen sekä taajuuskertojiin. Tässä järjestelmässä käytetään virtuaalisia antenniryhmiä kanavamatriisin luomiseen. Laitteistolla mitattu mittauskampanja raportoidaan. Viiveresoluution parantamiseksi esitellään kaksi muuta MIMO-mittausjärjestelmää, jotka perustuvat ultra wide band (UWB)-luotaimeen sekä vektoripiirianalysaattoriin. Nämä järjestelmät mahdollistavat MIMO-kanavan täyden karakterisoinnin viive- ja kulma-alueessa.
Työn toisessa osassa moniantennitekniikoiden suorituskykyä arvioidaan väitöskirjan ensimmäisessä osassa saatujen mittaustulosten perusteella. Kolme lupaavinta moniantennitekniikkaa, jotka ovat MIMO, antennivalinta-MIMO ja keilan suuntaaminen, analysoidaan ja vertaillaan keskenään. Esitetyt tulokset osoittavat, että mitatun MIMO-kanavan keskinäisinformaatio on lähellä riippumattoman ja tasaisesti jakautuneen MIMO Rayleigh-kanavan keskinäisinformaatiota. Lisäksi nähdään, että realistisissa olosuhteissa antennivalinta-MIMO johtaa usein matalampaan keskinäisinformaatioon kuin perinteinen MIMO samalla RF-ketjujen lukumäärällä. Tämän lisäksi nähdään, että kun otetaan huomioon vaiheensiirtimien todelliset häviöt, MIMO-tekniikalla saavutetaan melkein aina parempi suorituskyky kuin keilansuuntaustekniikalla. Väitöskirjan viimeisessä osassa esitellään 60 GHz:llä toimiva planaarinen ympärisäteilevä antenni. Tämä antenni sopii hyvin tietoliikennesovelluksiin, koska se on matalaprofiilinen ja sen metallikerros on vain yhdellä puolella substraattia. Tämän vuoksi se voidaan valmistaa helposti ja hyvin pienillä kustannuksilla. Lisäksi työssä on kehitetty koplanaarisella mittapäällä syötettävien antennien suorituskyvyn mittaamiseen tarkoitettu uudentyyppinen miltei täysin kolmiulotteinen säteilykuvion mittalaitteisto. Mittalaitteistolla saavutetaan erittäin hyvä mittausten toistettavuus. Mittapään säteily analysoidaan ja nähdään, että se on merkittävin laitteiston dynaamista aluetta rajoittava tekijä. Asiasanat MIMO channels, millimeter wave measurements, antennas, communications
ISBN (painettu) 978-951-22-9810-5 ISSN (painettu) 1797-4364
ISBN (pdf) 978-951-22-9811-2 ISSN (pdf) 1797-8467
Kieli englanti Sivumäärä 60
Julkaisija Teknillinen korkeakoulu, radiotieteen ja -tekniikan laitos
Painetun väitöskirjan jakelu Teknillinen korkeakoulu, radiotieteen ja -tekniikan laitos
Luettavissa verkossa osoitteessa http://lib.tkk.fi/Diss/2009/isbn9789512298112

AB
RESUME DE LA THESE DE DOCTORAT UNIVERSITE DE TECHNOLOGIE D’HELSINKI P.O. BOX 1000, FI-02015 TKK http://www.tkk.fi
Auteur Sylvain Ranvier
Intitulé des travaux de thèse
Propagation des ondes radios et antennes pour les communications mobiles à très haut débit dans la bande 60 GHz
Manuscrit soumis le 3 novembre 2008 Manuscrit révisé le 4 février 2009
Date de la soutenance 3 avril 2009
Faculté Faculty of Electronics, Communications and Automation Département Department of Radio Science and Engineering Domaine de recherche Radio Engineering Membre(s) du jury Prof. Lluis Jofre et Prof. Thomas Zwick Superviseur Prof. Pertti Vainikainen Instructeur Dr. Clemens Icheln Résumé
La bande de fréquence millimétrique autour de 60 GHz est considérée comme l’une des meilleures options pour l’implémentation des réseaux sans fils à très hauts débits de type WPAN (wireless personal area network). De plus, les systèmes multi-antennes de type MIMO (multiple-input multiple-output) sont très prometteurs. Ils peuvent augmenter de manière significative l’efficacité spectrale ou la fiabilité des communications sans fil. De ce fait, l’utilisation de systèmes multi-antennes à 60 GHz est, théoriquement, très prometteuse. Bien que les performances des systèmes MIMO aient été étudiées de manière approfondie à la fois théoriquement et expérimentalement à basses fréquences (2 et 5 GHz), il y a clairement un manque d’évaluation expérimentale de ces systèmes à 60 GHz. De plus, la conception et l’évaluation d’antennes millimétriques compactes à bas coûts pour des applications de type WPAN sont des sujets sur lesquels beaucoup de recherches doivent être encore faites.
Dans la première partie de la thèse, le premier sondeur de canal MIMO à 60 GHz est présenté. Ce système, construit à partir d’un sondeur existant pour 2 et 5 GHz, utilise des réseaux d’antennes virtuelles. Afin d’améliorer la résolution temporelle, deux autres systèmes de mesure ont été développés. Le premier est construit à partir d’un sondeur ultra large bande et le second à partir d’un analyseur vectoriel de réseau. Ces systèmes permettent la caractérisation totale du canal MIMO dans les domaines temporel et angulaire.
Dans la seconde partie, les performances de techniques pour systèmes multi-antennes sont analysées grâce aux mesures obtenues dans la première partie de la thèse. Les trois techniques étudiées sont: MIMO, MIMO avec sélection d’antennes et dépointage de faisceau. Les résultats indiquent que la capacité du canal MIMO mesuré est relativement proche de celle d’un canal idéal. Dans des conditions réalistes, la capacité obtenue grâce à la technique MIMO avec sélection d’antennes est souvent inférieure à celle obtenue avec la technique MIMO. Par ailleurs, lorsque l’on considère un réseau à déphasage avec des pertes réalistes, il apparait que la capacité obtenue avec la technique MIMO est presque toujours supérieure à celle obtenue avec la technique du dépointage du faisceau. Dans la dernière partie de la thèse, une antenne omnidirectionnelle est présentée. Cette antenne convient parfaitement aux applications de types WPAN car elle est plane et n’utilise qu’une seule couche de métallisation, ce qui la rend facile à réaliser et peut coûteuse. De plus, un banc de mesure quasi-3D de diagrammes de rayonnement d’antennes à 60 GHz à été développé. Ce système a une très bonne répétabilité. Le rayonnement de la pointe elle-même a été mesuré et les résultats indiquent que c’est la principale limitation de la dynamique d’amplitude de ce système.
Mots clés Canal MIMO, mesure d’ondes millimétriques, antennes, communications
ISBN (imprimé) 978-951-22-9810-5 ISSN (imprimé) 1797-4364
ISBN (pdf) 978-951-22-9811-2 ISSN (pdf) 1797-8467
Langue Anglais Nombre de pages 60
Editeur Université de Technologie d’Helsinki, Department of Radio Science and Engineering
Distribution Université de Technologie d’Helsinki, Department of Radio Science and Engineering
La thèse peut être lue à http://lib.tkk.fi/Diss/2009/isbn9789512298112


à Mimine et J.C.
IX

X

Preface The research work presented in this thesis has been carried out during 2003-2008. Most of the research has been done at the Department of Radio Science and Engineering (Former Radio Laboratory) at Helsinki University of Technology (TKK). In addition, during this period I had the opportunity to work one year at the Electronics, Antennas and Telecommunications Laboratory (LEAT), a joint research laboratory supported by CNRS and the University of Nice-Sophia Antipolis (UNSA), in France. The work has been partly founded by the Academy of Finland, TEKES and TKK. I am also grateful to Nokia Foundation for the additional support. I would like to thank Prof. Antti Räisänen, head of the department, for giving me the opportunity to join the Radio Laboratory in 2003. I express my deep gratitude to Prof. Pertti Vainikainen who gave me the opportunity to work on this challenging subject. I highly appreciate his support, his numerous ideas and our inspiring discussions. I am also very grateful to Prof. Robert Staraj for his guidance, support and valuable suggestions. I warmly thank my instructor Dr. Clemens Icheln for his support and his always positive attitude when facing problems. I am very thankful to Dr. Cyril Luxey for accepting to be my instructor at UNSA, for the many motivating discussions we had and his encouraging attitude toward my work. I would like to thank Dr. Jarmo Kivinen and Dr. Pasi Suvikunnas for their help, their advices and for sharing with me their valuable knowledge at the beginning of this work. Dr. Katsuyuki Haneda deserves special thanks for the numerous and fruitful discussions we had. I also would like to thank Mikko Kyrö for the smooth co-operation, which made possible the writing of many articles. I would like to thank Prof. Lluis Jofre and Prof. Michael Jensen for reviewing the thesis and for their valuable comments and suggestions. I would like to express my thanks to all my colleagues for the very pleasant working atmosphere. Special thanks to Stina Lindberg and Tuula Mylläri for taking care of many practical things, which made my life in Finland more enjoyable. I thank Lorenz Schmuckli for his immediate help when I faced computer problems. I thank also Eino Kahra and Lauri Laakso for building some parts of our measurement systems. I would like also to thank Dmitry Chicherin for our numerous discussions not only on science. I am very grateful to my parents and brothers for their endless support and encouragements, with special thanks to Jean Eudes. My dearest thanks are for my beloved wife Galia for her patience, support and love, and to our wonderful son Paul for making my days so full of joy and happiness. I know that I have asked a lot from them and I thank them with all my heart.
XI

XII

Table of contents Table of contents...........................................................................................................................XIII List of publications ...................................................................................................................... XIV Contributions of the author..........................................................................................................XV 1. Introduction...............................................................................................................................1
1.1. Background ...................................................................................................................... 1 1.2. Objectives of the work..................................................................................................... 2 1.3. Contents of the thesis....................................................................................................... 2
2. 60 GHz MIMO measurement systems ....................................................................................3 2.1. Introduction ..................................................................................................................... 3 2.2. Antenna arrays ................................................................................................................ 4 2.3. Narrow band system........................................................................................................ 4
2.3.1. Measurement system ............................................................................................... 4 2.3.2. Measurement campaign.......................................................................................... 5
2.4. Wide band systems .......................................................................................................... 6 2.4.1. UWB sounder based system ................................................................................... 6
2.4.1.1. Measurement system....................................................................................... 6 2.4.1.2. Measurement results....................................................................................... 7
2.4.2. VNA based system ................................................................................................... 9 2.4.2.1. Measurement system....................................................................................... 9 2.4.2.2. Measurement results....................................................................................... 9
2.5. Comparison of the measurement systems ................................................................... 10 3. Performance evaluation of multi-antenna systems ..............................................................12
3.1. Introduction ................................................................................................................... 12 3.2. MIMO Systems .............................................................................................................. 13
3.2.1. Comparison of measured and iid MIMO Rayleigh channels ............................ 13 3.2.2. Comparison of mutual information in the 2, 5 and 60 GHz bands................... 14 3.2.3. Effect of the antenna array orientation on the mutual information................. 15
3.3. MIMO systems with antenna selection ........................................................................ 16 3.3.1 Selection of antennas in sub-arrays ..................................................................... 16 3.3.2. Results .................................................................................................................... 17
3.4 Beam steering systems ................................................................................................... 19 3.4.1 Selection of the beam............................................................................................. 20 3.4.2 Ideal case ................................................................................................................ 20 3.4.3 Realistic case .......................................................................................................... 21
4. Planar omnidirectional antenna for 60 GHz applications ..................................................23 4.1. Introduction ................................................................................................................... 23 4.2. Antenna design and fabrication ................................................................................... 23 4.3. Antenna characteristics................................................................................................. 25
5. Antenna measurements at 60 GHz ........................................................................................27 5.1. Introduction ................................................................................................................... 27 5.2. Design of the measurement system .............................................................................. 27
5.2.1. RF part ................................................................................................................... 27 5.2.2. Mechanical part ..................................................................................................... 28
5.3. Test measurements ........................................................................................................ 29 5.3.1. Radiation of the probe .......................................................................................... 29 5.3.2. Measurement of test antenna ............................................................................... 30
6. Summary of publications ...................................................................................................32 7. Conclusions and future work ................................................................................................35 References ........................................................................................................................................38
XIII
List of publications This thesis is based on the work presented in the following papers. [P1] S. Ranvier, J. Kivinen, and P.Vainikainen, “Mm-wave MIMO radio channel sounder,” IEEE Transactions on Instrumentation and Measurement, June 2007, vol. 56, no 3, pp. 1018-1024. [P2] S. Ranvier, M. Kmec, R. Herrmann, J. Kivinen, J. Koivunen, R. S. Thomä, and P. Vainikainen, “Mm-wave wideband MIMO channel sounding,” Proc. of XXVIIIth URSI General Assembly, New Delhi, India, Oct. 23-29, 2005, Paper 01644. [P3] S. Ranvier, M. Kyrö, K. Haneda, T. Mustonen, C. Icheln, and P. Vainikainen, “VNA-Based Wideband 60 GHz MIMO Channel Sounder With 3-D Arrays,” Proc. of IEEE Radio and Wireless Symposium 2009, 18 - 22 Jan, 2009, San Diego, CA, USA. [P4] S. Ranvier, C. Icheln, and P. Vainikainen, “Measurement-based mutual information analysis of MIMO antenna selection in the 60 GHz band,” IEEE Antennas and Wireless Propagation Letters, to be published. [P5] M. Kyrö, S. Ranvier, C. Icheln, and P. Vainikainen, “Measurement based mutual information analysis of beam steering in the 60 GHz band,” Proc. of European Conference on Antennas and Propagation 2009. [P6] S. Ranvier, S. Dudorov, M. Kyrö, C. Icheln, C. Luxey, R. Staraj, and P. Vainikainen, “Low cost planar omnidirectional antenna for mm-wave applications,” IEEE Antenna and Wireless Propagation Letters, 2008, Vol. 7, pp. 521-523. [P7] S. Ranvier, M. Kyrö, C. Luxey, R. Staraj, C. Icheln, and P. Vainikainen, “Compact 3-D on wafer radiation pattern measurement for 60 GHz antennas,” Microwave and Optical Technology Letters, Dec. 2008, Vol. 51, no. 2, pp. 319 - 324.
XIV

Contributions of the author [P1] This author had the main responsibility for developing the measurement system, conducting the measurement campaign and preparing the manuscript. Dr. Jarmo Kivinen participated in the development of the system and in data processing. The work was supervised by prof. Pertti Vainikainen. [P2] This author had the main responsibility in conducting the measurement campaign and preparing the manuscript. The system was developed jointly by Martin Kmec and this author. Jukka Koivunen participated in the data processing, under the supervision of this author. The work was supervised by prof. Reiner Thomä and prof. Pertti Vainikainen. [P3] This author had the main responsibility for developing the measurement system and preparing the manuscript. Tuomas Mustonen participated in the development of the system under the supervision of this author. The test measurements were jointly performed by Mikko Kyrö, Dr. Katsuyuki Haneda, Tuomas Mustonen and this author. The work was supervised by Dr. Clemens Icheln and prof. Pertti Vainikainen. [P4] This author had the main responsibility for performing the data analysis and preparing the manuscript. The work was supervised by Dr. Clemens Icheln and prof. Pertti Vainikainen. [P5] Mikko Kyrö and this author performed the data analysis and prepared the manuscript in close cooperation. The work was supervised by Dr. Clemens Icheln and prof. Pertti Vainikainen. [P6] This author had the main responsibility for designing the antenna, analyzing the data and preparing the manuscript. Sergei Dudorov manufactured the antenna. Mikko Kyrö participated in the radiation pattern measurement. The work was supervised by Dr. Cyril Luxey, prof. Robert Staraj, Dr. Clemens Icheln and prof. Pertti Vainikainen. [P7] This author had the main responsibility for developing the measurement system, analyzing the data and preparing the manuscript. Mikko Kyrö participated in the development of the system and in the radiation pattern measurement. The work was supervised by Dr. Cyril Luxey, prof. Robert Staraj, Dr. Clemens Icheln and prof. Pertti Vainikainen.
XV

XVI

1. Introduction
1.1. Background
The need for short-range very-high data-rate communications systems is growing all the time and will continue to increase in the future. These wireless connections, usually referred to as wireless personal area networks (WPANs) [1], are needed in numerous applications such as high speed internet access, real time streaming and wireless USB [2]. The communications systems are expected to provide data rate higher than 1 Gbit/s and to cover distances up to 10 m. Such data rate requires a very wide bandwidth. The 60 GHz frequency band is one of the best candidates [2]-[4]. First, a 7 GHz license-free bandwidth has been allocated almost all around the world [1]. Furthermore, due to the short wavelength (about 5 mm) antenna arrays with large number of elements can be realized in small volume e.g. in a mobile phone, a PDA (Personal Digital Assistant) or the corner of a laptop computer. Due to the high additional oxygen absorption rate, about 16 dB/km at 60 GHz, this band is not appropriate for long range communications but is very suitable for short range which, in practice, means mainly indoor communications. The high path loss at this frequency can be overcome with high transmit power since 60 GHz regulation allows much higher transmit power than other existing wireless local area networks (WLANs) and WPANs [4]. In addition, the fast development of low cost 60 GHz CMOS chips [5]-[10] makes the 60 GHz band a very strong candidate for WPANs. In order to increase the spectral efficiency, one of the most promising technique is to use several transmit and receive antennas. This technique, referred to as multiple input multiple output (MIMO), has been studied extensively for more than two decades theoretically, e.g. [11]-[14], and at some frequencies also with channel measurements, e.g. [15], [16]. MIMO systems can take advantage of multipaths by transmitting and receiving signals over several parallel sub-channels, referred to as spatial multiplexing. MIMO can also be used for transmit or receive diversity to increase the reliability of the link [17]. Therefore, the use of MIMO systems in the 60 GHz band is theoretically very promising and is expected to achieve the needed very high data rates. Nevertheless, the implementation of such systems raises several challenges in many research areas including channel modeling, antenna design and antenna characterization. The implementation of MIMO systems at 60 GHz differs substantially in some aspects (e.g. propagation channel, hardware performance and cost) from MIMO systems at lower frequencies (e.g. 2 or 5 GHz bands). Therefore, several issues have to be considered specifically for the 60 GHz band. First, the achievable capacity of MIMO systems is defined by the availability of parallel propagation channels in the multipath environment. Then, the performance prediction of 60 GHz mobile radio links requires thorough investigation of the delay and angular domains of the channel. Furthermore, the usual techniques to optimize the use of multiple antennas (e.g. antenna selection, beam steering, etc.) have to be investigated specifically for 60 GHz indoor radio communications. Moreover, another issue is the design of proper antennas. In order to be used in mobile terminals, the antennas have to be compact, low profile and manufactured at very low cost, which is very demanding at 60 GHz. In addition, in order to fully characterize the antennas and predict their performance, the 3-D radiation pattern has to be measured. Such measurement is challenging at 60 GHz since traditional measurement
1
systems cannot be used directly. There are still many issues in other areas such as signal processing and circuit design, but they are outside the scope of this work.
1.2. Objectives of the work The general objectives of the thesis are: to develop a measurement system which allows the 3-D double-directional radio channel characterization, to provide realistic channel mutual information expectations for different multi-antenna configurations based on channel measurements and to give insights into the design and measurement of mobile terminal antennas at 60 GHz. The thesis has been divided into three parts. The objective of the first part is to measure the multidimensional 60 GHz MIMO channel. Since no such measurement system has been found in the literature, the first goal is to design a measurement system, which allows the characterization of the 60 GHz MIMO radio channel. Several solutions are studied and implemented (e.g. sounder-based or VNA-based measurement system). A further aim is to carry out measurement campaigns in different indoor environments. The goal of the second part is to use the data from the channel measurements mentioned above to compare the most promising multi-antenna techniques in real environments, namely MIMO, MIMO-antenna selection (MIMO-AS), and beam steering. For the third part, the first objective is to design a low-cost compact monolithic 60 GHz antenna suitable for mobile terminals and channel measurements. A further aim is to develop a 60 GHz radiation pattern measurement system for probe-fed antennas and to use it to characterize the antenna designed in the previous stage of the work.
1.3. Contents of the thesis In the first part of the thesis [P1]-[P3], three MIMO channel measurement systems with different advantages and drawbacks are presented and compared with each other. [P1] introduces the first 60 GHz MIMO channel measurement system in the world, based on a channel sounder. [P2] presents an mm-wave MIMO channel sounder based on an ultra wideband (UWB) sounder, which exhibits very high delay resolution. A vector network analyzer (VNA) based measurement system is presented in [P3]. In the second part, [P1], [P4] and [P5], the performance of MIMO, MIMO-AS and beam steering are compared for different configurations, considering realistic hardware implementations. The performance of MIMO is analyzed in [P1]. [P4] and [P5] present the performance evaluation of MIMO-AS and beam steering, respectively. The third part of the thesis is based on [P6] and [P7]. [P6] describes the design of a compact 60 GHz antenna for mobile terminals and channel measurements and [P7] presents the design and reliability of a radiation pattern measurement system for probe-fed antennas.
2
2. 60 GHz MIMO measurement systems
2.1. Introduction
Channel measurements are essential since they are required to implement realistic channel models. In addition, those measurements are needed to make realistic antenna performance evaluation – either by means of antenna evaluation methods such as MEBAT [18] or from direct measurement [P1], [P4], [P5]. To study the physical propagation phenomena occurring in indoor environments and develop accurate channel models, a large bandwidth is required. In addition, in order to allow the analysis of future high data-rate communications systems, the bandwidth of the measurement system have to be at least equal to the one of the system under evaluation. As proposed in [19], future systems may have up to 2 GHz bandwidth. The nominal delay resolution DR and spatial resolution SR are inversely proportional to the bandwidth BW. A first order estimation is:
BWDR 1
= (2-1)
and
BWcSR = (2-2)
where c is the velocity of the light. The nominal delay range DRa is given by
BWNDRa 1−
= , (2-3)
where N is the number of samples in the code or in the frequency domain. Single-input single-output (SISO) and MIMO channel measurements can be realized either in frequency or in time domain. Frequency domain measurements are performed either with a dedicated sounder (based on direct sequence waveforms, a sliding correlator or a stepping correlator) [20]-[25] or with VNA [26], [27]. Time domain measurements are performed by pulse sounding techniques [28]. The main drawbacks of pulse sounding techniques are the difficulty of calibration and the uneven power distribution in the frequency spectrum. For these reasons, only frequency domain measurements are considered in this thesis. The main advantage of dedicated sounders is the very fast measuring time which allows Doppler analysis and acquisition of very large set of data. Nevertheless, these sounders often have limited bandwidth or delay range. VNA-based measurement systems offer potentially much wider bandwidth but have longer measurement duration (due to the sweep time). In frequency domain sounding, 60 GHz measurement systems are usually based on low frequency systems with frequency converters. Basically, MIMO measurement systems are based on SISO systems. At low frequencies, i.e. 2 and 5 GHz bands, several MIMO measurement systems have been developed by university laboratories [15], [29] or are commercially available [30], [31]. Although several 60 GHz SISO [26], [21], [27] and single input multiple output (SIMO) [22], [32], [28] channel measurements have been reported for more than a decade, no MIMO radio channel sounder for 60 GHz has been found in the literature. Some of the reasons for that are the higher requirements, complexity and cost of mm-wave systems. To measure accurately the 60 GHz channel, the
3
measurement system must have higher phase stability and wider bandwidth. In addition, the design and realization of switchable antenna arrays, such as those used in the 2 and 5 GHz MIMO sounders, are much more difficult to construct and expensive at 60 GHz.
2.2. Antenna arrays
At mm-wave range, one of the major issues in the implementation of MIMO measurement systems is to have a proper antenna array. In order not to increase the complexity of the system (parallel architecture and calibration of the parallel branches) only one transmit and one receive antenna must be active at a time. There are basically two solutions to solve this problem, either to use switched arrays or virtual arrays. In the first solution, switches are used to select each element of the array independently, as described in [15]. Nevertheless, at 60 GHz the integration of switches with the antenna array is difficult. In addition, 60 GHz switches have quite high losses – about 1 dB insertion loss for single-pole double-throw. The second solution is based on “virtual antenna arrays” using linear stages (e.g. [23], [25]). The terms “virtual antenna arrays” or “synthetic arrays” are used because there are no real arrays. There are only one antenna at the transmitter and one antenna at the receiver. These antennas are moved in order to get a channel matrix. This solution has been used all along this work for the following reasons. The first advantage, as compared to switched array, is the possibility of full reconfiguration: it allows creating any array geometry in one, two or three dimensions (e.g. square, cube, cylinder or sphere) with any number of elements and spacing between elements, only with software modification. In addition, the radiating element can be changed as well, depending on the measurement purpose. Another advantage is the ease of calibration, since only one transmit and one receive antenna are used. In addition, it leads to good link budget since there are no losses in switches. The main disadvantage of virtual arrays is the duration of the measurement, due to the relatively slow moving of the antennas (mechanical limitation). Therefore, only static channels can be measured. In addition, measurement duration limits the number of elements per array because of the phase drift and also for practical reasons.
2.3. Narrow band system
2.3.1. Measurement system
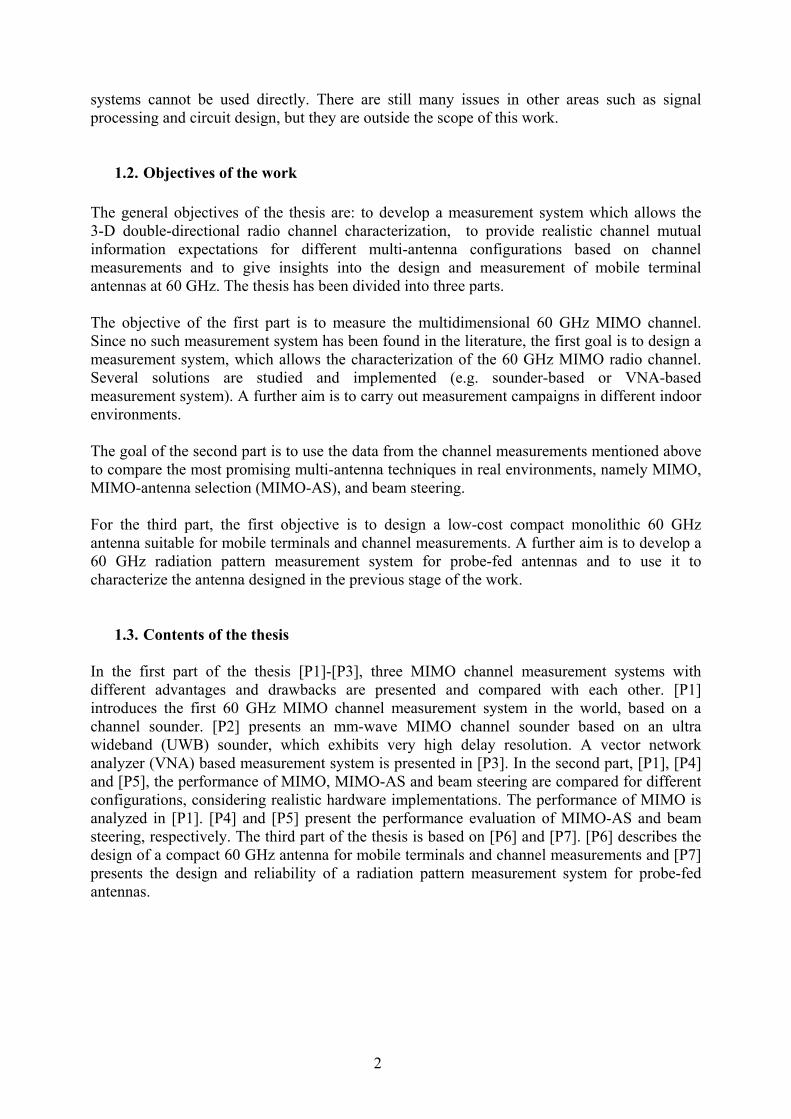
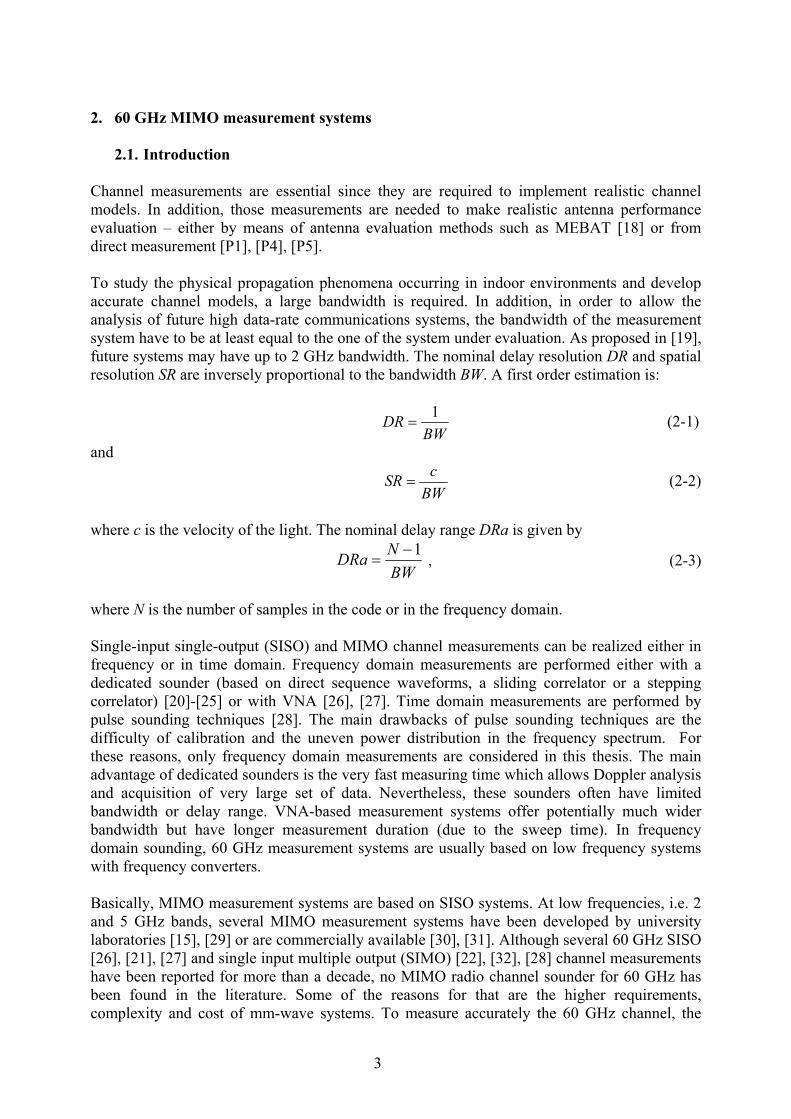
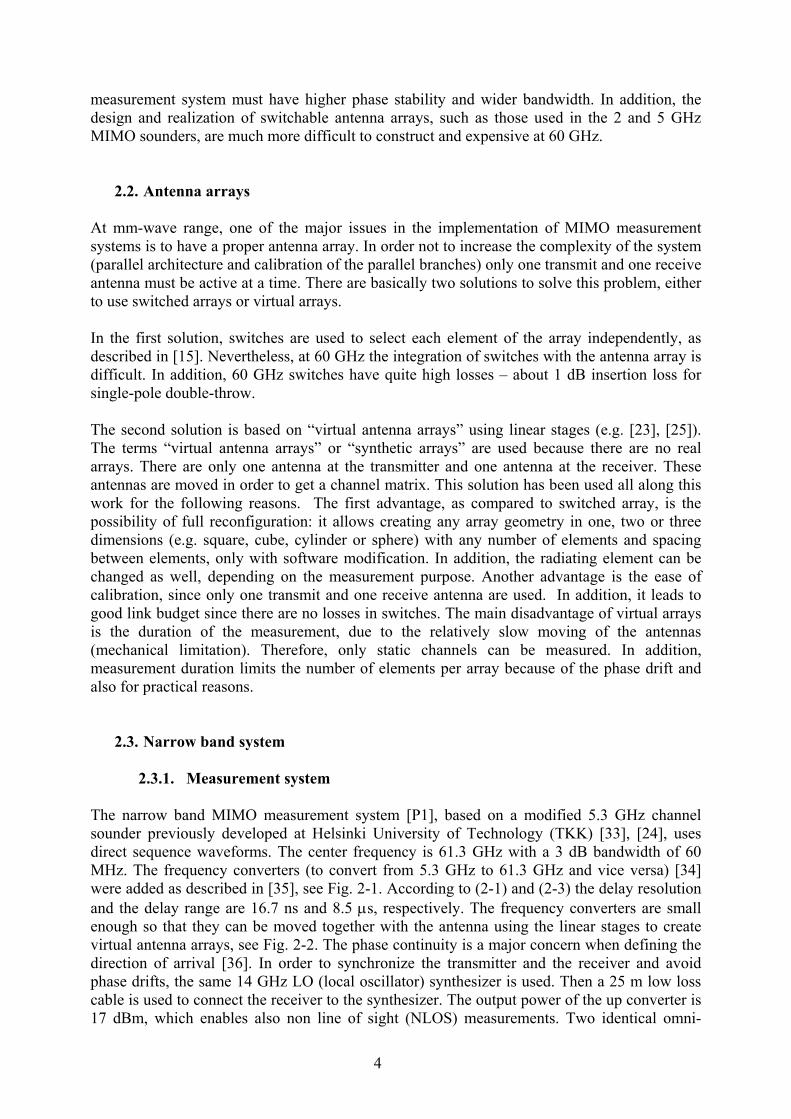
The narrow band MIMO measurement system [P1], based on a modified 5.3 GHz channel sounder previously developed at Helsinki University of Technology (TKK) [33], [24], uses direct sequence waveforms. The center frequency is 61.3 GHz with a 3 dB bandwidth of 60 MHz. The frequency converters (to convert from 5.3 GHz to 61.3 GHz and vice versa) [34] were added as described in [35], see Fig. 2-1. According to (2-1) and (2-3) the delay resolution and the delay range are 16.7 ns and 8.5 μs, respectively. The frequency converters are small enough so that they can be moved together with the antenna using the linear stages to create virtual antenna arrays, see Fig. 2-2. The phase continuity is a major concern when defining the direction of arrival [36]. In order to synchronize the transmitter and the receiver and avoid phase drifts, the same 14 GHz LO (local oscillator) synthesizer is used. Then a 25 m low loss cable is used to connect the receiver to the synthesizer. The output power of the up converter is 17 dBm, which enables also non line of sight (NLOS) measurements. Two identical omni-
4
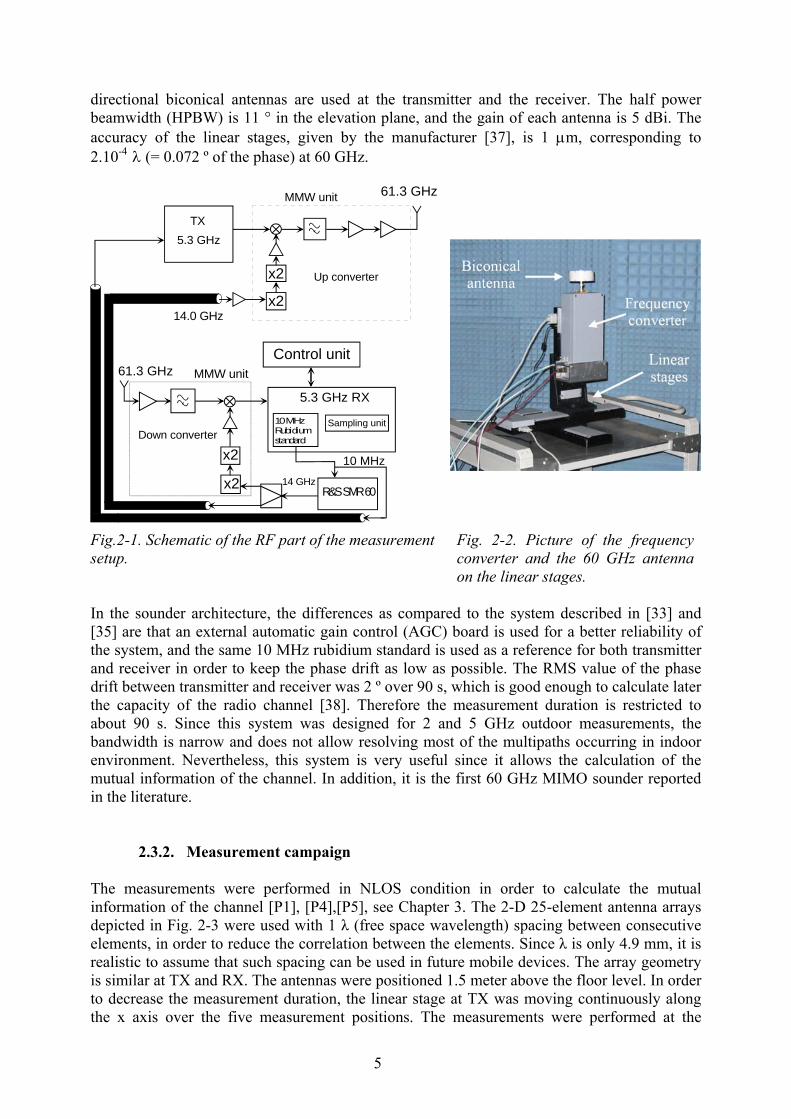
directional biconical antennas are used at the transmitter and the receiver. The half power beamwidth (HPBW) is 11 ° in the elevation plane, and the gain of each antenna is 5 dBi. The accuracy of the linear stages, given by the manufacturer [37], is 1 μm, corresponding to 2.10-4 λ (= 0.072 º of the phase) at 60 GHz.
61.3 GHz
R&S SMR 60
10 MHzx2
x2
10 MHzRubidiumstandard
61.3 GHz
14.0 GHz
Control unitMMW unit
MMW unit
TX
5.3 GHz RX
x2
x2
5.3 GHz
Up converter
Down converterSampling unit
14 GHz
Fig.2-1. Schematic of the RF part of the measurement setup.
Fig. 2-2. Picture of the frequency converter and the 60 GHz antenna on the linear stages.
In the sounder architecture, the differences as compared to the system described in [33] and [35] are that an external automatic gain control (AGC) board is used for a better reliability of the system, and the same 10 MHz rubidium standard is used as a reference for both transmitter and receiver in order to keep the phase drift as low as possible. The RMS value of the phase drift between transmitter and receiver was 2 º over 90 s, which is good enough to calculate later the capacity of the radio channel [38]. Therefore the measurement duration is restricted to about 90 s. Since this system was designed for 2 and 5 GHz outdoor measurements, the bandwidth is narrow and does not allow resolving most of the multipaths occurring in indoor environment. Nevertheless, this system is very useful since it allows the calculation of the mutual information of the channel. In addition, it is the first 60 GHz MIMO sounder reported in the literature.
2.3.2. Measurement campaign The measurements were performed in NLOS condition in order to calculate the mutual information of the channel [P1], [P4],[P5], see Chapter 3. The 2-D 25-element antenna arrays depicted in Fig. 2-3 were used with 1 λ (free space wavelength) spacing between consecutive elements, in order to reduce the correlation between the elements. Since λ is only 4.9 mm, it is realistic to assume that such spacing can be used in future mobile devices. The array geometry is similar at TX and RX. The antennas were positioned 1.5 meter above the floor level. In order to decrease the measurement duration, the linear stage at TX was moving continuously along the x axis over the five measurement positions. The measurements were performed at the
5

Department of Radio Science and Engineering of TKK. The walls are 13 cm thick and made of bricks. The receiver was kept in a room, while the transmitter was moved to 24 different positions in a corridor (Fig. 2-4). The room is used for laboratory experiments and is occupied by many metallic objects such as computers, measurement systems and metal shelves.
1 5 10 m
RXy
x
987 151413121110 19181716 201 2 3 4 5 6 232221 24
TX
Fig. 2-3. Antenna array configuration.
Fig. 2-4. Measurement location.
2.4. Wide band systems
In order to overcome the main drawback of the measurement system presented in Section 2.3 (narrow bandwidth), two other systems were developed. The UWB sounder based system and the VNA-based system presented in this section have very wide nominal bandwidth, 7 and 3.5 GHz, respectively. Therefore, they are very suitable to characterize accurately the 60 GHz indoor MIMO channel.
2.4.1. UWB sounder based system
2.4.1.1. Measurement system The system presented in [P2] is based on an UWB SISO sounder developed in the Electronic Measurement Research Laboratory of Ilmenau University of Technology (Germany) [39] and the mm-wave MIMO sub-system consisting in the frequency converters and virtual antenna arrays described in section 2.3.1. The UWB sounder uses a direct sequence waveform with broadband real-time sampling, which enables fast measurements. The nominal sounder bandwidth extends from 3.5 to 10.5 GHz which leads to a measurement frequency band of 59.5 - 66.5 GHz. The code contains 511 samples. According to (2-1) the nominal delay resolution is about 142 ps, which leads to a nominal spatial resolution of about 42 mm (2-2). The nominal delay range given by (2-3) is about 73 ns. A description of the RF part of the measurement setup is given in Fig. 2-5. Without calibration, the actual bandwidth of the system is narrower than 7 GHz. The frequency converters are the limiting components. The actual 3 dB bandwidth of the back to back frequency response of the whole setup is about 2.5 GHz, as shown in Fig. 2-6.
6

Laboratory synthesizer
10 MHzx2
x2
59.5 - 66.5 GHzMMW unitMMW unit
UWB sounder
x2
x2
3.5 - 10.5 GHz
Up converter
Down converter
14 GHz
3.5 GHz to 10.5 GHz
59.5 - 66.5 GHz
3.5 - 10.5 GHz
25 meters
15 meters
Fig. 2-5. Schematic of the RF part of the measurement setup.
60 61 62 63 64 65 66-25
-20
-15
-10
-5
0
Frequency (GHz)
Nor
mal
ized
bac
k to
bac
k fre
quen
cy re
spon
se (d
B)
Fig. 2-6. Back to back frequency response of the measurement setup. After warming up, the RMS value of the phase drift of the whole system is about 1º per hour. Therefore, the measurement duration was not restricted by the phase drift, and it has been possible to reduce the speed of the linear stages to achieve high spatial accuracy. Contrary to the measurement reported in Section 2.3.2, the antenna was stopped at each measurement point inside the array. The measurement time of one snapshot (625 channels) was 14 min. The standard deviation of the errors in the beam pointing, calculated from 10 successive line of sight (LOS) measurements, is less than 0.3 ° at RX and TX.
2.4.1.2. Measurement results
A set of measurements has been performed at Ilmenau University of Technology. The walls between the room and the corridor are 280 mm thick, and are made of concrete. The distance between TX and RX is 3.8 m. The geometry of the antenna arrays is similar to the one presented in Section 2.3.2, except that the spacing between adjacent elements is 1.8 mm instead of 4.9 mm. This spacing corresponds to 0.4 λmin, where λmin is the free space wavelength of the highest frequency (66.5 GHz). This is done in order to reduce the level of the spurious responses in direction of departure (DoD) and direction of arrival (DoA) estimations. The array geometry is similar at TX and RX. Both antennas were positioned 1.5 m high above the floor. Fig. 2-7 shows the DoD and DoA of the three strongest paths from the NLOS measurement (scenario depicted in Fig 2-8). They are calculated using the traditional beam forming algorithm independently at each end of the radio channel. The processing is based on the
7

phasing of adjacent elements and weighting of the element signals. The DoD and DoA estimations reported in the thesis have the same mathematical basis as in [40] but in 2-D and with only one polarization (vertical). Based on the DoD, DoA and the delay domain information obtained from the power delay profile (PDP) (plotted in Fig. 2-9), the three strongest multipaths are investigated. An estimation of the signal paths is plotted in Fig. 2-8.
Fig.2-7. TX and RX beam forming responses for the 3 strongest paths. Independent logarithmic scale for each path.
0 10 20 30 40 50 60 70 80-35
-30
-25
-20
-15
-10
-5
0
Nor
mal
ized
pow
er (d
b)
Time (ns)
1st path
2nd path
3rd path
Fig. 2-8. Estimation of the 3 strongest paths using ray tracing method.
Fig. 2-9. Normalized power delay profile averaged over 625 channels.
It can be seen that the first path (17.4 ns) contains one reflection from the edge of the door frame. The second path (34.1 ns) contains two reflections and the third path (40 ns) contains three reflections. It is clearly seen that no signals go through the wall. Due to the short code length, inter-code interferences occur. The peak visible in Fig. 2-9 at about 2.5 ns is due to this phenomenon.
8
2.4.2. VNA based system
2.4.2.1.Measurement system A VNA based MIMO measurement system operating in the 60 GHz band has been developed [P3]. The frequency converters and radiating elements are similar to those described in section 2.3.1. This sounder has a bandwidth of 3.5 GHz, operating from 60.5 to 64 GHz. The 3.5 GHz bandwidth corresponds to the 5dB bandwidth of the setup, as shown in Fig. 2-6. According to (2-1) and (2-2) the nominal delay resolution is 0.29 ns and the spatial resolution is 8.6 cm, respectively. The RMS phase drift of the whole setup is less than 1º over more than 10 hours. Therefore the phase drift is not a limitation for the measurement duration. The number of frequency points is set to 501. According to (2-3) the delay range is 143 ns, which is about twice the delay range obtained with the system described in Section 2.4.1. The difference between the antenna arrays used in this setup and those reported in Sections 2.3.2 and 2.4.1.1 is that a third axis has been added at TX and RX so that there are two 3-D arrays.
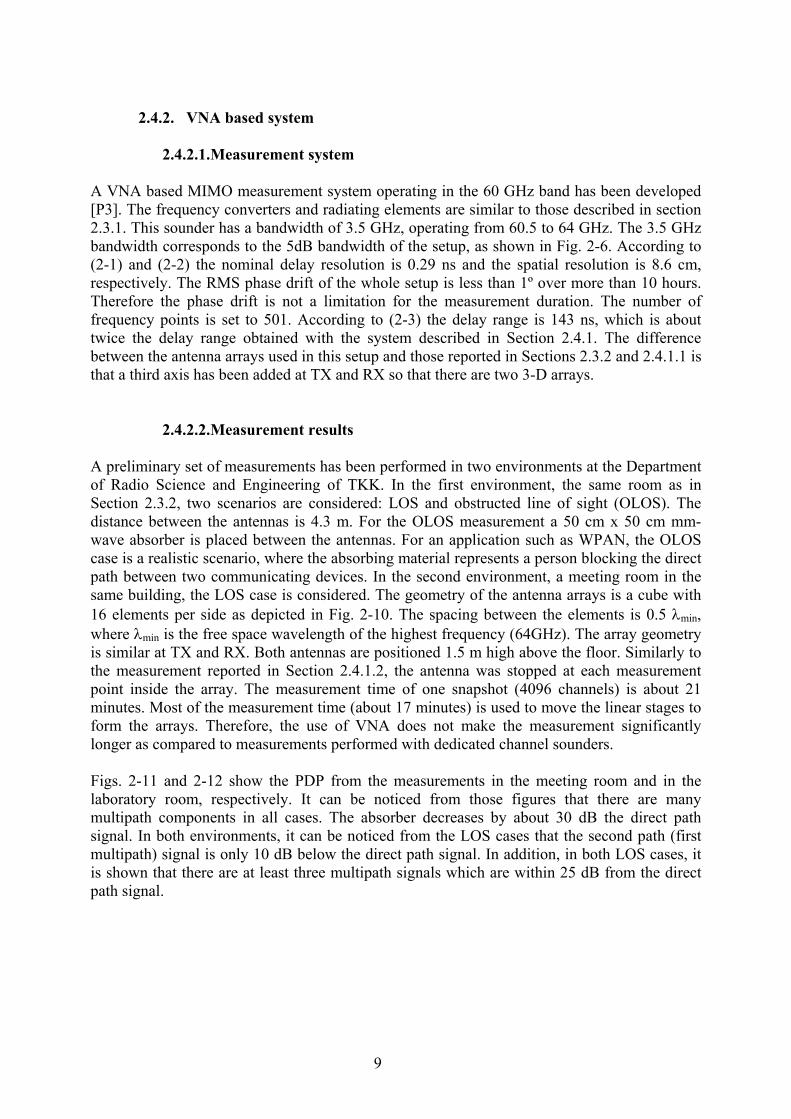
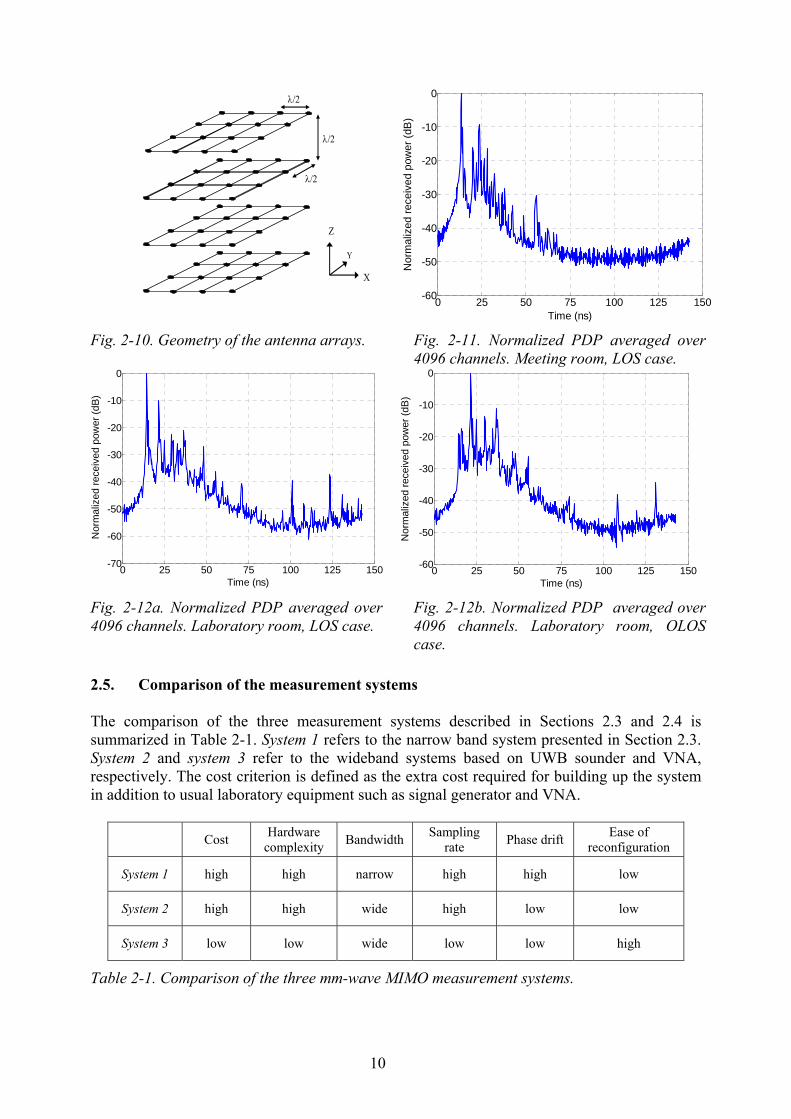
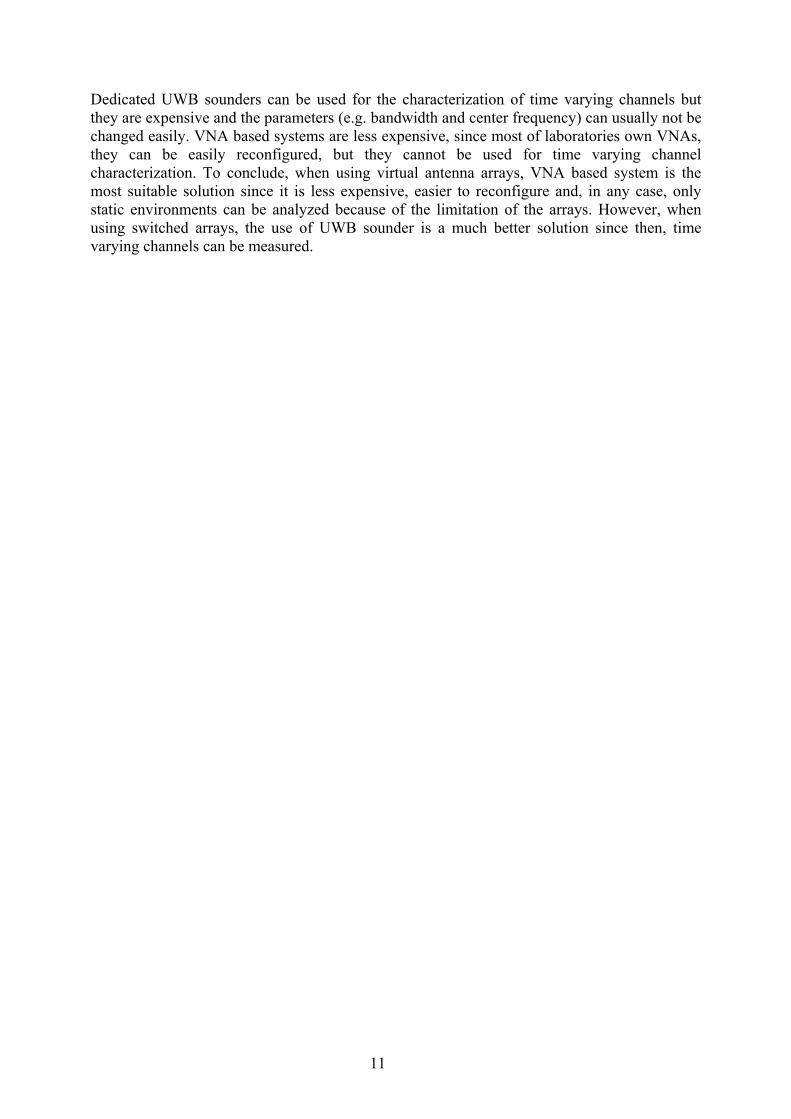
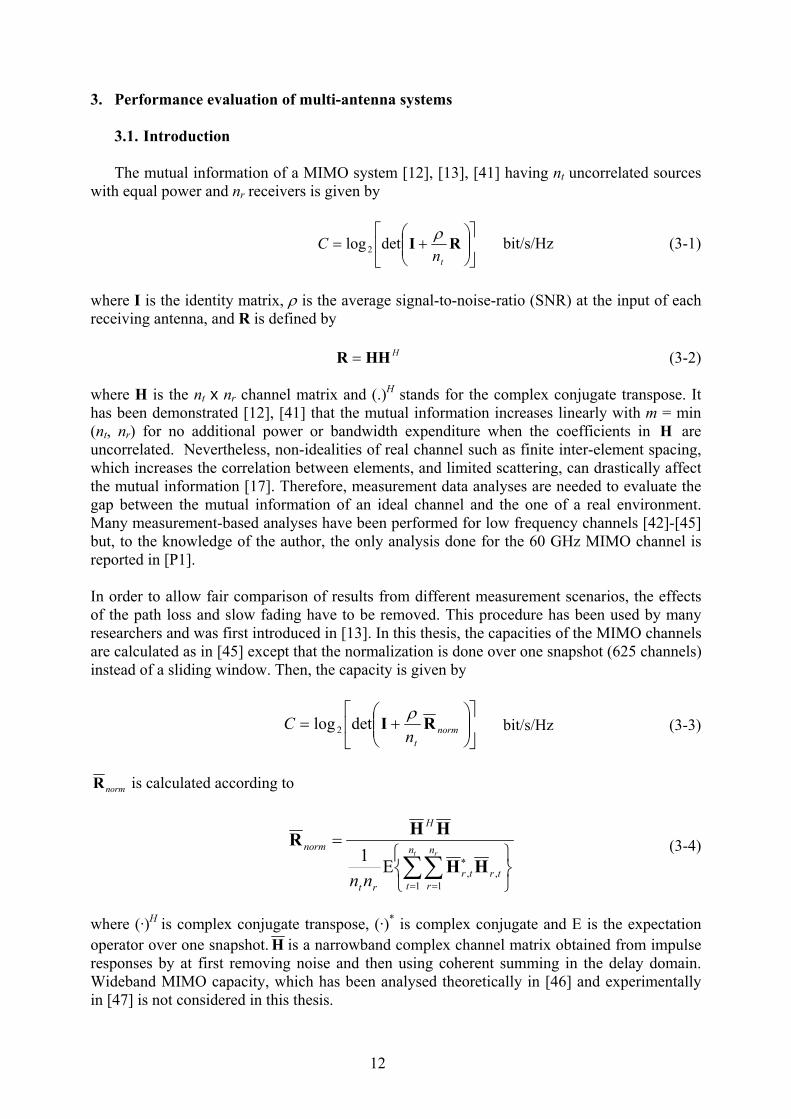
2.4.2.2.Measurement results A preliminary set of measurements has been performed in two environments at the Department of Radio Science and Engineering of TKK. In the first environment, the same room as in Section 2.3.2, two scenarios are considered: LOS and obstructed line of sight (OLOS). The distance between the antennas is 4.3 m. For the OLOS measurement a 50 cm x 50 cm mm-wave absorber is placed between the antennas. For an application such as WPAN, the OLOS case is a realistic scenario, where the absorbing material represents a person blocking the direct path between two communicating devices. In the second environment, a meeting room in the same building, the LOS case is considered. The geometry of the antenna arrays is a cube with 16 elements per side as depicted in Fig. 2-10. The spacing between the elements is 0.5 λmin, where λmin is the free space wavelength of the highest frequency (64GHz). The array geometry is similar at TX and RX. Both antennas are positioned 1.5 m high above the floor. Similarly to the measurement reported in Section 2.4.1.2, the antenna was stopped at each measurement point inside the array. The measurement time of one snapshot (4096 channels) is about 21 minutes. Most of the measurement time (about 17 minutes) is used to move the linear stages to form the arrays. Therefore, the use of VNA does not make the measurement significantly longer as compared to measurements performed with dedicated channel sounders. Figs. 2-11 and 2-12 show the PDP from the measurements in the meeting room and in the laboratory room, respectively. It can be noticed from those figures that there are many multipath components in all cases. The absorber decreases by about 30 dB the direct path signal. In both environments, it can be noticed from the LOS cases that the second path (first multipath) signal is only 10 dB below the direct path signal. In addition, in both LOS cases, it is shown that there are at least three multipath signals which are within 25 dB from the direct path signal.
9
0 25 50 75 100 125 150-60
-50
-40
-30
-20
-10
0
Time (ns)
Nor
mal
ized
rece
ived
pow
er (d
B)
Z
Y
X
λ/2
λ/2
λ/2
Fig. 2-10. Geometry of the antenna arrays.
Fig. 2-11. Normalized PDP averaged over 4096 channels. Meeting room, LOS case.
0 25 50 75 100 125 150-60
-50
-40
-30
-20
-10
0
Time (ns)
Nor
mal
ized
rece
ived
pow
er (d
B)
0 25 50 75 100 125 150-70
-60
-50
-40
-30
-20
-10
0
Time (ns)
Nor
mal
ized
rece
ived
pow
er (d
B)
Fig. 2-12a. Normalized PDP averaged over 4096 channels. Laboratory room, LOS case.
Fig. 2-12b. Normalized PDP averaged over 4096 channels. Laboratory room, OLOS case.
2.5. Comparison of the measurement systems The comparison of the three measurement systems described in Sections 2.3 and 2.4 is summarized in Table 2-1. System 1 refers to the narrow band system presented in Section 2.3. System 2 and system 3 refer to the wideband systems based on UWB sounder and VNA, respectively. The cost criterion is defined as the extra cost required for building up the system in addition to usual laboratory equipment such as signal generator and VNA.
Cost Hardware complexity Bandwidth Sampling
rate Phase drift Ease of reconfiguration
System 1 high high narrow high high low
System 2 high high wide high low low
System 3 low low wide low low high
Table 2-1. Comparison of the three mm-wave MIMO measurement systems.
10
Dedicated UWB sounders can be used for the characterization of time varying channels but they are expensive and the parameters (e.g. bandwidth and center frequency) can usually not be changed easily. VNA based systems are less expensive, since most of laboratories own VNAs, they can be easily reconfigured, but they cannot be used for time varying channel characterization. To conclude, when using virtual antenna arrays, VNA based system is the most suitable solution since it is less expensive, easier to reconfigure and, in any case, only static environments can be analyzed because of the limitation of the arrays. However, when using switched arrays, the use of UWB sounder is a much better solution since then, time varying channels can be measured.
11
3. Performance evaluation of multi-antenna systems
3.1. Introduction
The mutual information of a MIMO system [12], [13], [41] having nt uncorrelated sources with equal power and nr receivers is given by
⎥⎦
⎤⎢⎣
⎡⎟⎟⎠
⎞⎜⎜⎝
⎛+= RΙ
tnC ρdetlog 2 bit/s/Hz (3-1)
where I is the identity matrix, ρ is the average signal-to-noise-ratio (SNR) at the input of each receiving antenna, and R is defined by
HΗΗR = (3-2) where H is the nt x nr channel matrix and (.)H stands for the complex conjugate transpose. It has been demonstrated [12], [41] that the mutual information increases linearly with m = min (nt, nr) for no additional power or bandwidth expenditure when the coefficients in are uncorrelated. Nevertheless, non-idealities of real channel such as finite inter-element spacing, which increases the correlation between elements, and limited scattering, can drastically affect the mutual information [17]. Therefore, measurement data analyses are needed to evaluate the gap between the mutual information of an ideal channel and the one of a real environment. Many measurement-based analyses have been performed for low frequency channels [42]-[45] but, to the knowledge of the author, the only analysis done for the 60 GHz MIMO channel is reported in [P1].
H
In order to allow fair comparison of results from different measurement scenarios, the effects of the path loss and slow fading have to be removed. This procedure has been used by many researchers and was first introduced in [13]. In this thesis, the capacities of the MIMO channels are calculated as in [45] except that the normalization is done over one snapshot (625 channels) instead of a sliding window. Then, the capacity is given by
⎥⎦
⎤⎢⎣
⎡⎟⎟⎠
⎞⎜⎜⎝
⎛+= norm
tnC RΙ ρdetlog 2 bit/s/Hz (3-3)
normR is calculated according to
⎭⎬⎫
⎩⎨⎧
Ε=
∑∑= =
∗tr
n
t
n
rtr
rt
H
normt r
nn ,1 1
,1 HH
HHR (3-4)
where (·)H is complex conjugate transpose, (·)* is complex conjugate and E is the expectation operator over one snapshot. H is a narrowband complex channel matrix obtained from impulse responses by at first removing noise and then using coherent summing in the delay domain. Wideband MIMO capacity, which has been analysed theoretically in [46] and experimentally in [47] is not considered in this thesis.
12

3.2. MIMO Systems
Due to the high computational burden and hardware complexity required by MIMO systems, it is quite unrealistic to expect 25 element arrays in future mobile terminals. Therefore, the channel mutual information has been calculated only for 2x2, 3x3, 4x4 and 5x5 MIMO configurations with linear arrays, which are more likely to be implemented in future mobile devices. In addition this allows increasing the number of samples in the mutual information calculation.
3.2.1. Comparison of measured and iid MIMO Rayleigh channels The mutual information of 2x2, 3x3, 4x4 and 5x5 MIMO configurations is plotted in Figs. 3-1, 3-2, 3-3 and 3-4, respectively. These figures differ from those presented in [P1] because different normalizations are applied: in [P1] the normalization is done over the whole 24 measurement points, but here the normalization is done over one snapshot, as described in Section 3.1, which removes the slow fading and path loss effects more efficiently. In addition, the mutual information plotted in [P1] is at SNR = 10, 20 and 30 dB whereas it is plotted at SNR = 0, 10 and 20 dB here, because the latter values are more realistic. In order to compare those results to the theoretical limit, the mutual information of independent and identically distributed (i.i.d.) complex Gaussian variables with zero mean and unit variance have been plotted on the same figures. These variables will be referred to as iid MIMO Rayleigh channel in the following of the thesis.
0 5 10 15 200
0.1
0.2
0.3
0.4
0.5
0.6
0.7
0.8
0.9
1
Mutual information [bit/s/Hz]
Prob
abilit
y th
at M
I < a
bcis
sa
Measurement 2x2 MIMOiid 2x2 MIMO
SNR = 0 dB SNR = 10 dB SNR = 20 dB
0 5 10 15 20 250
0.1
0.2
0.3
0.4
0.5
0.6
0.7
0.8
0.9
1
Mutual information [bit/s/Hz]
Prob
abilit
y th
at M
I < a
bcis
sa
Measurement 3x3 MIMOiid 3x3 MIMO
SNR = 0 dB SNR = 10 dB SNR = 20 dB
Fig. 3-1. Mutual information of the 2x2 measured channel and the iid MIMO Rayleigh channel.
Fig. 3-2. Mutual information of the 3x3 measured channel and the iid MIMO Rayleigh channel.
Fig. 3-5 shows the mean mutual information of the measured channel as well as that of the iid MIMO Rayleigh channel, as a function of the number of elements at SNR = 0, 10 and 20 dB. It is found that the difference between the experimental results and the theoretical values increases as the number of elements increases. At SNR = 20 dB, the mean mutual information of the measured channel is 1.9%, 4.7%, 5.8% and 8.6% lower than the one of the iid MIMO Rayleigh channel, for 2x2, 3x3, 4x4 and 5x5 MIMO configurations, respectively. This difference is due to the fact that there is some correlation between the signals (because of the finite distance between the elements) and that there is a finite number of multipaths in the
13

environment. At 10% probability, at SNR = 20 dB, the difference between the two cases is slightly higher. It is 5.4%, 7.1%, 8.9% and 11.6% for 2x2, 3x3, 4x4 and 5x5 MIMO configurations, respectively. Nevertheless, it is seen that the mutual information of the measured channel increases almost linearly with the number of selected elements.
0 5 10 15 20 25 300
0.1
0.2
0.3
0.4
0.5
0.6
0.7
0.8
0.9
1
Mutual information [bit/s/Hz]
Prob
abilit
y th
at M
I < a
bcis
sa
Measurement 4x4 MIMOiid 4x4 MIMO
SNR = 0 dB SNR = 10 dB SNR = 20 dB
0 5 10 15 20 25 30 350
0.1
0.2
0.3
0.4
0.5
0.6
0.7
0.8
0.9
1
Mutual information [bit/s/Hz]
Prob
abilit
y th
at M
I < a
bcis
sa
Measurement 5x5 MIMOiid 5x5 MIMO
SNR = 0 dB SNR = 10 dB SNR = 20 dB
Fig. 3-3. Mutual information of the 4x4 measured channel and the iid MIMO Rayleigh channel.
Fig. 3-4. Mutual information of the 5x5 measured channel and the iid MIMO Rayleigh channel.
0
5
10
15
20
25
30
[2x2] [3x3] [4x4] [5x5]
Number of elements
Mut
ual i
nfor
mat
ion
[bit/
s/Hz
]
Measurement, SNR=0 dB
Measurement, SNR=10 dB
Measurement, SNR=20 dB
IID MIMO Rayleigh channelSNR =0 dBIID MIMO Rayleigh channelSNR =10 dBIID MIMO Rayleigh channelSNR =20 dB
Fig. 3-5. Mean mutual information of the measured channel and iid MIMO Rayleigh channel, as a function of the number of elements.
3.2.2. Comparison of mutual information in the 2, 5 and 60 GHz bands
As it as been shown in [48] from outdoor measurements and [49] from indoor measurements, the mutual information of MIMO channels can slightly vary as a function of frequency. Although the results in [48] indicate that the MIMO mutual information is slightly higher in the 5 GHz band than in the 2 GHz band (6% difference), the results presented in [49] indicate the opposite: MIMO mutual information is slightly lower in the 5 GHz band than in the 2 GHz band (about 2% difference). This divergence may come from the environments. Here, the results presented in Section 3.2.1 are compared with the mutual information obtained at 2.4 and 5.8 GHz in indoor environment. Although tens of MIMO measurements have been reported in
14

the 2 and 5 GHz frequency bands, only two sets of measurement based mutual information results reported in the literature were found to be suitable for comparison with the data presented in Section 3.2.1, because only measurements with the same values of parameters (e.g. antenna pattern, spacing between antennas and environments) can be compared. It is found that at SNR = 20 dB the mean mutual information results of 2 x 2 and 4 x 4 MIMO systems at 2.4 GHz presented in [50] are slightly higher than those presented in section 3.2.1 (less than 2% difference). The mean mutual information of the 4 x 4 MIMO system at 5.8 GHz presented in [51] for SNR = 0 dB, 10 dB and 20 dB is slightly higher than the one presented in Section 3.2.1 (4% to 5% higher). These results indicate that the frequency dependence of the MIMO mutual information is small, as observed in [48] and [49] for lower frequencies. The novel result of this work is that the frequency dependence remains very low even between frequencies with a ratio of about 25:1.
3.2.3. Effect of the antenna array orientation on the mutual information
To analyze the effects of the orientation (in the horizontal plane) of the antenna arrays on the mutual information, the elements are selected separately along the x or y axis (according to Fig. 2-4) as follows: “xx”, “xy”, “yx”, “yy”. The first letter refers to the transmitter orientation and the second one to the receiver orientation. For example, “xy” means that the elements are selected at the transmitter along the x axis and at the receiver along the y axis (see Fig. 3-6). It can be seen from Fig. 3-7 that the mean mutual information of the 3x3 MIMO system can vary up to 5% (0.8 bit/s/Hz). This variation can be up to 6% for the 5x5 MIMO system. It is seen that the variations appear when the orientation of the elements at the transmitter (in the corridor) are changed. The highest mutual information is found when the elements at the transmitters are selected along the y axis (perpendicular to the corridor), regardless of the orientation of the elements at the receiver. This comes from the fact that the laboratory room has many scatterers and therefore, the angular distribution at the receiver is much more uniform than the one at the transmitter. As a result, it can be stated that the antenna array orientation can have an effect on the mutual information, and this effect is highly dependent on the environment. Therefore, the results presented in this section are valid only for the environment presented in Section 2.3.2.
0 5 10 15 20 250
0.1
0.2
0.3
0.4
0.5
0.6
0.7
0.8
0.9
1
Mutual information [bit/s/Hz]
Prob
abilit
y th
at M
I < a
bcis
sa
3x3 MIMO XX3x3 MIMO XY3x3 MIMO YX3x3 MIMO YY
Fig. 3-6. Example of selection of sub-array, “xy”.
Fig. 3-7. Channel mutual information of the 3x3 MIMO configuration, as a function of the orientation of the elements.
15

3.3. MIMO systems with antenna selection Although MIMO systems can significantly enhance the data rate as compared to conventional SISO systems, they have several drawbacks: increase of hardware complexity, cost and computational burden. Since antenna arrays can be manufactured at relatively low cost, a solution which consists of selecting only a restricted number of antennas among the whole antenna array has been studied [52]-[56], and is referred to as MIMO-AS or hybrid selection/MIMO (H-S/MIMO). This technique reduces the computational burden as well as the number of RF chains - including low-noise amplifiers (LNA), power amplifiers, up- or down-converters and analog-to-digital converters. By using MIMO-AS, significant efficiency improvement in terms of mutual information unit per RF chain has been shown, as compared to MIMO. However, most of the published research works use theoretical channel models for the mutual information calculations. No measurement-based MIMO-AS study at 60 GHz is found in the literature. Furthermore, as it was suggested in [52] and has been shown in [P4], one of the most limiting factors of antenna selection are the losses in the switching network, but no thorough investigation on the effect of this is found in the literature. In this section, the mutual information of MIMO-AS in a real propagation environment at 60 GHz considering both ideal and realistic switching networks is studied. The data used in this section are extracted from the measurement campaign reported in Section 2.3.2.
3.3.1 Selection of antennas in sub-arrays The best antennas were chosen in subsets of the original 25 element arrays. Several sub-array configurations were investigated: 4 consecutive elements in a line (row or column), 4 elements in a square, 5 consecutive elements in a line (row or column), and 9 elements in a square. For each sub-array configuration, the selections of two elements out of N and three elements out of N are studied, where N is the number of available elements in the sub-array (i.e. 4, 5 or 9). As an example, the selection of 3 elements out of 9 is shown in Fig. 3-8. The antenna selection is done only at one end of the link at a time, either at TX or RX. The number of elements at the other end of the link is the same as the one of selected elements, two or three. Therefore, the mutual information was calculated either for 2x2 or 3x3 MIMO systems. When the selection is done at TX, the channel state information (CSI) is assumed to be perfectly known at the transmitter but the power is evenly distributed among the selected elements. The total number of selected channels is between 270 and 800 for each of the 24 measurement points, depending on the configuration.
Sub-array
Selected element
Fig. 3-8. An example of 3 selected antennas out of a sub-array of 9 elements in a square.
To select the “best” antennas in an array, several criteria and algorithms have been studied [53]-[56]. In this work, the mutual information for all the configurations is analyzed using the signal to noise ratio criterion (SNRC) and the optimum capacity criterion (OCC) [53], [55], [56]. The SNRC, which consists of selecting the antennas which lead to the highest SNR,
16

requires the lowest complexity scheme but leads to the maximum mutual information only at low SNR [55]. The OCC consists of calculating the mutual information of all possible combinations within the sub-arrays and selects the antennas that maximize the mutual information. It leads to the maximum mutual information but is computationally very expensive [53]-[56]. The total number of channels to be analyzed is between 1,920 and 22,680, depending on the configuration, for each of the 24 measurement points. Since the mutual information of each channel has to be calculated for the OCC, it is unrealistic to expect that such criterion could be used with the processing power available today in hand-held devices, but it is an interesting criterion since it gives the upper bound for the mutual information.
As mentioned in [52], the switching network is a limiting factor in the antenna selection gain. This is especially important at 60 GHz since the losses of switches and transmission lines are higher than at lower frequencies. For this reason, both ideal and realistic switching networks were considered when calculating the mutual information. Realistic switching networks refer to switching networks with realistic losses in the following. For low loss switches, insertion losses of 1 dB was found for a single-pole double-throw (SP2T) in [57] and 1.6 dB was found for a single-pole triple-throw (SP3T) in [58]. Those values were chosen as representative values in this work. To take into account the losses due to the extra length of the transmission line (TL), an additional loss of 0.4 dB / wavelength was applied. This value was found by simulating a traditional 50 Ω coplanar waveguide (CPW) TL on high resistivity silicon substrate at 60 GHz. The number and type of the switches together with their total insertion loss, the estimated extra length of the TL and the total loss of switching networks are presented in Table 3-1 for the four sub-array configurations. Since the total loss depends on many parameters such as switching network topology, substrate properties, as well as the technology used to fabricate the switches and the whole network, the values given below are only estimates of realistic losses.
Switches in series
Total loss due to switches (in dB)
Extra length of TL (in wavelengths)
Total loss of switching network (in dB)
4 in line 2 x SP2T 2 2 2.8 4 in square 2 x SP2T 2 2.5 3
5 in line SP2T + SP3T 2.6 2.5 3.6 9 in square 2 x SP3T 3.2 3 4.4
Table 3-1. Number, type and total insertion loss of switches, estimated extra length of TL and total loss of switching networks.
3.3.2. Results There are altogether 16 options for each sub-array shape: either two or three selected antennas, either with ideal or realistic switching network, either with SNRC or OCC and either with antenna selection at TX or RX. The mutual information of the 16 options is calculated using (3-3) and (3-4). The results of the three most relevant cases are presented in this section: Case 1: 2 RX out of N with OCC and the ideal switching network, which represents the most favorable case (in terms of mutual information ). Case 2: 2 RX out of N available antennas with SNRC and the ideal switching network. The effect of the selection criterion will be analyzed by comparing this case to case 1. Case 3: 2 RX out of N available, with the SNRC and the realistic switching network, which represents the worst case (in terms of mutual information ), but also the most realistic one, among the cases of 2 elements out of N. By comparing this case to case 2, the influence of the switching network will be discussed. In addition, general comments about all the 16 options will be given at the end of this section.
17

Case 1. The mutual information obtained by selecting 2 RX out of N with OCC and the ideal switching network is compared to the mutual information of 2x2 and 3x3 MIMO at SNR = 0, 10 and 20 dB in Fig. 3-9. The maximum mutual information increase at 10% probability, as compared to 2x2 MIMO, is 127.8%, which is the highest mutual information increase among all 16 options. It can be noticed that at 10 % probability, at SNR = 0 and 10 dB, the selection of the 2 best antennas in the 9 element sub-array leads to higher mutual information than 3x3 MIMO. Case 2. The mutual information obtained by selecting 2 RX out of N available antennas with SNRC and the ideal switching network as well as the mutual information of 2x2 and 3x3 MIMO are plotted at SNR = 0, 10 and 20 dB in Fig. 3-10. Similarly to the results reported in [52] and [55], it is seen that the SNRC leads to about the same mutual information as OCC at low SNR but its performance decreases when the SNR increases. Case 3. Fig. 3-11 shows the mutual information obtained by selecting 2 RX out of N available antennas, with the SNRC and the realistic switching network together with the mutual information of 2x2 and 3x3 MIMO at SNR = 0, 10 and 20 dB. It can be seen that at most of the probability levels, for all sub-array shapes, the mutual information of antenna selection configurations is lower than the one of 2x2 MIMO. The maximum mutual information increase at 10% probability, as compared to 2x2 MIMO, is only 11.5%.
0 5 10 15 20 250
0.1
0.2
0.3
0.4
0.5
0.6
0.7
0.8
0.9
1
Mutual information [bit/s/Hz]
Prob
abilit
y th
at m
utua
l inf
orm
atio
n <
abci
ssa
2RX out of 4 in square2RX out of 4 in line2RX out of 5 in line2RX out of 9 in squareMIMO 2x2MIMO 3x3
SNR= 20 dBSNR= 10 dBSNR= 0 dB
0 5 10 15 20 250
0.1
0.2
0.3
0.4
0.5
0.6
0.7
0.8
0.9
1
Mutual information [bit/s/Hz]
Prob
abilit
y th
at m
utua
l inf
orm
atio
n< a
bcis
sa
2RX out of 4 in square2RX out of 4 in line2RX out of 5 in line2RX out of 9 in squareMIMO 2x2MIMO 3x3
SNR= 0 dB SNR= 10 dB SNR= 20 dB
Fig. 3-9. mutual information obtained by selecting 2 RX out of N, with OCC and the ideal switching network.
Fig. 3-10. mutual information obtained by selecting 2 RX out of N, with the SNRC and the ideal switching network.
18

0 5 10 15 20 250
0.1
0.2
0.3
0.4
0.5
0.6
0.7
0.8
0.9
1
Mutual information [bit/s/Hz]
Prob
abilit
y th
at m
utua
l inf
orm
atio
n <
abci
ssa
2RX out of 4 in square2RX out of 4 in line2RX out of 5 in line2RX out of 9 in squareMIMO 2x2MIMO 3x3
SNR=0dB SNR=10dB SNR=20dB
Fig. 3-11. mutual information obtained by selecting 2RX out of N, with the SNRC and the realistic switching network. General comments about the 16 options. It is found that the antenna selection performed at TX leads to about the same mean mutual information as antenna selection at RX. With the ideal switching network: The sub-array which leads to the maximum increase of the mutual information is the 9 elements in square, followed by the 5 elements in line, the 4 elements in square and the 4 elements in line. The mean mutual information obtained with ideal switching network is close to the one reported in [6] for iid MIMO Rayleigh channel. This was expected since the mean mutual information of the MIMO configurations used in this work is close to the one of iid MIMO Rayleigh channel [P1]. With the realistic switching network: At 10% probability, the maximum increase of the mutual information obtained by selecting 2 and 3 antennas, as compared to MIMO with the same number of elements, is only 18.3% and 1%, respectively. In a large majority of cases the mutual information obtained with antenna selection is lower than the mutual information of MIMO. In most of the cases, at low SNR, the sub-array which maximizes the mutual information is 4 elements in line, followed by 5 elements in line, 9 elements in square and 4 elements in square. At high SNR, the order is the same as with the ideal switching network. 3.4 Beam steering systems Another well-known multi-antenna technique is beam steering, also referred to as a phased array. The idea is to form beams pointing in different directions and to select the beam that maximizes the SNR. This technique is popular since it requires less computational burden than traditional MIMO technique [59] and it can reduce the interference level. Beam steering has been considered for 60 GHz short range communications [60] and several 60 GHz beam steering antennas have been developed over the last years [61]-[63]. Nevertheless, the comparison between MIMO and beam steering technique has been studied only theoretically, e.g. [64], [65], or empirically at a lower frequency [66]. No experimental comparison at 60 GHz is found in the literature. Furthermore, as it has been shown in [P4], the performance of a multi-antenna technique can be significantly decreased, when considering its use at 60 GHz
19
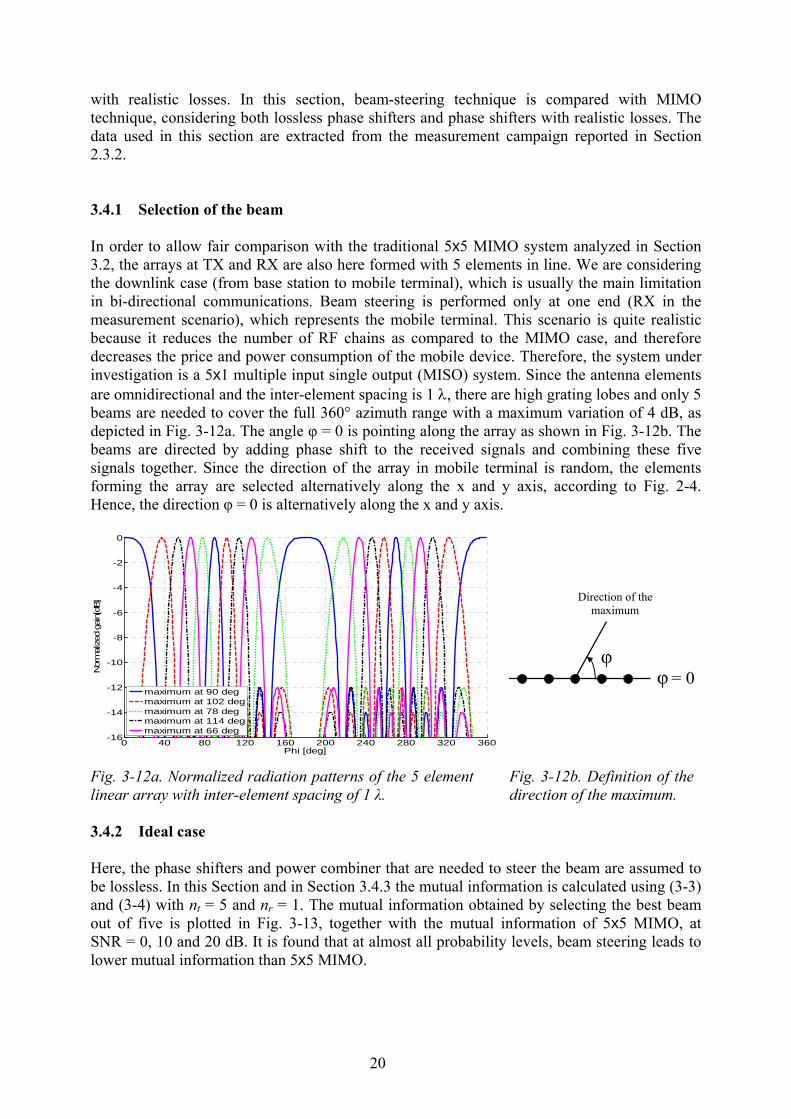
with realistic losses. In this section, beam-steering technique is compared with MIMO technique, considering both lossless phase shifters and phase shifters with realistic losses. The data used in this section are extracted from the measurement campaign reported in Section 2.3.2. 3.4.1 Selection of the beam In order to allow fair comparison with the traditional 5x5 MIMO system analyzed in Section 3.2, the arrays at TX and RX are also here formed with 5 elements in line. We are considering the downlink case (from base station to mobile terminal), which is usually the main limitation in bi-directional communications. Beam steering is performed only at one end (RX in the measurement scenario), which represents the mobile terminal. This scenario is quite realistic because it reduces the number of RF chains as compared to the MIMO case, and therefore decreases the price and power consumption of the mobile device. Therefore, the system under investigation is a 5x1 multiple input single output (MISO) system. Since the antenna elements are omnidirectional and the inter-element spacing is 1 λ, there are high grating lobes and only 5 beams are needed to cover the full 360° azimuth range with a maximum variation of 4 dB, as depicted in Fig. 3-12a. The angle φ = 0 is pointing along the array as shown in Fig. 3-12b. The beams are directed by adding phase shift to the received signals and combining these five signals together. Since the direction of the array in mobile terminal is random, the elements forming the array are selected alternatively along the x and y axis, according to Fig. 2-4. Hence, the direction φ = 0 is alternatively along the x and y axis.
0 40 80 120 160 200 240 280 320 360-16
-14
-12
-10
-8
-6
-4
-2
0
Phi [deg]
Nor
mal
ized
gai
n[dB
]
maximum at 90 degmaximum at 102 degmaximum at 78 degmaximum at 114 degmaximum at 66 deg
φ = 0φ
Direction of the maximum
Fig. 3-12a. Normalized radiation patterns of the 5 element linear array with inter-element spacing of 1 λ.
Fig. 3-12b. Definition of the direction of the maximum.
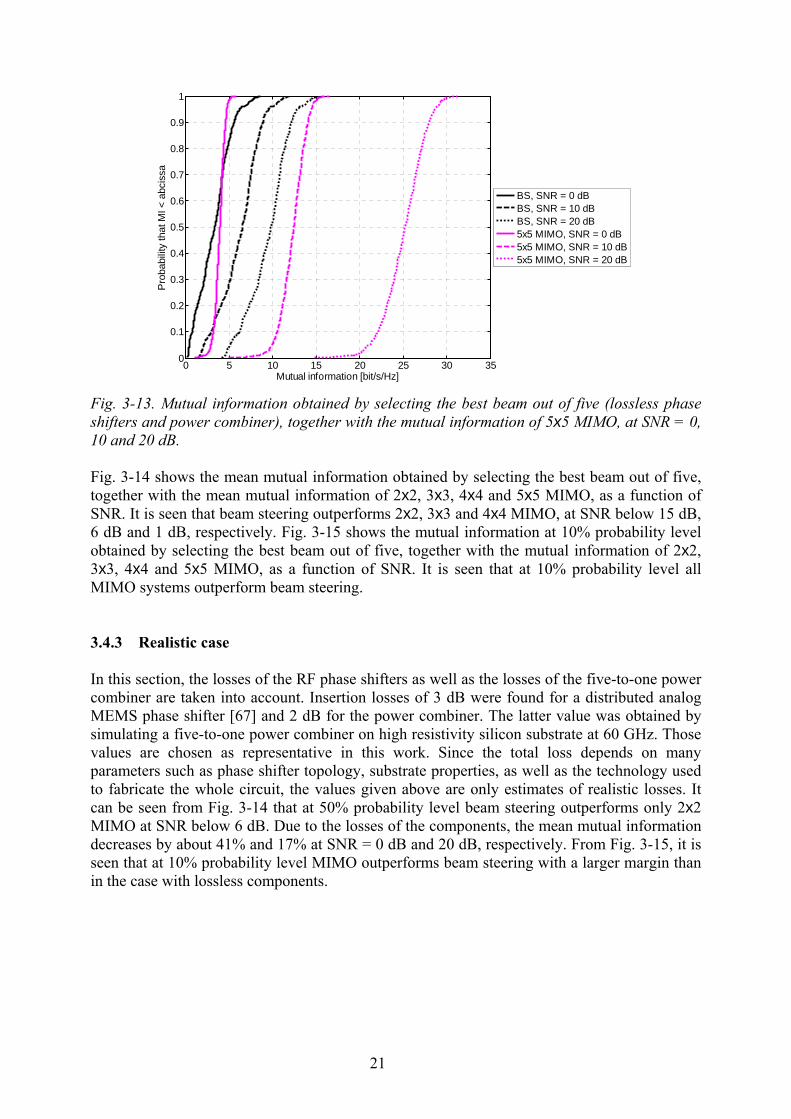
3.4.2 Ideal case Here, the phase shifters and power combiner that are needed to steer the beam are assumed to be lossless. In this Section and in Section 3.4.3 the mutual information is calculated using (3-3) and (3-4) with nt = 5 and nr = 1. The mutual information obtained by selecting the best beam out of five is plotted in Fig. 3-13, together with the mutual information of 5x5 MIMO, at SNR = 0, 10 and 20 dB. It is found that at almost all probability levels, beam steering leads to lower mutual information than 5x5 MIMO.
20
0 5 10 15 20 25 30 350
0.1
0.2
0.3
0.4
0.5
0.6
0.7
0.8
0.9
1
Mutual information [bit/s/Hz]
Pro
babi
lity
that
MI <
abc
issa
BS, SNR = 0 dBBS, SNR = 10 dBBS, SNR = 20 dB5x5 MIMO, SNR = 0 dB5x5 MIMO, SNR = 10 dB5x5 MIMO, SNR = 20 dB
Fig. 3-13. Mutual information obtained by selecting the best beam out of five (lossless phase shifters and power combiner), together with the mutual information of 5x5 MIMO, at SNR = 0, 10 and 20 dB. Fig. 3-14 shows the mean mutual information obtained by selecting the best beam out of five, together with the mean mutual information of 2x2, 3x3, 4x4 and 5x5 MIMO, as a function of SNR. It is seen that beam steering outperforms 2x2, 3x3 and 4x4 MIMO, at SNR below 15 dB, 6 dB and 1 dB, respectively. Fig. 3-15 shows the mutual information at 10% probability level obtained by selecting the best beam out of five, together with the mutual information of 2x2, 3x3, 4x4 and 5x5 MIMO, as a function of SNR. It is seen that at 10% probability level all MIMO systems outperform beam steering. 3.4.3 Realistic case In this section, the losses of the RF phase shifters as well as the losses of the five-to-one power combiner are taken into account. Insertion losses of 3 dB were found for a distributed analog MEMS phase shifter [67] and 2 dB for the power combiner. The latter value was obtained by simulating a five-to-one power combiner on high resistivity silicon substrate at 60 GHz. Those values are chosen as representative in this work. Since the total loss depends on many parameters such as phase shifter topology, substrate properties, as well as the technology used to fabricate the whole circuit, the values given above are only estimates of realistic losses. It can be seen from Fig. 3-14 that at 50% probability level beam steering outperforms only 2x2 MIMO at SNR below 6 dB. Due to the losses of the components, the mean mutual information decreases by about 41% and 17% at SNR = 0 dB and 20 dB, respectively. From Fig. 3-15, it is seen that at 10% probability level MIMO outperforms beam steering with a larger margin than in the case with lossless components.
21

0 5 10 15 200
5
10
15
20
25
30
SNR [dB]
Mut
ual i
nfor
mat
ion
[bit/
s/H
z]
BS, idealBS, realistic2x2 MIMO3x3 MIMO4x4 MIMO5x5 MIMO
Fig. 3-14. Mean mutual information obtained by selecting the best beam out of five, together with the mean mutual information of 2x2, 3x3, 4x4 and 5x5 MIMO, as a function of SNR.
0 5 10 15 200
5
10
15
20
25
SNR [dB]
Mut
ual i
nfor
mat
ion
[bit/
s/H
z]
BS, idealBS, realistic2x2 MIMO3x3 MIMO4x4 MIMO5x5 MIMO
Fig. 3-15. Mutual information at 10% probability level obtained by selecting the best beam out of five, together with the mutual information of 2x2, 3x3, 4x4 and 5x5 MIMO, as a function of SNR.
22

4. Planar omnidirectional antenna for 60 GHz applications 4.1. Introduction
Omnidirectional antennas are required in applications such as wireless communications (e.g. WLAN or WPAN) or for more specific purposes like radio channel sounding. In wireless communications antennas have to be as compact as possible and fabricated with low cost, i.e. with a simple manufacturing process. This is particularly important at mm-wave range where manufacturing antennas is much more difficult and expensive than at microwave frequencies. In addition, the antenna should have wide beam in the planes where the pattern is not omnidirectional since receivers and transmitters are not necessary located at the same height. At 60 GHz the antennas do not need to be ultra wideband (at least 25% bandwidth) to cover the 7 GHz bandwidth allocated for short range communications. Many omnidirectional antennas have already been designed and presented, but most of them are not planar, [68]-[70]. Therefore, these antennas will be complicated and expensive to fabricate at mm-wave frequency. Planar omnidirectional antennas already reported are also using sophisticated manufacturing processes as in [71]-[74] where specific shapes for the ground plane are needed. The antenna presented in this chapter uses shaped metal layer only on one side of the substrate, which decreases the complexity of the manufacturing process and therefore significantly decreases the cost.
4.2.Antenna design and fabrication It is well known that in printed antennas with single metal layer the radiated power is directed toward the substrate, and the thicker the substrate is, the more significant this effect becomes. Ideally, to get a perfect omnidirectional pattern, an antenna should be suspended in air or any homogeneous medium. For this reason, the antenna was first designed on thin substrate: 150 μm thick quartz substrate. The structure is a coplanar patch antenna (CPA) on finite ground plane and substrate with single metal layer as shown in Fig. 4-1. This type of antenna is based on the concept of open-ended coplanar waveguide resonator [75]. The structure was designed and simulated with the finite element method software HFSS [76]. The metal part is drawn in dark grey and the substrate in light grey. The length of the slot LSlot was designed to be half guided wavelength in the slot. The shape of the patch in the centre of the slot is a square. The width and length of the substrate as well as the width and length of the ground plane affect significantly the radiation pattern. Wground and WSub mainly define the x-z plane radiation pattern - where the antenna is desired to be omnidirectional. The dimensions of Wground and WSub were optimized for WTotal = 4.3 mm. It has to be noticed that if one wants to use this antenna as an elementary radiating element in an array, which means that the antenna is on a much wider substrate, the width of the ground plane Wground has to be re-optimized. HTop, HBot and HSub, which control the pattern in the y-z plane, have been designed such that the antenna will have wide beam in this plane. The length of the patch LPatch together with the width of the slot GSlot mainly determinate the return loss. The coplanar waveguide (CPW) transmission line was designed to be 50 Ω with the smallest gap G that can be acceptable for manufacturing, in order to minimize the effects of the line, and also in order it can be measured with a standard 150 μm pitch ground-signal-ground (GSG) probe. The value of each parameter is given in Table 4-1. Because of practical limitations in the manufacturing process, the antenna had to be fabricated on 300 μm thick quartz substrate, although the use of 150 μm substrate is possible in several
23

manufacturing places. For this reason, the structure has been re-optimized for 300 μm thick substrate. Nevertheless, this altered slightly the omni-directionality as it can be seen in the simulation results presented in the next section.
Parameters Value (in mm) LTotal 4.5 WTotal 4.3 HSub 0.5 WSub 1.15 HTop 1.12 HBot 1.27
WGround 0.195 LSlot 1.61 GSlot 0.18 LPatch 1.25
W 0.15 G 0.018
Fig. 4-1. Layout of the antenna.
Table 4-1. Antenna parameters.
In order to allow measuring the performance of the antenna (return loss and radiation pattern), an additional transmission line has to be added to the structure - otherwise the feeding probe would be too close to the radiating element and interfere with it. Since the ground plane around the patch acts as a part of the radiator, an 8 mm long finite width coplanar waveguide (FCPW) was inserted between the radiating element and the antenna port, see Fig. 4-2.
Fig. 4-2. Picture of the measured antenna with part of the feed line. The antenna was manufactured using standard photolithography process, sputtering 1 μm aluminium layer on 300μm quartz wafer. This technique is very cost efficient, especially in mass production when only one mask is needed and tens of antennas can be made on a wafer. In the following, the original structure on 150 μm thick substrate, the same structure on
24
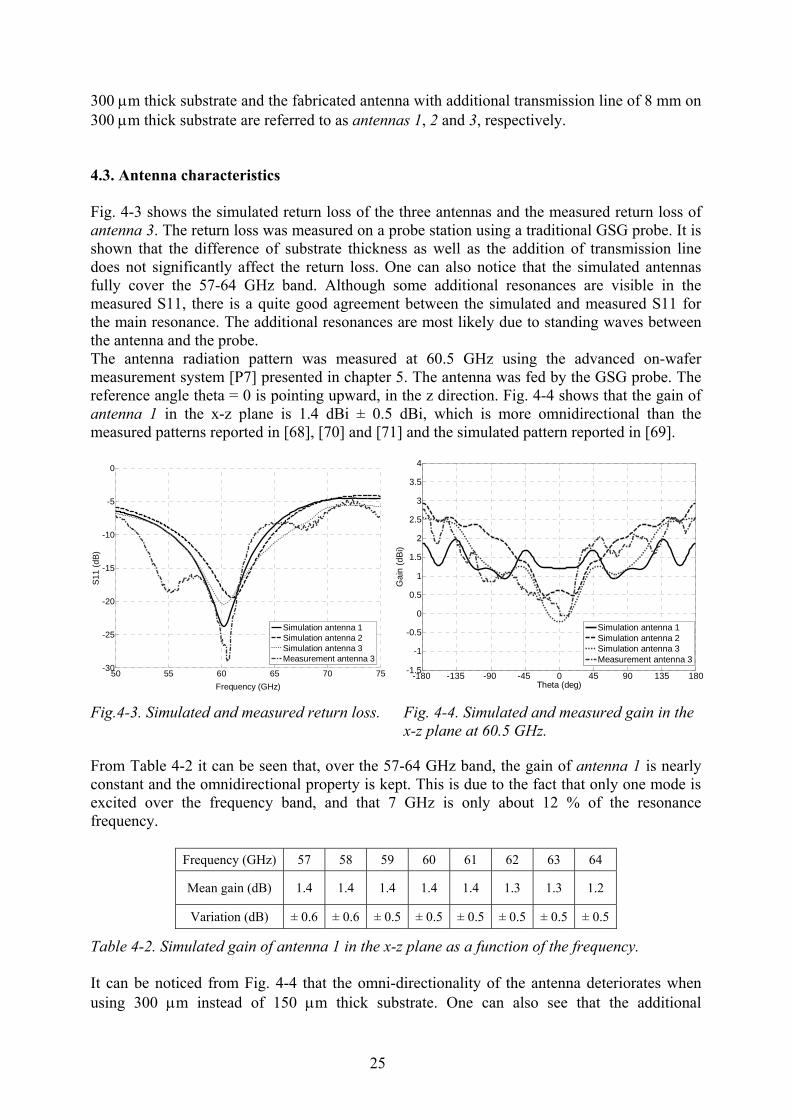
300 μm thick substrate and the fabricated antenna with additional transmission line of 8 mm on 300 μm thick substrate are referred to as antennas 1, 2 and 3, respectively. 4.3. Antenna characteristics Fig. 4-3 shows the simulated return loss of the three antennas and the measured return loss of antenna 3. The return loss was measured on a probe station using a traditional GSG probe. It is shown that the difference of substrate thickness as well as the addition of transmission line does not significantly affect the return loss. One can also notice that the simulated antennas fully cover the 57-64 GHz band. Although some additional resonances are visible in the measured S11, there is a quite good agreement between the simulated and measured S11 for the main resonance. The additional resonances are most likely due to standing waves between the antenna and the probe. The antenna radiation pattern was measured at 60.5 GHz using the advanced on-wafer measurement system [P7] presented in chapter 5. The antenna was fed by the GSG probe. The reference angle theta = 0 is pointing upward, in the z direction. Fig. 4-4 shows that the gain of antenna 1 in the x-z plane is 1.4 dBi ± 0.5 dBi, which is more omnidirectional than the measured patterns reported in [68], [70] and [71] and the simulated pattern reported in [69].
50 55 60 65 70 75-30
-25
-20
-15
-10
-5
0
Frequency (GHz)
S11
(dB)
Simulation antenna 1Simulation antenna 2Simulation antenna 3Measurement antenna 3
-180 -135 -90 -45 0 45 90 135 180-1.5
-1
-0.5
0
0.5
1
1.5
2
2.5
3
3.5
4
Theta (deg)
Gai
n (d
Bi)
Simulation antenna 1Simulation antenna 2Simulation antenna 3Measurement antenna 3
Fig.4-3. Simulated and measured return loss.
Fig. 4-4. Simulated and measured gain in the x-z plane at 60.5 GHz.
From Table 4-2 it can be seen that, over the 57-64 GHz band, the gain of antenna 1 is nearly constant and the omnidirectional property is kept. This is due to the fact that only one mode is excited over the frequency band, and that 7 GHz is only about 12 % of the resonance frequency.
Frequency (GHz) 57 58 59 60 61 62 63 64
Mean gain (dB) 1.4 1.4 1.4 1.4 1.4 1.3 1.3 1.2
Variation (dB) ± 0.6 ± 0.6 ± 0.5 ± 0.5 ± 0.5 ± 0.5 ± 0.5 ± 0.5
Table 4-2. Simulated gain of antenna 1 in the x-z plane as a function of the frequency. It can be noticed from Fig. 4-4 that the omni-directionality of the antenna deteriorates when using 300 μm instead of 150 μm thick substrate. One can also see that the additional
25

transmission line does not decrease significantly the performance of the antenna. The simulated gain of antenna 3 in the x-z plane is 1.4 dBi ± 1.4 dBi and the measured one is 1.5 dBi ± 1.4 dBi, which shows good agreement between the two results. The gain of the antennas in the y-z plane is shown in Fig. 4-5. The simulated half power beam width (HPBW) of antennas 1, 2 and 3 is about 75 º, 70 º and 65 º respectively. Due to practical limitations, the gain of antenna 3 in the y-z plane was measured only in one half plane. Good agreement between simulated and measured gain of antenna 3 can still be observed. Finally, one can notice that the additional transmission line affects the radiation pattern mainly in the y-z plane whereas the thicker substrate affects the pattern in both x-z and y-z planes. The simulated total efficiencies of antennas 1, 2 and 3 are 99%, 99% and 83 % respectively. This reveals that the additional transmission line introduces about 0.8 dB losses.
-180 -135 -90 -45 0 45 90 135 180-35
-30
-25
-20
-15
-10
-5
0
5
Theta (deg)
Gai
n (d
Bi)
Simulation antenna 1Simulation antenna 2Simulation antenna 3Measurement antenna 3
Fig. 4-5. Simulated and measured gain in the y-z plane at 60.5 GHz.
26

5. Antenna measurements at 60 GHz 5.1. Introduction It is very important to know the 3-D radiation pattern of mobile terminal antennas since it is needed to evaluate their performance, e.g. with the help of test beds such as MEBAT [18]. Nevertheless, 3-D pattern measurement at 60 GHz is not trivial. There are basically two options for feeding 60 GHz antennas: either by using coaxial V connectorTM [77] or mm-wave probe. The advantage of using a V connector is that the antenna can be measured in standard anechoic chamber. One of the main problems is that due to the geometry of the V connector adaptor, the end of the transmission line of the antenna has to be tapered to fit the adaptor, which can affect significantly the return loss and radiation pattern of the antenna. Moreover, due to the very small dimensions of the connector on the antenna side, it is very difficult to connect it to the antenna. Furthermore, V connectors can only be used up to 67 GHz. For these reasons, probe-feed-based antenna-pattern measurement techniques are of great interest and have been studied in the 60 GHz band [78]-[80] and at lower frequencies [81]-[83]. The advantages of this method are that it reduces the cost as well as the measurement and design time of integrated antennas. The main issue is that the antenna under test (AUT) cannot be moved since the probe has to be placed very accurately and any vibration may affect the alignment and therefore affects the results (or may even damage the probe and the AUT). Another issue is that, traditionally the AUT is measured on a probe station surrounded by many metal parts and a microscope which limits the measurement to a very narrow scan angle. So far, no on-wafer measurement system has been proposed to measure more than a hemisphere. In [78] the gain is measured only in a single angular direction. In [79] and [81] the pattern is measured in a few 2-D cuts over a 180 deg range. In [80], [82] and [83] only one half of the antenna pattern can be measured. In addition, among all the referred articles, only in [79] some comments are given about the radiation of the probe itself, which was seen as one of the main limitations of on-wafer radiation-pattern measurements. Nevertheless the exact effect of the probe has not been studied. In this chapter, a quasi-full 3-D on-wafer radiation-pattern measurement is presented, with a rigorous analysis of the effects of the probe [P7]. 5.2. Design of the measurement system
5.2.1. RF part
A Picoprobe 150 μm pitch ground-signal-ground (GSG) probe (model 67A-GSG-150-DP) [84], was used to feed the AUT. This probe was connected to the up-converter with a V connector and a semi rigid 60 GHz cable, as shown in Fig. 5-1. Since the probe is not moving, a waveguide fed probe could be used without modification. The AUT was measured with a standard 20 dBi gain horn antenna connected to an Agilent 11970V mixer. The LO signals going to and IF signal coming from the mixer were at lower frequencies, 4.3 GHz and 310 MHz respectively, and therefore were transferred with flexible coaxial cables which allowed moving the mixer during the measurement. The received signal was measured with an Agilent 8564EC spectrum analyzer controlled via GPIB. The whole system, mechanical part and RF part, was controlled using a custom made Labview [85] program on a PC. The measured average and maximum noise level of the spectrum analyzer were -71 dBm and -69 dBm respectively. If one would need to measure the amplitude and
27

phase, the same principle could be used, only the spectrum analyzer has to be replaced with a vector network analyzer (VNA) and coherent frequency conversion has to be ensured.
Axis 1
LO + IF felxible cables
60 GHz Semi-rigid cable
Rotary joint
Receive horn
antenna
Agilent 8564EC
Spectrum analyser
HP 83557A Mm-wave source module
+ coupler / detector
(x 4 frequency multiplier)
Waveguide to V connector
adapter GSG mm-wave probe
R&S SM60
Signal generator
15.125 GHz
HP 8349B
Amplifier
AUT
Agilent 11970V Mixer
Trigger + Data
Arm 2
Set frequency and power
Control computer
Serial port
GPIB card
Axis 2
Arm 1 Linear stage controller
DC-Motor controllers for rotation
stages
y
x
z
Fig. 5-1. Schematic of the whole system (mechanical and RF parts). 5.2.2. Mechanical part Since it is not possible to measure below and on the side of the antenna using a traditional probe station, a custom made carrier for the AUT was constructed from rigid polyurethane, based on the usual 3-D positioner used in probe stations. It left almost all the space free around the antenna, see Fig. 5-2. The receive antenna was connected directly to the mixer and both were moved along a sphere using two rotation arms as shown in Figs. 5-1 and 5-2.
Fig. 5-2a. Picture of the measurement setup.
Fig. 5-2b. Close view on the probe and AUT holders.
28

The mixer and the horn antenna can be rotated 90 deg in order to measure both polarizations. The distance between the AUT and the receive horn was 195 mm, which satisfies the far-field criterion [86] at 60GHz for antennas with maximum dimension smaller than 22 mm. The reference angles Axis 1 = 0 º and Axis 2 = 0 º are defined at the angular position where the horn antenna is above the AUT, vertically oriented (along z axis). The positive directions are indicated with arrows in Fig. 5-1. The system can measure from -35 º to 215 º around the first axis and from -120 º to 120 º around the second axis, which leads to the measurement range shown in Fig. 5-3.
Fig. 5-3. Angular range of the measurement system. The first arm was turning step by step, rotating 5 º each time the second arm reached the limit. The second axis was rotating continuously from -120 º to 120 º and vice versa, avoiding any vibration, with a measurement grid of 2 º. The two rotation arms were positioned accurately with the 3-D linear stages with the help of a laser pointer so that the origins of the two rotation axes were crossing exactly at the centre of the AUT. The resolution and repeatability given by the manufacturer are 0.1 μm and 1 μm for the linear stages and 3.5 μrad and 230 μrad for the rotation stages, respectively [37]. A movable arm for carrying a microscope above the AUT and the probe was tailor-made for this measurement system. One important practical issue was to avoid the twisting of the IF and LO cables connected to the mixer. For that, rotary joints were used through the axis of the second rotation stage. For 5 º steps, the measurement duration of one polarization is 48 min. The measurement system is very compact: the whole setup fits into a volume of about 1 m3. Instead of placing the whole measurement system in an anechoic chamber, absorbers were placed around the AUT and the measurement arms, as shown in Fig. 5-2a. 5.3. Test measurements 5.3.1. Radiation of the probe As mentioned above, the microwave probe itself radiates. Therefore the measured radiation pattern is actually the combination of the radiation pattern of the AUT and the radiation pattern of the probe. For that reason, it is very important to know the radiation pattern of the probe. Unlike the method used in [79] which gives only a rough approximation of the radiation of the probe when it is feeding the AUT, in this work the radiation pattern of the probe was measured when loaded with a 50 Ω load. Since AUTs are usually well matched – return loss more than 10 dB, it can be assumed that the probe radiates the same way as when it is feeding the AUT. The 3-D pattern of the loaded probe is plotted in Fig. 5-4. The average gain was -28 dBi with a
29
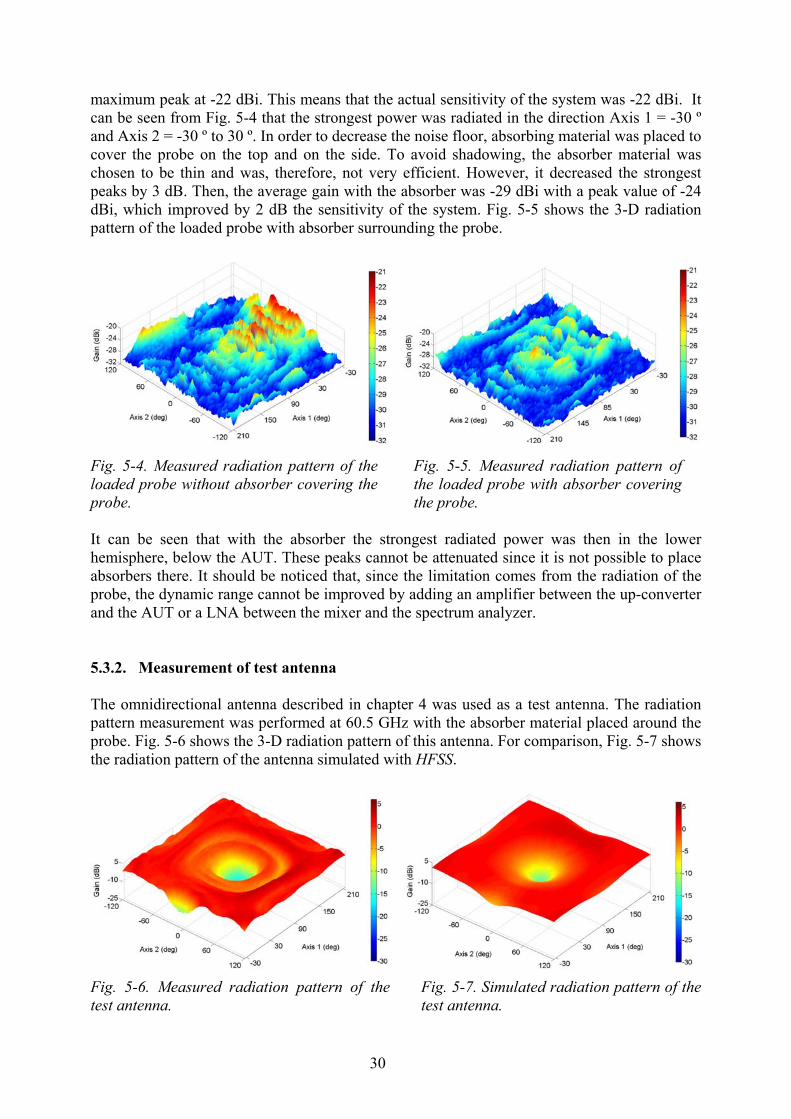
maximum peak at -22 dBi. This means that the actual sensitivity of the system was -22 dBi. It can be seen from Fig. 5-4 that the strongest power was radiated in the direction Axis 1 = -30 º and Axis 2 = -30 º to 30 º. In order to decrease the noise floor, absorbing material was placed to cover the probe on the top and on the side. To avoid shadowing, the absorber material was chosen to be thin and was, therefore, not very efficient. However, it decreased the strongest peaks by 3 dB. Then, the average gain with the absorber was -29 dBi with a peak value of -24 dBi, which improved by 2 dB the sensitivity of the system. Fig. 5-5 shows the 3-D radiation pattern of the loaded probe with absorber surrounding the probe.
Fig. 5-4. Measured radiation pattern of the loaded probe without absorber covering the probe.
Fig. 5-5. Measured radiation pattern of the loaded probe with absorber covering the probe.
It can be seen that with the absorber the strongest radiated power was then in the lower hemisphere, below the AUT. These peaks cannot be attenuated since it is not possible to place absorbers there. It should be noticed that, since the limitation comes from the radiation of the probe, the dynamic range cannot be improved by adding an amplifier between the up-converter and the AUT or a LNA between the mixer and the spectrum analyzer. 5.3.2. Measurement of test antenna The omnidirectional antenna described in chapter 4 was used as a test antenna. The radiation pattern measurement was performed at 60.5 GHz with the absorber material placed around the probe. Fig. 5-6 shows the 3-D radiation pattern of this antenna. For comparison, Fig. 5-7 shows the radiation pattern of the antenna simulated with HFSS.
Fig. 5-6. Measured radiation pattern of the test antenna.
Fig. 5-7. Simulated radiation pattern of the test antenna.
30

Good agreement between the two figures can be seen. The x-z plane cuts (axis 1 = 0º) of the measured and simulated patterns are plotted in Fig. 5-8. The asymmetry of the measured pattern most likely comes from the non-ideality of the fabricated AUT. Since Axis 2 ranges from -120 º to 120 º, the x-z pattern is not measured in once, but it is obtained by combining two subsets of the measured 3-D pattern. Therefore there is twice a 60 º overlap in this plane. From Fig. 5-8 it can be seen that the repeatability over the overlapping area is very good: there is less than 0.2 dB difference between the two subsets of data.
-180 -135 -90 -45 0 45 90 135 180-0.5
0
0.5
1
1.5
2
2.5
3
Axis 2 (deg)
Gai
n (d
Bi)
1st subset of data2nd subset of dataSimulation
Fig. 5-8. Cut of the measured and simulated patterns of the test antenna in the x-z plane.
31
6. Summary of publications [P1] Mm-wave MIMO radio channel sounder In this paper, the first 60 GHz MIMO channel measurement system is presented. The system is based on a 2 and 5 GHz channel sounder and frequency converters. 2-D virtual antenna arrays are used at both ends of the link. Measurements in NLOS using a 25-element square array at TX and RX are reported. The measurement duration of the 25x25 channel matrix is 90 s. From those measurements, the channel mutual information is calculated for 2x2, 3x3, 4x4 and 5x5 MIMO configurations and compared to the iid MIMO Rayleigh channel. It is found that the mutual information of the measured channel is slightly lower than the one of the theoretical channel, and that the difference between the experimental results and the theoretical values increases as number of elements and the SNR increases. Furthermore, the effects of the orientation of the elements on the mutual information are reported. In addition, measurements in LOS and obstructed LOS with a 16-element square array at both ends of the link are reported, from which the DoA and DoD of the radio waves are estimated. The measurement results of LOS and obstructed LOS are not discussed in the summary part of the thesis since more relevant analysis of DoD and DoA estimation is presented in Section 2.4.1.2, based on [P2]. [P2] Mm-wave wideband MIMO channel sounding This paper presents a mm-wave ultra-wideband MIMO measurement system based on the combination of two sub-systems: an UWB sounder and a mm-wave MIMO sub-system consisting of frequency converters and virtual antenna arrays. The nominal frequency band of the system is 59.5 GHz - 66.5 GHz and the respective spatial resolution 43 mm. Preliminary measurements are performed using a 25-element square array at both ends or an 18 element circular array at TX and a cylindrical array made of three 18 element circular arrays at RX (54 elements). The measurement duration of the 25x25 channel matrix is 14 min. LOS and NLOS measurements are reported, from which DoA, DoD and propagation paths are estimated. Only the most relevant results are presented in the summary part of the thesis. [P3] VNA-based wideband 60 GHz MIMO channel sounder with 3-D arrays This paper presents a wide band 60 GHz MIMO channel sounder based on VNA. Virtual antenna arrays are used at both ends. The geometry of the arrays is a cube with 16 elements per side. The measurement duration of one snapshot (4096 channels) is about 21 min. The measurement frequency is from 60.5 to 64 GHz, which leads to a nominal spatial resolution of 86 mm. This fine resolution allows the characterization of dense multipaths in indoor environments. Preliminary results are shown and it is seen that even with obstructed line of sight, a significant part of energy is transmitted from TX to RX through several multipaths. [P4] Measurement-based mutual information analysis of MIMO antenna selection in the 60 GHz band In this paper, the performance of several MIMO antenna selection configurations with 2 and 3 selected elements out of N available antennas are analyzed, based on 60 GHz MIMO channel measurement data. In addition, they are compared to the traditional 2x2 and 3x3 MIMO. With
32
a lossless switching network the mean mutual information is close to that found in the literature for antenna selection with iid MIMO Rayleigh channel. In the best case the mutual information obtained by selecting 2 elements out of N can be even higher than the mutual information of traditional 3x3 MIMO system. However, when considering a realistic switching network, the performance decreases drastically: in a large majority of cases the mutual information obtained with antenna selection is lower than the mutual information of traditional MIMO configuration. The results indicate that the losses of the switching network are a crucial issue in the implementation of antenna selection at 60 GHz. [P5] Measurement based mutual information analysis of beam steering in the 60 GHz band This paper presents the comparison, based on measurement data, between beam steering and MIMO techniques, in terms of mutual information. Beam steering technique is applied at RX, using 5 elements in line with inter-element spacing of 1 λ. Similar array geometry is used at TX so that the mutual information is calculated for a 5x1 MISO system. Five different phase shifts are applied at RX in such a way that the full 360° azimuth range is covered with maximum variation of 4 dB. With lossless phase shifters and power combiner, the mean mutual information obtained by selecting the best beam out of 5 is higher than the one of 2x2, 3x3 and 4x4 MIMO configurations at low SNR, but at 10 % probability level MIMO technique outperforms beam steering technique at all SNR. When considering realistic components, the mean mutual information obtained by selecting the best beam out of 5 is only higher than the one of 2x2 MIMO configuration at low SNR, and at 10% probability level MIMO technique outperforms beam steering technique with a larger margin than in the case with lossless components, at all SNR. [P6] Low cost planar omnidirectional antenna for mm-wave applications A planar omnidirectional antenna structure with a wide beam for applications in the 60 GHz band is presented in this paper. The antenna was designed so that only one metal layer is needed, and therefore it can be manufactured at low cost. The optimal structure, on 150 μm thick substrate, has been simulated and shows very good characteristics: the 10 dB bandwidth covers the 57 – 64 GHz band. The variation of the gain is ± 0.5 dB. The good omnidirectional property is observed over the full frequency band. Due to manufacturing limitations, the antenna was fabricated on 300 μm thick substrate, which decreases reasonably the performance of the structure. The measurement results of this antenna are presented and good agreement is found with the simulation results. The influence of an additional transmission line has been studied and it can be concluded that it does not affect significantly the radiation pattern. [P7] Compact 3-D on wafer radiation pattern measurement for 60 GHz antennas This paper presents a 3-D on-wafer radiation pattern measurement system for 60 GHz antennas. The whole setup is very compact and fits into a volume of about 1 m3. The results indicate that the limitation in the dynamic range comes from the radiation of the probe itself. Good agreement is found between the measurement and simulation results of a test antenna. Very good measurement repeatability was observed. The use of a V connector to feed the antenna was investigated and significant differences were found between probe-fed and
33

connector-fed antennas both in return loss and radiation pattern. Only the most relevant measurements and results are presented in the summary part of the thesis.
34
7. Conclusions and future work The work done in this thesis can be divided into three parts. In the first part, the objectives have been to develop a measurement system which allows the 3-D double-directional radio channel characterization and to perform measurements in indoor environments. The goal of the second part has been to compare three of the most promising multi-antenna techniques in real environments, namely MIMO, MIMO antenna selection and beam steering, based on the measurement data obtained in the first part. The aim of the third part has been to design a low cost 60 GHz planar omnidirectional antenna as well as a measurement system which allows the on-wafer characterization of 60 GHz antennas. The first step was to develop measurement systems which allow the characterization of the 60 GHz MIMO radio channel. The first system was developed based on an existing 2 and 5 GHz sounder and frequency converters. 2-D virtual antenna array, formed by moving an omnidirectional antenna with linear stages, was used at both ends. The advantages of virtual arrays, as compared to switched arrays, are the ease of reconfiguration, the free choice of the array geometry as well as the ease of calibration. The drawback is that only static environments can be measured. A measurement campaign was performed in NLOS with 25 element square array at both ends of the link. One of the main limitations was the phase drift, which limited the number of elements per array. Due to the limited bandwidth, the data obtained with this sounder were used only for mutual information evaluation. To the knowledge of the author, this was the first 60 GHz MIMO channel sounder reported in literature. Then, two wide band systems were developed. One was based on an existing UWB sounder. The frequency converters and virtual arrays were the same as those used in the first system. The other wide band system was based on a VNA, with the same frequency converters but the virtual arrays were formed with 3-D scanners at both ends. The phase drift of those wide band systems was very low so that it did not limit the number of elements per array. With the VNA based system LOS and obstructed LOS measurements were performed with 4x4x4 cube array at both ends (4096 channels per snapshot). Due to their high time resolution, the wide band systems can characterize accurately the indoor 60 GHz MIMO channel. The square arrays used in the two first systems and the cube arrays used in the third one were chosen since they allow the direction of departure (DoD) and direction of arrival (DoA) estimation in 2 and 3 dimensions, respectively, which can be used for channel modeling or to implement antenna test bed such as MEBAT. In addition, they allow mutual information evaluation directly from the measurement data as reported in [P1], [P4] and [P5]. In the second part of the thesis, novel information on the performance of multi-antenna techniques in real environments at 60 GHz is provided. The mutual information of traditional 2x2, 3x3, 4x4 and 5x5 MIMO systems was compared to the mutual information of iid MIMO Rayleigh channel. It is found that the mutual information of the measured channel is slightly lower than the one of the theoretical channel. The difference between the experimental results and the theoretical values increases as the number of elements and the SNR increases. This result indicates that at 60 GHz, in a NLOS scenario with TX in a corridor, the number of available sub-channels (due to spatial multiplexing) is limited, and this effect can be visible already with a small number of elements (e.g. 3x3 MIMO). Nevertheless, the mean mutual information obtained with the measured 5x5 MIMO is only about 10% lower than the one obtained with iid MIMO Rayleigh channel, which indicates that MIMO systems can operate well at 60 GHz. Furthermore, the effect of the orientation of the arrays on the mutual information is analyzed. It was found that, in an environment with a relatively uniform angular
35
distribution the orientation has no effect, but in an environment with a quite narrow angular distribution the mutual information of a 5x5 MIMO can vary up to 6%. Then, the performance of several MIMO-AS configurations with 2 and 3 selected elements out of N available antennas were analyzed and compared to the performance of traditional MIMO configurations. With lossless switching network the mean mutual information are close to those found in the literature for antenna selection with iid MIMO Rayleigh channel. In the best case the mutual information obtained by selecting 2 elements out of N can be even higher than the mutual information of traditional 3x3 MIMO configuration. However, when considering a realistic switching network, the performance decreases drastically: in a large majority of cases the mutual information obtained with antenna selection is lower than the mutual information of traditional MIMO. Therefore, for the same number of RF chains, it can be more beneficial, in terms of mutual information, to use traditional MIMO than MIMO-AS. The results indicate that the loss of the switching network is a crucial issue in the implementation of antenna selection at 60 GHz. The mutual information obtained by performing beam steering technique at RX with 5 element array has been compared to the one of traditional MIMO technique. It is seen that when considering lossless phase shifters, beam steering technique exhibits higher mean mutual information than 2x2, 3x3 and 4x4 MIMO at low SNR, but when considering realistic components, the mean mutual information obtained by selecting the best beam out of 5 is only higher than the one of 2x2 MIMO at low SNR. In all cases, at 10% probability level, MIMO technique outperforms beam steering technique. The results indicate that, similarly to MIMO-AS, the losses of the components affect significantly the performance of the system. Although the analysis reported in Chapter 3 is done only for NLOS scenario, it gives very useful information since this scenario is very probable in real environments (a person or a furniture can block the LOS signal). In addition, the results presented in Chapter 3 are based on measurements with 1 λ inter-element spacing. This is quite realistic for MIMO and MIMO-AS since this spacing reduces the correlation between the elements (as compared to traditional 0.5 λ spacing) and, due to the short wavelength (5 mm), such spacing can be used in future mobile devices. Although 1 λ spacing is not optimal for beam steering technique, the presented results give valuable knowledge on the trends. In the third part of the thesis, a planar omnidirectional antenna structure for applications in the 60 GHz band is presented. The antenna was designed so that only one metal layer is needed, which leads to low manufacturing cost. An optimal structure has been simulated and shows very good characteristics. The good omnidirectional property and impedance matching are kept over the full 57-64 GHz band. After the re-optimization of some parameters, this structure can be used as an element of a multi-element antenna. This antenna is very suitable for 60 GHz MIMO communications since it is compact, low profile, and inexpensive to fabricate. An advanced compact 3-D radiation pattern measurement system has been developed to evaluate probe-fed antennas. The advantages of this method are that it reduces the cost as well as the measurement and design time of integrated antennas. To the knowledge of the author, this is the first on-wafer measurement system which can measure more than one hemisphere, and therefore, allows measuring omnidirectional antennas. The radiation of the probe have been analysed and it was found that the dynamic range of the whole setup is limited by the radiation of the probe itself. A test antenna has been measured and good agreement was found between the measurement and simulation. In addition, very good measurement repeatability
36

was observed. From this work, it can be conclude that the on-wafer antenna characterisation technique is a cost-effective and reliable alternative to the traditional radiation pattern measurement in anechoic chamber. In summary, the performance of multi-antenna techniques has been analysed using the data obtained with novel 60 GHz MIMO measurement systems. A radiating element which can be a part of a multi-element antenna is presented, together with the measurement system which can characterise this antenna. As future work, more extensive measurement campaigns in several environments should be performed with the MIMO measurement system reported in [P3]. A radiating element with wider beam width in elevation, such as the one presented in [P6], could be used as elementary element in the virtual arrays. The data from this measurement campaign should be used to confirm the results presented in this thesis, and extend the validity of the analysis. In addition, the data should be utilized to optimize the implementation of multi-element antennas. The DoD and DoA should be extracted from those measurements and used to implement an antenna test bed, such as MEBAT, for 60 GHz multi-element antennas. Furthermore, those data should be utilized to build a 60 GHz MIMO channel model. Based on the radiating element presented in [P6], multi-element antenna should be designed. In order to improve the on-wafer radiation pattern measurement system, the phase should be measured, e.g. using a VNA instead of spectrum analyser. This would allow, with the help of the spherical wave expansion theory, increasing virtually the measured angular range.
37
References [1] R. Fisher, “60 GHz WPAN standardization within IEEE 802.15.3c”, Proc. Int. Symposium on Signals, Systems and Electronics, July 2007, pp. 103-105. [2] IEEE 802.15 WPAN Millimeter Wave Alternative PHY Task Group 3c (TG3c). Available at http://www.ieee802.org/15/pub/TG3c.html. [3] P.F.M. Smulders, “Exploiting the 60 GHz band for local wireless multimedia access: prospect and future directions,” IEEE Communications Magazine, pp. 140-147, Jan. 2002. [4] S. K. Yong and C. C. Chong, “An overview of multigigabit wireless through millimeter wave technology: potentials and technical challenges,” EURASIP Journal on Wireless Communications and Networking, no. 1, pp. 1-10, 2007. [5] M. Varonen, M. Karkkainen, M. Kantanen, and K. Halonen, “Millimeter-wave integrated circuits in 65-nm CMOS,” IEEE Journal of Solid-State Circuits, vol. 43, pp. 1991-2002, Sept. 2008. [6] C.-M. Lo, C.-S. Lin, and H. Wang, “A miniature V-band 3-stage cascade LNA in 0.13 μm CMOS,” IEEE Int. Solid-State Circuits Conf. Dig. Tech Papers, San Francisco, CA, Feb. 2006, pp. 322–323. [7] F. Zhang, E. Skafidas, and W. Shieh, “A 60-GHz double-balanced Gilbert cell down-conversion mixer on 130-nm CMOS,” in 2007 IEEE Radio Frequency Integrated Circuits Symp. Dig., Honolulu, HI, June 2007, pp. 141–144. [8] M. Varonen, M. Kärkkäinen, and K. Halonen, “Millimeter-wave amplifiers in 65-nm CMOS,” Proc. IEEE European Solid-State Circuit Conf., Munich, Germany, Sept. 2007, pp. 280–283. [9] B. Razavi, “CMOS transceivers for the 60-GHz band,” IEEE Radio Frequency Integrated Circuits Symp. Dig., San Francisco, CA, Jun. 2006, pp. 231–234. [10] S. Emami, C. H. Doan, A. M. Niknejad, and R. W. Brodersen, “A highly integrated 60 GHz CMOS front-end receiver,” IEEE Int. Solid-State Circuits Conf. Dig. Tech. Papers, San Francisco, CA, Feb. 2007, pp. 190–191. [11] J. H. Winters, “On the capacity of radio communications systems with diversity with Rayleigh fading environments,” IEEE Journal on selected areas Comm., vol. 5, pp.971-878, June 1987. [12] J. G. Foschini, “Layered space-time architecture for wireless communication in a fading environement when using multi-element antennas,” Bell Labs Technical Journal, pp. 41-59, Autumn 1996. [13] J. G. Foschini and M. J. Gans, “On limits of wireless communications in a fading environment when using multiple antennas,” Wireless Pers. Commun., vol. 6, pp. 311-335, Mar. 1998.
38
[14] J. Bach Andersen, “Array gain and capacity for known random channels with multiple element arrays at both ends,” IEEE J. Select. Areas Commun., vol. 18, no. 11, pp. 2172-2178, Nov. 2000. [15] J. Kivinen, P. Suvikunnas, D. Perez, C. Herrero, K. Kalliola, and P. Vainikainen, “Characterization system for MIMO channels,” Proc. 4th Int. Symp. Wireless Personal Multimedia Communications, Sept. 2001, pp. 159–162. [16] R. S. Thomä, D. Hampicke, M. Landmann, G. Sommerkorn, and A. Richter, “MIMO measurement for double-directional channel modelling,” Proc. IEE Technical Seminar on MIMO Communication Systems, London, UK, Dec. 2001, ref. no. 2001/175. [17] A. J. Paulraj, D. A. Gore, R. U. Nabar, and H. Bölcskei, “An overview of MIMO communications – A key to gigabit wireless,” Proceedings of the IEEE, vol. 92, no. 2, pp. 198-218, Feb. 2004. [18] P. Suvikunnas, K. Sulonen, J. Villanen, C. Icheln and P. Vainikainen, “Evaluation of performance of multiple-antenna terminals using two approaches,” Proc. of IEEE IMTC2004, Como, Italy, May 2004, vol. 2, pp. 1091 – 1096. [19] IEEE 802.15-07-0934-01-003c, available at https://mentor.ieee.org/802.15/file/07/15-07-0934-01-003c-merged-proposal-new-phy-layer-and-enhancement-mac-mmwave-system-proposal.pdf [20] D. C. Cox, “Delay Doppler charasteristics of multipath propagation at 910 MHz in a suburban mobile radio environment,” IEEE Trans. on Antennas and Propagation, vol. 20, no. 5, pp. 625-635, Sept. 1972. [21] S. Guillouard, G. El Zein, and J. Citerne, “Wideband propagation measurements and Doppler analysis for the 60 GHz indoor channel,” IEEE MTT-S Digest, Anaheim, CA, USA, Jun. 1999, vol. 4, pp. 1751-1754. [22] X. Hao, V. Kukshya, and T. S. Rappaport, “Spatial and temporal characteristics of 60 GHz indoor channels,” IEEE Journal on Selected Areas in Comm., vol. 20, no. 3, pp. 620-630, Apr. 2002. [23] M. Steinbauer, A. F. Molisch, and E. Bonek, “The double-directional radio channel,” IEEE Antennas and Propagation Magazine, vol. 43, no. 4, pp. 51-63, 2001. [24] J. Kivinen and P. Vainikainen, “Wideband indoor radio channel measurements at 5.3 GHz,” Proc. 27th European Microwave Conference, Jerusalem, Israel, Sept. 1997, pp. 464-469. [25] H. Oezcelik, M. Herdin, and H. Hofstetter, “Indoor 5.2 GHz MIMO measurement campaign,” COST Temporary Document TD (04) 174, Duisburg, Germany, Sept. 2004. [26] T. Manabe, Y. Miura, and T. Ihara, “Effects of antenna directivity and polarization on indoor multipath propagation characteristics at 60 GHz,” IEEE J. Select. Areas Com., vol. 14, no. 3, pp. 441-448, 1996.
39

[27] Y. Haibing, P. F. M. Smulders, and M. H. A. J. Herben, “Indoor channel measurements and analysis in the frequency bands 2 GHz and 60 GHz,” IEEE 16th International Symposium on Personal, Indoor and Mobile Radio Communications, Berlin, Germany, Sept. 2005, vol. 1, pp. 579-583. [28] N. Moraitis and P. Constantinou, “Measurements and characterization of wideband indoor radio channel at 60 GHz,” IEEE Transactions on Wireless Communications, vol. 5, no. 4, pp. 880-889, Apr. 2006. [29] K. Sakaguchi, J. Takada, and K. Araki, “A novel architecture for MIMO spatio-temporal channel sounder,” IEICE Trans. Electron., vol. E85-C, no.3, pp. 436-431, Mar. 2002. [30] MEDAV GmbH, Gräfenberger Str. 32-34, D-91080 Uttenreuth, Germany. http://www.medav.de. [31] Elektrobit Corporation, Automaatiotie 1, FIN-90461 Oulunsalo, Finland. http://www.propsim.com. [32] M.S. Choi, G. Grosskopf, and D. Rohde, “Statistical characteristics of 60 GHz wideband indoor propagation channel,” Proc. 16th Annual IEEE International Symposium on Personal Indoor and Mobile Radio Communications. CD-ROM, Berlin, Germany, Sept. 2005. [33] J. Kivinen, T.O. Korhonen, P. Aikio, R. Gruber, P. Vainikainen, and S.-G. Haggman, “Wideband radio channel measurement system at 2 GHz,” IEEE Transactions on Instrumentation and Measurement, vol. 48, no. 1, pp. 39-44, Feb. 1999. [34] J. Kivinen, “60-GHz wideband radio channel sounder,” IEEE Transactions on Instrumentation and Measurement, vol. 56, no. 5, pp.1831-1838. Oct. 2007. [35] J. Kivinen, P. Kangaslahti, M. Kärkkäinen, and X. Zhao, “Wideband radio channel sounder extension to 60 GHz frequency range,” Proc. 31st European Microwave Conference, London, England, Sept. 2001, pp. 305-308. [36] J. Laurila, K. Kalliola, M. Toeltsch, K. Hugl, P. Vainikainen, and E. Bonek, “Wideband 3D characterization of mobile radio channels in urban environment,” IEEE Transactions on Antennas and Propagation, vol. 50, no. 2, pp. 233-243, Feb. 2002. [37] Physik Instrumente (PI) GmbH & Co. KG Auf der Römerstr. 1 D-76228 Karlsruhe/Palmbach, Germany. [38] D. S. Baum and H. Bölcskei, “Impact of phase noise on MIMO channel measurement accuracy,” Proc. IEEE VTC4-Fall, Los Angeles, CA, Sept. 2004, pp. 1614-1618. [39] J. Sachs, M. Kmec, P. Peyerl, P. Rauschenbach, R. Thomä, and R. Zetik, “A novel ultra-wideband real-time MIMO channel sounder architecture,” Proc. URSI G.A., New Delhi, India, Oct. 2005, Paper 01645. [40] V-M. Kolmonen, J. Kivinen, L. Vuokko, and P. Vainikainen, “5.3 GHz MIMO radio channel sounder,” IEEE Transaction on Instrumentation and Measurement, vol. 55, no. 4, pp. 1263-1269, Aug. 2006.
40

[41] I. E. Telatar, “Capacity of multi-antenna Gaussian channels,” European Transactions on Telecommunications, vol. 10, pp. 585-595, Nov./Dec.1999. [42] C. C. Martin, J. H. Winters, and N. R Sollenberger, “Multiple-input multiple-output (MIMO) radio channel measurements,” Proc. IEEE 52th Veh. Tech. Conf (Fall), vol. 2, pp. 774-779, 2000. [43] M. J. Gans, N. Amitay, Y. S. Yeh, H. Xu, T. C. Damen, R. A. Valenzuela, T. Sizer, R. Storz, D. Taylor, W. M. MacDonald, C. Tran, and A. Adamiecki, “Outdoor BLAST measurement system at 2.44 GHz: Calibration and initial results,” IEEE J. Sel. Areas Commun., vol. 20, no. 3, pp. 570-583, Apr. 2002. [44] D. Chizhik, J. Ling, P. W. Wolniansky, R. A. Valenzuela, N. Costa, and K. Huber, ”Multiple-input − multiple-output measurements and modeling in Manhattan,” IEEE J. Select. Areas Commun., vol. 21, no. 3, pp. 703-712, Apr. 2003. [45] K. Sulonen, P. Suvikunnas, L. Vuokko, J. Kivinen, and P. Vainikainen, “Comparison of MIMO antenna configurations in picocell and microcell environements,” IEEE J. Sel. Areas in Commun., Special Issue on MIMO Systems and Application, vol. 21, no. 5, pp. 703-712, June 2003. [46] G.G. Raleigh, and J. M. Cioffi, “Spatio temporal coding for wireless communication,” IEEE Trans. Comm., vol. 46, no. 3, pp. 357-366, March 1998. [47] A. F. Molisch, M. Steinbauer, M. Toeltsch, E. Bonek, and R. S. Thomä, “Capacity of MIMO systems based on measured wireless channels,” IEEE J. Select. Areas Commun., vol. 20, no. 3, pp. 561-569, Apr. 2002. [48] L. Vuokko, P. Suvikunnas, J. Salo, J. Kivinen, and P. Vainikainen, “Comparison of measured MIMO capacities at 2 and 5 GHz,” Proc. of XXVIIIth URSI General Assembly, New Delhi, India, Oct. 2005, Paper 0741. [49] B.T. Maharaj, J.W. Wallace, M.A. Jensen, L.P. Linde, “Co-located indoor 2.4- and 5.2-GHz MIMO channel measurement, frequency scaling of capacity and correlation,” Proc. of ICT 2005, Cape Town, South Africa, May 2005, Paper 340. [50] V. Anreddy and M. Ingram, “Capacity of measured ricean and rayleigh indoor MIMO channels at 2.4 GHz with polarization and spatial diversity,” Proc. of IEEE Wireless Communications and Networking Conference, Las Vegas, NV, USA, April 2006, vol. 2, pp. 946–951. [51] J-S. Jiang, M.F. Demirkol, and M.A. Ingram, “Measured capacities at 5.8 GHz of indoor MIMO systems with MIMO interference,” Proc. of IEEE Vehicular Technology Conference, Orlando, FL, Oct. 2003. vol. 1, pp. 388-393. [52] S. Sanayei, and A. Nosratinia, “Antenna selection in MIMO systems,” IEEE Commun. Magazine, vol. 42, no. 10, pp 68 – 73, Oct. 2004. [53] P. Almers, T. Santos, F. Tufvesson, A.F. Molisch, J. Karedal, and A.J. Johansson, “Measured diversity gains from MIMO antenna selection,” Proc. 64th IEEE Vehicular Technology Conference, Montréal, Canada, Sept. 2006.
41

[54] M.A. Jensen and M.L. Morris, “Efficient capacity-based antenna selection for MIMO systems,” IEEE Transactions on Vehicular Technology, vol. 54, no. 1, pp. 110-116, Jan. 2005. [55] G. Lebrun, S. Spiteri, and M. Falkner, “MIMO complexity reduction through antenna selection,” Proc. of the Australian Telecommunications, Networks and Applications Conference, ATNAC, Melbourne, Australia, Dec. 2003. [56] A.F. Molisch, M.Z. Win, Y-S. Choi, and J.H. Winters, “Capacity of MIMO systems with antenna selection,” IEEE Transactions on Wireless Communications, vol. 4, no. 4, pp. 1759-1772, Jul. 2005. [57] J.-H. Park, S. Lee, J.-M. Kim, Y. Kwon, and Y.-K. Kim, “A 35-60 GHz single-pole double-throw (SPDT) switching circuit using direct contact MEMS switches and double resonance technique,” 12th International Conference on Solid-State Sensors, Actuators and Microsystems, Boston, Massachusetts, June 2003. vol. 2, pp. 1796-1799. [58] M. Case, M. Matloubian, Hsiang-Chih Sun, D. Choudhury, and C. Ngo, “High-performance W-band GaAs PIN diode single-pole triple-throw switch CPW MMIC,” IEEE MTT-S International Microwave Symposium Digest, June 1997, vol. 2, pp. 1047-1051. [59] C. K. Au-Yeung and D. Love, “On the performance of random vector quantization limited feedback beamforming in a miso system,” IEEE Trans. Wireless Commun., vol. 6, no. 2, pp. 458–462, Feb. 2007. [60] N. Guo, R. C. Qiu, S. S. Mo, and K. Takahashi, “60-GHz millimeter-wave radio: Principle, technology, and new results,” EURASIP J. Wireless Commun. Networking, vol. 2007, ID 68253, 2007. [61] S. Lee, S. Song, Y. Kim, J. Lee, C-Y. Cheon, K-S. Seo, and Y. Kwon, “A V-band beam-steering antenna on a thin-film substrate with a flip-chip interconnection,” IEEE Microwave and Wireless Components Letters, vol. 18, no. 4, pp. 287-289, April 2008. [62] J.A.G. Akkermans and M.H.A.J. Herben, “Planar beam-forming array for broadband communication in the 60 GHz band,” Second European Conference on Antennas and Propagation, Edinburgh, UK, Nov. 2007. [63] J.-Y. Park, Y. Wang, and T. Itoh, “A 60 GHz integrated antenna array for high-speed digital beamforming applications,” IEEE MTT-S International Microwave Symposium digest, vol. 3, pp. 1677-1680, 2003. [64] M. Sanchez-Fernandez , S. Zazo, and R. Valenzuela , “Performance comparison between beamforming and spatial multiplexing for the downlink in wireless cellular systems,” IEEE Transactions on Wireless Communications, vol. 6, no. 7, pp. 2427-2431, 2007. [65] A. Pollok, W.G. Cowley, and I.D. Holland, “Multiple-input multiple-output options for 60 GHz line-of-sight channels,” Australian Communications Theory Workshop, Jan./Feb. 2008, pp. 101-106.
42

[66] C. Hermosilla, R. Valenzuela, L. Ahumada, and R. Feick, “Empirical comparison of MIMO and beamforming schemes,” IEEE International Conference on Communications, Beijing, China, May 2008, pp. 4226-4229. [67] H. T. Kim, S. Lee, J. Kim, J.-H. Park, Y.-K. Kim, and Y. Kwon, “A V-band CPS distributed analog MEMS phase shifter,” Digest of IEEE International Microwave Symposium MTT-S 2003, June 2003, vol. 3, pp. 1481-1484. [68] F. R. Hsiao and K. L. Wong, “Low-profile omnidirectional circularly polarized antenna for WLAN access points,” Microwave and Optical Technology Letters, vol. 46, no. 3, pp. 227-231, Aug. 2005. [69] N. Herscovici, Z. Sipus, and P.-S. Kildal, “The cylindrical oomnidirectional patch antenna,” IEEE Transactions on Antennas and Propagation, vol. 49, no. 12, pp.1746-1753, Dec. 2001. [70] K. L. Wong and C. H. Wu, “Wide-band omnidirectional square cylindrical metal-plate monopole antenna,” IEEE Transactions on Antennas and Propagation, vol. 53, no. 8, part 2, pp. 2758-2761, Aug. 2005. [71] K. L. Wong, F. R. Hsiao, and T. W. Chiou, “Omnidirectional planar dipole array antenna,” IEEE Transactions on Antennas and Propagation, vol. 52, no. 2, pp. 624-628, Feb. 2004. [72] R. Bancroft and B. Bateman, “An omnidirectional planar microstrip antenna,” IEEE Transactions on Antennas and Propagation, vol. 52, no. 11, pp. 3151-3153, Nov. 2004. [73] Y.-J. Wu, B.-H. Sun, J.-F. Li, and Q.-Z. Liu, “Triple-band omni-directional antenna for WLAN application,” Progress In Electromagnetics Research, PIER 76, pp. 477-484, 2007. [74] Y.-J. Wu, J.-W. Fan, and B.-H. Sun, “Dual-band omni-directional antenna for WLAN application,” Microwave and Optical Technology Letters, vol. 50, no. 5, pp. 1328-1330, Mar 2008. [75] P.M. Watson, G.L. Creech, and K.C. Gupta, “Knowledge based EM-ANN models for the design of wide bandwidth CPW patch/slot antennas,” IEEE AP Symposium, Orland, Florida, July. 1999, vol. 4, pp. 2588-2591. [76] Ansoft Corporation, 225 West Station Square Drive Suite 200, Pittsburgh, Pennsylvania, 15219-1119, USA. [77] Anritsu Corporation, 5-1-1 Onna, Atsugi-shi, Kanagawa, 243-8555 Japan, http://www.anritsu.com. [78] C. Kärnfelt, P. Hallbjörner, H. Zirath, P. Ligander, K. Boustedt, and A. Alping, “High gain active microstrip antenna for 60-GHz WLAN/WPAN applications,” IEEE Trans. on Microwave Theory and Techniques, vol. 54, no. 6, pp. 2593-2603, June 2006. [79] T. Zwick, C. Baks, U. R. Pfeiffer, D. Liu, and B.P. Gaucher, “Probe based MMW antenna measurement setup,” IEEE AP-S Symposium, Monterey, CA, USA, June 2004, vol.1, pp. 747-750.
43
[80] J.A.G. Akkermans, R. van Dijk, and M.H.A. Herben, “Millimeter-wave antenna measurement,” Proc. European Microwave Conference 2007, Munich, Germany, Oct. 2007, pp. 83-86. [81] R. N. Simons, “Novel on-wafer radiation pattern measurement technique for MEMS actuator based reconfigurable patch antennas,” 24th Annual Antenna Measurement Techniques Association Meeting and Symposium, Cleveland, Ohio, Nov. 2002. [82] L. Roy, M. Li, S. Labonte, and N.R.S. Simons, “Measurement techniques for integrated-circuit slot antennas,” IEEE Trans. Instrumentation and Measurement, vol. 46, no. 4, pp.1000-1004, Aug. 1997. [83] A.Shamim, L. Roy, N.c Fong, and N. G. Tarr, “24 GHz on-chip antennas and balun on bulk Si for air transmission,” IEEE Trans. Antennas and Propagation, vol. 56, no. 2, pp. 303-311, Feb. 2008. [84] GGB Industries, Inc., P.O. Box 10958, NAPLES, FL 34101. http://www.ggb.com. [85] National Instruments Corporation, 11500 N MoPac Expwy, Austin, TX 78759-3504, USA. [86] J. Kraus and R. Marhefka, Antennas For All Applications, Third Edition, Mc Graw Hill, 2002.
44