Embed Size (px)
Citation preview
RADNANUINTERNATIONALE
EIA AddendumVol a
In July 1996 the Moroccan Ministry of Environment approved the Jorf Lasfar Power
Plant (JLPP) Environmental Inpact Assessment (EIA) with the stipulation that certain materials
be provided as an addendum. These are as follows:
Attachment 1: Letter (in French) from the Minist6re de l'Environnement withattachments approving the EIA;
Attachment 2: English translation of the letter from the Minist6re de1'Environnement;
*. Attachment 3: A brief description of the EIA process;
*. Attachment 4: A matrix summmrizing impacts of the proposed Project;
>. Attachment 5: Ambient air data collected in 1994 and in March - May 1996;
Attachment 6: Results from Air Monitoring at JLPP (30-Day Report);
Attachment 7: Analysis of JLPP ash;
Attachment 8: The Radian Phase II Environmental Assessment Report; and
Attachment 9: The Radian Phase II Environmental Assessment Report,Appendices.
These materials are provided in this volume.
lA
EIA Addendum August 1, 1996
Pub
lic D
iscl
osur
e A
utho
rized
Pub
lic D
iscl
osur
e A
utho
rized
Pub
lic D
iscl
osur
e A
utho
rized
Pub
lic D
iscl
osur
e A
utho
rized
Pub
lic D
iscl
osur
e A
utho
rized
Pub
lic D
iscl
osur
e A
utho
rized
Pub
lic D
iscl
osur
e A
utho
rized
Pub
lic D
iscl
osur
e A
utho
rized

I~~~~~~~~~~~~~~~~~~~~~~~~~~~~~~~~~
ok I l ,ft
;
RAD ANINTERNATIONALM3
EIA AddendumAttachment 1
Letter (in French) from the Ministere de I'Environnement
t4

is I .
2~~~~~~~~~~~~~~~~~~~~~~~~~~~~~~ROVAU4E DV #4t4U-
NMISJTV"K DT ?LoJiN
PaIM-AoDN DE f0 L81mIA1*NmDt SIW3 U CT OR LA L'RIJOWNATI(YN
s~ ~ ~ ~~~V I.e Mi(r v zlWh Ic Prz.vir;cnaoament
MonsiDaUI Tony RikRadia eteatlmm
Ulunsbommi' iatsQU3O Sba(bpdsk Ju*d, Suke 0
Lv1WlilIt NY 4S222
Obft' lRapport d'esamen de i'ttude dWimpaot prdliminsim dgi prujtd'ctendoade la cetnak lhnriqua. JcarlL r.
Dans lc wcrc du projet ddextems ai dct plaoitalion de la cQLJuulcthormique & Ju!fLa Lwr par le congnrtium ABWCMS, un 6tude u 'impM a t
<*r c*Kb]rtU Mt gux Dre,ctives de- Is 1bzoo Mafndisie et desoolhiliCUS DuOiucs ont ii crgonises A El Jdida au prfit de In populfiscusci a *CabRanca poor IC- Orsuniussicn'm iJo GvuuvcniUfttaLks.
I A t rruws dt , rxiAum do ce-te duiLi p*.4ws14 par la socii* kldimn omiti aoppvr s par It! Misixis6r* de; 'i'nvironrxrijcn, q'u a &A ollwiti pourprocdetr i It'wmca de l'tude d'impact et dertre xo. avis.
L)nz ce sensw et cmodaZn?nent i l proc#dure dc a& sim des exudesd'inu=pti pt*er'.te par cc. dii.prwm!nt -au (Xmszil Nvtional do V'rEviTonnuncri;om de ta sestion d Juin 199S, b. Mini'tiTe de ItrwMrounnomant u% iavwt lesmombres du eomlde t de xsufvies ktuis% d'impu A partielpor d 1'examn decetc itude et 'a N Mui.mi organisdc & vet .tffet le Mardi 23 jo!llet 196, aii si6gedo laDietic de l'Observatio. osTi Eutirs et de la Coardinatkm. tine copie dc.I'etude JiiuWeet de ce pjca a ii adrewse A chkmd do dMpartementsniruistdjdels directnemni wnc=6- par ce proie.
so
l.JjrSL dt .,tS rtiniin. leg teprSisLants d; le societe Rdiam, duLabctrniTe Puhhig d'Jissais et d'Btdls et ceux du coQso)Iium A139/CMS ont1Ri-sente danf. tn prmiTtier tnmps tea diffSreruu upu* nlrs du prorjct ct dc1'6tude d'impact avent d'entamer les d5scussions auzour So wcvx smlvarA-
- conformnitx d& J'etude d'impact aux meuns de YEireFce pv6scrftls;
- prtinence et iran*tittude des domx8 our 1'enviromctueat er sur le projt
- imwt cdu projet su le milieu envirannaTt
- rncsurJ t'aniination preconise;
- plan de survcilhunc.. de suivi :L de conurole e.nannamenftai
- rapFux r td'examen dc ldxtude d'iupLC.
A Iiiu= d( ce 5tUrimi, iA Coit, de suM a recomzmndc & la societeRadiaus et au Ckmvrfi4ml A. 8CMS d"'nt6i a i V sde les p*%s %Wuants:
I- W*e neot mnWwJl.c%ique qui s ltise la do 4he pouniie mrt'ftude d'imDact sur Iwirumtt.
2- unv mutriu& Wli%atm resortir lea prhn.ipales co nPozarwes. h& nroiet(phase dcs comnwtion et dI' xpJukada) ii hurw- oftes cur le milieu bialogic ue,physique et htumahn.
J- lo% do*untis RtTeren?tcs Aux cainpa,im d'6chv.ti11onuager el dcAnatyicSomniomswes dans lietwie d'inip.c. 11 x'azit cr. '=uffmnce des dornbs
Sujv0nitec.
tui.v l, danneF -miatie8ItVC ampx pw rca 5aUS69 pot 1OW4 or1994, 199,5 i J46 svr 1'.au et Nth;
- toutcs es, donQea rel3tives aux campagres p. s p Aran cnUV'p et 1996. sjr l'a&. 1'eA o le, 4l.
* les caraet&risiqucs dce ccudres.
XUUSUbsm-,M 3 4& E f? fix asZfwlu
£^M-U_DI2MA . .A""P-t¶ argAl mo-a&-G.-.@; : 'w... ifslir1N JQG * ' :. r*-. :g nl~ i"rn - *as *|Z:;
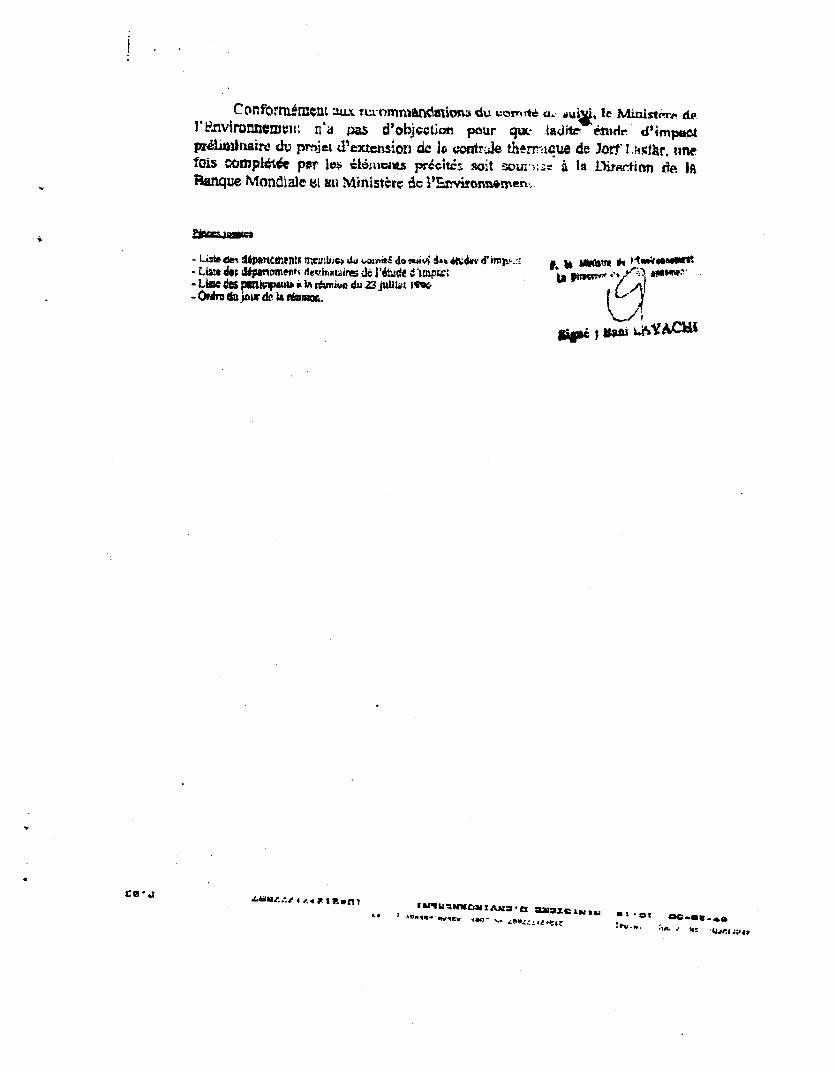
CoiformOnsaL aux nrymnanrd mima d;± vortt u a ui, Ic Ministerp. deli.nvirannealrui n'a -Pas d'objcctan pour qu Aalacitr 1&idr d'impst
prilJinaire du pmietd dlextensior, de 1hi cntrje thezr-acue de Jor I. gtr, linefois oompl64e par 1I m koliicnts prieit* soit u,i,-v a la L)rection ile IARanque Maondiale eL ati Mlinisterc de m.itonuamem-
-Li= d; dipndend% dmip.'mir &t, j, Imnstu -L Mwdes p= qui& ijz rAmiw dui 23 PWW ifCOUPdaur de doom . 3
t MF,gq. A ViKV 1M3 *e.:- e
N.m: ; --t -"I p~~
_PI -A _ . . ., . _
A A Nx Vs H s 4______*_:__ . -_r . __________
;4GS% 4.-z (d2 t4
' oS,si j,,1 kL>.&s _____________
- ___. ....._ _ _ _ _,_""i Li35^ LA<w_Z9\ Ja r_t
Ex.
F~~~~~~~~~^ -W -- -
r'l ~ ~ ~ ~ ~ ~ ''
b . _ . .. _. _.*__ L '. 1II.
*. . __ - tw--
i W -a 00 . 4 {s tF If- fo IC yP4 9,,1 CA 3 mm-we -
-~~~~~~~~~~~~~~~~~~~~0 ' - V
~~G&L IUEO-C4,2w _ ; MMN~lKL auXLLXI El &I U _; j,-
_~~~~~~~~~~~~ Neby ., *-;m*o&e L i 1..
. ~ ~ ~ ~ ~ _ _ _ *- _/.!-'' : i i-t
. ' {a.2 Fs t? m A i , ;' 1'O#t
_ _.t_. _ P_I ._ .. _ _.___
_________ i'_____t. / fo44 yg3X
_. _ _ _ _ _ _ __-
te 4 4 ANr -_ _.U &
.V_ _
N ;~~~~~~~~~1 A:4, .vsv ju, zeu. w. -.i!- S0- eW4:..4
- , OL° 4 -> n - 3s 4v 2
LddN fI4UdANU &...h i~ -. 0
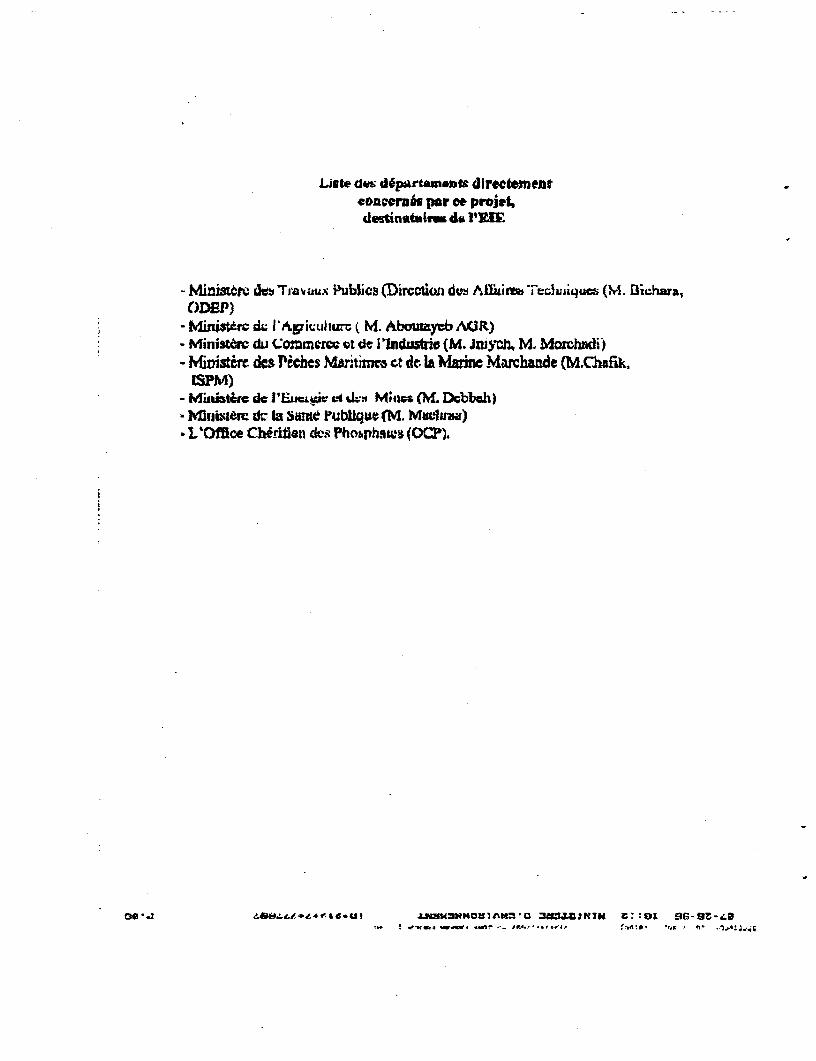
Liste des d6partamwts dJir.ctomentconc.r.is par oe projet,deutianbti de lRl.
- MinfiCawt dY Tjaa;jux P}Ub5icB (Dirsctioi duw Ali]~i Tec~iiq3uct (M. Bicar,ODEP)
- Minisdr di I& icAtkuhu= ( M. AboUycb AGR)- Minist6c d; C=ommrc ot de (It Indu*i (M. Jniych, M. M4onhcdii)- 1nistre des eches Marititr8 a de la Mmim Marchande (MCbafik.
KSPM)- Minist&e dcc I'hLJcLit %6: Mha (oL DIbb,h)
M- 1u*i d Ia Samte Pubhlqiw (M. Maclirsa)-L'Otfice Chdrfifen des Phosaphows (OC?P).
OB .1 JJ65I43NMOH_= -~J.UK -! 4 I'U I El 9:at S-9r-da
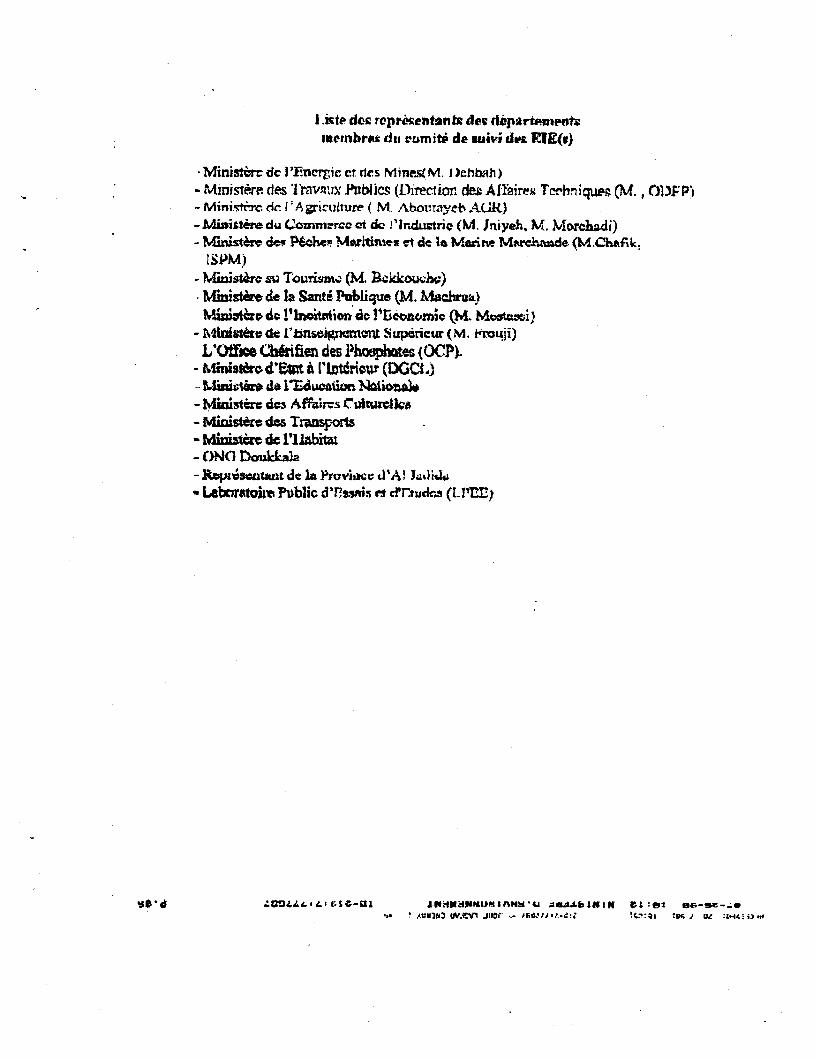
I .ite dosc rep erenntR Aec departsent;me,nbra* dii rwnmitb de suivi dm RIEQI
*Minist*rc dc l'EncTrric et vies Mine-i M. I )ebbAh )- Mrnistere des Tr1vAvx PibliciCS (LDirectior, deie A Ibirem Tbn iqw (M., OL)F P)-MPAinist"rc: dc IA Agrictiture ( M. Abovr. ryed* A.UR- =Mi mitte du Commrrcc et dc J' Indtrie (M. Iniyeh. 1M. Mormhadi)- Ministhe def P66heu M4itiifnes et dc la Mriwie Mamrck=de (M.CIfWk
- lMliistErc su Tourisas; (M Bkkiou¢)Miisite de a Sa=tt Puliquse (M. Machrma)at !'1roi§ioa do es£icnun;c (M. Mc0um)
- Mistdr. de l'hnseigncXmo S upcrietr (M. frou i)
L'O±YsOB CLb6ifien des Phophette6 {OCP.- &Smo 4"Ezt A lIint4riour (DGCC)
IMix"Ump dc it afion Naitialo- Miuistr dcs Affarms Ciuhustela- Miuistr des Trm*spoz
-Miniate de 1'lLsbiti- O)W(1 DOukka)a
* w Lbftauuxt de la h-lvr1nt d'Afl (L%WolAkMtoltv i bl hi;c d'P, -so etc r=t udcs (1 1'r1r-
sO'd ~ SOvLL§L$f%{-Ol ^.";H"S^[t8S^"iU 4FJNI {:a% o4r-S-Le' A .. '"IN3 WJE JUDC' . h!}.! t'1 *,} W ;A
VJ.K .S'IU Vt.'UKRANOr
rlti E-TLES rr V} Lh COUIWINATFON
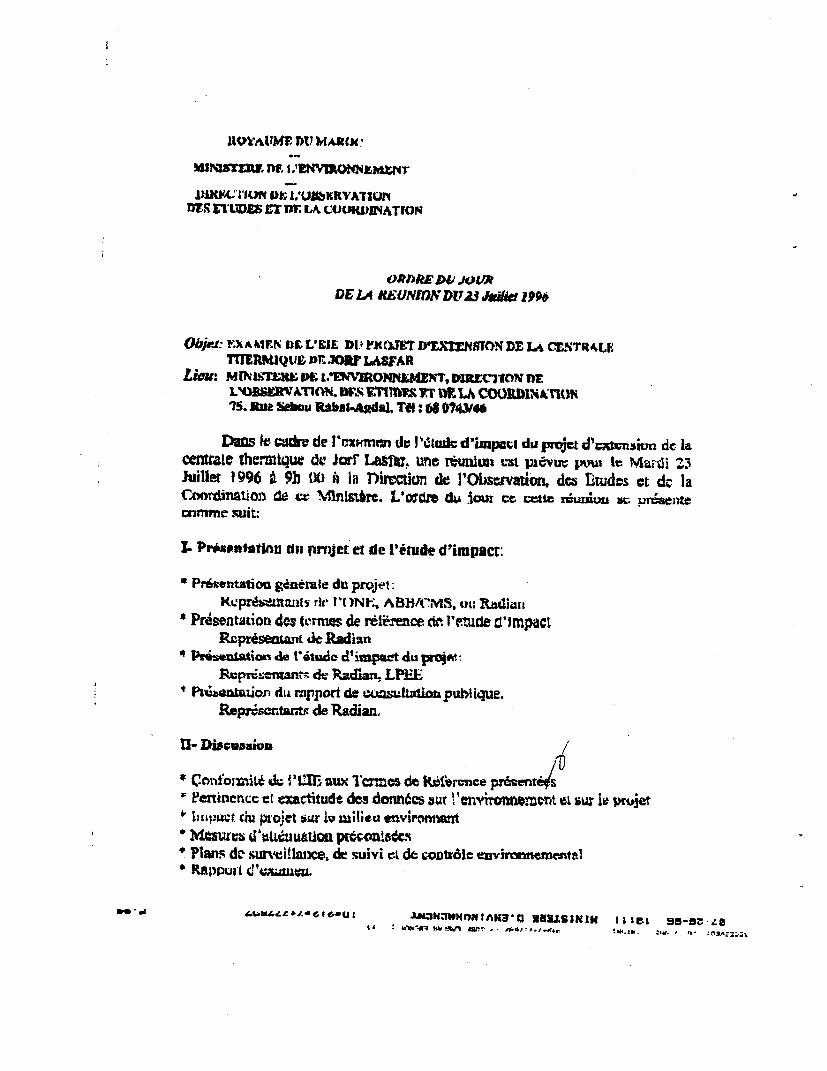
O#JvRED@E' 4fhIDELol K9UN1f1WD1T23Jae 1
Obj.ef FVXA bEN DI LEIE D;i FXONET IYEXTENISON DE L CTUNTRALPTUrRQVRS& Jr1 O MSFAR
Lieu: MNLtS1iX1P ¶tIViRONy4M~', DiariiCN nz- ~L'OSVVThI 1. VOFflb1 mm; IZE.Lh aOORB1NANw
?S. fi SIou R*bal.A*duL, TiW: 6 0743V46
Dam It cake de I'xmmmm d I Piutadc d'impasi du proj d'c;M,5ivun dc laccn=ale thermique dc jorf Lasufai une tuntwI LIsl pevur pt"Ar i Mau 23Juillet 1996 A 9h 9b h An floirmikn de I'Obsivatimo, dcs Ltudos et dc laCoordination de cr Nistire. L'oawd d& ioux cc cztc n'unku . 'U:naenltezrnime suit:
L Proxontofati dii pnijet et de letude d'impact:
- Pr6smtation ,tnerale du projet:K,cprfs=zritits rc, 1'( )Nl ., ABIi/AMS, cit, l sian
* Prisentation des termnes de r6limence c. P Mude d'impactRzpr4semnt de Radian
P Pseitation de iteudo d'inixwt d.i T-p-riesnton-, d- Rafian, LPEE
' himi"on du rapport de cuasWI4a1ipublique.Ropr6scltartR de Radian.
U- Diuwuao
* Contoiti d^; M'=; aux 1'rm,s de Hifertnce priSsnrsI Fenincnicc et Cxaitude des doam6cs sur ! 'en .m rt vI sus Ie prijet' Itspwt. ciu pzojet Sur i0nlv itii envi ;* Mtuzr dI'glktuuaUc pronlc.at.* Plans de suwmi!lalce, des uivi c de comtr6ie envimmeme:nta1' RtappuaL i!znv,
-It* ! 6-u t' SuIJ LCSIN l n 58 9B-9Z #O

I~~~~~~~~

I

RADL^N-INTERNATIONALMB
EIA AddendumAttachment 2
English Translation of the Letter from theMinistere de l'Environnement

II
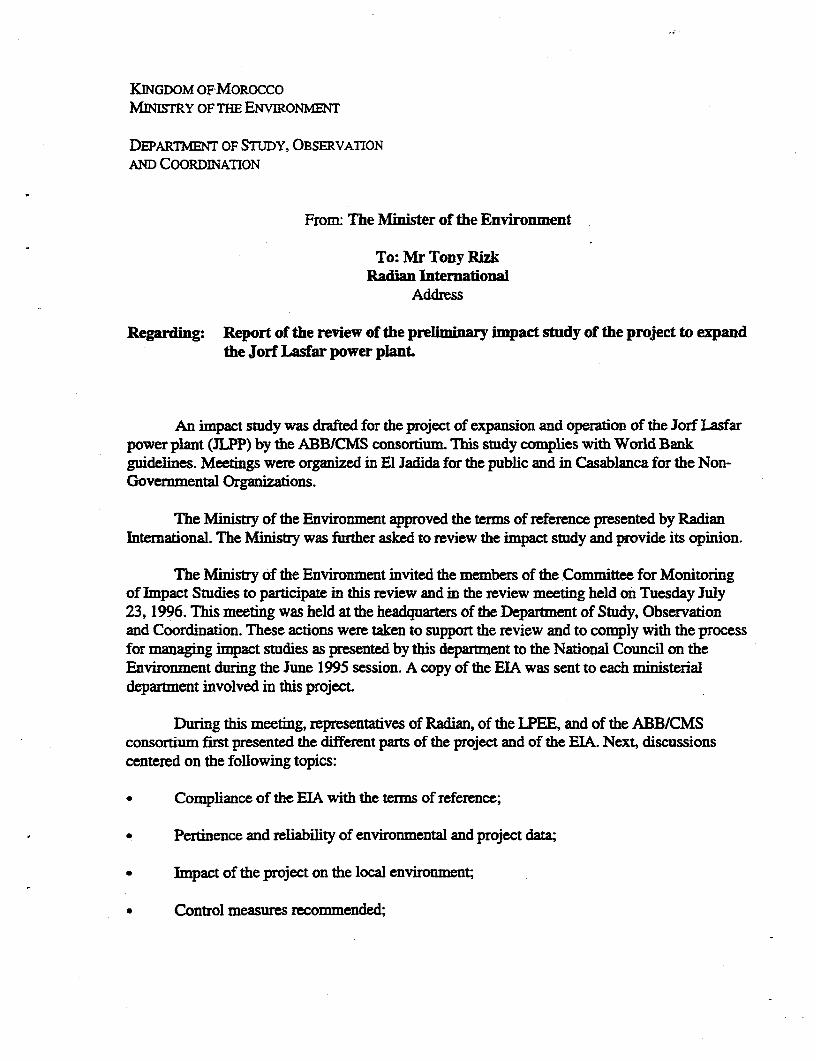
KINGDOM OFQMOROCCOMiNSRY OF THE ENvIRoNMENT
DEPARTmENT OF STUDY, OBSERVATONAND COORDINATION
From: The Minister of the Environment
To: Mr Tony RizkRadian International
Address
Regarding: Report of the review of the preliminary impact study of the project to expandthe Jorf Lasfar power plant.
An impact study was drafted for the project of expansion and operation of the Jorf Lasfarpower plant (JLPP) by the ABB/CMS consortium. This study complies with World Bankguidelines. Meetings were organized in El Jadida for the public and in Casablanca for the Non-Governmental Organizations.
The Ministry of the Environment approved the terms of reference presented by RadianInternational. The Ministry was further asked to review the impact study and provide its opinion.
The Ministry of the Environment invited the members of the Committee for Monitoringof Impact Studies to participate in this review and in the review meeting held on Tuesday July23, 1996. This meeting was held at the headquarters of the Departaent of Study, Observationand Coordination. These actions were taken to support the review and to comply with the processfor managing impact studies as presented by this department to the National Council on theEnvironment during the June 1995 session. A copy of the EIA was sent to each ministerialdepartment involved in this projecL
During this meeting, representatives of Radian, of the LPEE, and of the ABBICMSconsortium first presented the different parts of the project and of the EIA. Next, discussionscentered on the following topics:
* Compliance of the EIA with the terms of reference;
* Pertnence and reliability of environmental and project data;
* Impact of the project on the local environment;
a Control measures recommended;
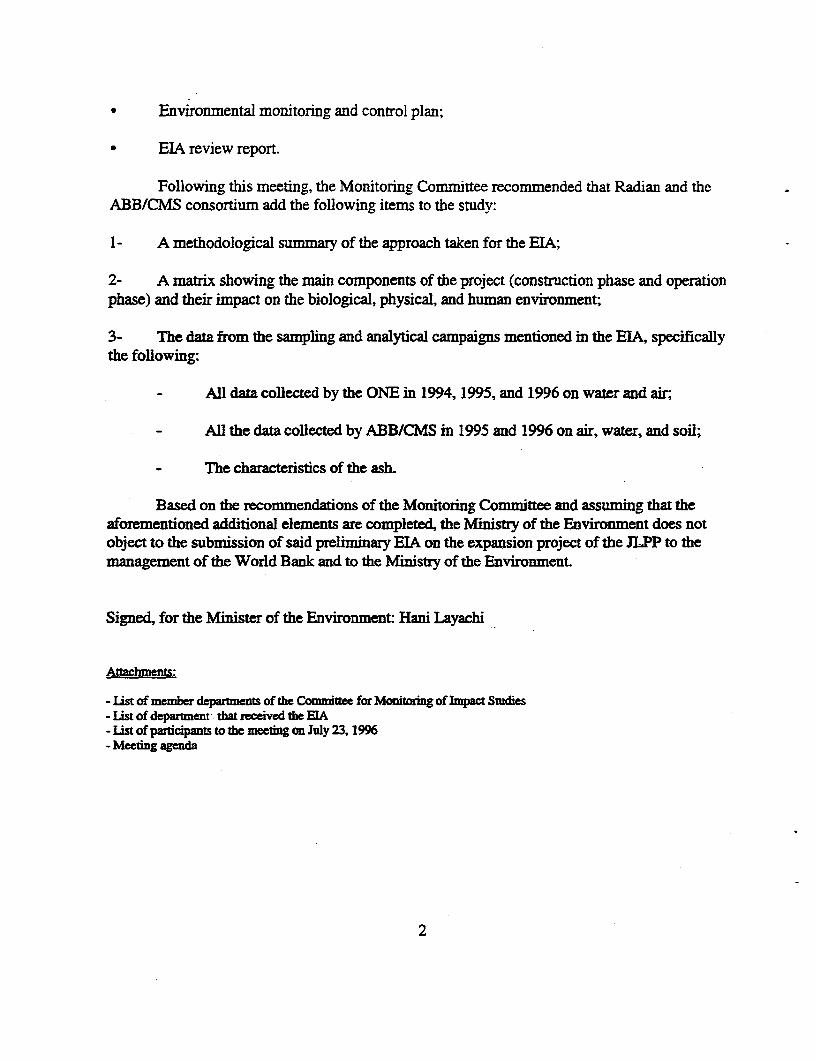
* Environmental monitoring and control plan;
* EIA review report.
Following this meeting, the Monitoring Committee recommended that Radian and theABB/CMS consortium add the following items to the study:
1- A methodological summary of the approach taken for the EIA;
2- A matrix showing the main components of the project (construction phase and operationphase) and their impact on the biological, physical, and human environment;
3- The data from the sampling and analytical campaigns mentioned in the EIA, specificallythe following:
All data collected by the ONE in 1994, 1995, and 1996 on water and air;
-All the data collected by ABB/CMS in 1995 and 1996 on air, water, and soil;
The characteristics of the ash.
Based on the recommendations of the Monitoring Committee and assuming that theaforementioned additional elements are completed, the Ministry of the Environment does notobject to the submission of said preliminary EIA on the expansion project of the JLPP to themnanagement of the World Bank and to the Ministry of the Environment.
Signed, for the Minister of the Environment Hani Layachi
Attachments:
-List of member depa4ments of the Conminte for Monitoring of Impact Studies- List of department- tbat received the EIA- List of participants to the meetig on July 23, 1996- Meeting agenda
2

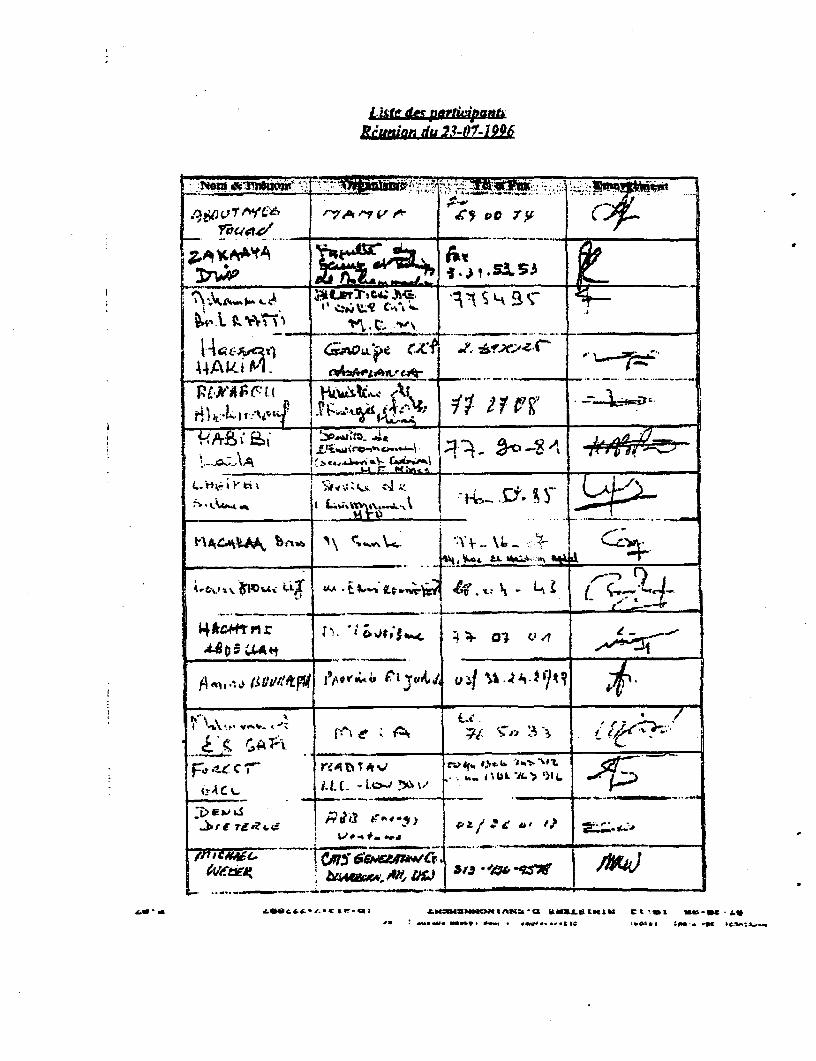
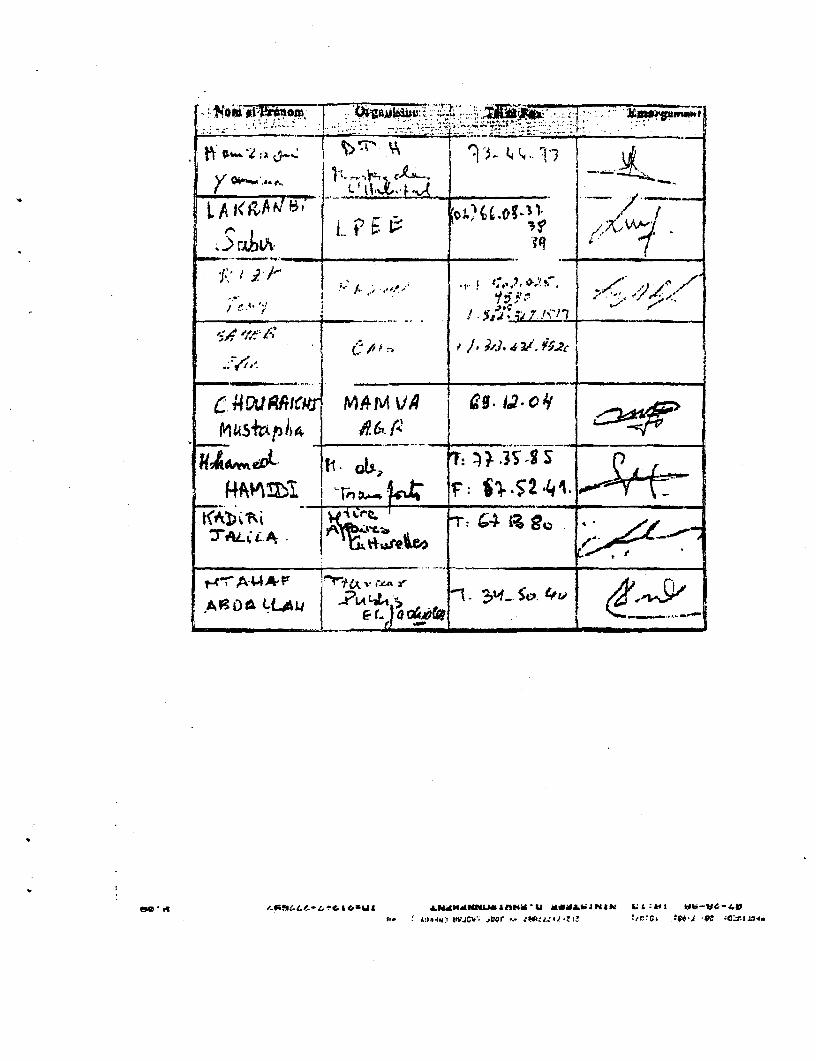
List of Paricidantslulv 23, 1996 Meetine
3

I If I X
List of departnents directly interested in this project(recipients of the EIA)
* Ministry of Public Works (Department of Technical Affairs, M. Bichara, ODEP)
* Ministry of Agriculture (M. Aboutayeb AGR)
* Ministry of Commerce and Industry (M. Jniyeh, M. Morchadi)
* Ministry of Marine Fisheries and Merchant Navy (M. Chafik, ISPM)
* Ministry of Energy and Mines (M. Debbah)
* Ministry of Public Health (M. Machraa)
* Office Ch6rifien des Phosphates (OCP)
4

List of Representatives of the Member Departments ofthe Committee for Monitoring of ELAs
* Ministry of Energy and Mines (M. Debbah)
* Ministry of Public Works (Department of Technical Affairs, M., ODEP)
* Ministry of Agriculture (M. Aboutayeb AGR)
* Ministry of Commerce and Industry (M. Jniyeh, M. Morchadi)
* Ministry of Marine Fisheries and Merchant Navy (M. Chafik, ISPM)
* Ministry of Tourism (M. Bekkouche)
* Ministry of Public Health (M. Machraa)
* Ministry of Economic Development (M. Mestassi)
* Ministry of Higher Education (M. Frouji)
* Office Ch6rifien des Phosphates (OCP)
3State Ministry of the Interior (DGCL)
* Ministry of National Education
* fMinistry of Culture
* Ministry of Transportation
* Ministry of Housing
* NGO Doukkala
* Representative of the Province of El Jadida
* LPEE
5
KiNGDOM OF MOROCCOMrNSY OF THE ENviRONMENT
DEPARTmENT OF STUDY, OBSERVATIONAND COORDINATION
JULY23, 1996MEETiNGAGENDA
Subject: REvIEw OF THE EIA OF THEE EXPANSION PROJECT OF THE JORF LASFAR POWERPLANT
Place: MINIsTRY OF TBE ENvIRoNMENTDEPARTMENT OF STUDY, OBSERVATION AND COORDINATION75, Rue Sebou Rabat-Agdal, TeL: 68 0743/46
A meeting is scheduled for Tuesday, July 23, 1996, at 9:00 am. at the Department ofStudy, Observation, and Coordination of this Ministry. The purpose of the meeting is to reviewthe EIA for the expansion project at the Jorf Lasfar power plant. The agenda of this meeting is asfollows:
L Presentation of the Project and the EIA:
* Overall project presentation:Representatives of the ONE, ABB/CMS, or Radian
* Presentation of the Terms of Reference of the impact studyRadian representative
- Presentation of the project EIA:Representatives of Radian , LPEE
* Presentation of the public meeting report:Representatives of Radian.
IL Discussion
Correspondence of the BIA with the Terms of Reference presentedPertinence and reliability of the environmental and project dataEnvironmental impact of the projectRecommended control measuresMonitoring, follow-up, and control plansReport of review
6

a
RADL^NEI NTERNATIONALEM
EIA AddendumAttachment 3
A Brief Description of the EIA Process

I
INTERNATIONALEM
EIA Methodology
Identify the applicable laws and relevant Moroccan govemment organizations
Develop the guidelines of the project
Develop the Terms of Reference
Consult with relevant agencies
Evaluate the project impacts
Identify baseline conditionsS * Identify scientific method to evaluate impacts
Evaluate impacts
Develop corrective action measures
Develop surveillance plan and follow up activities
Consult with public and NGOs
Obtain agreement of relevant govemment organizations and agencies
EIA Addendum August 1, 1996

I I I A
RZADUIN-INTERNATIONALM3
EIA AddendumAttachment 4
A Matrix Summarizing Impacts of the Proposed Project

I
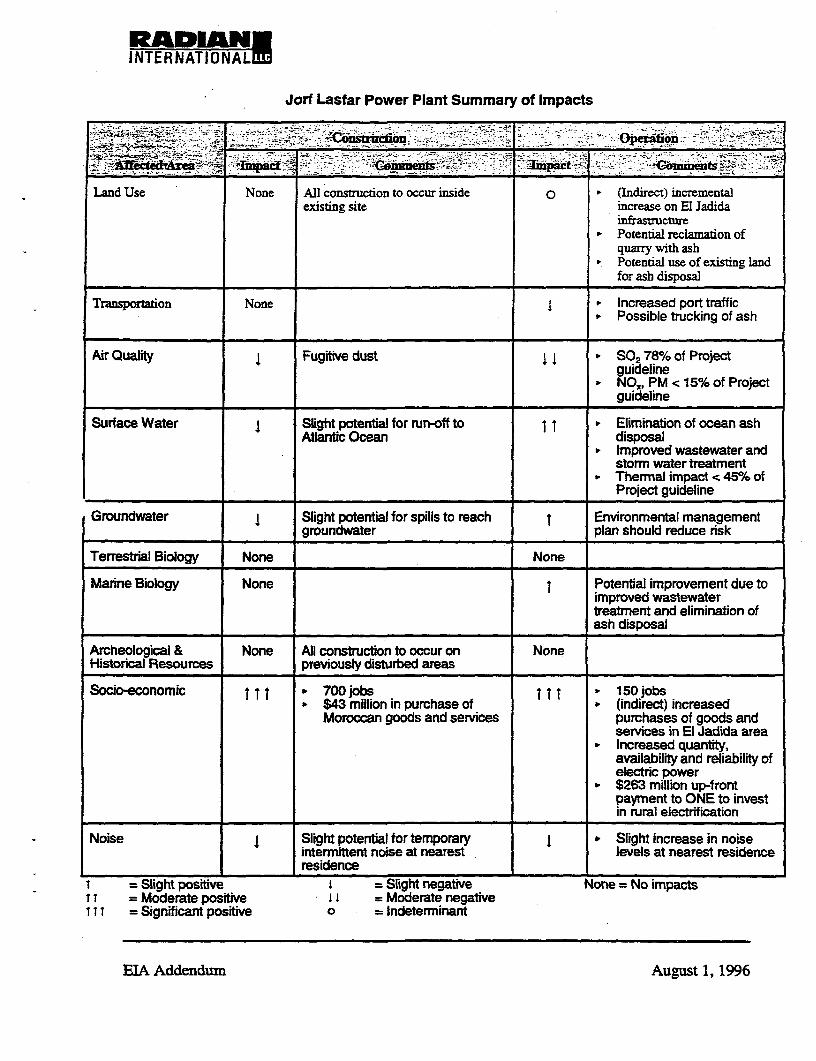
RADIAN-INTERNATIONALM3
Jorf Lasfar Power Plant Summary of Impacts
~~C -~~ ~ ~ _ _ _ _ _ _ _ _ _ _ _ _ _ .- - - .~~~~~~.- ,
Land Use None All construction to occur inside o (Indirect) incrementalexisting site increase on El Jadida
infiastructure* Potential reclamation of
quarry with ashPotential use of existing landfor ash disposa]
Transportation None F Increased port traffic. Possible trucking of ash
Air Quality Fugitive dust SO2 78% of ProjectguidelineNO1, PM < 15% of Project
___________________ _________ _ _____________________________ _________ guidelineSurface Water Slight potential for run-off to . Elimination of ocean ash
Atlantic Ocean disposalImproved wastewater andstorn water treatmentThermnal impact < 45% ofProject guideline
Groundwater Slight potential for spills to reach Environmental managementl________ groundwater plan should reduce risk
Terrestrial Biology None None
Marine Biology None Potential improvement due toimproved wastewatertreatment and elimination ofash disposal
Archeological & None All construction to occur on NoneHistorical Resources previously disturbed areas
Socio-economic t t 700 jobs Tt I 150 jobs$43 million in purchase of * (indirect) increasedMoroccan goods and services purchases of goods and
services in El Jadida areaIncreased quantity,availability and reliability ofelectric power$263 million up-frontpayment to ONE to investin rural electrification
Noise Slight potential for temporary _ Slight increase in noiseintermfttent noise at nearest levels at nearest residenceresidence
= Slight positive I = Slight negative None = No impactst t = Moderate positive I I = Moderate negativeITT = Significant positive o = lndeterminant
EIA Addendum August 1, 1996

I I
RADIAN!INTERNATIONAL
EIA AddendumAttachment 5
Ambient Air Data Collected in 1994 and in March - May 1996

I I I I
RADIAMNINTERNATIONAL
EIA Addendum
Ambient Air Monitoring Data Collected in 1994(Used for Dispersion Modelling in EIA)

I I I I
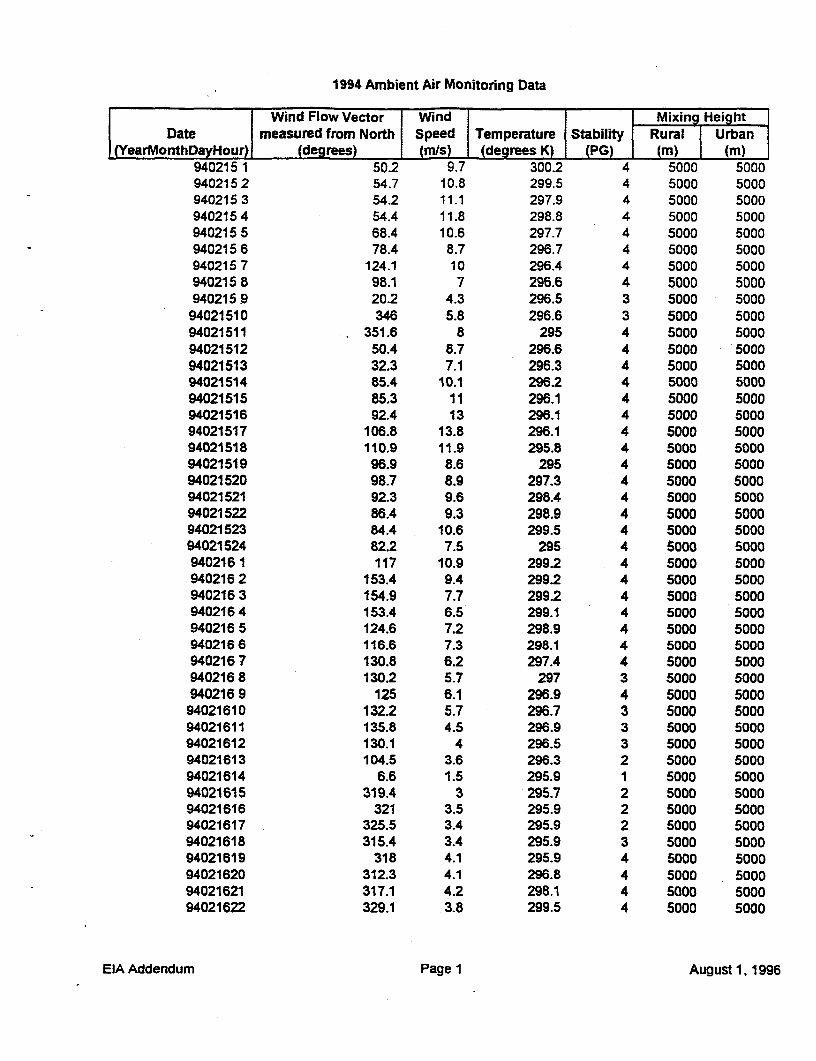
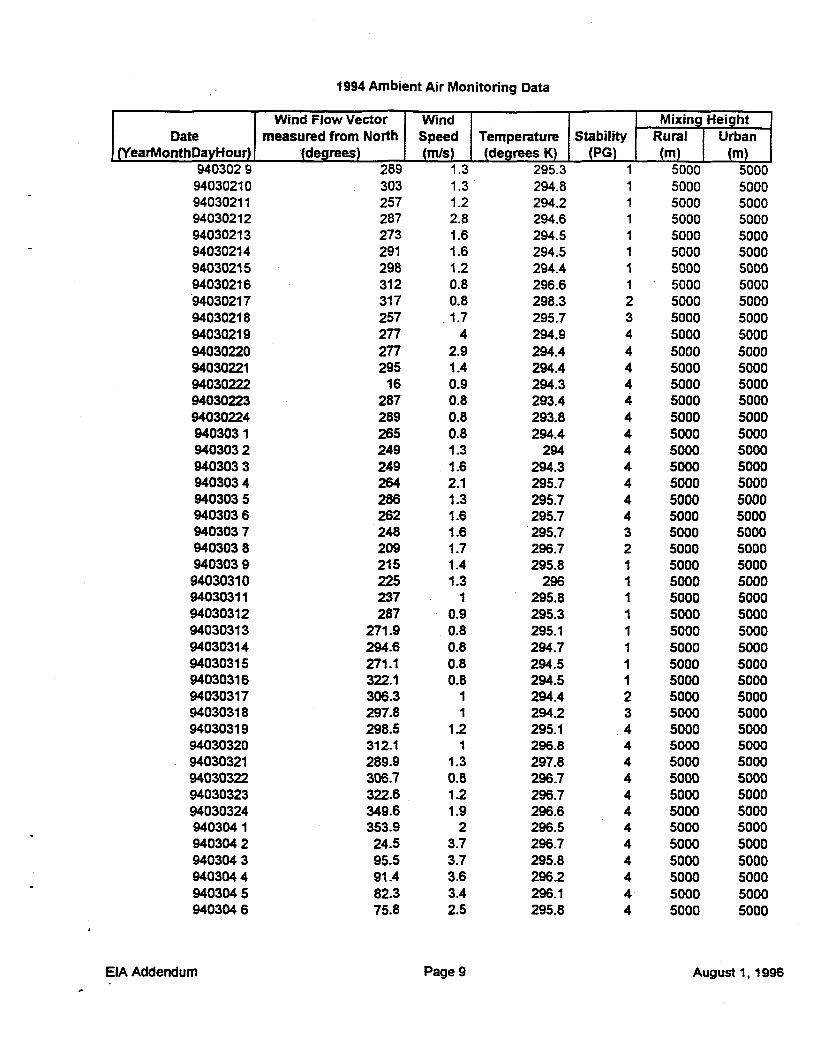
1994 Ambient Air Monitoring Data
Wind Flow Vector Wind Mixing HeightDate measured from North Speed Temperature Stability Rural Urban
(YearMonthDayHour) (degrees) (mis) (degrees K) (PG) (A) (i)940215 1 50.2 9.7 300.2 4 5000 5000940215 2 54.7 10.8 299.5 4 5000 5000940215 3 54.2 11.1 297.9 4 5000 5000940215 4 54.4 11.8 298.8 4 5000 5000940215 5 68.4 10.6 297.7 4 5000 5000940215 6 78.4 8.7 296.7 4 5000 5000940215 7 124.1 10 296.4 4 5000 5000940215 8 98.1 7 296.6 4 5000 5000940215 9 20.2 4.3 296.5 3 5000 500094021510 346 5.8 296.6 3 5000 500094021511 351.6 8 295 4 5000 500094021512 50.4 8.7 296.6 4 5000 500094021513 32.3 7.1 296.3 4 5000 500094021514 85.4 10.1 296.2 4 5000 500094021515 85.3 11 296.1 4 5000 500094021516 92.4 13 296.1 4 5000 500094021517 106.8 13.8 296.1 4 5000 500094021518 110.9 11.9 295.8 4 5000 500094021519 96.9 8.6 295 4 5000 500094021520 98.7 8.9 297.3 4 5000 500094021521 92.3 9.6 298.4 4 5000 500094021522 86.4 9.3 298.9 4 5000 500094021523 84.4 10.6 299.5 4 5000 500094021524 82.2 7.5 295 4 5000 5000940216 1 117 10.9 299.2 4 5000 5000940216 2 153.4 9.4 299.2 4 5000 5000940216 3 154.9 7.7 299.2 4 5000 5000940216 4 153.4 6.5 299.1 4 5000 5000940216 5 124.6 7.2 298.9 4 5000 5000940216 6 116.6 7.3 298.1 4 5000 5000940216 7 130.8 6.2 297.4 4 5000 5000940216 8 130.2 5.7 297 3 5000 5000940216 9 125 6.1 296.9 4 5000 500094021610 132.2 5.7 296.7 3 5000 500094021611 135.8 4.5 296.9 3 5000 500094021612 130.1 4 296.5 3 5000 500094021613 104.5 3.6 296.3 2 5000 500094021614 6.6 1.5 295.9 1 5000 500094021615 319.4 3 295.7 2 5000 500094021616 321 3.5 295.9 2 5000 500094021617 325.5 3.4 295.9 2 5000 500094021618 315.4 3.4 295.9 3 5000 500094021619 318 4.1 295.9 4 5000 500094021620 312.3 4.1 296.8 4 5000 500094021621 317.1 4.2 298.1 4 5000 500094021622 329.1 3.8 299.5 4 5000 5000
EIA Addendum Page 1 August 1, 1996
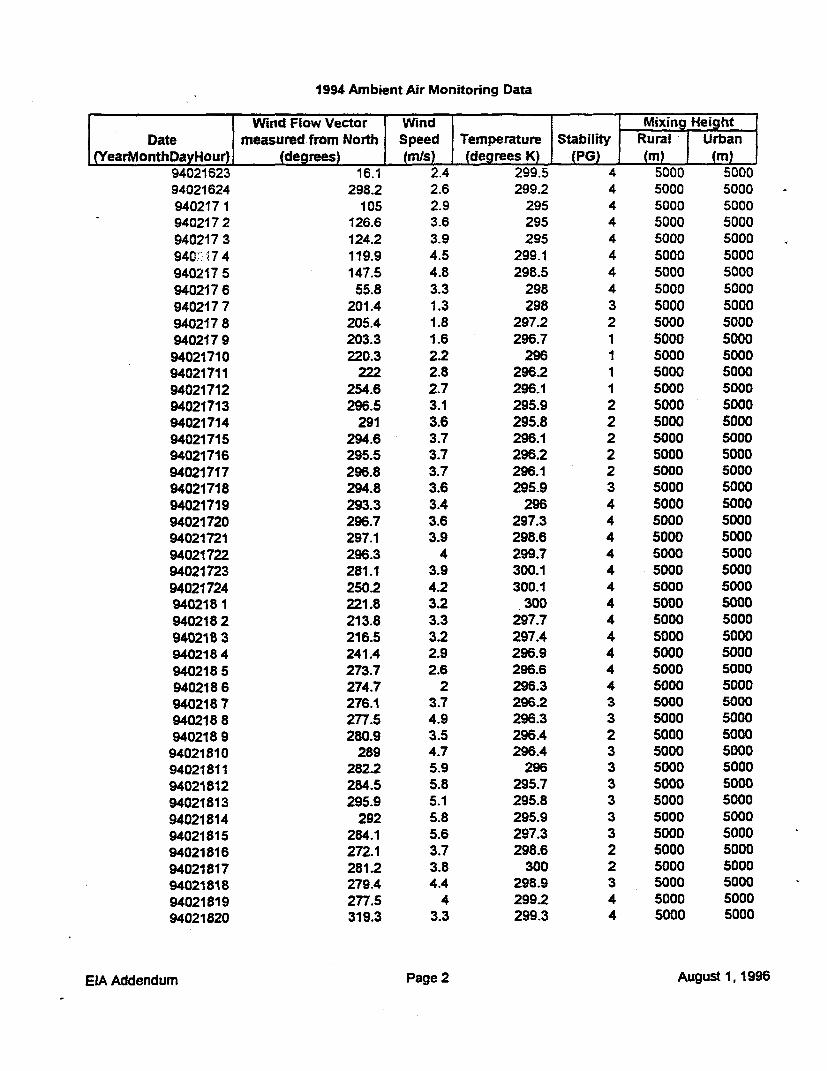
1994 Ambient Air Monitoring Data
Wind Flow Vector Wind Mixing HeightDate measured from North Speed Temperature Stability Rural Urban
(YearMonthDayHour) (degrees) (mis) (degrees K) (PG) (mn) (m)94021623 16.1 2.4 299.5 4 5000 500094021624 298.2 2.6 299.2 4 5000 5000940217 1 105 2.9 295 4 5000 5000940217 2 126.6 3.6 295 4 5000 5000940217 3 124.2 3.9 295 4 5000 5000940'.I7 4 119.9 4.5 299.1 4 5000 5000940217 5 147.5 4.8 298.5 4 5000 5000940217 6 55.8 3.3 298 4 5000 5000940217 7 201.4 1.3 298 3 5000 5000940217 8 205.4 1.8 297.2 2 5000 5000940217 9 203.3 1.6 296.7 1 5000 5000
94021710 220.3 2.2 296 1 5000 500094021711 222 2.8 296.2 1 5000 500094021712 254.6 2.7 296.1 1 5000 500094021713 296.5 3.1 295.9 2 5000 500094021714 291 3.6 295.8 2 5000 500094021715 294.6 3.7 296.1 2 5000 500094021716 295.5 3.7 296.2 2 5000 500094021717 296.8 3.7 296.1 2 5000 500094021718 294.8 3.6 295.9 3 5000 500094021719 293.3 3.4 296 4 5000 500094021720 296.7 3.6 297.3 4 5000 500094021721 297.1 3.9 298.6 4 5000 500094021722 296.3 4 299.7 4 5000 500094021723 281.1 3.9 300.1 4 5000 500094021724 250.2 4.2 300.1 4 5000 5000940218 1 221.8 3.2 .300 4 5000 50009402182 213.8 3.3 297.7 4 5000 5000940218 3 216.5 3.2 297.4 4 5000 5000940218 4 241.4 2.9 296.9 4 5000 5000940218 5 273.7 2.6 296.6 4 5000 5000940218 6 274.7 2 296.3 4 5000 5000940218 7 276.1 3.7 296.2 3 5000 5000940218 8 277.5 4.9 296.3 3 5000 5000940218 9 280.9 3.5 296.4 2 5000 500094021810 289 4.7 296.4 3 5000 500094021811 282.2 5.9 296 3 5000 500094021812 284.5 5.8 295.7 3 5000 500094021813 295.9 5.1 295.8 3 5000 500094021814 292 5.8 295.9 3 5000 500094021815 284.1 5.6 297.3 3 5000 500094021816 272.1 3.7 298.6 2 5000 500094021817 281.2 3.8 300 2 5000 500094021818 279.4 4.4 298.9 3 5000 500094021819 277.5 4 299.2 4 5000 500094021820 319.3 3.3 299.3 4 5000 5000
EIA Addendum Page 2 August 1, 1996
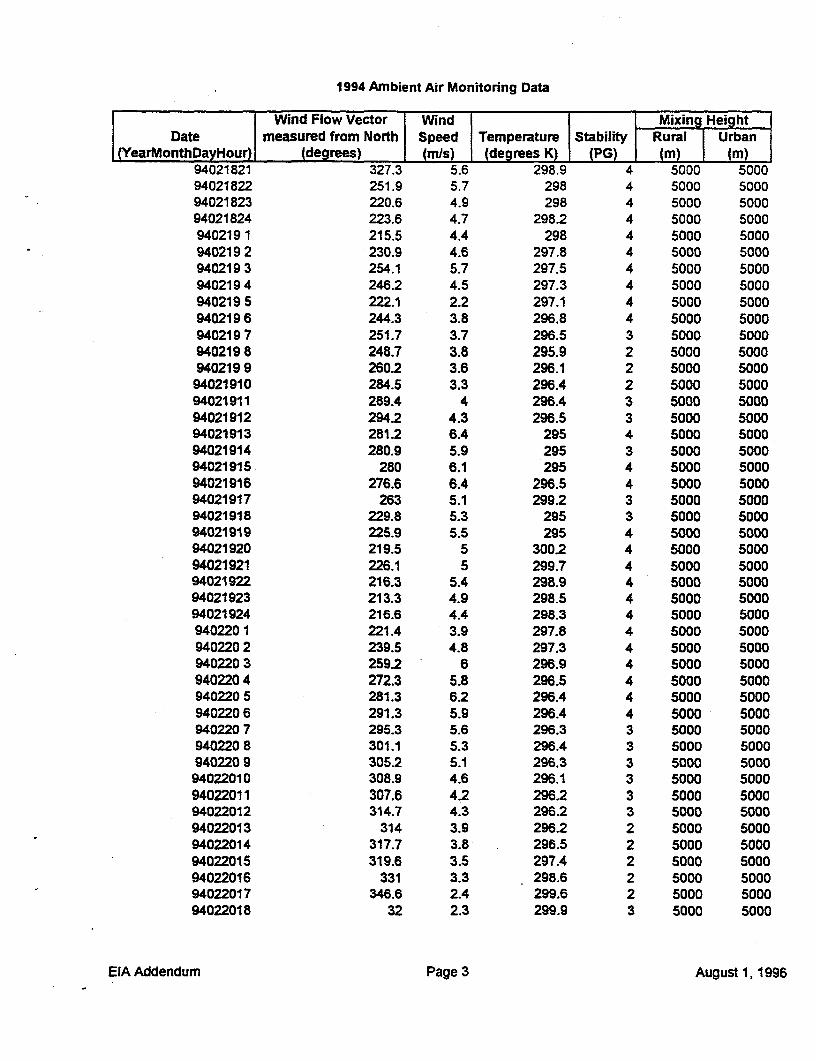
1994 Ambient Air Monitoring Data
Wind Flow Vector Wind Mixing HeightDate measured from North Speed Temperature Stability Rural Urban
(YearMonthDayHour) (degrees) (m/s) (degrees K) (PG) (mi) (m)94021821 327.3 5.6 298.9 4 5000 500094021822 251.9 5.7 298 4 5000 500094021823 220.6 4.9 298 4 5000 500094021824 223.6 4.7 298.2 4 5000 5000940219 1 215.5 4.4 298 4 5000 5000940219 2 230.9 4.6 297.8 4 5000 5000940219 3 254.1 5.7 297.5 4 5000 5000940219 4 246.2 4.5 297.3 4 5000 5000940219 5 222.1 2.2 297.1 4 5000 5000940219 6 244.3 3.8 296.8 4 5000 5000940219 7 251.7 3.7 296.5 3 5000 5000940219 8 248.7 3.8 295.9 2 5000 5000940219 9 260.2 3.6 296.1 2 5000 500094021910 284.5 3.3 296.4 2 5000 500094021911 289.4 4 296.4 3 5000 500094021912 294.2 4.3 296.5 3 5000 500094021913 281.2 6.4 295 4 5000 500094021914 280.9 5.9 295 3 5000 500094021915 280 6.1 295 4 5000 500094021916 276.6 6.4 296.5 4 5000 500094021917 263 5.1 299.2 3 5000 500094021918 229.8 5.3 295 3 5000 500094021919 225.9 5.5 295 4 5000 500094021920 219.5 5 300.2 4 5000 500094021921 226.1 5 299.7 4 5000 500094021922 216.3 5.4 298.9 4 5000 500094021923 213.3 4.9 298.5 4 5000 500094021924 216.6 4.4 298.3 4 5000 5000940220 1 221.4 3.9 297.8 4 5000 5000940220 2 239.5 4.8 297.3 4 5000 5000940220 3 259.2 6 296.9 4 5000 5000940220 4 272.3 5.8 296.5 4 5000 5000940220 5 281.3 6.2 296.4 4 5000 5000940220 6 291.3 5.9 296.4 4 5000 5000940220 7 295.3 5.6 296.3 3 5000 5000940220 8 301.1 5.3 296.4 3 5000 5000940220 9 305.2 5.1 296.3 3 5000 500094022010 308.9 4.6 296.1 3 5000 500094022011 307.6 4.2 296.2 3 5000 500094022012 314.7 4.3 296.2 3 5000 500094022013 314 3.9 296.2 2 5000 500094022014 317.7 3.8 296.5 2 5000 500094022015 319.6 3.5 297.4 2 5000 500094022016 331 3.3 298.6 2 5000 500094022017 346.6 2.4 299.6 2 5000 500094022018 32 2.3 299.9 3 5000 5000
EIA Addendum Page 3 August 1, 1996
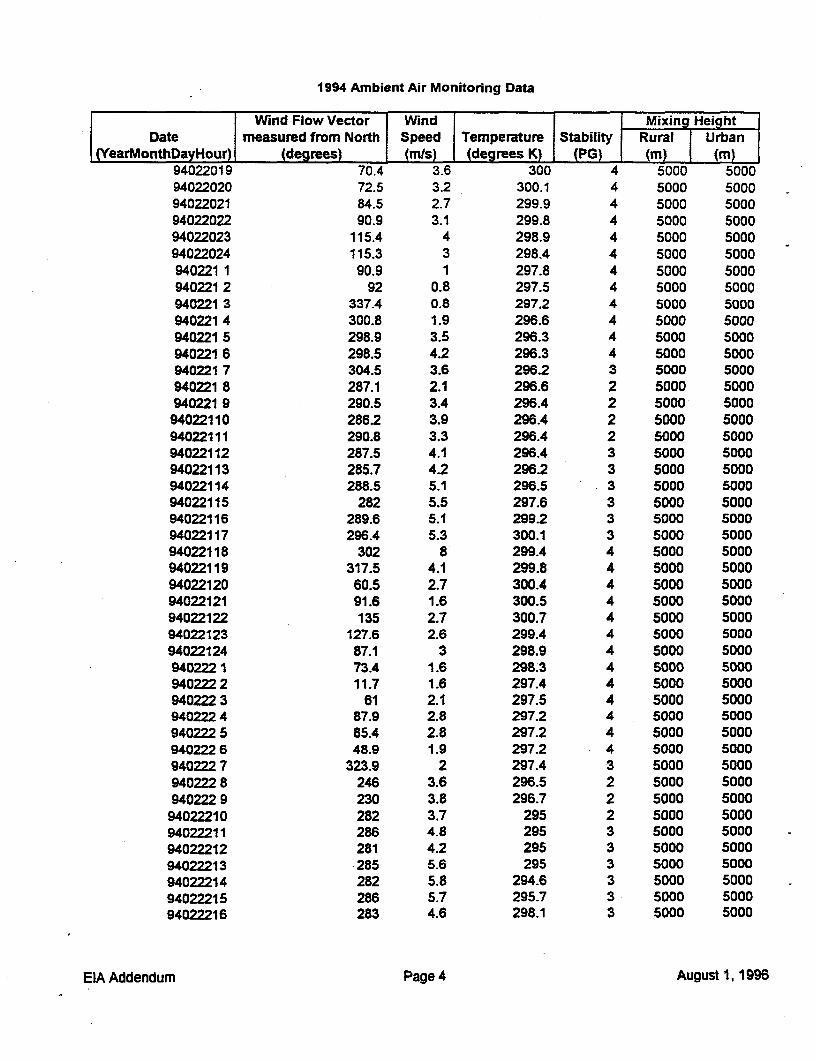
1994 Ambient Air Monitoring Data
Wind Flow Vector Wind Mixing HeightDate measured from North Speed Temperature Stability Rural Urban
(YearMonthDayHour) (degres) (mts) (degrees K) (PG) ( I) (m)94022019 70.4 3.6 300 4 5000 500094022020 72.5 3.2 300.1 4 5000 500094022021 84.5 2.7 299.9 4 5000 500094022022 90.9 3.1 299.8 4 5000 500094022023 115.4 4 298.9 4 5000 500094022024 115.3 3 298.4 4 5000 5000940221 1 90.9 1 297.8 4 5000 5000940221 2 92 0.8 297.5 4 5000 5000940221 3 337.4 0.8 297.2 4 5000 5000940221 4 300.8 1.9 296.6 4 5000 5000940221 5 298.9 3.5 296.3 4 5000 5000940221 6 298.5 4.2 296.3 4 5000 5000940221 7 304.5 3.6 296.2 3 5000 5000940221 8 287.1 2.1 296.6 2 5000 5000940221 9 290.5 3.4 296.4 2 5000 500094022110 286.2 3.9 296.4 2 5000 500094022111 290.8 3.3 296.4 2 5000 500094022112 287.5 4.1 296.4 3 5000 500094022113 285.7 4.2 296.2 3 5000 500094022114 288.5 5.1 296.5 3 5000 500094022115 282 5.5 297.6 3 5000 500094022116 289.6 5.1 299.2 3 5000 500094022117 296.4 5.3 300.1 3 5000 500094022118 302 8 299.4 4 5000 500094022119 317.5 4.1 299.8 4 5000 500094022120 60.5 2.7 300.4 4 5000 500094022121 91.6 1.6 300.5 4 5000 500094022122 135 2.7 300.7 4 5000 500094022123 127.6 2.6 299.4 4 5000 500094022124 87.1 3 298.9 4 5000 50009402221 73A 1.6 298.3 4 5000 5000940222 2 11.7 1.6 297.4 4 5000 5000940222 3 61 2.1 297.5 4 5000 5000940222 4 87.9 2.8 297.2 4 5000 5000940222 5 85.4 2.8 297.2 4 5000 5000940222 6 48.9 1.9 297.2 4 5000 5000940222 7 323.9 2 297A 3 5000 5000940222 8 246 3.6 296.5 2 5000 5000940222 9 230 3.8 296.7 2 5000 5000
94022210 282 3.7 295 2 5000 500094022211 286 4.8 295 3 5000 500094022212 281 4.2 295 3 5000 500094022213 -285 5.6 295 3 5000 500094022214 282 5.8 294.6 3 5000 500094022215 286 5.7 295.7 3 5000 500094022216 283 4.6 298.1 3 5000 5000
ELA Addendum Page 4 August 1, 1996
1994 Ambient Air Monitoring Data
Wind Flow Vector Wind Mixing HeightDate measured from North Speed Temperature Stability Rural Urban
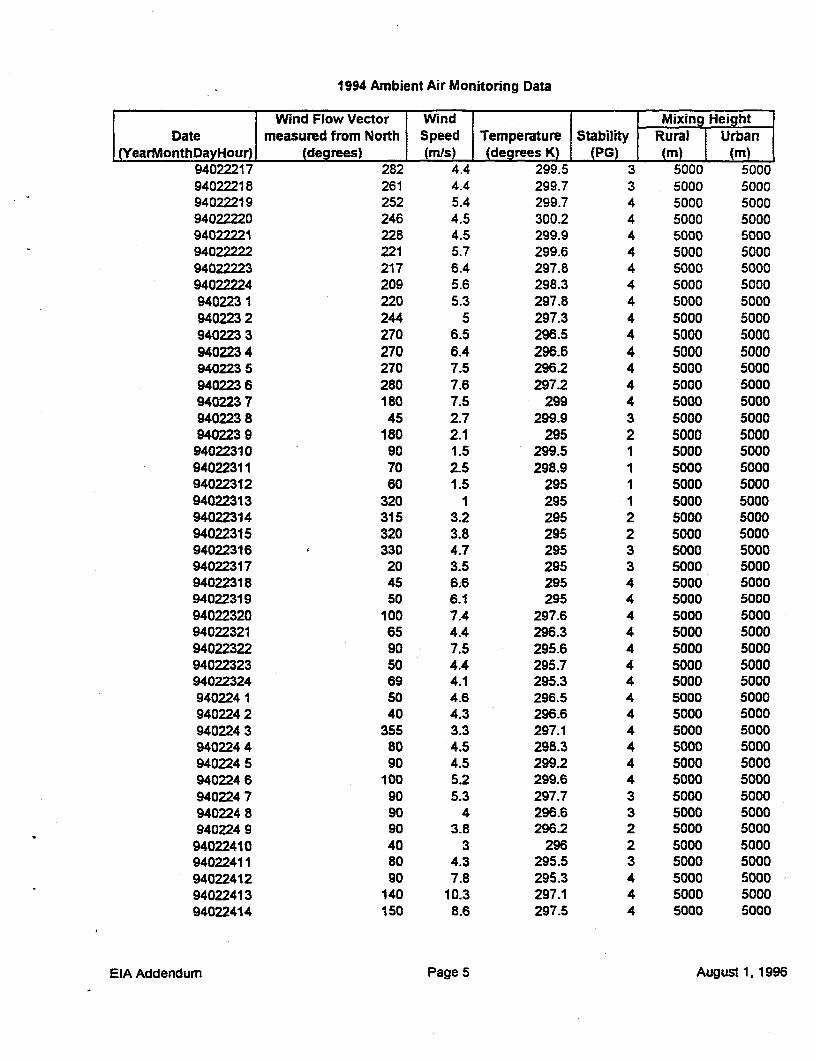
(YearMonthDayHour) (degrees) (mis) (degrees K) (PG) (m) (m})94022217 282 4.4 299.5 3 5000 500094022218 261 4.4 299.7 3 5000 500094022219 252 5.4 299.7 4 5000 500094022220 246 4.5 300.2 4 5000 500094022221 228 4.5 299.9 4 5000 50009402922 221 5.7 299.6 4 5000 500094022223 217 6.4 297.8 4 5000 500094022224 209 5.6 298.3 4 5000 5000940223 1 220 5.3 297.8 4 5000 5000940223 2 244 5 297.3 4 5000 5000940223 3 270 6.5 296.5 4 5000 5000940223 4 270 6.4 296.6 4 5000 5000940223 5 270 7.5 296.2 4 5000 5000940223 6 280 7.6 297.2 4 5000 5000940223 7 180 7.5 299 4 5000 5000940223 8 45 2.7 299.9 3 5000 5000940223 9 180 2.1 295 2 5000 500094022310 90 1.5 299.5 1 5000 500094022311 70 2.5 298.9 1 5000 500094022312 60 1.5 295 1 5000 500094022313 320 1 295 1 5000 500094022314 315 3.2 295 2 5000 500094022315 320 3.8 295 2 5000 500094022316 330 4.7 295 3 5000 500094022317 20 3.5 295 3 5000 500094022318 45 6;6 295 4 5000 500094022319 50 6.1 295 4 5000 500094022320 100 7.4 297.6 4 5000 500094022321 65 4.4 296.3 4 5000 500094022322 90 7.5 295.6 4 5000 500094022323 50 4.4 295.7 4 5000 500094022324 69 4.1 295.3 4 5000 5000940224 1 50 4.6 296.5 4 5000 5000940224 2 40 4.3 296.6 4 5000 5000940224 3 355 3.3 297.1 4 5000 5000940224 4 80 4.5 298.3 4 5000 5000940224 5 90 4.5 299.2 4 5000 5000940224 6 100 5.2 299.6 4 5000 5000940224 7 90 5.3 297.7 3 5000 5000940224 8 90 4 296.6 3 5000 5000940224 9 90 3.8 296.2 2 5000 500094022410 40 3 296 2 5000 500094022411 80 4.3 295.5 3 5000 500094022412 90 7.8 295.3 4 5000 500094022413 140 10.3 297.1 4 5000 500094022414 150 8.6 297.5 4 5000 5000
EIA Addendum Page 5 August 1, 1996
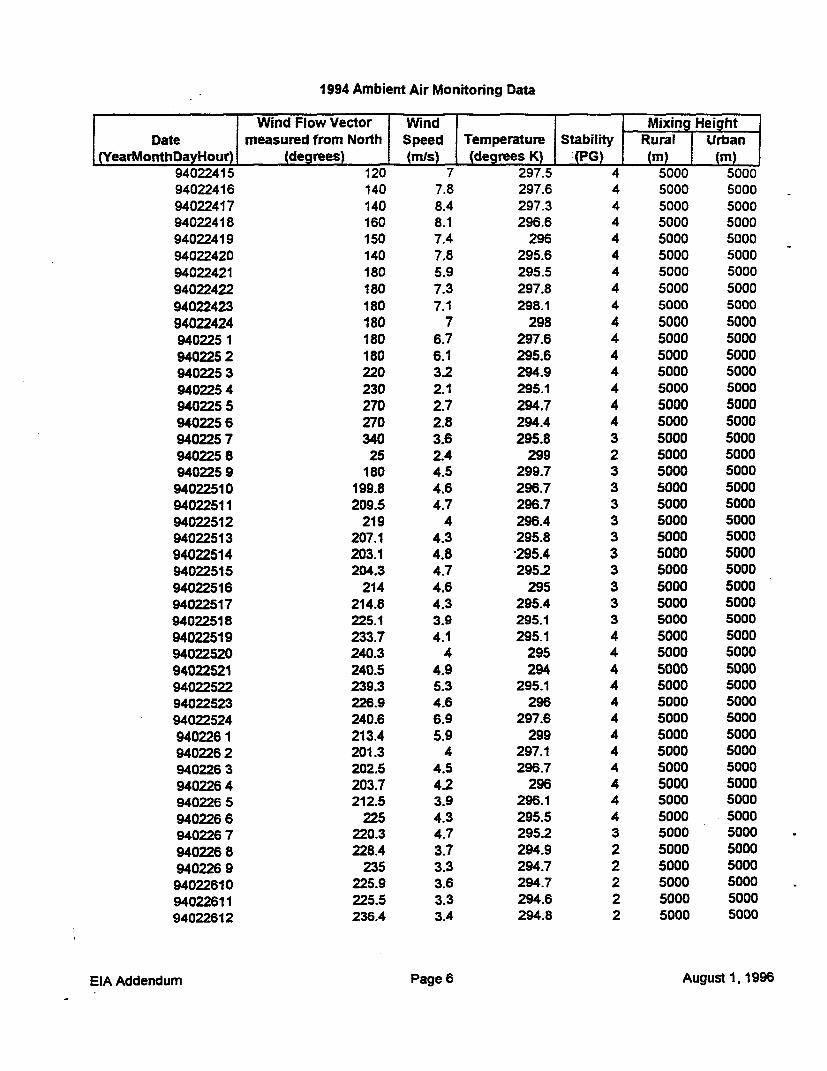
1994 Ambient Air Monitoring Data
Wind Flow Vector Wind Mixin HeightDate measured from North Speed Temperature Stability Rural Urban
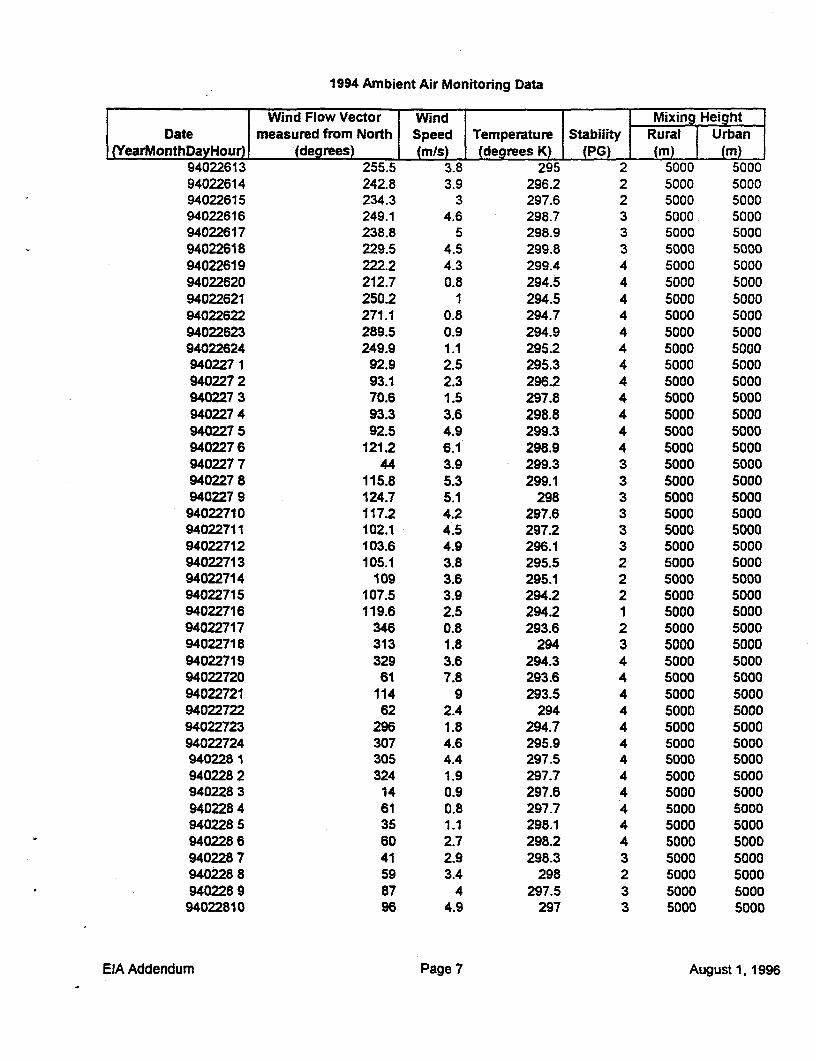
(YearMonthDayHour) (degrees) (mIs) (degrees K) :(PG) (mi) (m)94022415 120 7 297.5 4 5000 500094022416 140 7.8 297.6 4 5000 500094022417 140 8.4 297.3 4 5000 500094022418 160 8.1 296.6 4 5000 500094022419 150 7.4 296 4 5000 500094022420 140 7.8 295.6 4 5000 500094022421 180 5.9 295.5 4 5000 500094022422 180 7.3 297.8 4 5000 500094022423 180 7.1 298.1 4 5000 500094022424 180 7 298 4 5000 5000940225 1 180 6.7 297.6 4 5000 5000940225 2 180 6.1 295.6 4 5000 5000940225 3 220 3.2 294.9 4 5000 5000940225 4 230 2.1 295.1 4 5000 5000940225 5 270 2.7 294.7 4 5000 5000940225 6 270 2.8 294.4 4 5000 5000940225 7 340 3.6 295.8 3 5000 5000940225 8 25 2.4 299 2 5000 5000940225 9 180 4.5 299.7 3 5000 500094022510 199.8 4.6 296.7 3 5000 500094022511 209.5 4.7 296.7 3 5000 500094022512 219 4 296.4 3 5000 500094022513 207.1 4.3 295.8 3 5000 500094022514 203.1 4.8 295.4 3 5000 500094022515 204.3 4.7 295.2 3 5000 500094022516 214 4.6 295 3 5000 500094022517 214.8 4.3 295.4 3 5000 500094022518 225.1 3.9 295.1 3 5000 500094022519 233.7 4.1 295.1 4 5000 500094022520 240.3 4 295 4 5000 500094022521 240.5 4.9 294 4 5000 500094022522 239.3 5.3 295.1 4 5000 500094022523 226.9 4.6 296 4 5000 500094022524 240.6 6.9 297.6 4 5000 5000940226 1 213.4 5.9 299 4 5000 5000940226 2 201.3 4 297.1 4 5000 5000940226 3 202.5 4.5 296.7 4 5000 5000940226 4 203.7 4.2 296 4 5000 5000940226 5 212.5 3.9 296.1 4 5000 5000940226 6 225 4.3 295.5 4 5000 5000940226 7 220.3 4.7 295.2 3 5000 5000940226 8 228.4 3.7 294.9 2 5000 5000940226 9 235 3.3 294.7 2 5000 500094022610 225.9 3.6 294.7 2 5000 500094022611 225.5 3.3 294.6 2 5000 500094022612 236.4 3.4 294.8 2 5000 5000
EIA Addendum Page 6 August 1, 1996
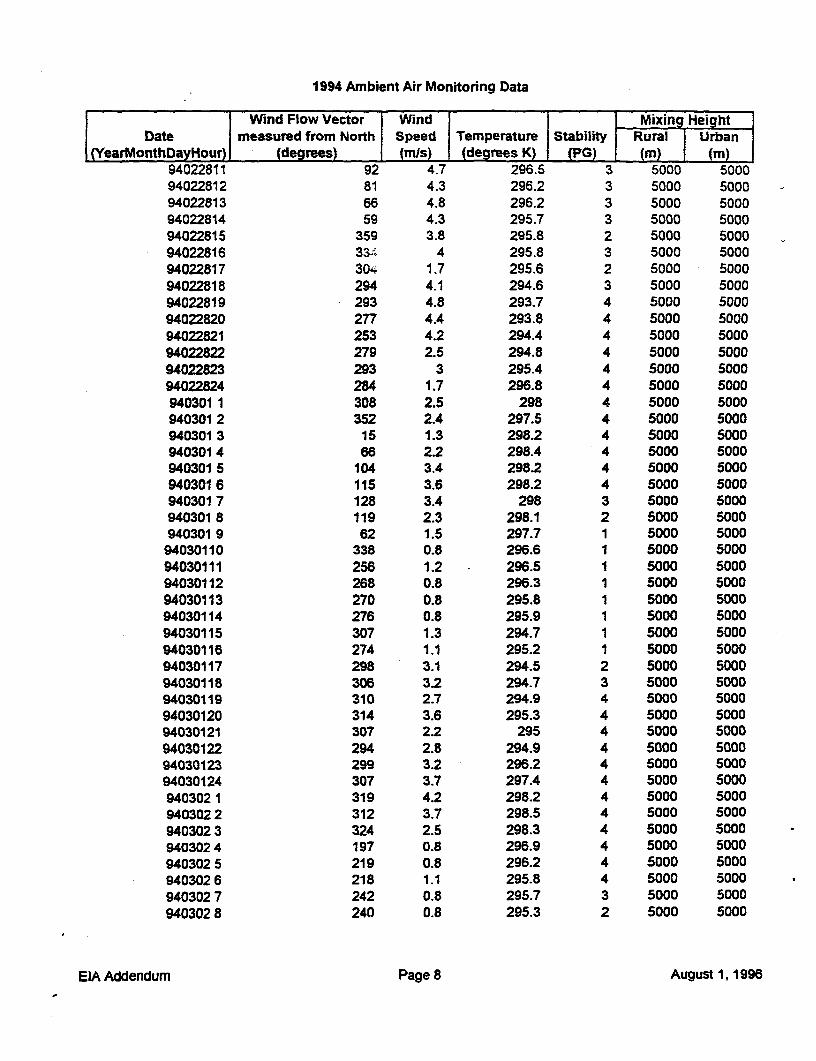
1994 Ambient Air Monitoring Data
Wind Flow Vector Wind Mixing HeightDate measured from North Speed Temperature Stability Rural Urban
(YearMonthDayHour) (degrees) (mIs) (degrees K) (PG) (m) (m)94022613 255.5 3.8 295 2 5000 500094022614 242.8 3.9 296.2 2 5000 500094022615 234.3 3 297.6 2 5000 500094022616 249.1 4.6 298.7 3 5000 500094022617 238.8 5 298.9 3 5000 500094022618 229.5 4.5 299.8 3 5000 500094022619 222.2 4.3 299.4 4 5000 500094022620 212.7 0.8 294.5 4 5000 500094022621 250.2 1 294.5 4 5000 500094022622 271.1 0.8 294.7 4 5000 500094022623 289.5 0.9 294.9 4 5000 500094022624 249.9 1.1 295.2 4 5000 50009402271 92.9 2.5 295.3 4 5000 5000940227 2 93.1 2.3 296.2 4 5000 5000940227 3 70.6 1.5 297.8 4 5000 5000940227 4 93.3 3.6 298.8 4 5000 5000940227 5 92.5 4.9 299.3 4 5000 5000940227 6 121.2 6.1 298.9 4 5000 5000940227 7 44 3.9 299.3 3 5000 5000940227 8 115.8 5.3 299.1 3 5000 5000940227 9 124.7 5.1 298 3 5000 500094022710 117.2 4.2 297.6 3 5000 500094022711 102.1 4.5 297.2 3 5000 500094022712 103.6 4.9 296.1 3 5000 500094022713 105.1 3.8 295.5 2 5000 500094022714 109 3.6 295.1 2 5000 500094022715 107.5 3.9 294.2 2 5000 500094022716 119.6 2.5 294.2 1 5000 500094022717 346 0.8 293.6 2 5000 500094022718 313 1.8 294 3 5000 500094022719 329 3.6 294.3 4 5000 500094022720 61 7.8 293.6 4 5000 500094022721 114 9 293.5 4 5000 500094022722 62 2.4 294 4 5000 500094022723 296 1.8 294.7 4 5000 500094022724 307 4.6 295.9 4 5000 50009402281 305 4.4 297.5 4 5000 5000940228 2 324 1.9 297.7 4 5000 5000940228 3 14 0.9 297.6 4 5000 5000940228 4 61 0.8 297.7 4 5000 5000940228 5 35 1.1 298.1 4 5000 5000940228 6 60 2.7 298.2 4 5000 5000940228 7 41 2.9 298.3 3 5000 5000940228 8 59 3.4 298 2 5000 5000940228 9 87 4 297.5 3 5000 500094022810 96 4.9 297 3 5000 5000
EIA Addendum Page 7 August 1, 1996
1994 Ambient Air Monitoring Data
Wind Flow Vector Wind Mixing HeightDate measured from North Speed Temperature Stability Rural Urban
(YearMonthDayHour) (degrees) (m/s) (degrees K) (PG) (m} (inm)94022811 92 4.7 296.5 3 5000 500094022812 81 4.3 296.2 3 5000 500094022813 66 4.8 296.2 3 5000 500094022814 59 4.3 295.7 3 5000 500094022815 359 3.8 295.8 2 5000 500094022816 33: 4 295.8 3 5000 500094022817 304 1.7 295.6 2 5000 500094022818 294 4.1 294.6 3 5000 500094022819 293 4.8 293.7 4 5000 500094022820 277 4.4 293.8 4 5000 500094022821 253 4.2 294.4 4 5000 500094022822 279 2.5 294.8 4 5000 500094022823 293 3 295.4 4 5000 500094022824 284 1.7 296.8 4 5000 5000940301 1 308 2.5 298 4 5000 5000940301 2 352 2.4 297.5 4 5000 5000940301 3 15 1.3 298.2 4 5000 5000940301 4 66 2.2 298.4 4 5000 5000940301 5 104 3.4 298.2 4 5000 5000940301 6 115 3.6 2982 4 5000 5000940301 7 128 3.4 298 3 5000 5000940301 8 119 2.3 298.1 2 5000 5000940301 9 62 1.5 297.7 1 5000 500094030110 338 0.8 296.6 1 5000 500094030111 256 1.2 296.5 1 5000 500094030112 268 0.8 296.3 1 5000 500094030113 270 0.8 295.8 1 5000 500094030114 27B 0.8 295.9 1 5000 500094030115 307 1.3 294.7 1 5000 500094030116 274 1.1 295.2 1 5000 500094030117 298 3.1 294.5 2 5000 500094030118 306 3.2 294.7 3 5000 500094030119 310 2.7 294.9 4 5000 500094030120 314 3.6 295.3 4 5000 500094030121 307 2.2 295 4 5000 500094030122 294 2.8 294.9 4 5000 500094030123 299 3.2 296.2 4 5000 500094030124 307 3.7 297.4 4 5000 5000940302 1 319 4.2 298.2 4 5000 5000940302 2 312 3.7 298.5 4 5000 5000940302 3 324 2.5 298.3 4 5000 5000940302 4 197 0.8 296.9 4 5000 5000940302 5 219 0.8 296.2 4 5000 5000940302 6 218 1.1 295.8 4 5000 5000940302 7 242 0.8 295.7 3 5000 5000940302 8 240 0.8 295.3 2 5000 5000
EIA Addendum Page 8 August 1,1996
1994 Ambient Air Monitoring Data
Wind Flow Vector Wind Mixing HeightDate measured from North Speed Temperature Stability Rural Urban
(YearMonthDayHour) (degrees) (mis) (degrees K) (PG) (m) (m)940302 9 289 1.3 295.3 1 5000 500094030210 303 1.3 294.8 1 5000 500094030211 257 1.2 294.2 1 5000 500094030212 287 2.8 294.6 1 5000 500094030213 273 1.6 294.5 1 5000 500094030214 291 1.6 294.5 1 5000 500094030215 298 1.2 294.4 1 5000 500094030216 312 0.8 296.6 1 5000 500094030217 317 0.8 298.3 2 5000 500094030218 257 1.7 295.7 3 5000 500094030219 277 4 294.9 4 5000 500094030220 277 2.9 294.4 4 5000 500094030221 295 1.4 294.4 4 5000 500094030222 16 0.9 294.3 4 5000 500094030223 287 0.8 293.4 4 5000 500094030224 289 0.8 293.8 4 5000 50009403031 265 0.8 294.4 4 5000 5000940303 2 249 1.3 294 4 5000 5000940303 3 249 1.6 294.3 4 5000 5000940303 4 264 2.1 295.7 4 5000 5000940303 5 286 1.3 295.7 4 5000 50009403036 262 1.6 295.7 4 5000 5000940303 7 248 1.6 295.7 3 5000 5000940303 8 209 1.7 296.7 2 5000 5000940303 9 215 1.4 295.8 1 5000 500094030310 225 1.3 296 1 5000 500094030311 237 1 295.8 1 5000 500094030312 287 0.9 295.3 1 5000 500094030313 271.9 0.8 295.1 1 5000 500094030314 294.6 0.8 294.7 1 5000 500094030315 271.1 0.8 294.5 1 5000 500094030316 322.1 0.8 294.5 1 5000 500094030317 306.3 1 294.4 2 5000 500094030318 297.8 1 294.2 3 5000 500094030319 298.5 1.2 295.1 4 5000 500094030320 312.1 1 296.8 4 5000 500094030321 289.9 1.3 297.8 4 5000 500094030322 306.7 0.8 296.7 4 5000 500094030323 322.6 1.2 296.7 4 5000 500094030324 349.6 1.9 296.6 4 5000 5000940304 1 353.9 2 296.5 4 5000 5000940304 2 24.5 3.7 296.7 4 5000 5000940304 3 95.5 3.7 295.8 4 5000 5000940304 4 91.4 3.6 296.2 4 5000 5000940304 5 82.3 3.4 296.1 4 5000 5000940304 6 75.8 2.5 295.8 4 5000 5000
EIA Addendum Page 9 August 1, 1996
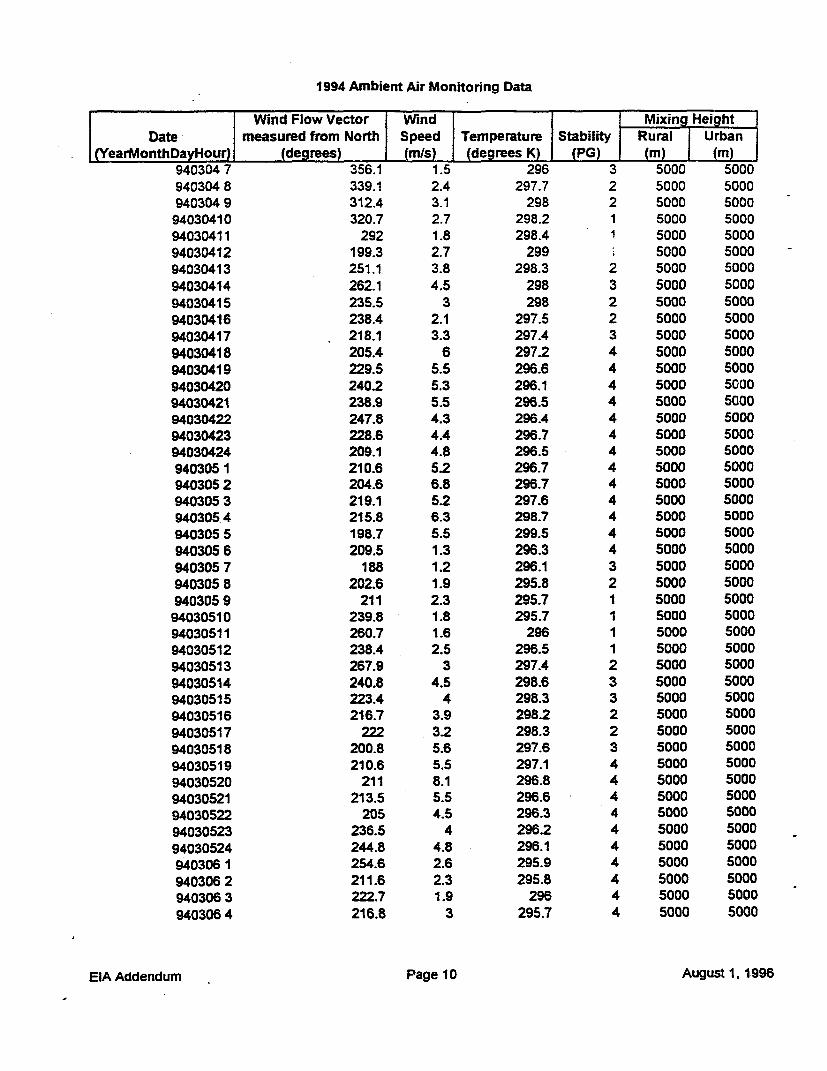
1994 Ambient Air Monitoring Data
Wind Flow Vector Wind Mixing HeightDate measured from North Speed Temperature Stability Rural Urban
(YearMonthDayHour) (degrees) (mis) (degrees K) (PG) (m) (m)940304 7 356.1 1.5 296 3 5000 5000940304 8 339.1 2.4 297.7 2 5000 5000940304 9 312.4 3.1 298 2 5000 5000
94030410 320.7 2.7 298.2 1 5000 500094030411 292 1.8 298.4 1 5000 500094030412 199.3 2.7 299 5000 500094030413 251.1 3.8 298.3 2 5000 500094030414 262.1 4.5 298 3 5000 500094030415 235.5 3 298 2 5000 500094030416 238.4 2.1 297.5 2 5000 500094030417 218.1 3.3 297.4 3 5000 500094030418 205.4 6 297.2 4 5000 500094030419 229.5 5.5 296.6 4 5000 500094030420 240.2 5.3 296.1 4 5000 500094030421 238.9 5.5 296.5 4 5000 500094030422 247.8 4.3 296.4 4 5000 500094030423 228.6 4.4 296.7 4 5000 500094030424 209.1 4.8 296.5 4 5000 5000940305 1 210.6 5.2 296.7 4 5000 5000940305 2 204.6 6.8 296.7 4 5000 5000940305 3 219.1 5.2 297.6 4 5000 5000940305 4 215.8 6.3 298.7 4 5000 5000940305 5 198.7 5.5 299.5 4 5000 5000940305 6 209.5 1.3 296.3 4 5000 5000940305 7 188 1.2 296.1 3 5000 5000940305 8 202.6 1.9 295.8 2 5000 5000940305 9 211 2.3 295.7 1 5000 5000
94030510 239.8 1.8 295.7 1 5000 500094030511 260.7 1.6 296 1 5000 500094030512 238.4 2.5 296.5 1 5000 500094030513 267.9 3 297.4 2 5000 500094030514 240.8 4.5 298.6 3 5000 500094030515 223.4 4 298.3 3 5000 500094030516 216.7 3.9 298.2 2 5000 500094030517 222 3.2 298.3 2 5000 500094030518 200.8 5.6 297.6 3 5000 500094030519 210.6 5.5 297.1 4 5000 500094030520 211 8.1 296.8 4 5000 500094030521 213.5 5.5 296.6 4 5000 500094030522 205 4.5 296.3 4 5000 500094030523 236.5 4 296.2 4 5000 500094030524 244.8 4.8 296.1 4 5000 50009403061 254.6 2.6 295.9 4 5000 5000940306 2 211.6 2.3 295.8 4 5000 5000940306 3 222.7 1.9 296 4 5000 5000940306 4 216.8 3 295.7 4 5000 5000
EIA Addendum Page 10 August 1, 1996
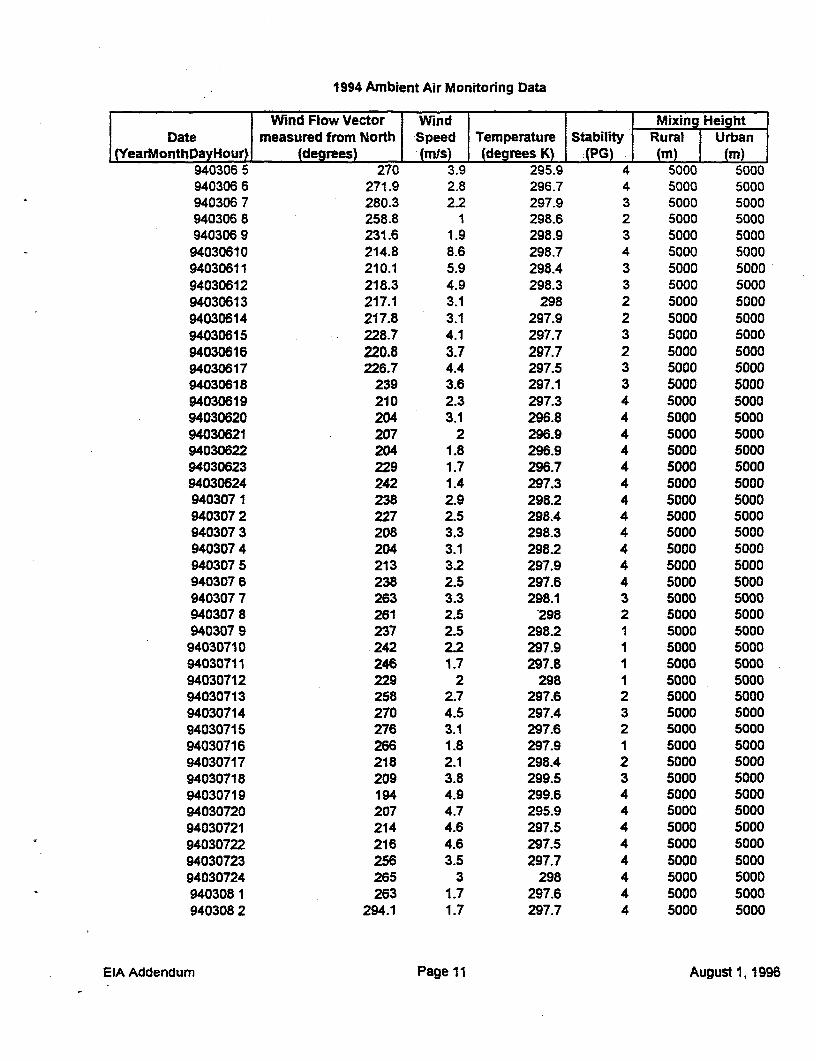
1994 Ambient Air Monitoring Data
Wind Flow Vector Wind Mixing HeightDate measured from North Speed Temperature Stability Rural Urban
(YearMonthDayHour) (degrees) meis) (degrees K) -(PG) (m) (m)940306 5 270 3.9 295.9 4 5000 5000940306 6 271.9 2.8 296.7 4 5000 5000940306 7 280.3 2.2 297.9 3 5000 5000940306 8 258.8 1 298.6 2 5000 5000940306 9 231.6 1.9 298.9 3 5000 5000
94030610 214.8 8.6 298.7 4 5000 500094030611 210.1 5.9 298.4 3 5000 500094030612 218.3 4.9 298.3 3 5000 500094030613 217.1 3.1 298 2 5000 500094030614 217.8 3.1 297.9 2 5000 500094030615 228.7 4.1 297.7 3 5000 500094030616 220.8 3.7 297.7 2 5000 500094030617 226.7 4.4 297.5 3 5000 500094030618 239 3.6 297.1 3 5000 500094030619 210 2.3 297.3 4 5000 500094030620 204 3.1 296.8 4 5000 500094030621 207 2 296.9 4 5000 500094030622 204 1.8 296.9 4 5000 500094030623 229 1.7 296.7 4 5000 500094030624 242 1.4 297.3 4 5000 50009403071 238 2.9 298.2 4 5000 5000940307 2 227 2.5 298.4 4 5000 5000940307 3 208 3.3 298.3 4 5000 5000940307 4 204 3.1 298.2 4 5000 5000940307 5 213 3.2 297.9 4 5000 5000940307 6 238 2.5 297.6 4 5000 5000940307 7 263 3.3 298.1 3 5000 5000940307 8 261 2.5 298 2 5000 5000940307 9 237 2.5 298.2 1 5000 500094030710 242 2.2 297.9 1 5000 500094030711 246 1.7 297.8 1 5000 500094030712 229 2 298 1 5000 500094030713 258 2.7 297.6 2 5000 500094030714 270 4.5 297.4 3 5000 500094030715 276 3.1 297.6 2 5000 500094030716 266 1.8 297.9 1 5000 500094030717 218 2.1 298.4 2 5000 500094030718 209 3.8 299.5 3 5000 500094030719 194 4.9 299.6 4 5000 500094030720 207 4.7 295.9 4 5000 500094030721 214 4.6 297.5 4 5000 500094030722 216 4.6 297.5 4 5000 500094030723 256 3.5 297.7 4 5000 500094030724 265 3 298 4 5000 5000940308 1 263 1.7 297.6 4 5000 5000940308 2 294.1 1.7 297.7 4 5000 5000
EIA Addendum Page 11 August 1, 1996
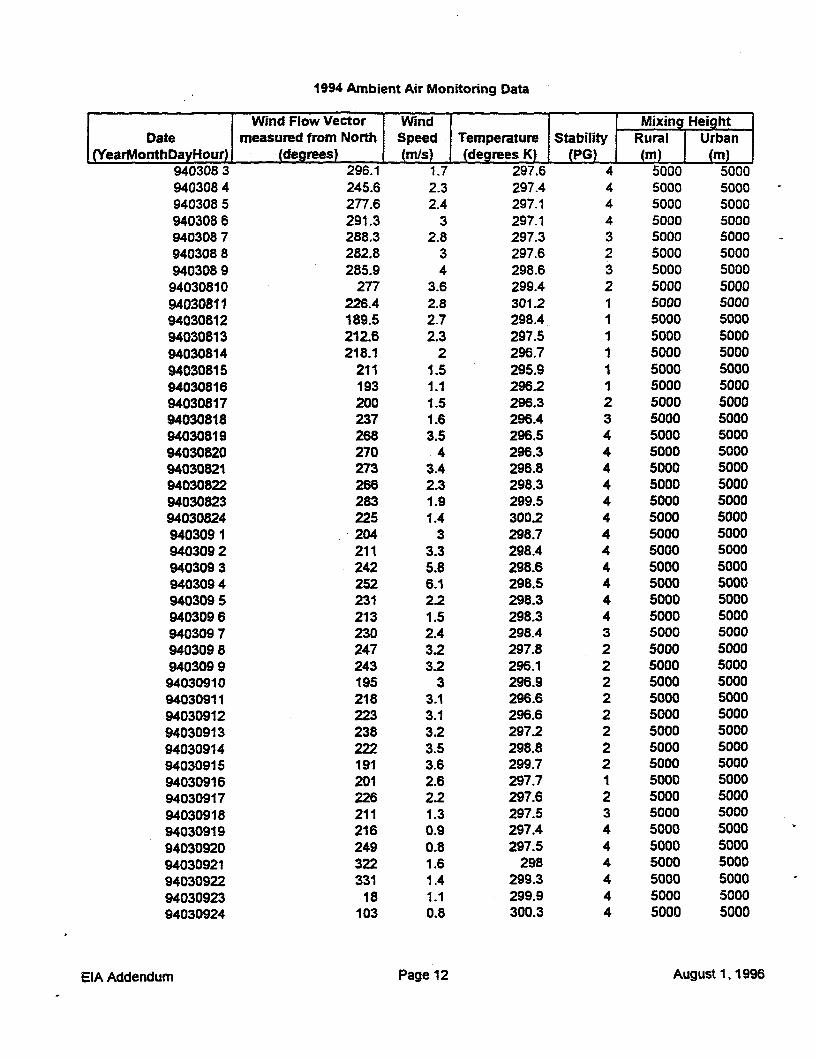
1994 Ambient Air Monitoring Data
Wind Flow Vector Wind Mixing HeightDate measured from North Speed Temperature Stability Rural Urban
(YearMonthDayHour) (degrees) (m/s) (degrees K) (PG) (m) (m)940308 3 296.1 1.7 297.6 4 5000 5000940308 4 245.6 2.3 297.4 4 5000 5000940308 5 277.6 2.4 297.1 4 5000 5000940308 6 291.3 3 297.1 4 5000 5000940308 7 288.3 2.8 297.3 3 5000 5000940308 8 282.8 3 297.6 2 5000 5000940308 9 285.9 4 298.6 3 5000 500094030810 277 3.6 299.4 2 5000 500094030811 226.4 2.8 301.2 1 5000 500094030812 189.5 2.7 298.4 1 5000 500094030813 212.6 2.3 297.5 1 5000 500094030814 218.1 2 296.7 1 5000 500094030815 211 1.5 295.9 1 5000 500094030816 193 1.1 296.2 1 5000 500094030817 200 1.5 296.3 2 5000 500094030818 237 1.6 296A 3 5000 500094030819 268 3.5 296.5 4 5000 500094030820 270 4 296.3 4 5000 500094030821 273 3.4 296.8 4 5000 500094030822 266 2.3 298.3 4 5000 500094030823 283 1.9 299.5 4 5000 500094030824 225 1.4 300.2 4 5000 5000940309 1 204 3 298.7 4 5000 5000940309 2 211 3.3 298A 4 5000 5000940309 3 242 5.8 298.6 4 5000 5000940309 4 252 6.1 298.5 4 5000 5000940309 5 231 2.2 298.3 4 5000 5000940309 6 213 1.5 298.3 4 5000 5000940309 7 230 2.4 298.4 3 5000 5000940309 8 247 3.2 297.8 2 5000 5000940309 9 243 3.2 296.1 2 5000 500094030910 195 3 296.9 2 5000 500094030911 218 3.1 296.6 2 5000 500094030912 223 3.1 296.6 2 5000 500094030913 238 3.2 297.2 2 5000 500094030914 222 3.5 298.8 2 5000 500094030915 191 3.6 299.7 2 5000 500094030916 201 2.6 297.7 1 5000 500094030917 226 2.2 297.6 2 5000 500094030918 211 1.3 297.5 3 5000 500094030919 216 0.9 297.4 4 5000 500094030920 249 0.8 297.5 4 5000 500094030921 322 1.6 298 4 5000 500094030922 331 1.4 299.3 4 5000 500094030923 18 1.1 299.9 4 5000 500094030924 103 0.8 300.3 4 5000 5000
EIA Addendum Page 12 August 1, 1996
1994 Ambient Air Monitoring Data
Wind Flow Vector Wind Mixing HeightDate measured from North Speed Temperature Stability Rural Urban
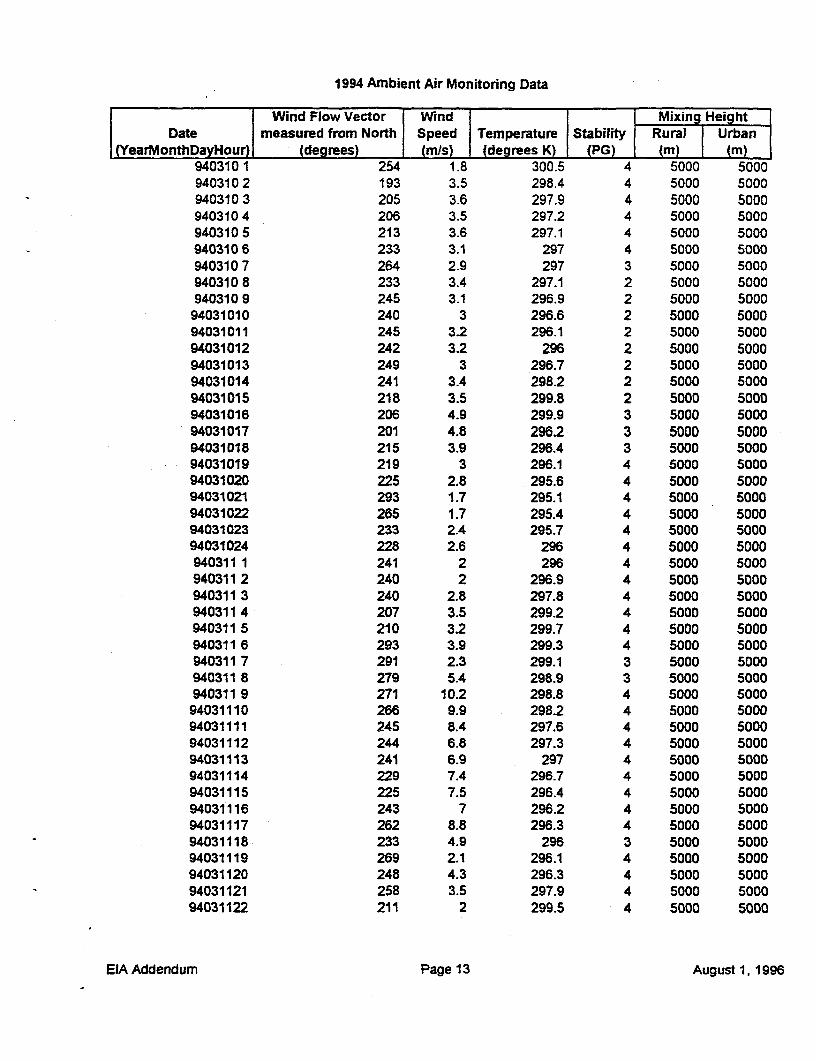
(YearMonthDayHour) (degrees) (MIs) (degrees K) (PG) ({m) (Im)940310 1 254 1.8 300.5 4 5000 5000940310 2 193 3.5 298.4 4 5000 5000940310 3 205 3.6 297.9 4 5000 5000940310 4 206 3.5 297.2 4 5000 5000940310 5 213 3.6 297.1 4 5000 5000940310 6 233 3.1 297 4 5000 5000940310 7 264 2.9 297 3 5000 5000940310 8 233 3.4 297.1 2 5000 5000940310 9 245 3.1 296.9 2 5000 500094031010 240 3 296.6 2 5000 500094031011 245 3.2 296.1 2 5000 500094031012 242 3.2 296 2 5000 500094031013 249 3 296.7 2 5000 500094031014 241 3.4 298.2 2 5000 500094031015 218 3.5 299.8 2 5000 500094031016 206 4.9 299.9 3 5000 500094031017 201 4.8 296.2 3 5000 500094031018 215 3.9 296.4 3 5000 500094031019 219 3 296.1 4 5000 500094031020 225 2.8 295.6 4 5000 500094031021 293 1.7 295.1 4 5000 500094031022 265 1.7 295.4 4 5000 500094031023 233 2.4 295.7 4 5000 500094031024 228 2.6 296 4 5000 5000940311 1 241 2 296 4 5000 5000940311 2 240 2 296.9 4 5000 5000940311 3 240 2.8 297.8 4 5000 5000940311 4 207 3.5 299.2 4 5000 5000940311 5 210 3.2 299.7 4 5000 5000940311 6 293 3.9 299.3 4 5000 5000940311 7 291 2.3 299.1 3 5000 5000940311 8 279 5.4 298.9 3 5000 5000940311 9 271 10.2 298.8 4 5000 500094031110 266 9.9 298.2 4 5000 500094031111 245 8.4 297.6 4 5000 500094031112 244 6.8 297.3 4 5000 500094031113 241 6.9 297 4 5000 500094031114 229 7.4 296.7 4 5000 500094031115 225 7.5 296.4 4 5000 500094031116 243 7 296.2 4 5000 500094031117 262 8.8 296.3 4 5000 500094031118 233 4.9 296 3 5000 500094031119 269 2.1 296.1 4 5000 500094031120 248 4.3 296.3 4 5000 500094031121 258 3.5 297.9 4 5000 500094031122 211 2 299.5 4 5000 5000
ElA Addendum Page 13 August 1, 1996
1994 Ambient Air Monitoring Data
Wind Flow Vector Wind Mixing HeightDate measured from North Speed Temperture Stability Rural Urban
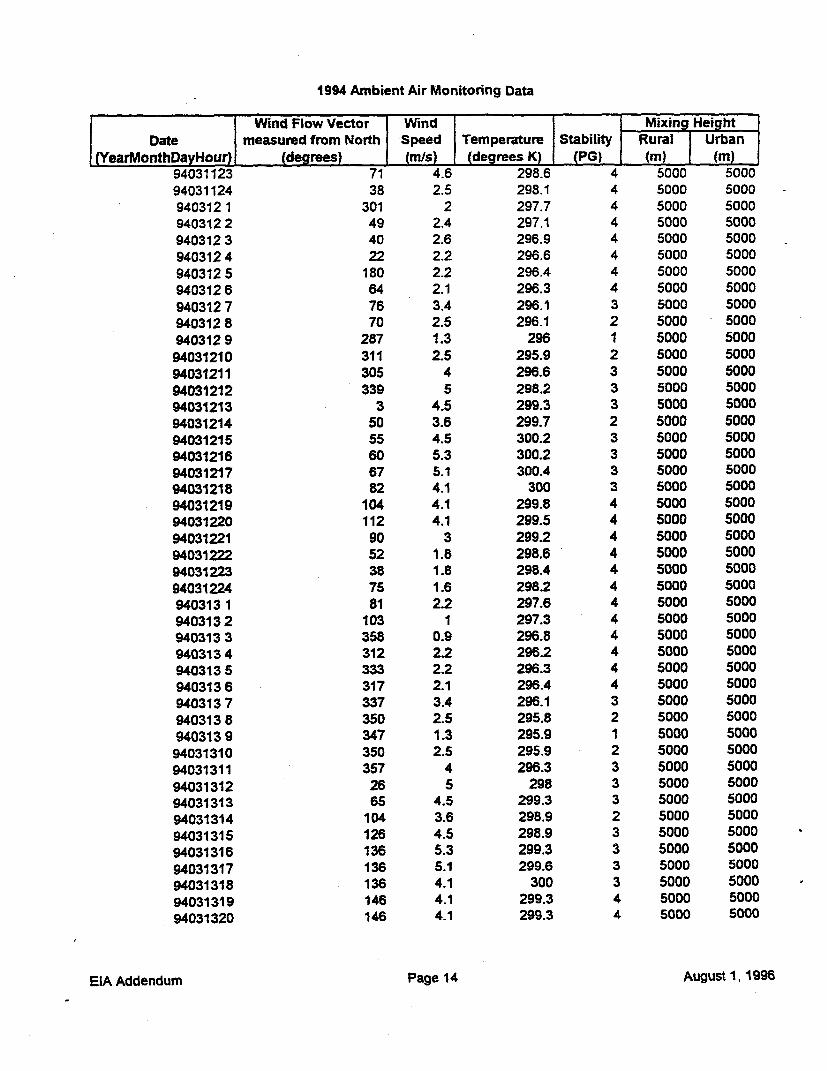
(YearMonthDayHour) (degrees) (mis) (degrees K) (PG) (m) I (m)94031123 71 4.6 298.6 4 5000 500094031124 38 2.5 298.1 4 5000 5000940312 1 301 2 297.7 4 5000 5000940312 2 49 2.4 297.1 4 5000 5000940312 3 40 2.6 296.9 4 5000 5000940312 4 22 2.2 296.6 4 5000 5000940312 5 180 2.2 296.4 4 5000 5000940312 6 64 2.1 296.3 4 5000 5000940312 7 76 3.4 296.1 3 5000 5000940312 8 70 2.5 296.1 2 5000 5000940312 9 287 1.3 296 1 5000 500094031210 311 2.5 295.9 2 5000 500094031211 305 4 296.6 3 5000 500094031212 339 5 298.2 3 5000 500094031213 3 4.5 299.3 3 5000 500094031214 50 3.6 299.7 2 5000 500094031215 55 4.5 300.2 3 5000 500094031216 60 5.3 300.2 3 5000 500094031217 67 5.1 300.4 3 5000 500094031218 82 4.1 300 3 5000 500094031219 104 4.1 299.8 4 5000 500094031220 112 4.1 299.5 4 5000 500094031221 90 3 299.2 4 5000 500094031222 52 1.8 298.6 4 5000 500094031223 38 1.8 298.4 4 5000 500094031224 75 1.6 298.2 4 5000 5000940313 1 81 2.2 297.6 4 5000 5000940313 2 103 1 297.3 4 5000 5000940313 3 358 0.9 296.8 4 5000 5000940313 4 312 2.2 296.2 4 5000 5000940313 5 333 2.2 296.3 4 5000 5000940313 6 317 2.1 296.4 4 5000 5000940313 7 337 3.4 296.1 3 5000 5000940313 8 350 2.5 295.8 2 5000 5000940313 9 347 1.3 295.9 1 5000 500094031310 350 2.5 295.9 2 5000 500094031311 357 4 296.3 3 5000 500094031312 26 5 298 3 5000 500094031313 65 4.5 299.3 3 5000 500094031314 104 3.6 298.9 2 5000 500094031315 126 4.5 298.9 3 5000 500094031316 136 5.3 299.3 3 5000 500094031317 136 5.1 299.6 3 5000 500094031318 136 4.1 300 3 5000 500094031319 146 4.1 299.3 4 5000 500094031320 146 4.1 299.3 4 5000 5000
EIA Addendum Page 14 August 1,1996
1994 Ambient Air Monitoring Data
Wind Flow Vector Wind Mixin HeightDate measured from North Speed Temperature Stability Rural Urban
(YearMonthDayHour) (degrees) (mWs) (degrees K) (PG) (ml) (m)94031321 146 3 298.9 4 5000 500094031322 148 1.8 298.4 4 5000 500094031323 241.7 1.5 297.2 4 5000 500094031324 248.4 1.6 298.2 4 5000 5000940314 1 268.2 1.5 299.4 4 5000 5000940314 2 196.6 2.3 297.6 4 5000 5000940314 3 213.1 2.5 297.4 4 5000 5000940314 4 257.8 2.2 297.3 4 5000 5000940314 5 281.8 2.3 297.2 4 5000 5000940314 6 282.8 3 297.4 4 5000 5000940314 7 278.9 2.8 297.4 3 5000 5000940314 8 292.9 3.4 297.3 2 5000 5000940314 9 296.9 3.9 297.1 2 5000 5000
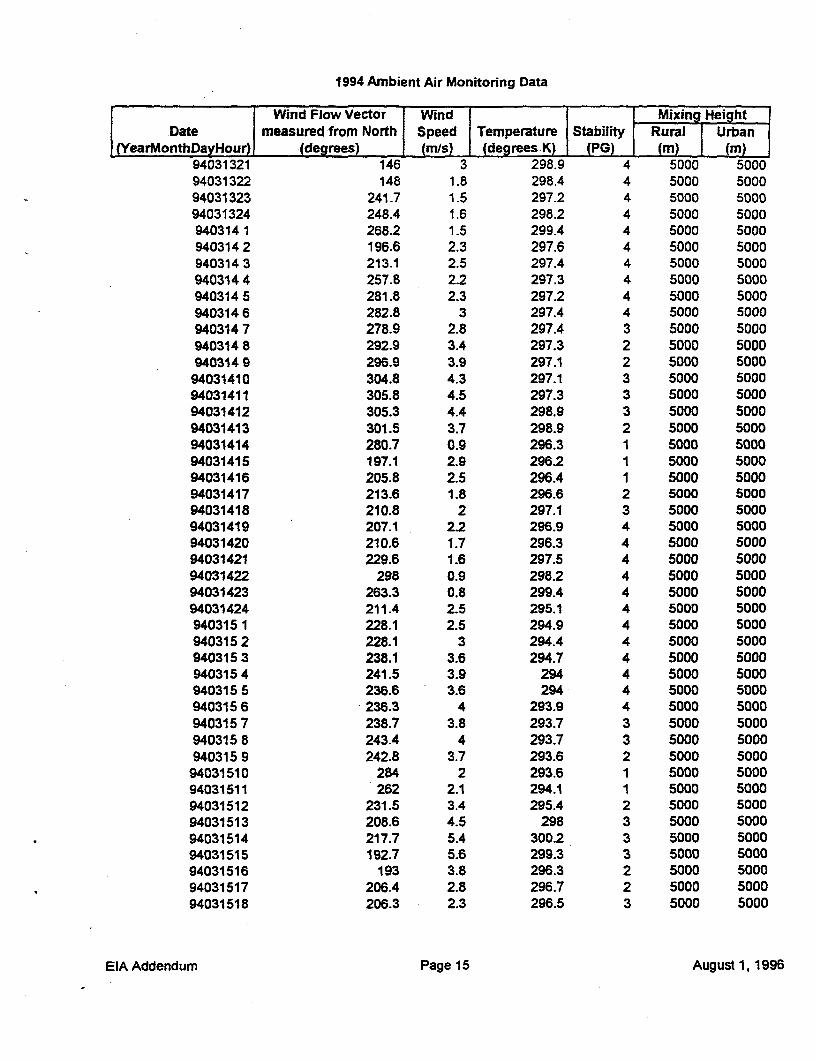
94031410 304.8 4.3 297.1 3 5000 500094031411 305.8 4.5 297.3 3 5000 500094031412 305.3 4.4 298.9 3 5000 500094031413 301.5 3.7 298.9 2 5000 500094031414 280.7 0.9 296.3 1 5000 500094031415 197.1 2.9 296.2 1 5000 500094031416 205.8 2.5 296.4 1 5000 500094031417 213.6 1.8 296.6 2 5000 500094031418 210.8 2 297.1 3 5000 500094031419 207.1 2.2 296.9 4 5000 500094031420 210.6 1.7 296.3 4 5000 500094031421 229.6 1.6 297.5 4 5000 500094031422 298 0.9 298.2 4 5000 500094031423 263.3 0.8 299.4 4 5000 500094031424 211.4 2.5 295.1 4 5000 5000940315 1 228.1 2.5 294.9 4 5000 5000940315 2 228.1 3 294.4 4 5000 5000940315 3 238.1 3.6 294.7 4 5000 5000940315 4 241.5 3.9 294 4 5000 5000940315 5 236.6 3.6 294 4 5000 50009403156 236.3 4 293.9 4 5000 5000940315 7 238.7 3.8 293.7 3 5000 5000940315 8 243.4 4 293.7 3 5000 5000940315 9 242.8 3.7 293.6 2 5000 500094031510 284 2 293.6 1 5000 500094031511 262 2.1 294.1 1 5000 500094031512 231.5 3.4 295.4 2 5000 500094031513 208.6 4.5 298 3 5000 500094031514 217.7 5.4 300.2 3 5000 500094031515 192.7 5.6 299.3 3 5000 500094031516 193 3.8 296.3 2 5000 500094031517 206.4 2.8 296.7 2 5000 500094031518 206.3 2.3 296.5 3 5000 5000
EIA Addendum Page 15 August 1, 1996
1994 Ambient Air Monitoring Data
Wind Flow Vector Wind Mixing HeightDate measured from North Speed Temperature Stability Rural Urban
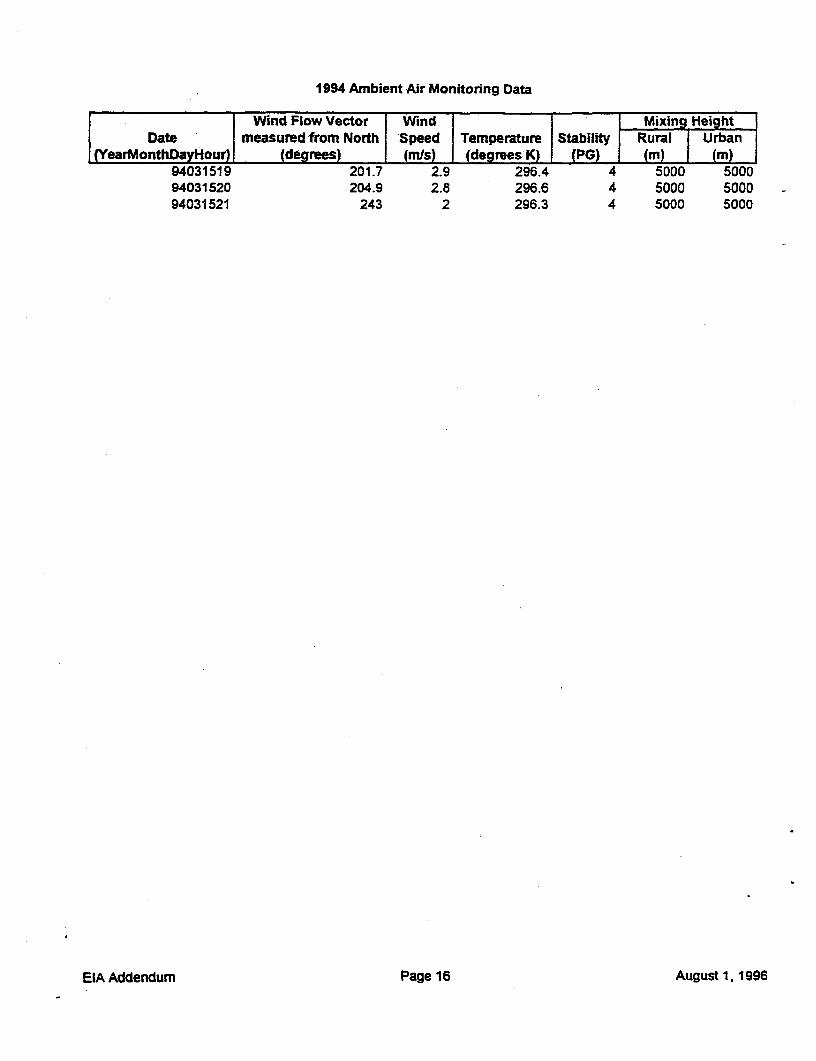
(YearMonthDayHour) (degres) (m1s) (degrees K) (PG) (m) (m)94031519 201.7 2.9 296.4 4 5000 500094031520 204.9 2.8 296.6 4 5000 500094031521 243 2 296.3 4 5000 5000
EIA Addendum Page 16 August 1, 1996
CONCENTRATION des PARTICULES RESPIRAELES en FONCTION de In DIRECTION du VENT du 09.05 au 13.05.1996
400-
350
300-
250
I 200
150
100
* *
50 F *" Ul .U *_ S
0 90 180 270 360NORD EST SUD OUEST NORD
DIRECTION
pps
28103/19961:I 0 0ZOO0
201996 129100-I
30M0I1996 02:00
3010311996 09:00
30103(1996 16:00
30/0311996 23:00
31/03119960600
31/0311996 13:00
311/1996 20.00
01/04/1996 03.00
011W4199610.00
010411996 1700 O0
00421996 00:00 0
0210W11996 07:00 m
02W1996 14.00
02l1099621:00 L
0304111996 04.00
0304/19961100 I O
n 03/04/996 18:00
04W4199601.00
04X10499608.00 0
0410W119961500
0410W41996 22:00
0510411996 2:00
OSfW1996 19.001
060W1996 02:0 0
0611996 09:C00
06dW1996 16:00
06M10996 2300
0714S 99806800
071W01996 1300
07X0411996 2000
0804/1996 03:00
0o41s96 10:00
0&"l W96 17:00 )
CONCENTRATION du 802 en FONCTION de la DIRECTION du VENTdu 29.03 au 08.04.1998
250 -
.
200
150
3m]"S02mcoIL
100
50
-6 * U
0 - AwsL 9 m *mu u-n0 45 90 135 180 225 270 315 360
NORD EST SUD OUEST NORD
DIRECTION
CONCENTRATION des POLLUANTS en FONCTION du TEMPS
40
30
2 02
20 -2
10
8 8. 8 8 88 8 a 8 8 8 8S8 88 8 8 8 88. 8 88Ea88 8 8 8 8
TEMPS
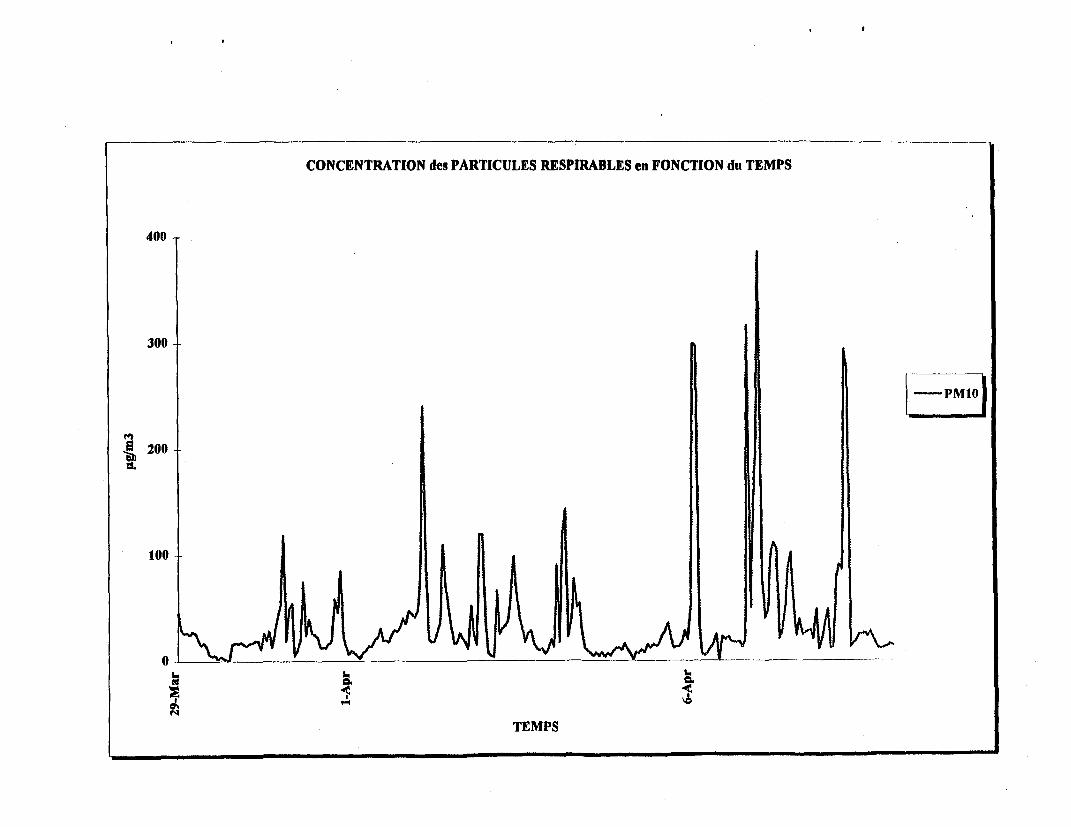
CONCENTRATION des PARTICULES RESPIRABLES en FONCTION du TEMPS
400
300
200
100
0-
TEMPS
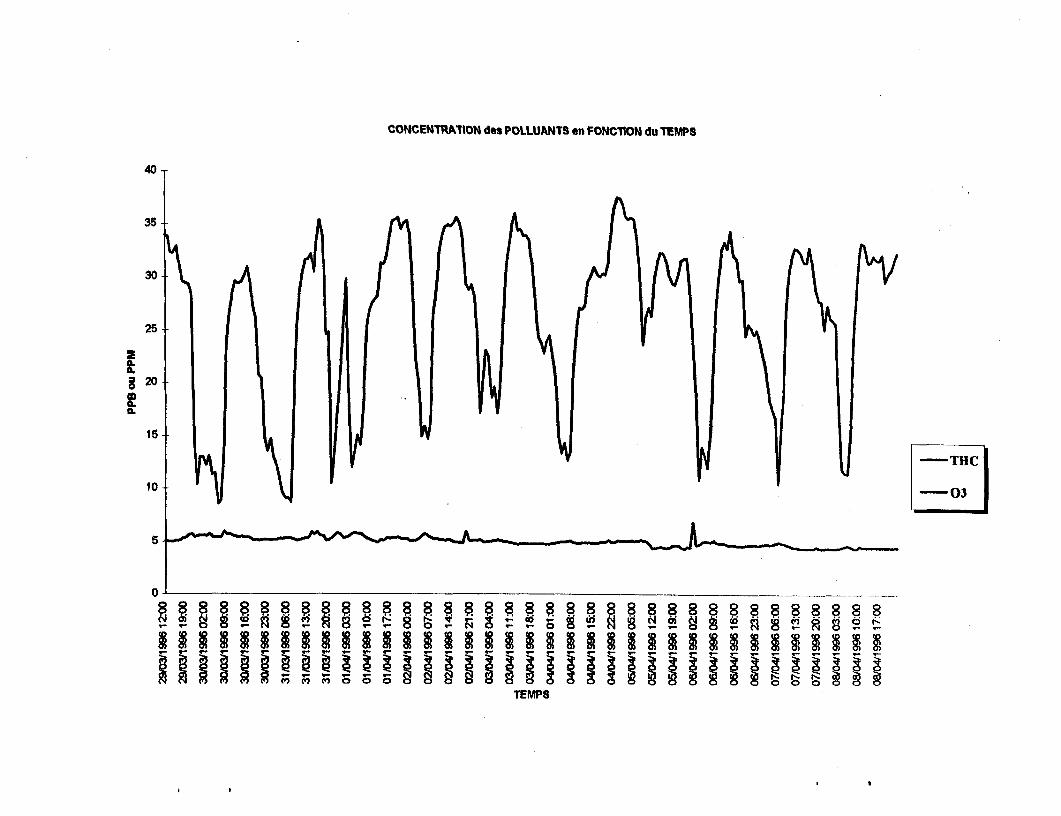
CONCENTRAtION des POLLUANTS en FONCIION du TEMPS
40T
35
30
25
S20
10 0
5
0 ~ ~ ~ 0
TEMPS
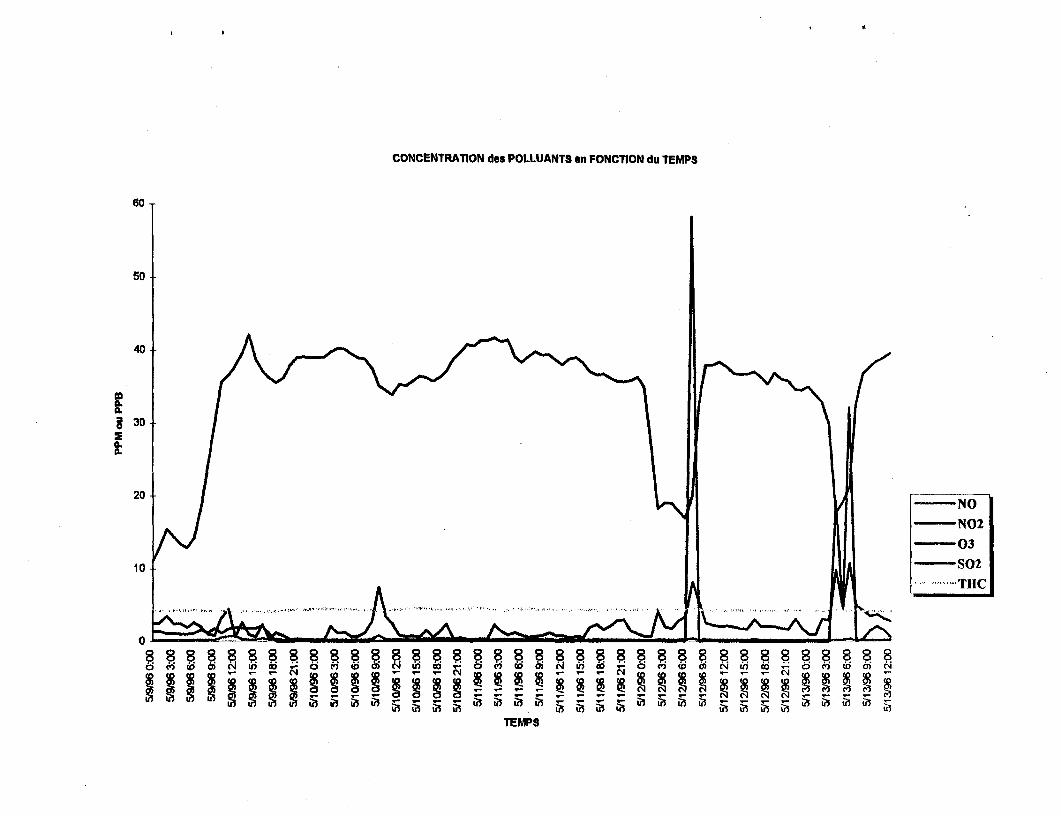
CONCENTRATION des POLLUANTS en FONCTION du TEMPS
60
so
40
30
a-
20 ~N
~NO2
-03
10 S02
8 8 8 88888 888888 8b ((( J 0 N . 0 _~ O r O' Nn 00 _ O N- e 0 o e' an _r Oo
TEMPS

RADIAN-I NTERN ATION ALM
EIA Addendum
Ambient Air Monitoring Data Collected in March-May 1996

I e I k
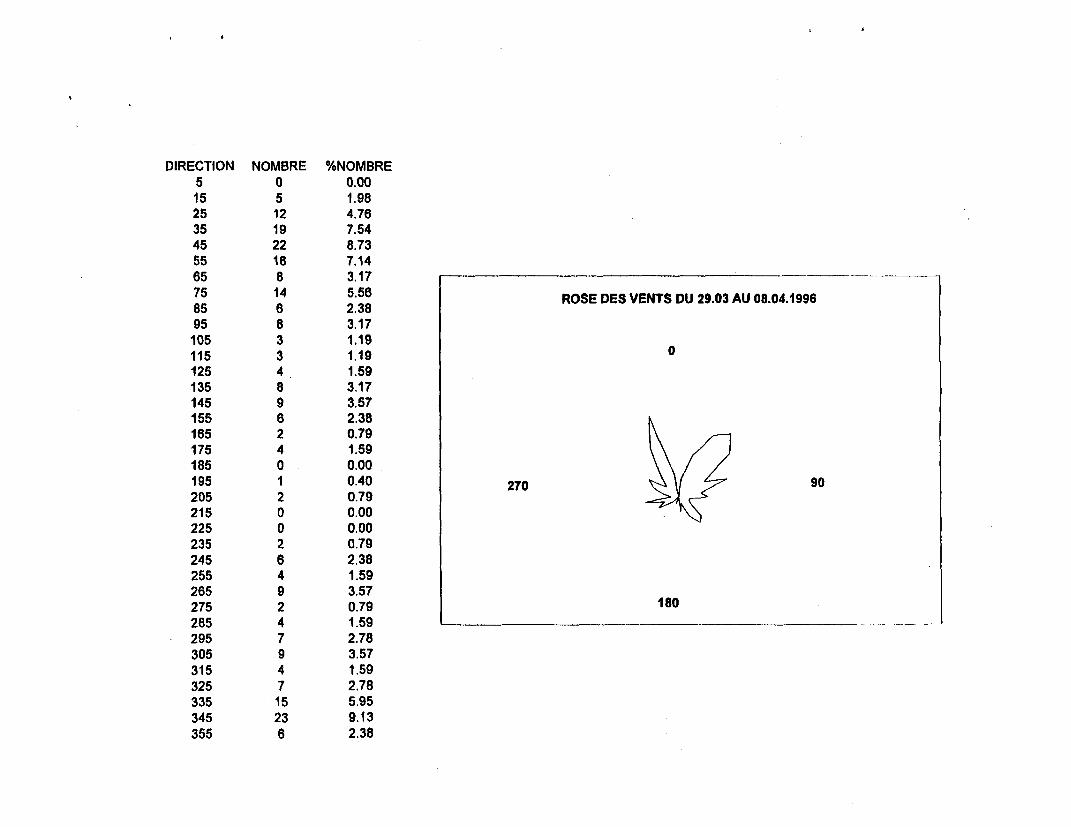
DIRECTION NOMBRE %NOMBRE5 0 0.0015 5 1.9825 12 4.7635 19 7.5445 22 8.7355 18 7.1465 8 3.1775 14 5.56 ROSE DES VENTS DU 29.03 AU 08.04.199685 6 2.3895 8 3.17105 3 1.19115 3 1.19 0125 4 1.59135 8 3.17145 9 3.57155 6 2.38165 2 0.79175 4 1.59185 0 0.00195 1 0.40 270 90205 2 0.79215 0 0.00225 0 0.00235 2 0.79245 6 2.38255 4 1.59265 9 3.57275 2 0.79 180285 4 1.59295 7 2.78305 9 3.57315 4 1.59325 7 2.78335 15 5.95345 23 9.13355 6 2.38
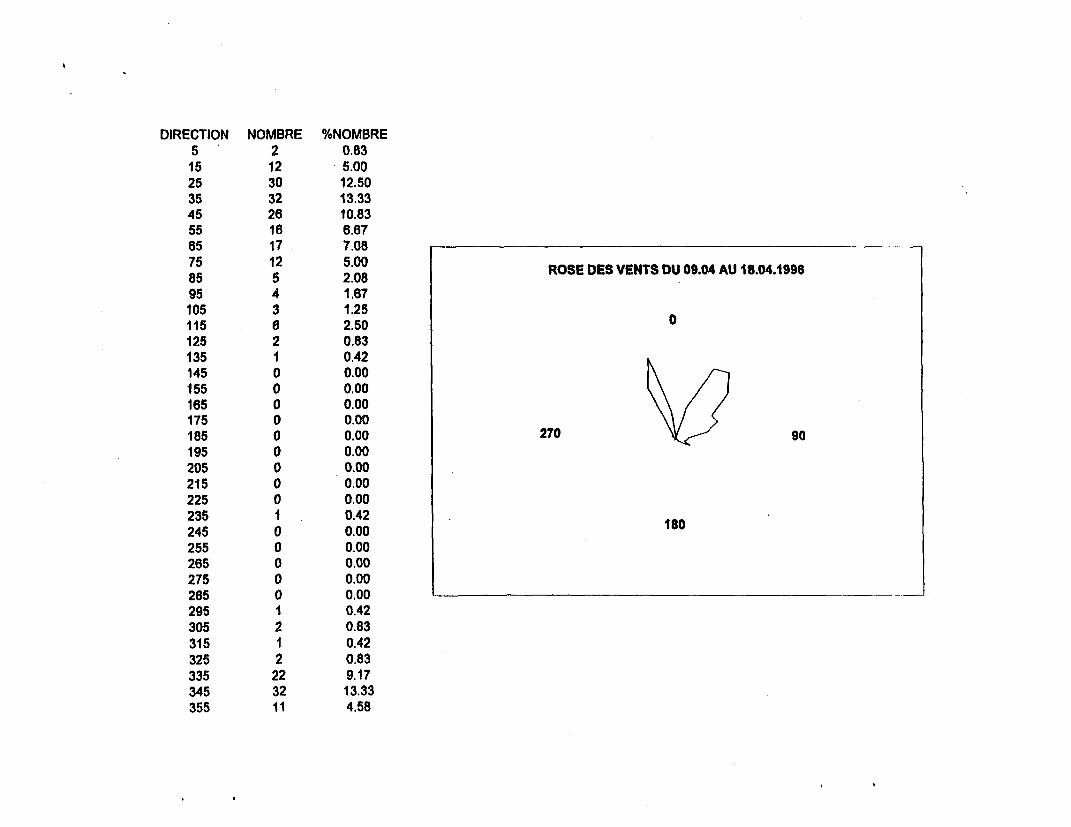
DIRECTION NOMBRE %NOMBRE5 2 0.8315 12 5.0025 30 12.5035 32 13.3345 26 10.8355 16 6.6765 17 7.08785 12 2.08 ROSE DES VENTS DU 09.04 AU 18.04.1996
95 4 1.67105 3 1.25 0115 6 2.50125 2 0.83135 1 0.42145 0 0.00155 0 0.00165 0 0.00175 0 0.00185 0 0.00 270 90195 0 0.00205 0 0.00215 0 0.00225 0 0.00235 1 0.42 180245 0 0.0010255 0 0.00265 0 0.00275 0 0.00285 0 0.00295 1 0.42305 2 0.83315 1 0.42325 2 0.83335 22 9.17345 32 13.33355 11 4.58
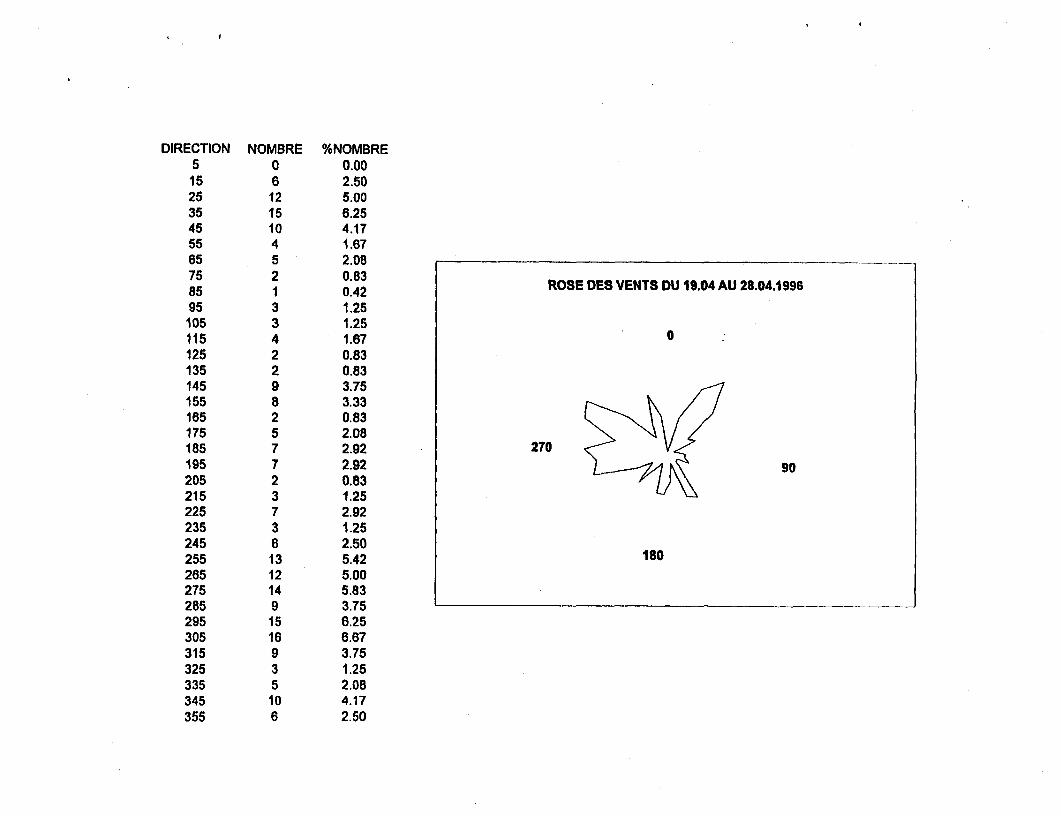
DIRECTION NOMBRE %NOMBRE5 0 0.0015 6 2.5025 12 5.0035 15 6.2545 10 4.1755 4 1.6765 5 2.08
875 2 0.42 ROSE DES VENTS DU 19.04 AU 28.04.199695 3 1.25105 3 1.25115 4 1.67 0125 2 0.83135 2 0.83145 9 3.75155 8 3.33165 2 0.83175 5 2.08185 7 2.92 270195 7 2.92 90205 2 0.83215 3 1.25225 7 2.92235 3 1.25245 8 2.50IS255 13 5.42 180265 12 5.00275 14 5.83285 9 3.75295 15 6.25305 16 6.67315 9 3.75325 3 1.25335 5 2.08345 10 4.17355 6 2.50
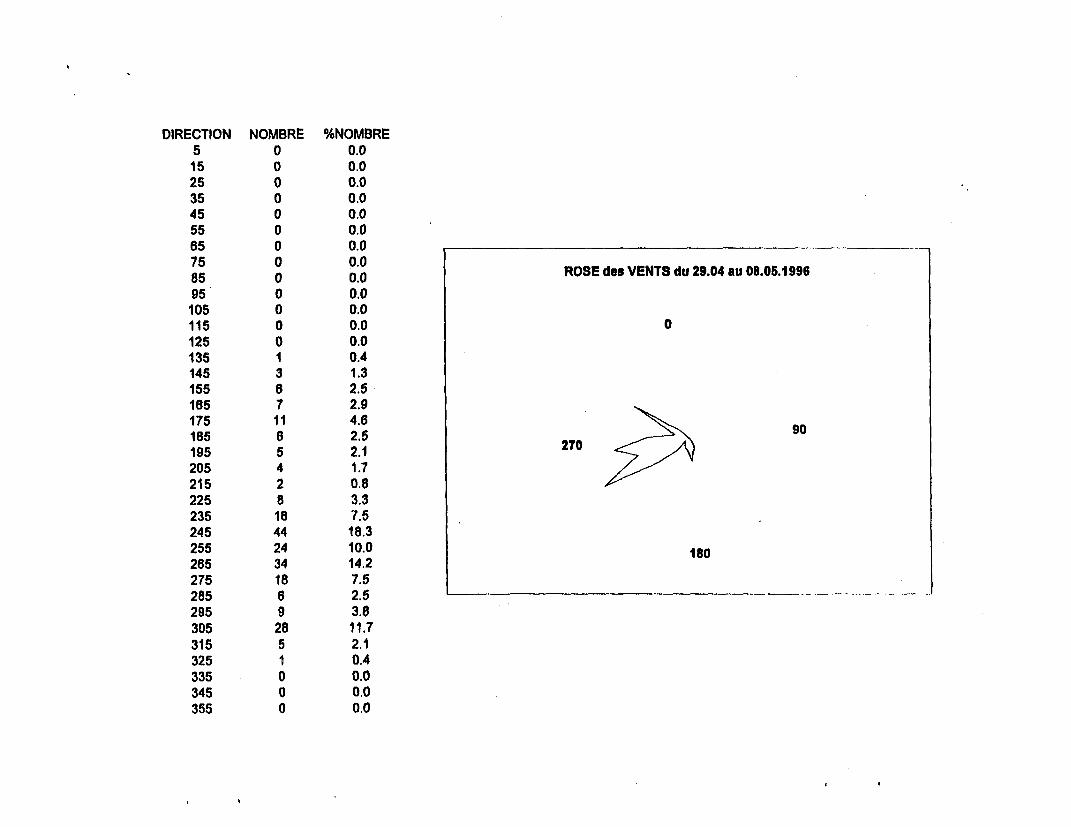
DIRECTION NOMBRE %NOMBRE5 0 0.015 0 0.025 0 0.035 0 0.045 0 0.055 0 0.065 0 0.075 0 0.0 ROSE des VENTS du 29.04 au 08.05.199685 0 0.095 0 0.0105 0 0.0115 0 0.0 0125 0 0.0135 1 0.4145 3 1.3155 6 2.5165 7 2.9175 11 4.6 90185 6 2.5 270195 5 2.127205 4 1.7215 2 0.8225 8 3.3235 18 7.5245 44 18.3255 24 10.0 180265 34 14.2275 18 7.5285 6 2.5295 9 3.8305 28 11.7315 5 2.1325 1 0.4335 0 0.0345 0 0.0355 0 0.0
DIRECTION NOMBRE %NOMBRE5 0 0.015 3 2.825 3 2.835 15 13.845 3 2.855 4 3.765 3 2.8
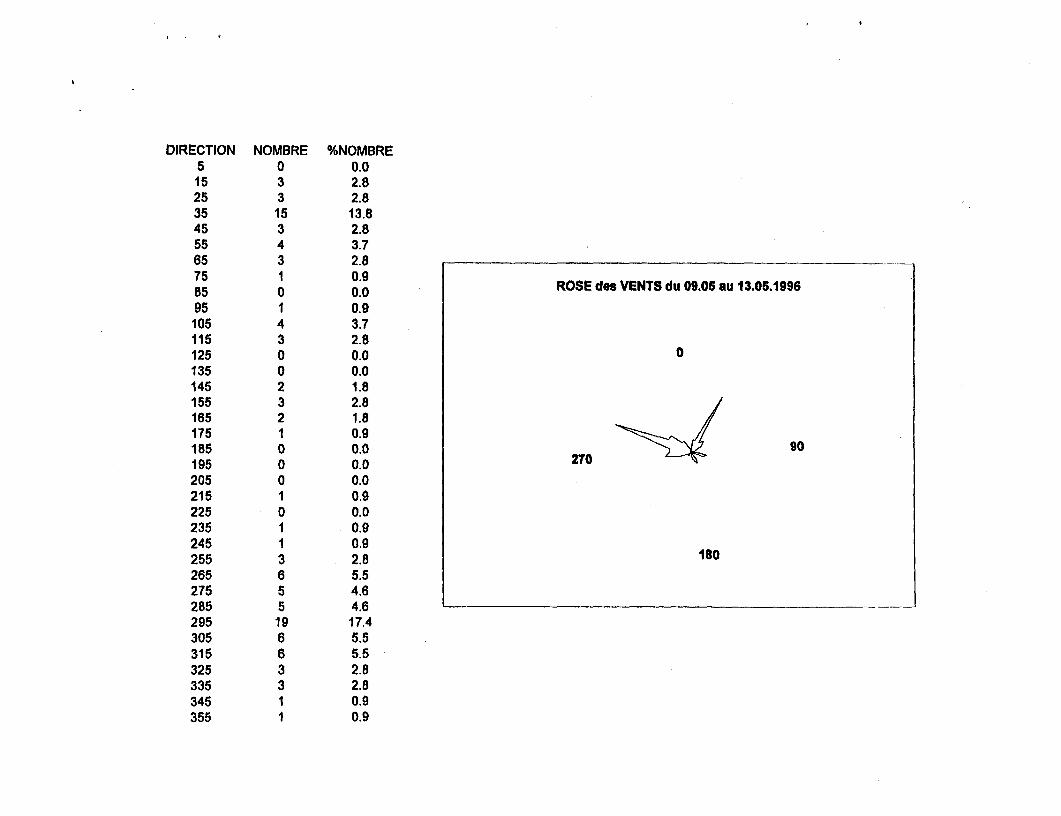
85 0 0.0 ROSE des VENTS du 09.05 au 13.05.199695 1 0.9105 4 3.7115 3 2.8125 0 0.0 0135 0 0.0145 2 1.8155 3 2.8165 2 1.8175 1 0.9185 0 0.0 270 90195 0 0.0205 0 0.0215 1 0.9225 0 0.0235 1 0.9245 1 0.9IS255 3 2.8 180265 6 5.5275 5 4.6285 5 4.6295 19 17.4305 6 5.5315 6 5.5325 3 2.8335 3 2.8345 1 0.9355 1 0.9

I
RADL^NIINTERNATIONALM3
EIA AddendumAttachment 6
30-Day Report: Results from Air Monitoringat Jort Lasfar Power Plant

4 I I
Resultsfrom Air MonitoringatJorfLasfar Power Plant
Submitted to:
CMS Generation CompanyandABB Energy Ventures, Inc.
Results from Air Monitoringat
Jorf Lasfar Power Plan
Submitted to:
CSM Generation Companyand
ABB Energy Ventures, Inc.
Prepared by:
Radian International LLCP. O. Box 201088
Austin, Texas 78720-1088
July 26, 1996
Table of Contents
1.0 Introduction ............................ 1-1
1.1 Program Description .................. 1-11.2 Scope of the Report .................. 1-3
2.0 Summary of Results ....................... 2-1
3.0 Operational Summary .3-1
Appendix A: Hourly Summaries of Air Pollutant Data .A-1
Appendix B: Hourly Summaries of Meteorological Data .B-1
Appendix C: Trip Reports .C-1
ii
List of Figures
1-1 Map Showing Air Monitoring Site .1-2
2-1 Pollution Rose for Oxides of Nitrogen ...................................... 2-2
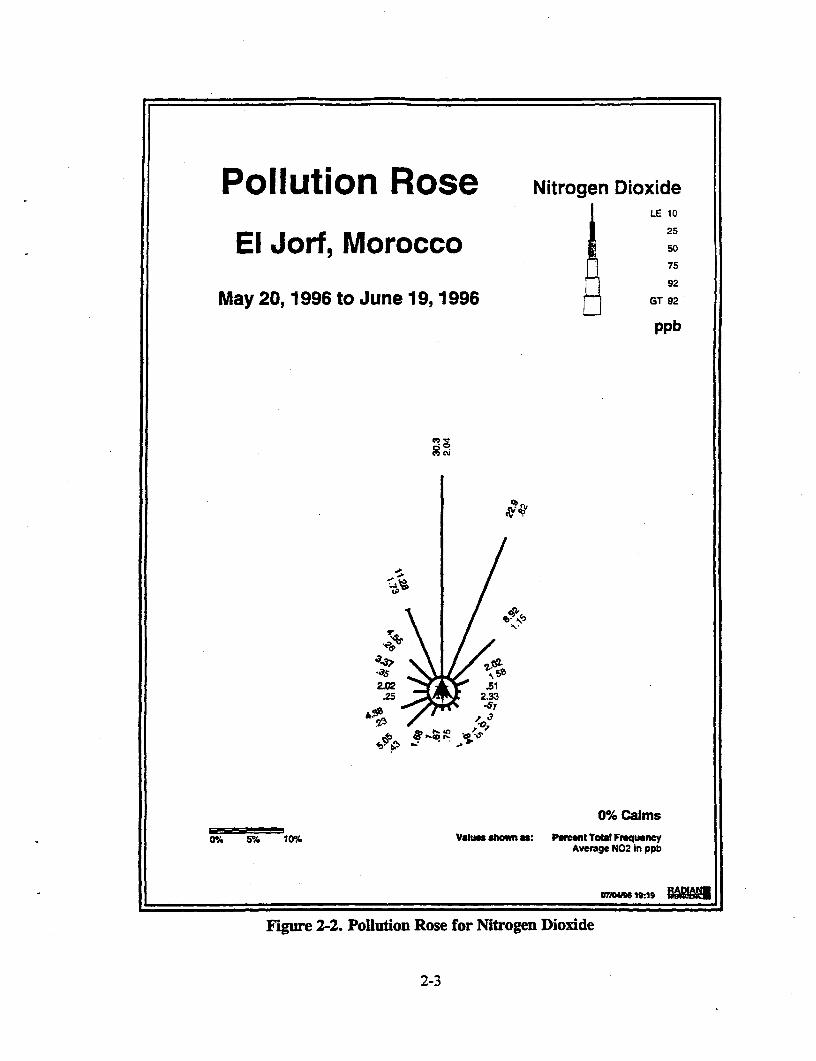
2-2 Pollution Rose for Nitrogen Dioxide ....................................... 2-3
2-3 Pollution Rose for Nitric Oxide ............... ................... 2-4
2-4 Polution Rose for Sulfur Dioxide ................................... 2-5
2-5 Pollution Rose for JLPP Air Quality Monitoring Site .......... ................ 2-6
iii
List of Tables
1-1 Project Guidelines for Quality Parameters ............ ....................... 1-1
1-2 Summary of Measurement Parameters ............. ........................ 1-3
2-1 Summary of Maximnum 1-Hour Oxides of Nitrogen (NO) Values ...... .......... 2-1
2-2 Summary of Maximum 1 -Hour Nitrogen Dioxide (NO2 ) Values ...... ........... 2-7
2-3 Summary of Maximum 1 -Hour Nitric Oxide (NO) Values ...... ................ 2-7
2-4 Summary of Maximum 1-Hour Sulfur Dioxide (SO2 ) Values ...... .............. 2-8
2-5 Summary of Particulate Matter Sampling Results .2-8
2-6 Stability Class for Air Quality Station at JLPP (Sigma Algorithm)May 20, 1996 - June 19, 1996 .2-9
2-7 Key to Stability Classes .2-10
3-1 Data Capture Rates for Meteorological Parameters at the JLPP Air Quality Site . 3-2
3-2 Data Capture for Air Quality Parameters at the JLPP Air Quality Site .3-2
iv

i
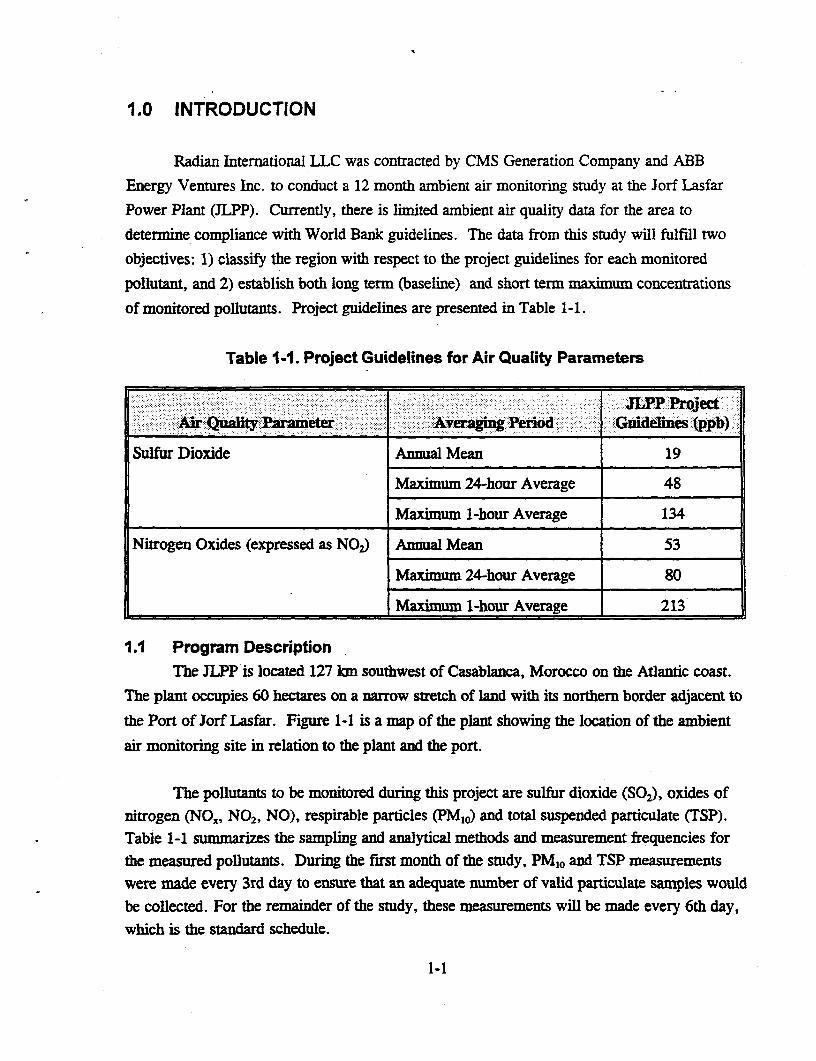
1.0 INTRODUCTION
Radian International LLC was contracted by CMS Generation Company and ABB
Energy Ventures Inc. to conduct a 12 month ambient air monitoring study at the Jorf Lasfar
Power Plant (JLPP). Currently, there is limited ambient air quality data for the area to
determine compliance with World Bank guidelines. The data from this study will fulfill two
objectives: 1) classify the region with respect to the project guidelines for each monitored
pollutant, and 2) establish both long term (baseline) and short term maximum concentrations
of monitored pollutants. Project guidelines are presented in Table 1-1.
Table 1-1. Project Guidelines for Air Quality Parameters
JLP' Prject~A-r Qushly P-rameter Averagi-- Ped-- - G deines(ppb)
Sulfur Dioxide Annual Mean 19
Maximum 24-hour Average 48
Maximum 1-hour Average 134
Nitrogen Oxides (expressed as NO2) Amnual Mean 53
Maximum 24-hour Average 80
Maximm 1-hour Average 213
1.1 Program DescriptionThe JLPP is located 127 km southwest of Casablanca, Morocco on the Atlantic coast.
The plant occupies 60 hectares on a narrow stretch of land with its northern border adjacent to
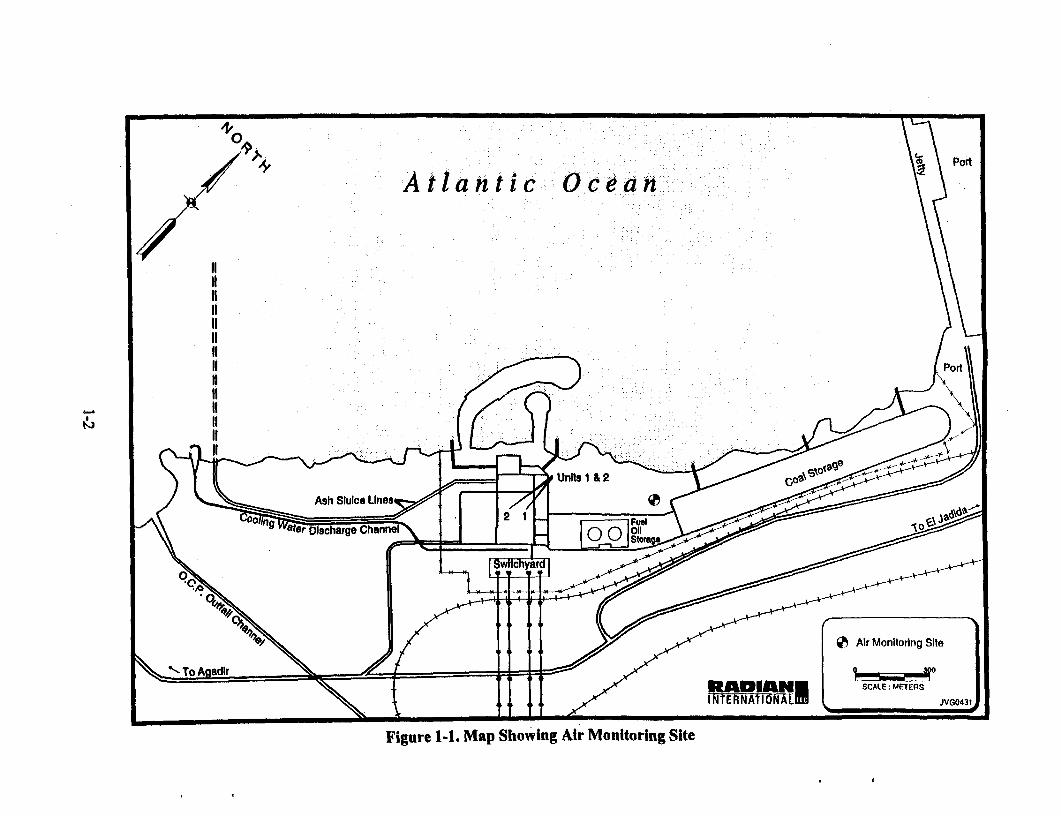
the Port of Jorf Lasfar. Figure 1-1 is a map of the plant showing the location of the ambient
air monitoring site in relation to the plant and the port.
The pollutants to be monitored during this project are sulfur dioxide (SO2), oxides ofnitrogen (NO., NO2, NO), respirable particles (PM1o) and total suspended particulate (TSP).Table 1-1 summarizes the sampling and analytical methods and measurement frequencies forthe measured pollutants. During the first month of the study, PM10 and TSP measurementswere made every 3rd day to ensure that an adequate number of valid particulate samples wouldbe collected. For the remainder of the study, these measurements will be made every 6th day,which is the standard schedule.
1-1
4-0
Port
4-: Atlantaic Ocea nh
7 ~~~~~~~~Ash SlulceLlnes 7'|O<
Figure 1-1. Map Showing Air Monitoring Site
1.2 Scope of the ReportThis report presents the monitoring results from the first 31 days of site operation (May
20 to June 19, 1996). The report is organized as follows:
Section 2 presents the monitoring results and contains data summary tables andpollution roses for each continuously measured pollutant.
Section 3 presents a summary of the site operations, including the data capturepercentages for each parameter as well as a description of system downtime anddata loss.
Appendix A contains hourly summaries of the air pollutant data.
Appendix B contains hourly summaries of the meteorological parameters.
Appendix C contains two trip reports that document the activities at the site duringthe first month of monitoring.
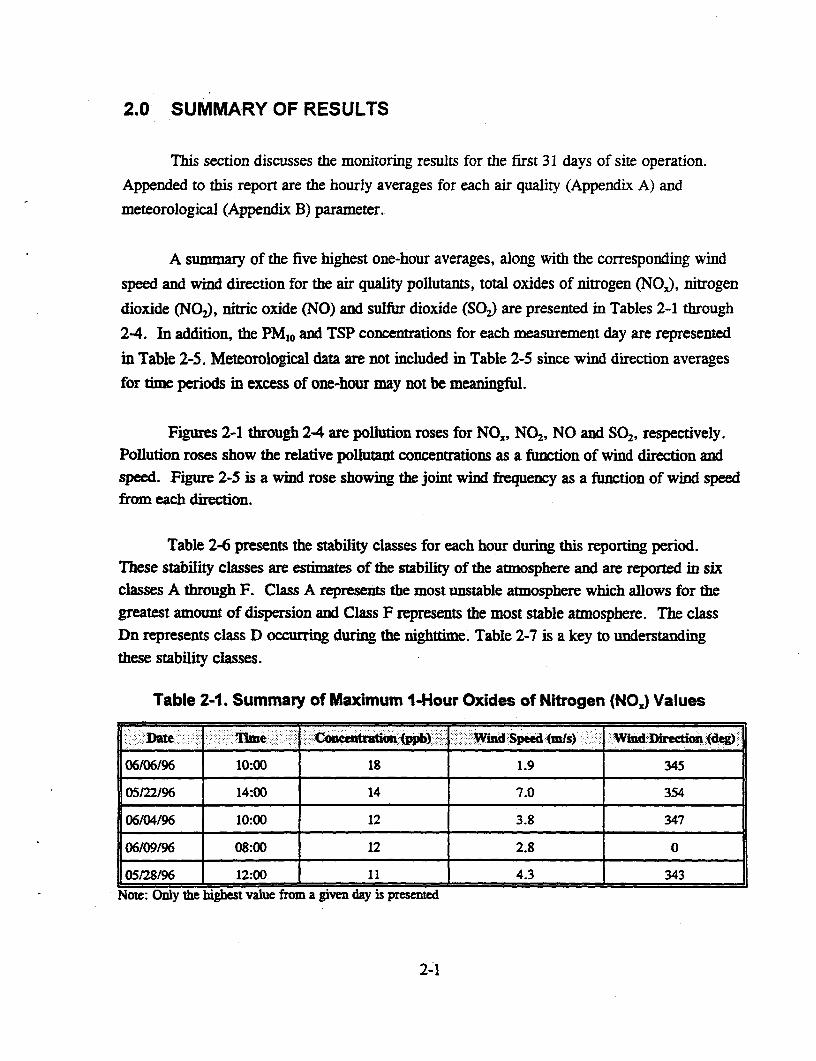
Table 1-2. Summary of Measurement Parameters
'SamplingMeasurement Parieter- Frequency MethodAna -lyMcal M-thod
Sulfur Dioxide (SO2) Continuous Contimous EPA reference PulsedMonitor Fluorescence
Nitrogen Oxides (NOJ) Continuous Continuous EPA referenceMonitor Chemiluminescence
Total Suspended Particulate Every 3rd day' EPA Reference Gravimetric(TSP) High Volume Determination
Respirable Particulate Every 3rd day' EPA Reference Gravimetric(PM1o) Inlet High Determination
Volume ISampling is every 3rd day only for the first 30 days, after which samples will be collectedevery 6th day.
1-3

l~~~~~~~~~~~~~~~~~~~~~~~~~~~~~~~~~~~~~~~~~~~~~~~~~~~~~~~~~~~~~~~~~~~~~~~~~~~~~~~~~~~~~~~~~~~~~~~~~~~~~~~~~~~~~~~~~~~~~~~~
2.0 SUMMARY OF RESULTS
This section discusses the monitoring results for the first 31 days of site operation.
Appended to this report are the hourly averages for each air quality (Appendix A) and
meteorological (Appendix B) parameter.
A summary of the five highest one-hour averages, along with the corresponding wind
speed and wind direction for the air quality pollutants, total oxides of nitrogen (NO,), nitrogen
dioxide (NO2 ), nitric oxide (NO) and sulfur dioxide (SO2) are presented in Tables 2-1 through
2-4. In addition, the PMIo and TSP concentrations for each measurement day are represented
in Table 2-5. Meteorological data are not included in Table 2-5 since wind direction averagesfor time periods in excess of one-hour may not be meaningful.
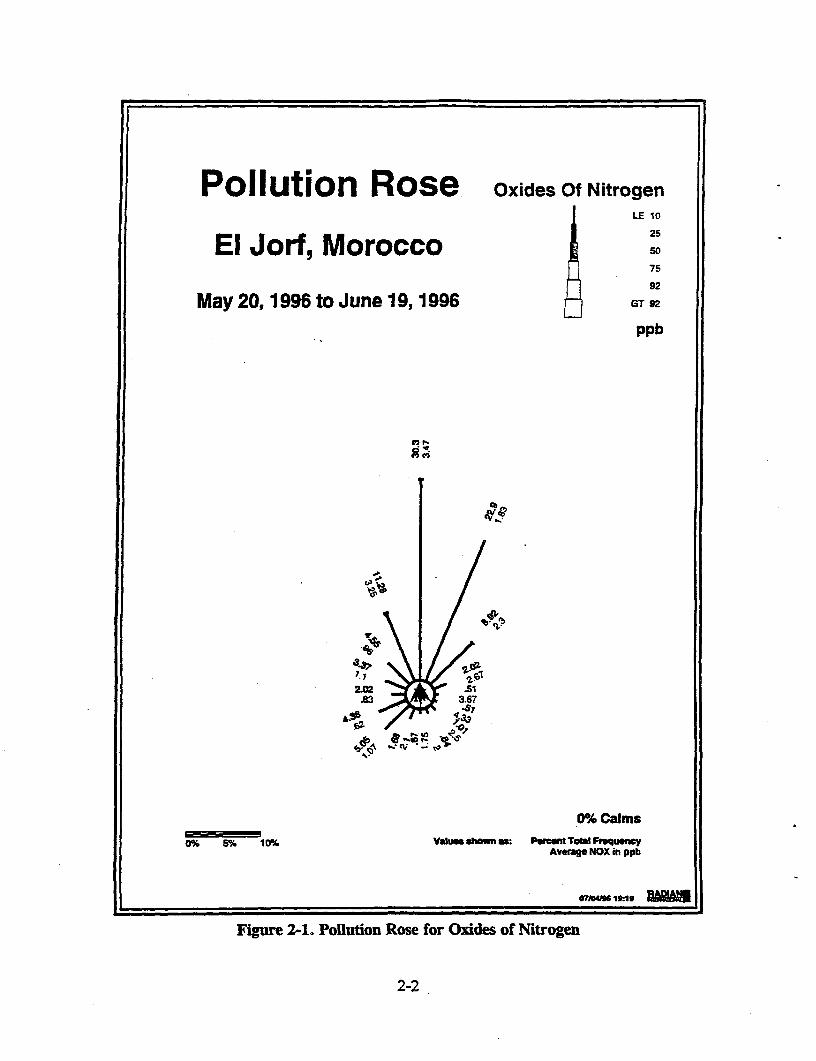
Figures 2-1 through 24 are pollution roses for NO1, NO2, NO and S02, respectively.Pollution roses show the relative pollutant concentrations as a function of wind direction andspeed. Figure 2-5 is a wind rose showing the joint wind frequency as a function of wind speedfrom each direcfion.
Table 2-6 presents the stability classes for each hour during this reporting period.These stability classes are estimates of the stability of the atmosphere and are reported in sixclasses A through F. Class A represents the most unstable atmosphere which allows for thegreatest amount of dispersion and Class F represents the most stable atmosphere. The classDn represents class D occurring during the nightdme. Table 2-7 is a key to understandingthese stability classes.
Table 2-1. Summary of Maximum 1-Hour Oxides of Nitrogen (NOx) Values
-; Date - -- -- --e -C: -e- ppb) W---d-Speeds (is) -Wind Diection deg-
06106/96 10:00 18 1.9 345
05/22/96 14:00 14 7.0 354
06/04/96 10:00 12 3.8 347
06/09/96 08:00 12 2.8 0
05/28/96 12:00 11 4.3 343Note: Only the highest value from a given day is presented
2-1
Pollution Rose Oxides Of NitrogenLE 10
25
El Jorf, Morocco so92
May 20,1996 to June 19, 1996 GT 92
ppb
*83 3.67
'.'V~~'
0%O Calms
0% 5% 10% Value shown : Pedn Toad FrequencyAverage NOX in ppb
Figure 2-1. Pollution Rose for Oxides of Nitrogen
2-2
Pollution Rose Nitrogen DioxideLE 10
25El Jorf, Morocco 5
H ~~~7592
May 20, 1996 to June 19, 1996 GT 92
ppb
s
2.02 1.25 2.33
-.
0% Calms
OOA 5% t0% Value shown as: Pecent Totl FrquencyAverage N02 in ppb
a7ic4 1S1s
Figure 2-2. Pollution Rose for Nitrogen Dioxide
2-3
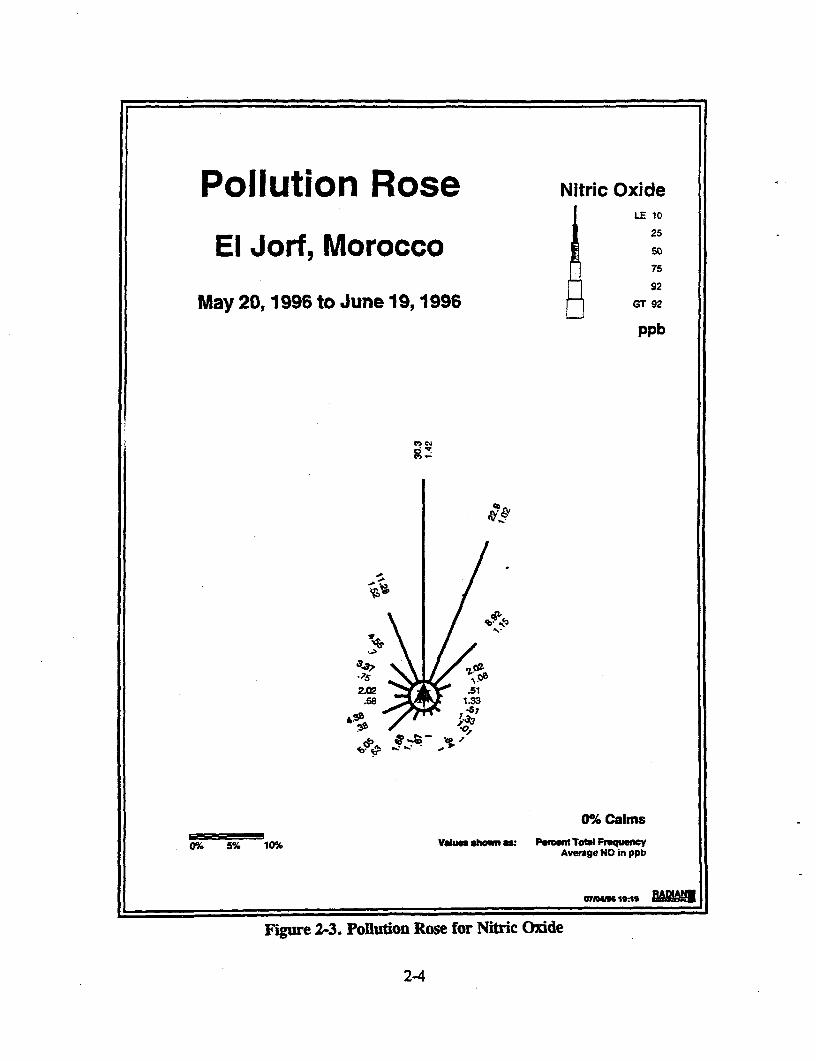
Pollution Rose Nitric OxideLE 10
25
El Jorf, Morocco 50
g ~~~7592
May 20,1996 to June 19,1996 GT 92
ppb
rb-~-V
A .
.;Is
0°h Calms
0% 5% 10% Vaue shon #: Percen Total FrequenyAverage NO in ppb
Figure 2-3. Pollution Rose for Nitric Oxide
2-4
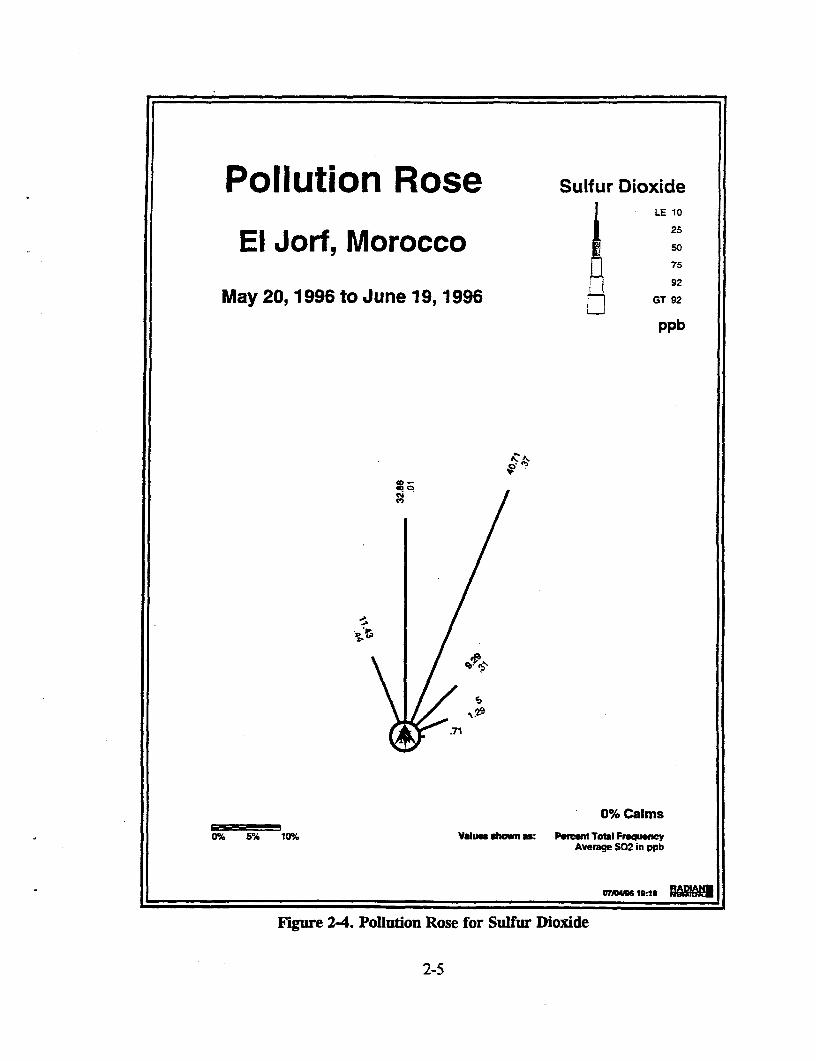
Pollution Rose Sulfur DioxideLE 10
El Jorf, Morocco so75
92
May 20, 1996 to June 19, 1996 GT 92
ppb
o~~~~~~~0 '
0-
w
.71
0% Calms
0% 5% 10% Value shown a: Pwnt Tobtl FreQuenyAwrage S02 in ppb
7OAM6 19:13
Figure 2W4. Pollution Rose for Sulfur Dioxide
2-5
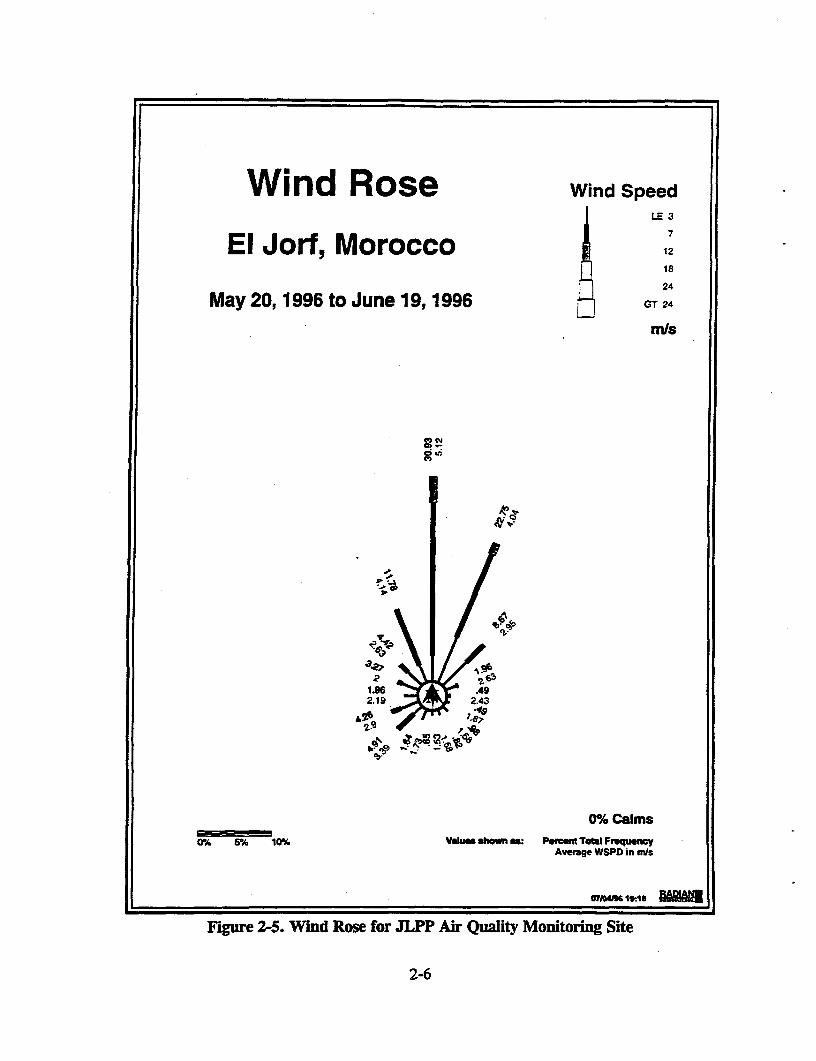
Wind Rose Wind SpeedLE 3
7El Jorf, Morocco 12
18
24
May 20,1996 to June 19, 1996 GT 24
n/s
C~~~~~~vrg WSD n n
C')
2-6
1.96 A92.19 2.43
I4
(0%0 Calms0%. 5% 10% Values shown sa: Peftent Total Frequency
Average WSPD in mis
Figure 2-5. Wind Rose for JLPP Air Quality Monitoring Site
2-6
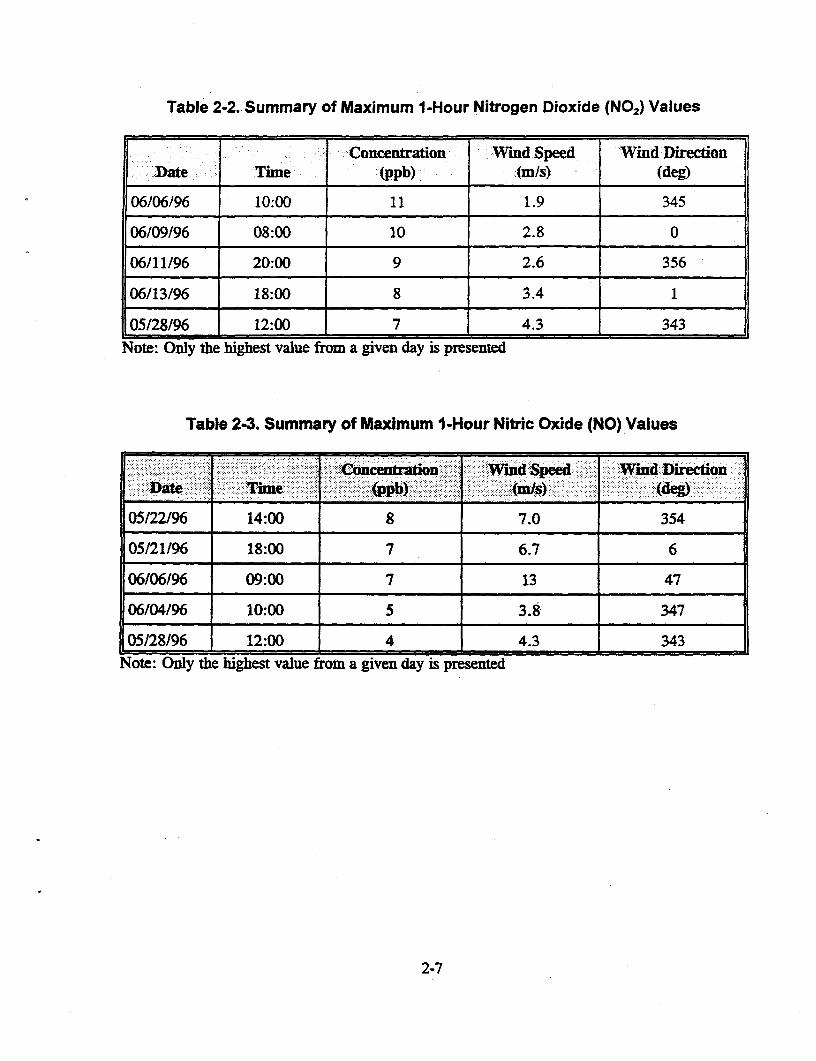
Table 2-2. Summary of Maximum 1-Hour Nitrogen Dioxide (NO2) Values
Concentration Wind Speed Wind Direction.Date Time (ppb) (mWs) (deg)
06/06/96 10:00 11 1.9 345
06/09/96 08:00 10 2.8 0
06/11/96 20:00 9 2.6 356
06/13/96 18:00 8 3.4 1
05/28/96 12:00 7 4.3 343
Note: Only the highest value from a given day is presented
Table 2-3. Summary of Maximum 1-Hour Nitric Oxide (NO) Values
Concenration Wind peed Wiind -DirectionDate Time (jp~~b)(m)(dg
05/22/96 14:00 8 7.0 354
05/21/96 18:00 7 6.7 6
06/06/96 09:00 7 13 47
06/04/96 10:00 5 3.8 347
05/28/96 12:00 4 4.3 343Note: Only the highest value from a given day is presented
2-7
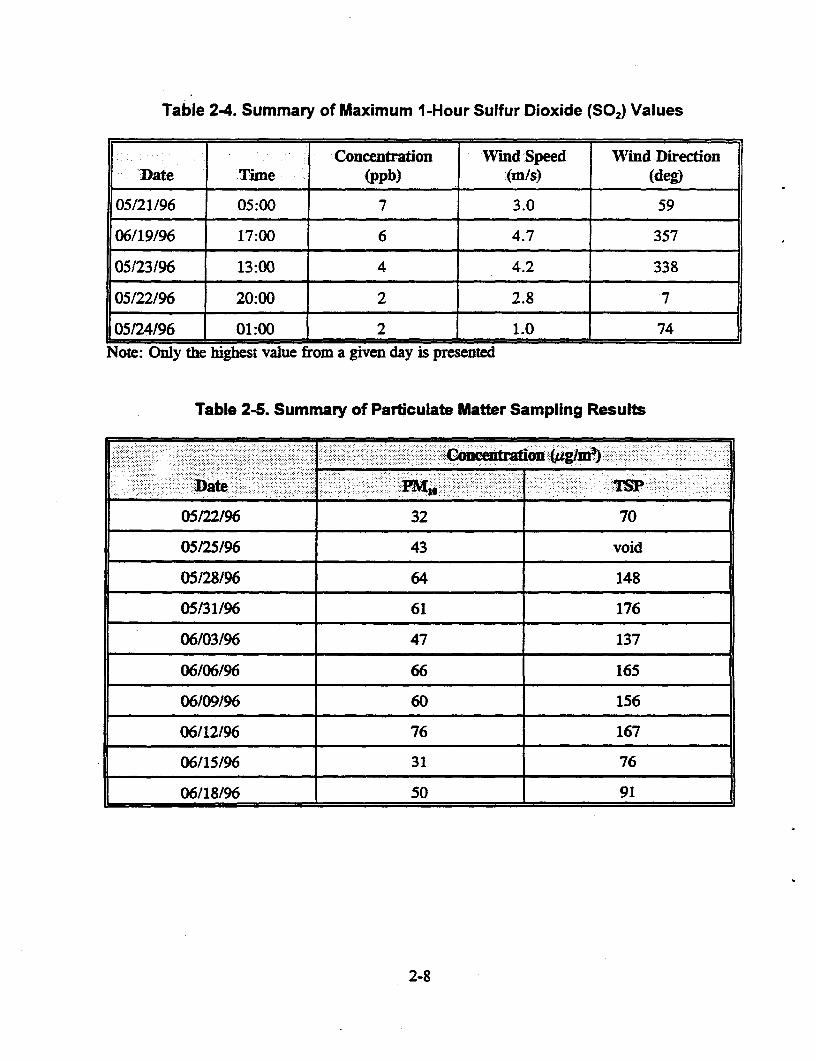
Table 2-4. Summary of Maximum 1-Hour Sulfur Dioxide (SO2 ) Values
'Concentration Wind ~Speed Wind DirectionDate Time (ppb) ;(m/s) (deg)
05/21/96 05:00 7 3.0 59
06/19/96 17:00 6 4.7 357
05123/96 13:00 4 4.2 338
05/22/96 20:00 2 2.8 7
05/24196 01:00 2 1.0 74Note: Only the highest value from a given day is presented
Table 2-5. Summary of Particulate Matter Sampling Results
,1 ?SW0 0: X X,~~~~. .. . .. ........ . ..
05/22/96 32 70
05/25/96 43 void
05/28/96 64 148
05/31/96 61 176
06/03/96 47 137
06106/96 66 165
06/09/96 60 156
06/12/96 76 167
06/15/96 31 76
06/18/96 50 91
2-8
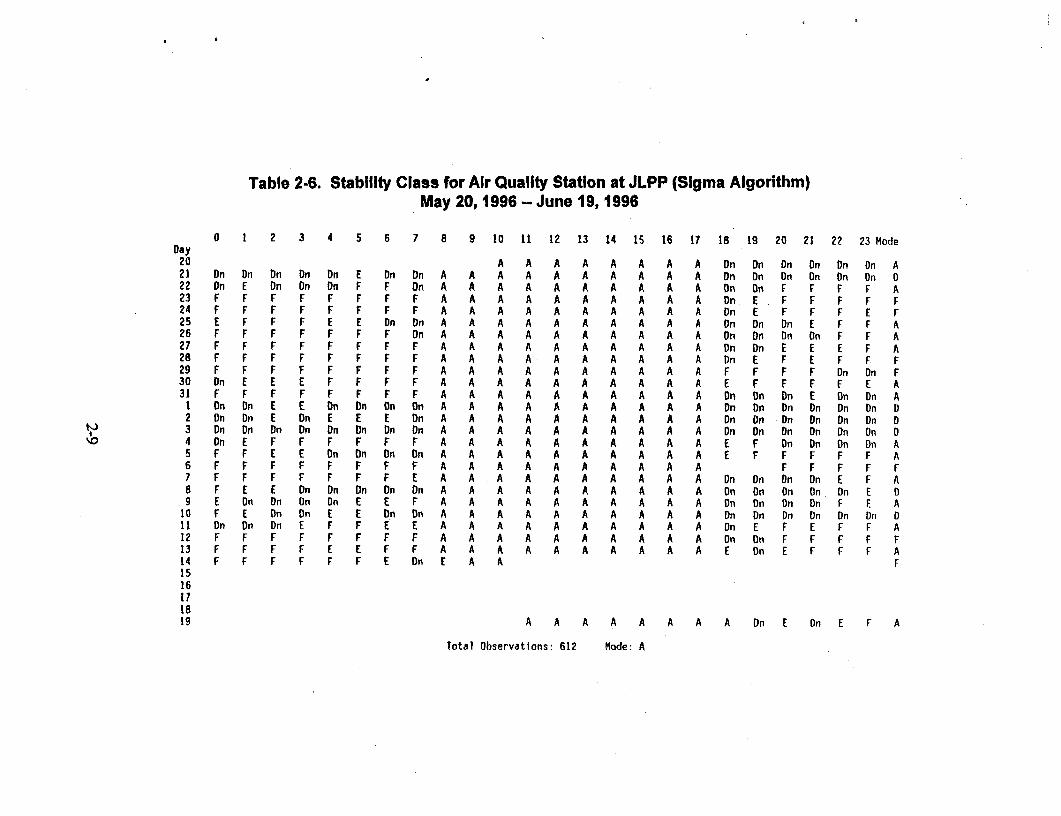
Table 2-6. Stability Class for Air Quality Station at JLPP (Sigma Algorithm)May 20, 1996 -- June 19, 1996
0 1 2 3 4 5 6 7 8 9 10 11 12 13 14 15 16 11 18 19 20 21 22 23 ModeDay20 A A A A A A A A On On On Dn Dn Dn A21 Dn Dn Dn Dn Dn E On Dn A A A A A A A A A A Dn on On On On On 022 On E Dn Dn Dn F F Dn A A A A A A A A A A On On F F F F A23 F F F F F F F F A A A A A A A A A A On E F F F F F24 F F F F F F F F A A A A A A A A A A Dn E F F F E F25 E F F F E E Dn Dn A A A A A A A A A A On Dn Dn E F F A26 F F F F F F F On A A A A A A A A A A On On On On F F A27 F F F F F F F F A A A A A A A A A A Dn Dn E F E F A28 F F F F F F F F A A A A A A A A A A Dn E F E F F F29 F F F F F F F F A A A A A A A A A A F F F F Dn Dn F30 Dn E E E F F F F A A A A A A A A A A E F F F F E A31 F F F F F F F F A A A A A A A A A A Dn Dn Dn E On On AI On On E E On On On Dn A A A A A A A A A A Dn Dn Dn Dn Dn Dn D2 Dn Dn E Dn E E E Dn A A A A A A A A A A On Dn Dn Dn On Dn 0
,)i 3 Dn Dn Dn Dn Dn Dn Dn Dn A A A A A A A A A A On Dn Dn On Dn On 0'0 4 On E F F F F F F A A A A A A A A A A E F On Dn On Dn A
5 F F E E Dn On On On A A A A A A A A A A E F F F F F A6 F F F F F F F F A A A A A A A A A A F F F F F7 F F F F F F F E A A A A A A A A A A On Dn Dn Dn E F A8 F E E Dn On Dn Dn Dn A A A A A A A A A A On Dn On On On E 09 E Dn On On On E E F A A A A A A A A A A Dn Dn On Dn F E A10 F E On On E E Dn Dn A A A A A A A A A A Dn Dn Dn Dn Dn Dn D11 Dn Dn Dn E F F E E A A A A A A A A A A Dn E F E F F A12 F F F F F F F F A A A A A A A A A A Dn On F F F F F13 F F F F E E F F A A A A A A A A A A E On E F F F A14 F F F F F F E On E A A F1516171819 A A A A A A A A Dn E Dn E F A
Total Observations: 612 Mode: A
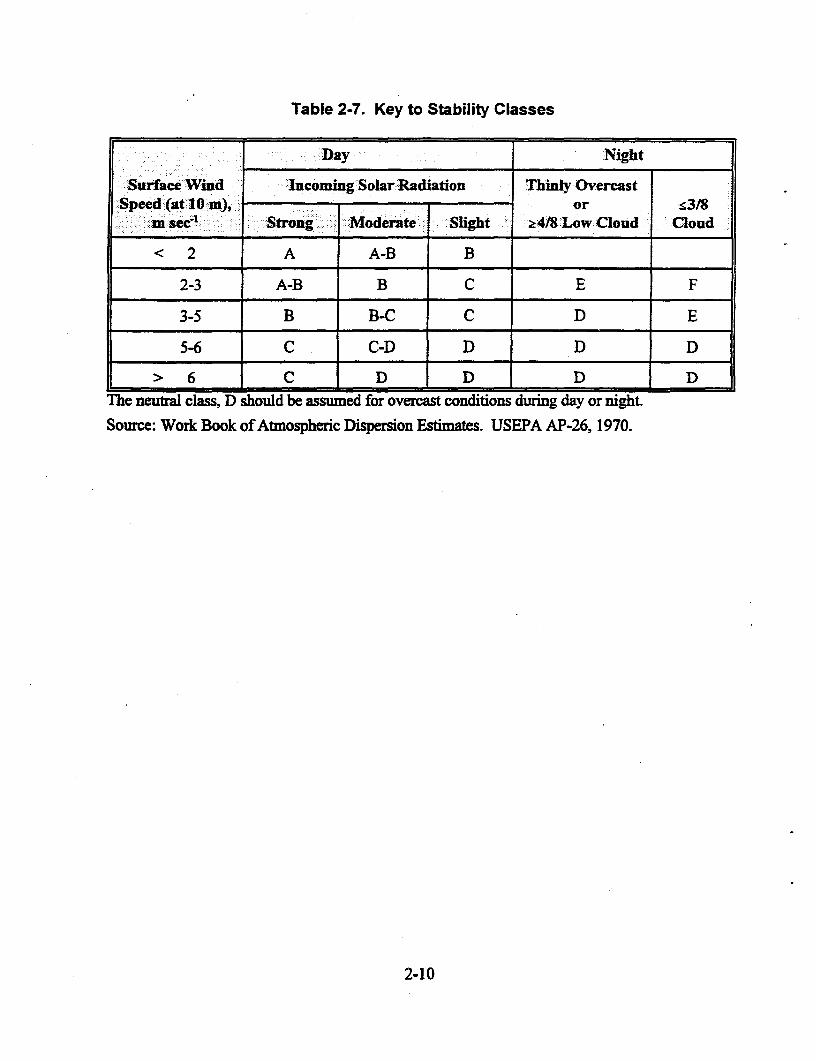
Table 2-7. Key to Stability Classes
Day Night
:-Surface Wind IncomingeSolar Radiation Thinty Overcast;.Speed S(at 10 M), or k318
.m sec- Strongk Moderate Slight :4/8 Low Cloud Cloud
< 2 A A-B B
2-3 A-B B C E F
3-5 B B-C C D E
5-6 C C-D D D D
> 6 C D D D DThe neutral class, D should be assumed for overcast conditions during day or night.
Source: Work Book of Atmospheric Dispersion Estimates. USEPA AP-26, 1970.
2-10
3.0 OPERATIONAL SUMMARY
This section discusses the data capture rates for the period of May 20,1996 through June
19,1996 and explains any significant periods of missing data. The data capture rate, or the
completeness of capturing continuous data (i.e., by means of meteorological and continuous air
quality monitors), is defined as the total number of valid data hours out of the total number of
possible hours. For noncontinuous parameters (i.e., particulate samples), data capture is defined
as the total number of valid sampling events out of the total number of sampling events
attempted.
Table 3-1 presents the data capture for all meteorological parameters and Table 3-2
presents the data capture for all air quality parameters. The program objectives for
meteorological data are 90% data capture and 85% data capture for all air quality data. All
parameters except SO2 and Delta Temperature exceeded the program objectives. An explanation
of the S02 and Delta Temperature problems are provided in the paragraphs below.
The SO2 analyzer photomultiplier tube temperature control circuit and voltage to
frequency converter failed on May 26 causing an elevated instrument baseline response. Severalattempts were made by the on-site LPEE Operator and Radian Support Staff to diagnose and
correct the problem. The problem was corrected on June 20 when the temperature controller and
V/F circuits were replaced by Radian Support Staff. Overall, this problem resulted in the loss of
592 hours of S02 data.
The delta temperature signal conditioning circuit was short circuited during transit of the
equipment to the site. This resulted in loss of delta temperature data during the first 25 days of
site operation. To correct this problem, another translator card was ordered from the
manufacturer and replaced on June 14. However, the new translator was not set-up properly, by
the manufacturer, to provide accurate wind direction measurements. This resulted in the loss of
120 hours of wind direction (vector and scalar), wind speed (vector only), and wind standard
deviation. On June 17th, it was decided to go back to the original signal conditioner because of
the importance of the wind direction and the wind standard deviation data for calculating
atmospheric stability class. All systems are currently on-line collecting data. Additional on-site
spare parts and better communications between the site operator and support staff have been
established to help minimize future downtime.
3-1
Valid daily, hourly, and five-minute data must include at least 75% of the underlying
averages or scans. Daily averages must include at least 18 hours, hourly averages at least 45minutes and five-minute at least 225 one-second scans.
Table 3-1. Data Capture Rates for Meteorological Parameters at theJLPP Air Quality Site
F A; ~P W$- -0i -f DR XyWDA.W WSR WSA WSD d-TEMP. SRAD:l
.. __. 1...i= _% Data 97.4 82.1 82.1 82.1 98.4 82.1 11.8 97.7
Key: Temp = temperatureWDR = wind direction (resultant)WDA = wind direction (actual)WSR = wind speed (resultant)WSA = wind speed (actual)WSD = wind speed deviationd-Temp = delta temperatueSRAD = solar radiaton
Table 3-2. Data Capture Rates for Air Quality Parameters at theJLPP Air Quality Site
`N ~ N 'NO2 O
%/DataCapture 96.0 96.0 96.0 18.8 3
3-2
Appendix A
Hourly Summaries of Air Pollutant Data

W X *~~~~~~~~~~~~~~~~~~~~~~~~~~~~~~~~~~~~~~~~~~~~~~~~~~~~~~~~~~~~~~~~~~~~~~~~~~~~~~~~~~~~~~~~~~~~~~~~~~~~~~~~~~~~~~~~~
TABLE X-X
Hourly Values of NOX in PPB for Station 001For Period 5/20/96 -- 6/19/96
Hour
0 1 2 3 4 5 6 7 8 9 10 11 12 13 14 15 16 17 18 19 20 21 22 23 MeanDay20 2 4 2 2 2 2 2 2 0 0 2 2 2 2*21 2 2 2 2 2 2 2 2 2 6 2 3 2 4 2 8 2 2 2 2 2 322 2 2 2 2 2 2 3 3 4 4 4 4 4 14 2 2 2 2 2 2 1 323 1 1 1 1 1 2 3 2 2 1 1 2 2 4 2 1 1 3 4 6 224 4 4 1 1 1 1 2 1 2 4 6 6 4 2 5 8 9 3 4 2 1 2 2 2 325 1 2 2 2 2 2 2 2 2 2 2 8 8 4 5 4 4 6 6 2 1 3 3 2 326 3 2 2 2 2 2 2 4 2 2 4 4 4 4 3 3 2 2 2 1 1 2 2 3 327 1 2 1 2 2 2 3 2 7 4 6 4 8 6 3 3 3 2 2 5 4 3 3 2 328 2 2 2 1 2 2 5 4 2 2 4 7 11 9 10 10 5 4 3 7 4 5 2 6 529 4 2 2 4 3 3 2 2 2 2 1 1 1 0 0 1 0 0 0 0 0 0 0 1 130 0 0 0 1 0 1 1 3 1 1 1 0 0 1 0 0 0 0 0 2 1 0 0 0 131 1 1 0 0 0 0 1 2 0 0 0 0 0 0 1 2 6 4 2 3 2 4 4 3 21 4 2 1 3 3 4 4 3 2 3 4 6 4 4 2 3 2 3 4 1 1 1 1 1 32 3 3 1 2 2 2 4 4 6 4 4 4 4 4 4 7 6 7 8 5 1 2 1 0 43 0 1 0 0 0 1 1 1 2 1 1 1 1 1 1 1 1 1 1 2 3 2 2 1 14 1 1 2 2 2 3 2 3 5 4 12 1 1 1 1 1 1 1 3 2 1 1 1 2 25 1 1 1 1 0 1 0 1 1 0 0 0 0 0 0 0 0 0 0 0 0 0 1 1 06 2 1 1 1 2 1 2 1 1 15 18 2 2 1 1 0 0 0 0 2 0 1 27 7 4 3 2 0 2 2 2 1 1 2 0 0 0 1 1 1 3 1 1 1 1 1 1 28 1 1 1 1 0 1 1 2 1 2 1 1 1 0 1 1 2 2 1 1 1 1 1 1 19 2 1 1 1 1 4 5 8 12 4 1 1 1 1 2 2 2 6 6 8 3 2 1 2 3
10 1 2 1 2 2 1 2 2 2 2 4 2 1 2 1 4 7 4 3 3 4 1 1 1 211 1 1 1 1 2 2 2 1 2 1 1 1 1 1 1 1 1 3 6 3 10 8 2 2 212 1 6 1 3 3 3 3 2. 1 3 1 2 1 2 5 4 6 5 5 2 2 313 2 2 2 2 2 4 4 6 3 5 7 7 6 7 4 10 2 2 3 5 4 414 2 1 2 2 4 4 3 2 2 2 1 1 1 1 1 1 1 1 1 1 1 0 1 1 215 1 1 1 2 1 1 1 1 0 0 1 1 0 1 0 0 0 0 2 1 0 0 0 0 116 1 1 1 1 0 0 0 0 0 0 0 2 1 0 2 0 0 0 0 0 0 0 3 6 117 2 1 1 1 1 1 1 1 1 1 0 0 0 1 2 2 2 2 2 3 2 1 3 118 3 1 2 4 4 6 4 4 2 0 0 4 0 0 0 0 0 0 1 1 1 2 2 2 219 1 1 2 2 2 2 2 2 2 1 1 0 0 0 1 2 2 8 2 2 4 6 6 2 2
Mean 2 2 1 2 2 2 2 2 2 3 3 2 2 2 3 2 2 3 3 2 2 2 2 2
Total Number of Observations = 714 Mean = 2* Indicates Insufficient Data Capture; Not Included in Summaries
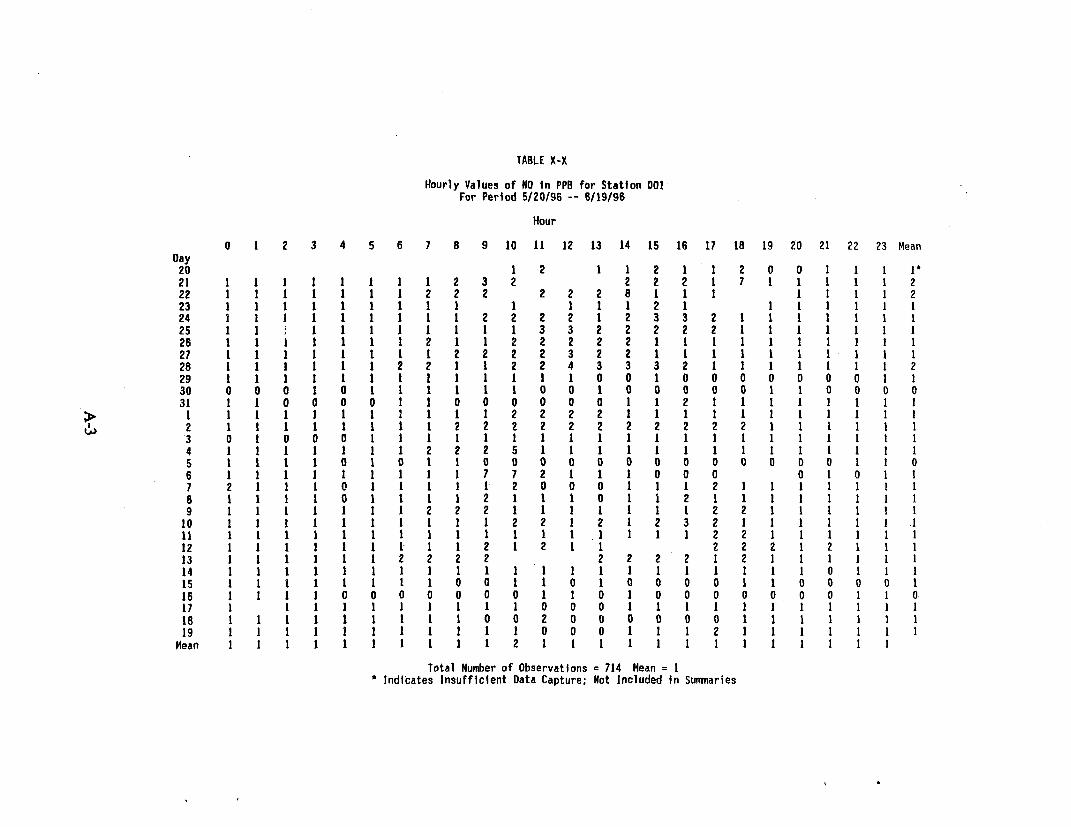
TABLE X-X
Hourly Values of NO in PPB for Station 001For Period 5/20/96 -- 6/19/96
Hour
0 1 2 3 4 5 6 7 8 9 10 11 12 13 14 15 16 17 18 19 20 21 22 23 MeanDay20 1 2 1 1 2 1 1 2 0 0 1 1 121 1 1 1 1 1 1 1 1 2 3 2 2 2 2 1 7 1 1 1 1 1 222 1 1 1 1 1 1 1 2 2 2 2 2 2 8 1 1 1 1 1 1 1 223 1 1 1 1 1 1 1 1 1 1 1 1 1 2 1 1 1 1 1 1 124 1 1 1 1 1 1 1 1 1 2 2 2 2 1 2 3 3 2 1 1 1 1 1 1 125 1 1 I I I I I I I 1 3 3 2 2 2 2 2 1 1 1 1 1 1 126 1 1 1 1 1 1 1 2 1 1 2 2 2 2 2 1 1 1 1 1 1 1 1 1 127 1 1 1 1 1 1 1 1 2 2 2 2 3 2 2 1 1 1 1 1 1 1 1 1 128 1 1 1 1 1 1 2 2 1 1 2 2 4 3 3 3 2 1 1 1 1 1 1 1 229 1 1 1 1 1 1 1 1 1 1 1 1 1 0 0 1 0 0 0 0 0 0 0 1 130 0 0 0 1 0 1 1 1 1 1 1 0 0 1 0 0 0 0 0 1 1 0 0 0 031 1 1 0 0 0 0 1 1 0 0 0 0 0 0 1 1 2 1 1 1 1 1 1 1 11 1 1 1 1 1 1 1 1 1 1 2 2 2 2 1 1 1 1 1 1 1 1 1 1 12 1 1 1 1 1 1 1 1 2 2 2 2 2 2 2 2 2 2 2 1 1 1 1 1 13 0 1 0 0 0 1 1 1 1 1 1 1 1 1 1 1 1 1 1 1 1 1 1 1 14 1 1 1 1 1 1 1 2 2 2 5 1 1 1 1 1 1 1 1 1 1 1 1 1 15 1 1 1 1 0 1 0 1 1 0 0 0 0 0 0 0 0 0 0 0 0 0 1 1 06 1 1 1 1 1 1 1 1 1 7 7 2 1 1 1 0 0 0 0 1 0 1 17 2 1 1 1 0 1 1 1 1 1 2 0 0 0 1 1 1 2 1 1 1 1 1 1 18 1 1 1 1 0 1 1 1 1 2 1 1 1 0 1 1 2 1 1 1 1 1 1 1 19 1 1 1 1 1 1 1 2 2 2 1 1 1 1 1 1 1 2 2 1 1 1 1 1 110 1 1 1 1 1 1 1 1 1 1 2 2 1 2 1 2 3 2 1 1 1 1 1 1 111 1 1 1 1 1 1 1 1 1 1 1 1 1 1 1 1 1 2 2 1 1 1 1 1 112 1 1 1 1 1 1 1 1 1 2 1 2 1 1 2 2 2 1 2 1 1 113 1 1 1 1 1 1 2 2 2 2 2 2 2 2 1 2 1 1 1 1 1 114 1 1 1 1 1 1 1 1 1 1 1 1 1 1 1 1 1 1 1 1 1 0 1 1 115 1 1 1 1 1 1 0 0 1 1 0 1 0 0 0 0 1 1 0 0 I 0 116 1 1 1 1 0 0 0 0 0 0 0 1 1 0 1 0 0 0 0 0 0 0 1 1 017 1 1 1 1 1 1 1 1 1 1 0 0 0 1 1 1 1 1 1 1 1 1 1 118 1 1 1 1 1 1 1 1 1 0 0 2 0 0 0 0 0 0 1 1 1 1 1 1 119 1 1 1 1 1 1 1 1 1 1 1 0 0 0 1 1 1 2 1 1 1 1 1 1 1Mean I I I I I I I I I 1 2 1 1 1 1 1 1 1 1 1 1 1 1 1
Total Number of Observations = 714 Mean = I* Indicates Insufficient Data Capture; Not Included in Summarles
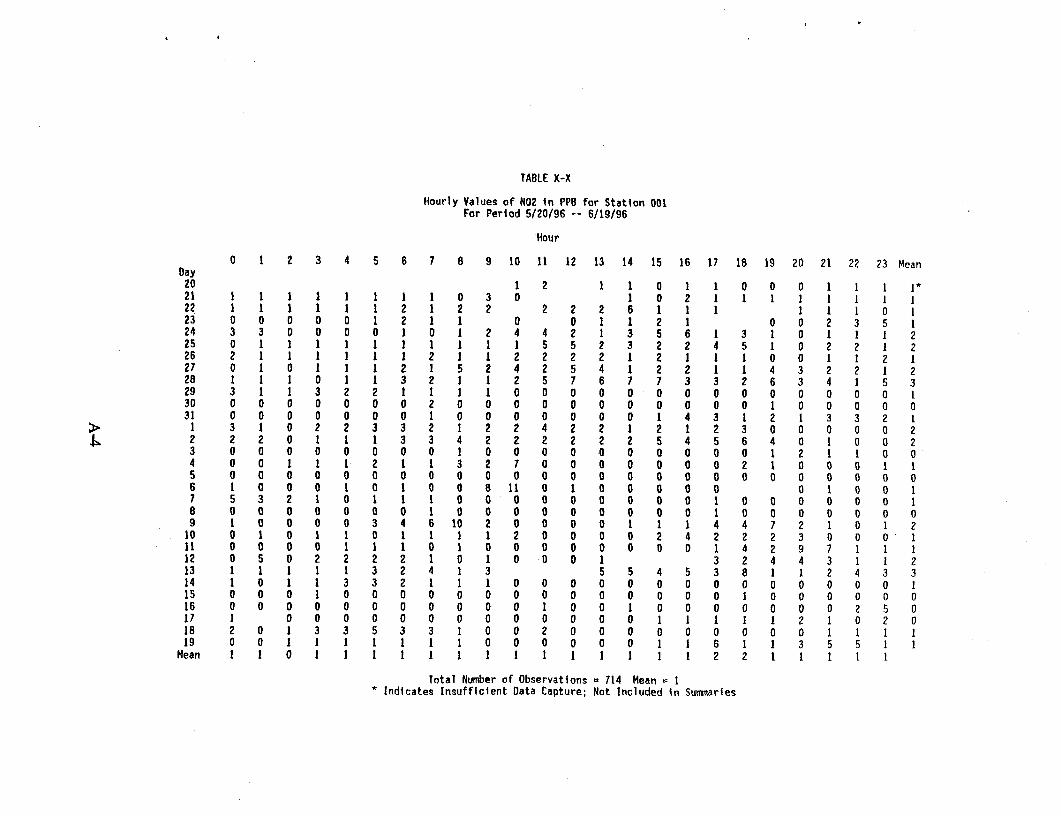
TABLE X-X
Hourly Values of N02 in PPB for Station 001For Period 5/20/96 -- 6/19/96
Hour
0 1 2 3 4 5 6 7 8 9 10 11 12 13 14 15 16 17 18 19 20 21 22 23 MeanDay20 1 2 1 1 0 1 1 0 0 0 1 1 1 121 1 1 1 1 1 1 1 1 0 3 0 1 0 2 1 1 1 1 1 1 1 122 1 1 1 1 1 1 2 1 2 2 2 2 2 6 1 1 1 1 1 1 0 123 0 0 0 0 0 1 2 1 1 0 0 1 1 2 1 0 0 2 3 5 124 3 3 0 0 0 0 1 0 1 2 4 4 2 1 3 5 6 1 3 1 0 1 1 1 225 0 1 1 1 1 1 1 1 1 1 1 5 5 2 3 2 2 4 5 1 0 2 2 1 226 2 1 1 1 1 1 1 2 1 1 2 2 2 2 1 2 1 1 1 0 0 1 1 2 127 0 1 0 1 1 1 2 1 5 2 4 2 5 4 1 2 2 1 1 4 3 2 2 1 228 1 1 1 0 1 1 3 2 1 1 2 5 7 6 7 7 3 3 2 6 3 4 1 5 329 3 1 1 3 2 2 1 1 1 1 0 0 0 0 0 0 0 0 0 0 0 0 0 0 130 0 0 0 0 0 0 0 2 0 0 0 0 0 0 0 0 0 0 0 1 0 0 0 0 031 0 0 0 0 0 0 0 1 0 0 0 0 0 0 0 1 4 3 1 2 1 3 3 2 11 3 1 0 2 2 3 3 2 1 2 2 4 2 2 1 2 1 2 3 0 0 0 0 0 22 2 2 0 1 1 1 3 3 4 2 2 2 2 2 2 5 4 5 6 4 0 1 0 0 23 0 0 0 0 0 0 0 0 1 0 0 0 0 0 0 0 0 0 0 1 2 1 1 0 04 0 0 1 1 1 2 1 1 3 2 7 0 0 0 0 0 0 0 2 1 0 0 0 1 15 0 0 0 0 0 0 0 0 0 0 0 0 0 0 0 0 0 0 0 0 0 0 0 0 06 1 0 0 0 1 0 1 0 0 8 11 0 1 0 0 0 0 0 0 1 0 0 17 5 3 2 1 0 1 1 1 0 0 0 0 O O O O 0 1 0 0 0 0 0 18 0 0 0 0 0 0 0 1 0 0 0 O O O 0 0 0 1 0 0 0 0 0 0 09 I 0 0 0 0 3 4 6 10 2 0 0 0 0 I I 1 4 4 7 2 1 0 1 210 0 1 0 1 1 0 1 1 1 1 2 0 0 0 0 2 4 2 2 2 3 0 0 0 111 0 0 0 0 1 1 1 0 1 0 0 0 0 0 0 0 0 1 4 2 9 7 1 1 112 0 5 0 2 2 2 2 1 0 1 0 0 0 1 3 2 4 4 3 1 1 213 1 1 1 1 1 3 2 4 1 3 5 5 4 5 3 8 1 1 2 4 3 314 1 0 1 1 3 3 2 1 1 1 0 0 0 0 0 0 0 0 0 0 0 0 0 0 115 0 0 0 1 0 0 0 0 0 0 0 0 0 0 0 0 0 0 1 0 0 0 0 0 016 0 0 0 0 0 0 0 0 0 0 0 1 0 0 1 0 0 0 0 0 0 0 2 5 017 1 0 0 0 0 0 0 0 0 0 0 0 0 0 1 1 1 1 1 2 1 0 2 018 2 0 1 3 3 5 3 3 1 0 0 2 0 0 0 0 0 0 0 0 0 1 1 1 119 0 0 1 1 1 1 1 1 1 0 0 0 0 0 0 1 1 6 1 1 3 5 5 1 1Mean I I 0 1 1 1 1 1 1 1 1 1 1 1 1 1 1 2 2 1 1 1 1 1
Total Number of Observations 714 Mean = I* Indicates Insufficient Data Capture; Not Included in Summaries
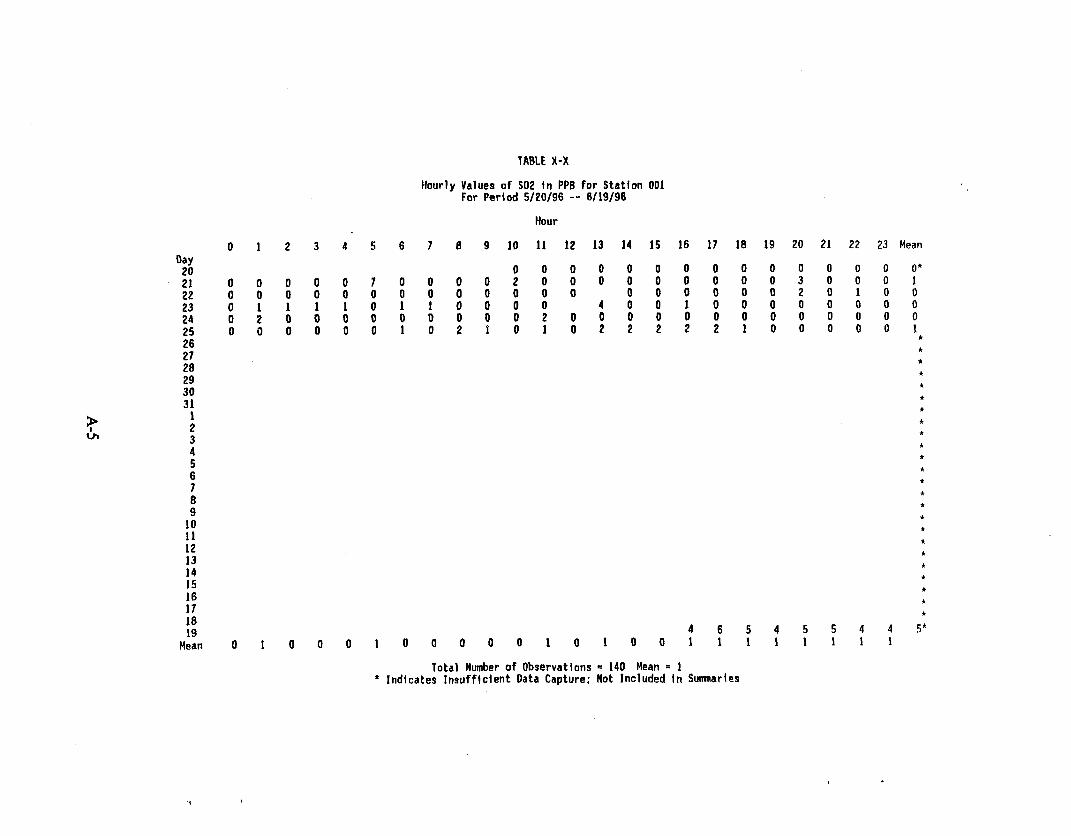
TABLE X-X
Hourly Values of S02 in PPB for Station 001For Period 5/20/96 -- 6119/96
Hour
0 1 2 3 4 5 6 7 8 9 10 11 12 13 14 15 16 17 18 19 20 21 22 23 MeanDay20 0 0 0 0 0 0 0 0 0 0 0 0 0 0 0*21 0 0 0 0 0 7 0 0 0 0 2 0 0 0 0 0 0 0 0 0 3 0 0 0 122 0 0 0 0 0 0 0 0 0 0 0 0 0 0 0 0 0 0 0 2 0 1 0 023 0 1 1 1 1 0 1 1 0 0 0 0 4 0 0 1 0 0 0 0 0 0 0 024 0 2 0 0 0 0 0 0 0 0 0 2 0 0 0 0 0 0 0 0 0 0 0 0 025 0 0 0 0 0 0 1 0 2 1 0 1 0 2 2 2 2 2 1 0 0 0 0 0 126272829 *3031 *
e ' ~~~~~~~~~~~~~~~~~~~~~~~~~~~~~~~~~~~~~~~~~~~~~~~~~~~~~**en 3
4*5 *
6 *
7*8*9*
1011*12*13*14 *
15 ~~~~~~~~~~~~~~~~~~~~~~~~~~~~~~~~~~~~~~~~~~~~~~~~~~~~*
161718 *19 4 6 5 4 5 5 4 4 5*Mean 0 1 0 0 0 1 0 0 0 0 0 1 0 1 0 0 1 1 1 1 1 1 1 1
Total Number of Observations 140 Mean = I* Indicates Insufficient Data Capture; Not Included in Summaries
Appendix B
Hourly Summaries of Meteorological Data

I I I
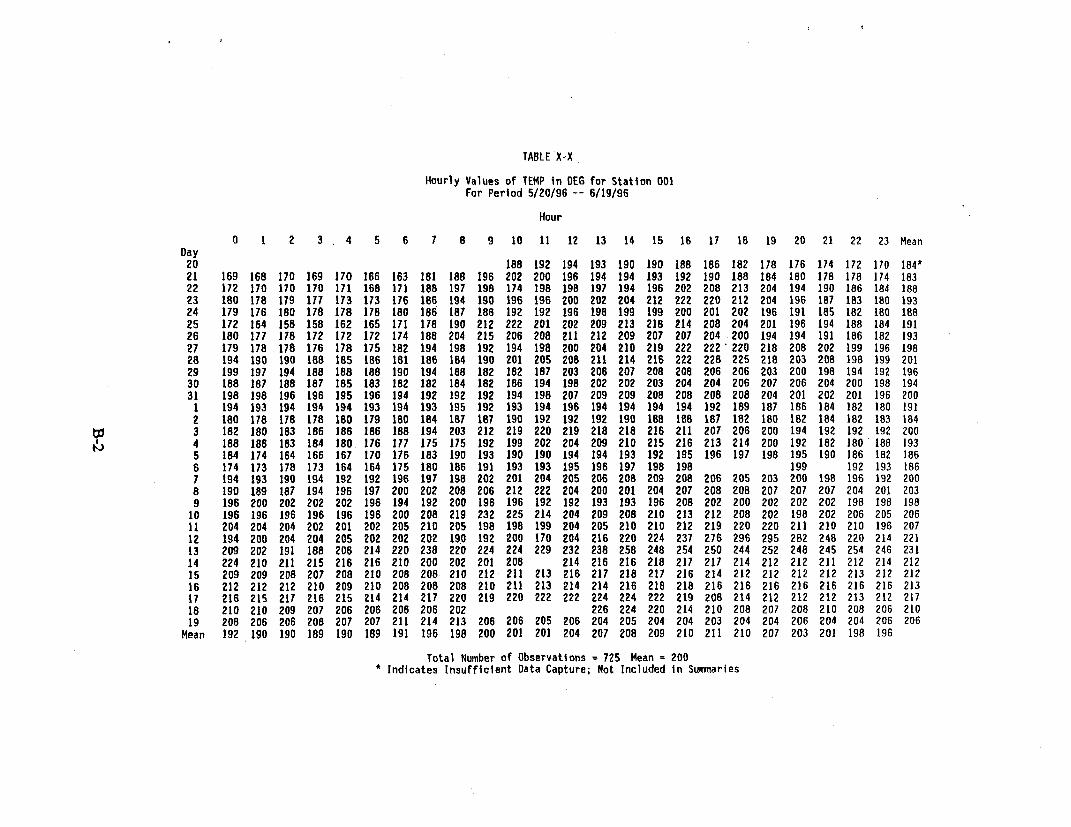
TABLE X-X
Hourly Values of TEMP in DEG for Station 001For Period 5/20/96 -- 6/19/96
Hour
0 1 2 3 4 5 6 7 8 9 10 11 12 13 14 15 16 17 18 19 20 21 22 23 MeanDay20 188 192 194 193 190 190 188 186 182 178 176 174 172 170 184*21 169 168 170 169 170 166 163 181 188 196 202 200 196 194 194 193 192 190 188 184 180 178 178 174 18322 172 170 170 170 171 168 171 188 197 198 174 198 198 197 194 196 202 208 213 204 194 190 186 184 18823 180 178 179 177 173 173 176 186 194 190 196 196 200 202 204 212 222 220 212 204 196 187 183 180 19324 179 176 180 178 178 178 180 186 181 188 192 192 196 198 199 199 200 201 202 196 191 185 182 180 18825 172 164 158 158 162 165 171 178 190 212 222 201 202 209 213 218 214 208 204 201 196 194 188 184 19126 180 177 178 172 172 172 174 188 204 215 206 208 211 212 209 207 207 204 200 194 194 191 186 182 19327 179 178 178 176 178 175 182 194 198 192 194 198 200 204 210 219 222 222- 220 218 208 202 199 196 19828 194 190 190 188 185 186 181 186 184 190 201 205 208 211 214 216 222 228 225 218 203 208 198 199 20129 199 197 194 188 188 188 190 194 188 182 182 187 203 206 207 208 208 206 206 203 200 198 194 192 19630 188 187 188 187 185 183 182 182 184 182 186 194 198 202 202 203 204 204 206 207 206 204 200 198 19431 198 198 196 196 195 196 194 192 192 192 194 198 207 209 209 208 208 208 208 204 201 202 201 196 2001 194 193 194 194 194 193 194 193 195 192 193 194 196 194 194 194 194 192 189 187 186 184 182 180 1912 180 178 178 178 180 179 180 184 187 187 190 192 192 192 190 188 188 187 182 180 182 184 182 183 1843 182 180 183 186 186 186 188 194 203 212 219 220 219 218 218 216 211 207 206 200 194 192 192 192 2004 188 186 183 184 180. 176 177 175 175 192 199 202 204 209 210 215 216 213 214 200 192 182 180 188 1935 184 174 164 166 167 170 176 183 190 193 190 190 194 194 193 192 195 196 197 198 195 190 186 182 1866 174 173 178 173 164 164 175 180 186 191 193 193 195 196 197 198 198 199 192 193 1867 194 193 190 194 192 192 196 197 198 202 201 204 205 206 208 209 208 206 205 203 200 198 196 192 2008 190 189 187 194 196 197 200 202 208 206 212 222 204 200 201 204 207 208 208 207 207 207 204 201 2039 196 200 202 202 202 196 194 192 200 196 196 192 192 193 193 196 208 202 200 202 202 202 198 198 19810 196 196 196 196 196 196 200 208 219 232 225 214 204 209 208 210 213 212 208 202 198 202 206 205 20611 204 204 204 202 201 202 205 210 205 198 198 199 204 205 210 210 212 219 220 220 211 210 210 196 20712 194 200 204 204 205 202 202 202 19O 192 200 170 204 216 220 224 237 276 296 295 282 248 220 214 22113 209 202 191 188 206 214 220 238 220 224 224 229 232 238 258 248 254 250 244 252 248 245 254 246 23114 224 210 211 215 216 216 210 200 202 201 208 214 216 216 218 217 217 214 212 212 211 212 214 21215 209 209 208 207 208 210 208 208 210 212 211 213 216 217 218 217 216 214 212 212 212 212 213 212 21216 212 212 212 210 209 210 208 208 208 210 211 213 214 214 216 218 218 216 216 216 216 216 216 216 21317 216 215 217 216 215 214 214 217 220 219 220 222 222 224 224 222 219 208 214 212 212 212 213 212 21718 210 210 209 207 206 206 206 206 202 226 224 220 214 210 208 207 208 210 208 206 21019 208 206 206 208 207 207 211 214 213 206 206 205 206 204 205 204 204 203 204 204 206 204 204 206 206Mean 192 190 190 189 190 189 191 196 198 200 201 201 204 207 208 209 210 211 210 207 203 201 198 196
Total Number of Observations = 725 Mean = 200* Indicates Insufficient Data Capture; Not Included in Summaries
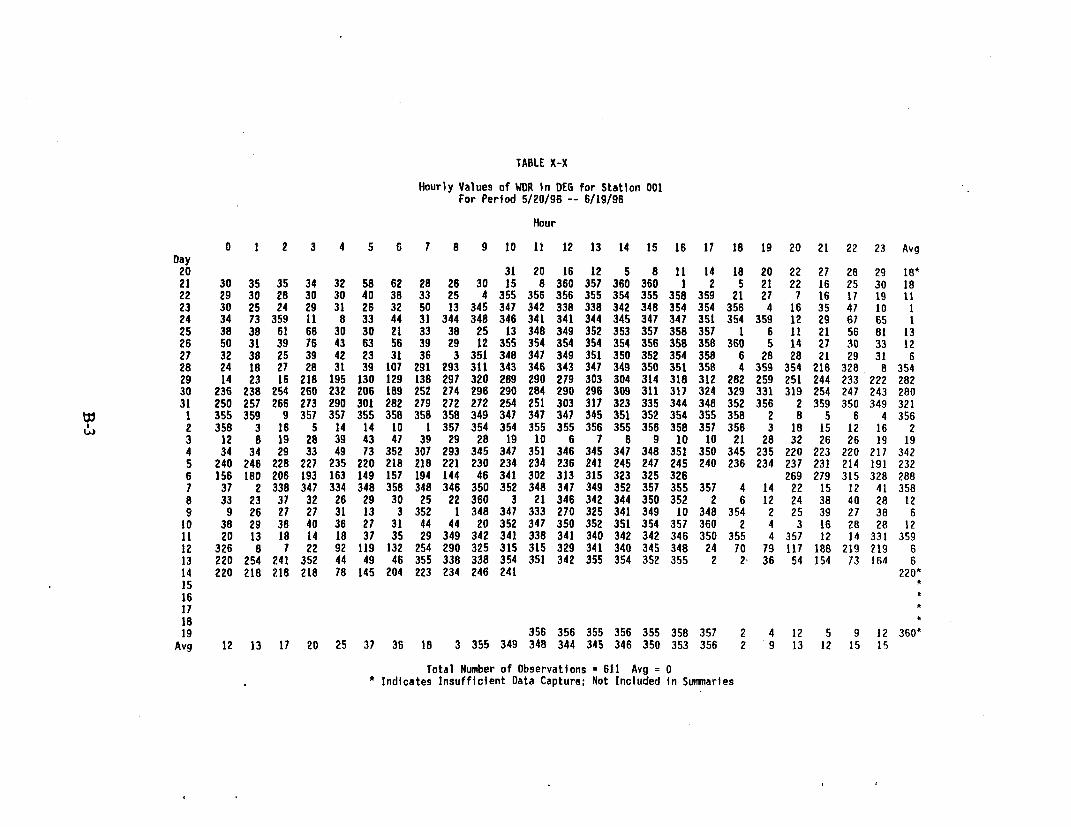
TABLE X-X
Hourly Values of WOR in DEG for Station 001For Period 5/20/96 -- 6/19/96
Hour
0 1 2 3 4 5 6 7 8 9 10 11 12 13 14 15 16 17 18 19 20 21 22 23 AvgDay20 31 20 16 12 5 8 11 14 18 20 22 27 28 29 18*21 30 35 35 34 32 58 62 28 26 30 15 8 360 357 360 360 1 2 5 21 22 16 25 30 1822 29 30 28 30 30 40 38 33 25 4 355 356 356 355 354 355 358 359 21 27 7 16 17 19 1123 30 25 24 29 31 26 32 50 13 345 347 342 338 338 342 348 354 354 356 4 16 35 47 10 124 34 73 359 11 8 33 44 31 344 348 346 341 341 344 345 347 347 351 354 359 12 29 67 65 125 38 38 61 66 301 1 33 38 25 13 348 349 352 353 357 358 357 1 6 11 21 56 81 1326 50 31 39 76 43 63 56 39 29 12 355 354 354 354 354 356 358 358 360 5 14 27 30 33 1227 32 38 25 39 42 23 31 36 3 351 348 347 349 351 350 352 354 358 6 28 28 21 29 31 628 24 18 27 28 31 39 107 291 293 311 343 346 343 347 349 350 351 358 4 359 354 216 328 8 35429 14 23 16 218 195 130 129 138 297 320 289 290 279 303 304 314 318 312 282 259 251 244 233 222 28230 236 238 254 260 232 206 189 252 274 296 290 284 290 296 309 311 317 324 329 331 319 254 247 243 28031 250 257 266 273 290 301 282 279 272 272 254 251 303 317 323 335 344 348 352 356 2 359 350 349 3211 355 359 9 357 357 355 358 358 358 349 347 347 347 345 351 352 354 355 358 2 8 5 6 4 3562 358 3 16 5 14 14 10 1 357 354 354 355 355 356 355 356 358 357 356 3 18 15 12 16 23 12 8 19 28 39 43 47 39 29 28 19 10 6 7 6 9 10 10 21 28 32 26 26 19 194 34 34 29 33 49 73 352 307 293 345 347 351 346 345 347 348 351 350 345 235 220 223 220 217 3425 240 246 228 227 235 220 218 218 221 230 234 234 236 241 245 247 245 240 236 234 237 231 214 191 2326 156 180 206 193 163 149 157 194 144 46 341 302 313 315 323 325 326 269 279 315 328 2887 37 2 338 347 334 348 358 348 346 350 352 348 347 349 352 357 355 357 4 14 22 15 12 41 3588 33 23 37 32 26 29 30 25 22 360 3 21 346 342 344 350 352 2 6 12 24 38 40 28 129 9 26 27 27 31 13 3 352 1 348 347 333 270 325 341 349 10 348 354 2 25 39 27 38 610 38 29 38 40 36 27 31 4 4 20 352 347 350 352 351 354 357 360 2 4 3 16 28 28 1211 20 13 18 14 18 37 35 29 349 342 341 338 341 340 342 342 346 350 355 4 357 12 14 331 35912 326 8 7 22 92 119 132 254 290 325 315 315 329 341 340 345 348 24 70 79 117 188 219 219 613 220 254 241 352 44 49 46 355 338 338 354 351 342 355 354 352 355 2 2 36 54 154 73 164 614 220 218 218 218 78 145 204 223 234 246 241 220*15 *16 *1718 *19 356 356 355 356 355 358 357 2 4 12 5 9 12 360*Avg 12 13 17 20 25 37 36 18 3 355 349 348 344 345 346 350 353 356 2 9 13 12 15 15
Total Number of Observations = 611 Avg = 0* Indicates Insufficient Data Capture; Not Included in Summaries
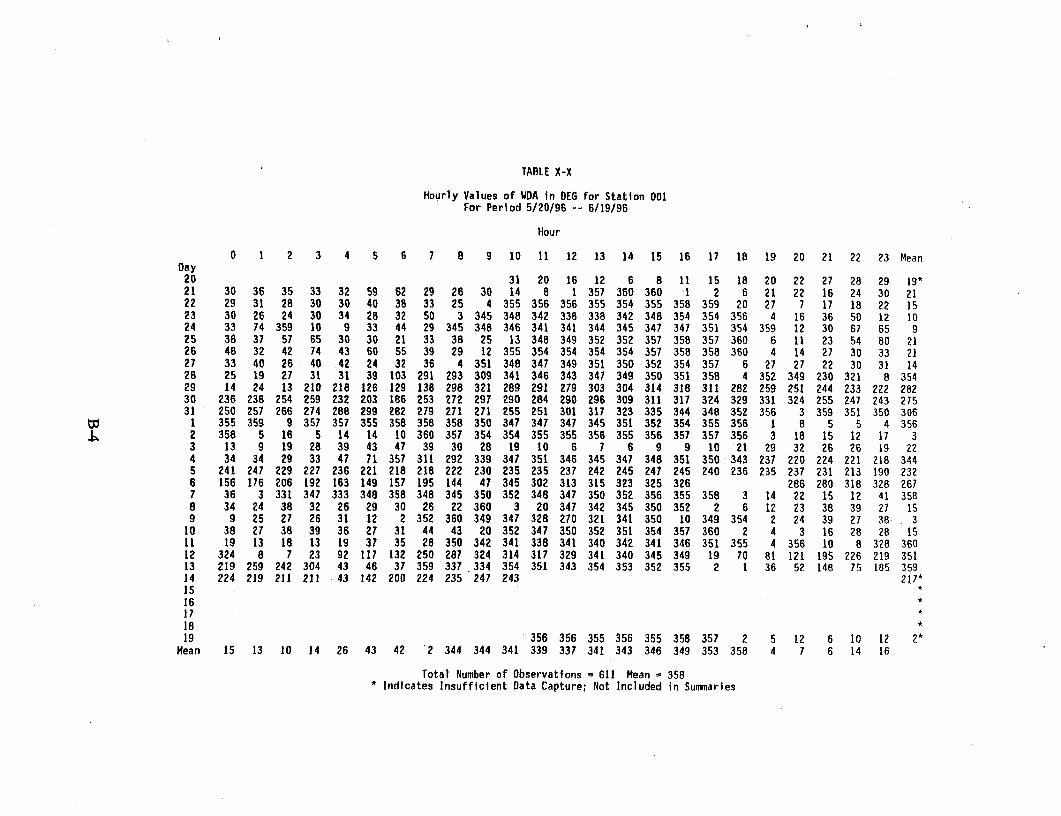
TABLE X-X
Hourly Values of WDA In DEG for Station 001For Period 5/20/96 -- 6/19/96
Hour
0 1 2 3 4 5 6 7 8 9 10 11 12 13 14 15 16 17 18 19 20 21 22 23 MeanDay20 31 20 16 12 6 8 11 15 18 20 22 27 28 29 19*21 30 36 35 33 32 59 62 29 26 30 14 8 1 357 360 360 1 2 6 21 22 16 24 30 2122 29 31 28 30 30 40 38 33 25 4 355 356 356 355 354 355 358 359 20 27 7 17 18 22 1523 30 26 24 30 34 28 32 50 3 345 348 342 338 338 342 348 354 354 356 4 16 36 50 12 1024 33 74 359 10 9 33 44 29 345 348 346 341 341 344 345 347 347 351 354 359 12 30 67 65 925 38 37 57 65 30 30 21 33 38 25 13 348 349 352 352 357 358 357 360 6 11 23 54 80 2126 48 32 42 74 43 60 55 39 29 12 355 354 354 354 354 357 358 358 360 4 14 27 30 33 2127 33 40 26 40 42 24 32 36 4 351 348 347 349 351 350 352 354 357 6 27 27 22 30 31 1428 25 19 27 31 31 39 103 291 293 309 341 346 343 347 349 350 351 358 4 352 349 230 321 8 35429 14 24 13 210 218 126 129 138 298 321 289 291 279 303 304 314 318 311 282 259 251 244 233 222 28230 236 238 254 259 232 203 186 253 272 297 290 284 290 296 309 311 317 324 329 331 324 255 247 243 27531 250 257 266 274 288 299 282 279 271 271 255 251 301 317 323 335 344 348 352 356 3 359 351 350 3061 355 359 9 357 357 355 358 358 358 350 347 347 347 345 351 352 354 355 356 1 8 5 5 4 3562 358 5 16 5 14 14 10 360 357 354 354 355 355 356 355 356 357 357 356 3 18 15 12 17 33 13 9 19 28 39 43 47 39 30 28 19 10 6 7 6 9 9 10 21 29 32 26 26 19 224 34 34 29 33 47 71 357 311 292 339 347 351 346 345 347 348 351 350 343 237 220 224 221 218 3445 241 247 229 227 236 221 218 218 222 230 235 235 237 242 245 247 245 240 236 235 237 231 213 190 2326 156 176 206 192 163 149 157 195 144 47 345 302 313 315 323 325 326 286 280 318 328 2677 36 3 331 347 333 348 358 348 345 350 352 348 347 350 352 356 355 358 3 14 22 15 12 41 3588 34 24 38 32 26 29 30 26 22 360 3 20 347 342 345 350 352 2 6 12 23 38 39 27 159 9 25 27 26 31 12 2 352 360 349 347 328 270 321 341 350 10 349 354 2 24 39 27 38 310 38 27 38 39 36 27 31 44 43 20 342 347 350 352 351 354 357 360 2 4 3 16 28 28 1511 19 13 18 13 19 37 35 28 350 342 341 338 341 340 342 341 346 351 355 4 356 10 8 328 36012 324 8 7 23 92 117 132 250 287 324 314 317 329 341 340 345 349 19 70 81 121 195 226 219 35113 219 259 242 304 43 46 37 359 337 334 354 351 343 354 353 352 355 2 1 36 52 148 75 185 35914 224 219 211 211 43 142 200 224 235 247 243 217*15 *16 *17 *18 *19 356 356 355 356 355 358 357 2 5 12 6 10 12 2*
Mean 15 13 10 14 26 43 42 *2 344 344 341 339 337 341 343 346 349 353 358 4 7 6 14 16
Total Number of Observations = 611 Mean = 358* Indicates Insufficient Data Capture; Not Included in Summarles
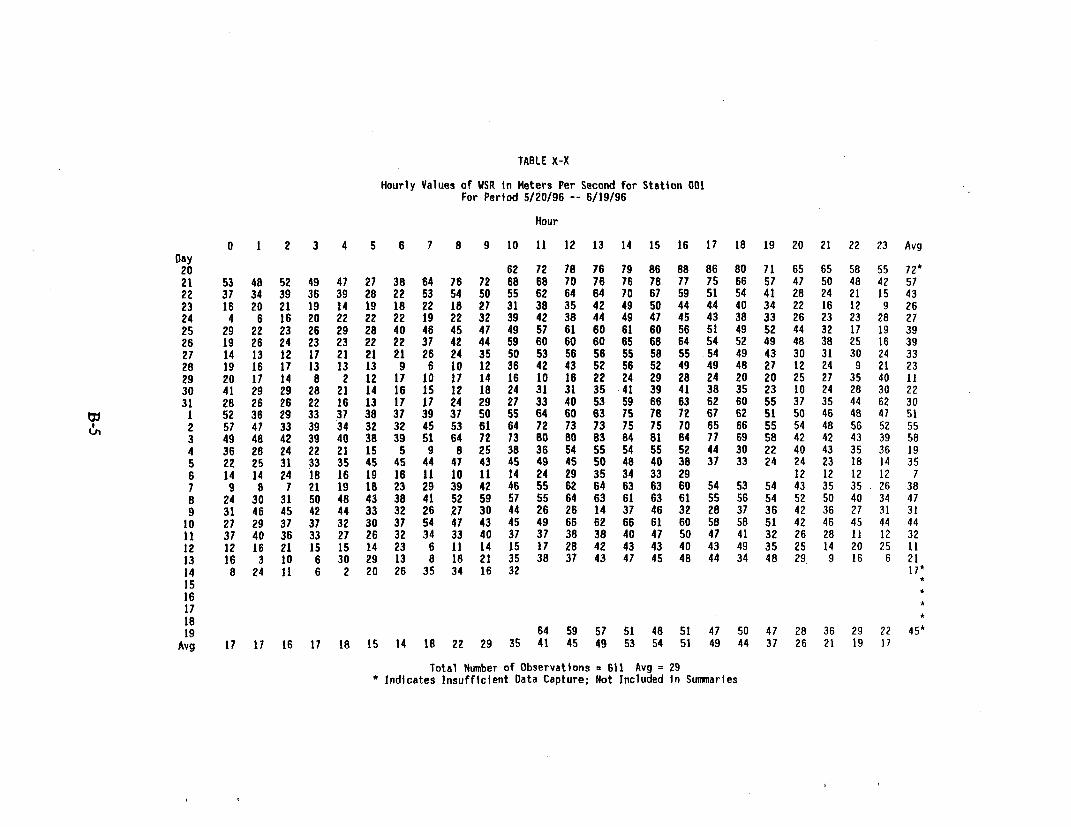
TABLE X-X
Hourly Values of WSR in Meters Per Second for Station 001For Period 5/20/96 -- 6/19/96
Hour
0 1 2 3 4 5 6 7 8 9 10 11 12 13 14 15 16 17 18 19 20 21 22 23 AvgDay20 62 72 78 76 79 86 88 86 80 71 65 65 58 55 72*21 53 48 52 49 47 27 38 64 76 72 68 68 70 76 76 78 77 75 66 57 47 50 48 42 5722 37 34 39 36 39 28 22 53 54 50 55 62 64 64 70 67 59 51 54 41 28 24 21 15 4323 16 20 21 19 14 19 18 22 18 27 31 38 35 42 49 50 44 44 40 34 22 16 12 9 2624 4 6 16 20 22 22 22 19 22 32 39 42 38 44 49 47 45 43 38 33 26 23 23 28 2725 29 22 23 26 29 28 40 46 45 47 49 57 61 60 61 60 56 51 49 52 44 32 17 19 3926 19 26 24 23 23 22 22 37 42 44 59 60 60 60 65 68 64 54 52 49 48 38 25 16 3927 14 13 12 17 21 21 21 26 24 35 50 53 56 56 55 58 55 54 49 43 30 31 30 24 3328 19 16 17 13 13 13 9 6 10 12 36 42 43 52 56 52 49 49 48 27 12 24 9 21 2329 20 17 14 8 2 12 17 10 17 14 16 10 16 22 24 29 28 24 20 20 25 27 35 40 1130 41 29 29 28 21 14 16 15 12 18 24 31 31 35 41 39 41 38 35 23 10 24 28 30 2231 28 26 26 22 16 13 17 17 24 29 27 33 40 53 59 66 63 62 60 55 37 35 44 62 301 52 36 29 33 37 38 37 39 37 50 55 64 60 63 75 78 72 67 62 51 50 46 48 47 512 57 47 33 39 34 32 32 45 53 61 64 72 73 73 75 75 70 65 66 55 54 48 56 52 553 49 48 42 39 40 38 39 51 64 72 73 80 80 83 84 81 84 77 69 58 42 42 43 39 584 36 28 24 22 21 15 5 9 8 25 38 36 54 55 54 55 52 44 30 22 40 43 35 36 195 22 25 31 33 35 45 45 44 47 43 45 49 45 50 48 40 38 37 33 24 24 23 18 14 356 14 14 24 18 16 19 16 11 10 It 14 24 29 35 34 33 29 12 12 12 12 77 9 8 7 21 19 18 23 29 39 42 46 55 62 64 63 63 60 54 53 54 43 35 35. 26 388 24 30 31 50 48 43 38 41 52 59 57 55 64 63 61 63 61 55 56 54 52 50 40 34 479 31 46 45 42 44 33 32 26 27 30 44 26 26 14 37 46 32 28 37 36 42 36 27 31 3110 27 29 37 37 32 30 37 54 47 43 45 49 66 62 66 61 60 58 58 51 42 46 45 44 4411 37 40 36 33 27 26 32 34 33 40 37 37 38 38 40 47 50 47 41 32 26 28 11 12 3212 12 16 21 15 15 14 23 6 11 14 15 17 28 42 43 43 40 43 49 35 25 14 20 25 1113 16 3 10 6 30 29 13 8 18 21 35 38 37 43 47 45 48 44 34 48 29 9 16 6 2114 8 24 11 6 2 20 26 35 34 16 32 17*15 *1617 *18 *19 64 59 57 51 48 51 47 50 47 28 36 29 22 45*Avg 17 11 16 17 18 15 14 18 22 29 35 41 45 49 53 54 51 49 44 37 26 21 19 17
Total Number of Observations = 611 Avg = 29* Indicates Insufficient Data Capture; Not Included In Summaries
TABLE X-X
Hourly Values of WSA in Meters Per Second for Station 001For Period 5/20/96 -- 6/19/96
Hour
0 1 2 3 4 5 6 7 8 9 10 11 12 13 14 15 16 17 18 19 20 21 22 23 MeanDay20 64 75 80 78 80 88 90 88 81 72 65 66 59 56 74*21 54 48 53 50 47 30 39 64 78 73 69 70 72 78 78 80 78 76 67 58 47 51 49 42 6022 38 35 39 36 39 28 22 54 55 51 55 64 65 64 70 68 59 51 55 42 28 24 21 16 4523 16 20 21 20 15 19 19 23 23 27 31 38 35 42 49 50 44 44 41 34 22 16 12 9 2824 6 10 16 21 23 22 22 21 23 32 39 42 38 44 49 47 45 43 38 33 26 24 23 29 3025 30 22 25 27 29 29 40 46 47 48 52 57 61 60 61 60 57 51 50 52 44 33 19 20 4326 21 27 25 24 24 24 23 38 43 46 59 61 61 60 66 69 65 55 52 50 48 39 25 16 4327 14 13 12 17 21 22 22 27 28 36 50 53 56 56 55 58 55 54 50 43 31 31 30 24 3628 19 16 17 13 13 14 11 9 10 13 38 42 43 52 56 52 49 49 49 30 13 30 16 22 2829 21 17 15 14 9 13 17 14 18 14 17 11 17 22 24 29 29 24 20 21 25 27 36 41 2130 42 30 30 30 22 17 18 17 17 18 24 31 32 35 41 39 41 38 35 23 14 24 28 31 2831 28 27 26 22 17 14 18 19 24 29 27 33 42 53 59 66 64 63 61 55 37 35 44 63 391 52 37 29 33 38 38 37 39 38 50 55 64 60 64 75 78 73 68 62 52 50 46 49 48 512 58 48 34 40 34 32 32 46 54 62 65 72 73 74 75 75 70 65 67 56 55 50 57 53 563 50 49 43 40 41 39 40 52 65 73 74 81 82 84 85 82 85 78 71 59 43 43 44 39 604 36 29 24 22 21 16 7 12 9 26 38 37 54 55 54 55 52 44 30 23 41 44 36 37 335 23 26 31 34 36 46 46 45 48 44 46 50 46 50 48 40 38 38 34 24 25 23 18 15 366 14 16 24 19 16 19 17 13 12 13 19 24 30 35 34 33 29 23 17 24 12 12 217 9 9 8 21 19 19 25 30 40 43 47 55 62 64 63 64 61 55 54 55 43 36 35 27 398 24 30 32 50 49 44 39 43 54 60 58 57 64 63 61 63 61 57 57 55 52 50 40 34 509 31 46 46 42 45 34 32 26 28 30 44 27 27 16 38 47 33 29 37 36 43 37 28 31 3510 27 30 38 38 32 30 38 54 48 44 47 49 66 62 67 61 61 58 58 51 42 46 46 45 4711 38 40 37 33 27 26 33 34 34 40 37 37 38 38 40 47 50 47 41 33 26 29 12 12 3512 12 16 21 16 17 17 24 10 12 14 15 17 28 42 43 43 40 47 50 36 28 18 22 25 2613 17 7 12 16 31 30 19 12 18 23 35 38 39 44 47 45 48 45 34 49 30 13 19 12 2814 13 24 12 9 5 21 29 36 34 17 32 45 44 45 44 46 46 43 42 42 22 28 16 30 3015 25 26 24 25 24 22 26 24 23 28 26 33 36 44 46 49 51 44 38 22 32 29 22 32 3116 28 19 24 18 20 13 28 24 19 19 23 24 29 38 41 42 40 42 38 29 30 27 26 26 2817 28 22 23 21 22 16 27 18 22 26 48 51 56 64 66 66 62 63 64 64 64 64 64 64 4518 64 64 64 64 64 64 64 64 52 40 15 28 47 51 57 58 61 59 60 48 35 31 27 36 5119 39 41 35 35 46 47 40 40 49 57 62 64 59 57 51 48 51 47 50 47 29 36 30 23 45
Mean 29 28 28 28 28 27 28 32 34 37 42 46 50 53 56 56 54 51 50 43 36 35 31 31
Total Number of Observations = 732 Mean = 39* Indicates Insufficient Data Capture; Mot Included in Summaries
TABLE X-X
Hourly Values of DTEMP IN HDGC for Station 001For Period 5/20196 -- 6/19/96
Hour
0 1 2 3 4 5 6 7 8 9 10 11 12 13 14 15 16 17 18 19 20 21 22 23 MeanDay2021
*22 *23
2425
*26 *27
28 *29 *30
31 *a I *2*
34
*5 *6
7 *8 *9
1011
*1213 -498 -498 -498 -498 -498 -498 -498 -498 -499 -498 -499 -498*14 -82 -98 -105 -109 -83 -62 -44 -23 -13 -1 -3 -11 -53*15 -6 2 0 0 3 -3 -4 -15 -22 -28 -61 -86 -101 -114 -106 -89 -71 -39 -40 -30 -21 -14 -7 0 -3516 1 -3 -6 -7 -6 -3 -6 -9 -17 -29 -54 -65 -77 -91 -127 -126 -136 -129 -90 -30 -21 -8 0 13 -4317 11 6 3 -4 -6 -6 -12 -20 -42 -82 -89 -175 -185 -176 -135 -75 -52 -61*1819
Mean 2 1 -1 -3 -3 -4 -7 -15 -27 -46 -68 -109 -111 -195 -194 -179 -168 -182 -168 -145 -138 -131 -127 -124Total Number of Observations = 88 Mean = -103
* Indicates Insufficient Data Capture; Not Included in Sumaries
TABLE X-X
Hourly Values of SRAO In Watts per Meter Squared for Station 001For Period 5/20/96 -- 6/19196
Hour
0 1 2 3 4 5 6 7 8 9 10 11 12 13 14 15 16 17 18 19 20 21 22 23 MeanDay20 892 997 1036 1021 952 814 630 414 192 19 5 5 5 5 499*21 0 0 0 0 0 10 76 177 377 696 818 824 957 1011 950 781 614 417 168 25 0 0 0 0 32922 0 0 0 0 0 13 117 319 545 737 872 997 1031 1014 942 804 623 411 190 23 0 0 0 0 36023 0 0 0 0 0 14 142 323 539 745 890 990 1026 1008 945 810 632 416 197 25 0 0 0 0 36324 0 0 0 0 0 14 100 345 465 701 925 965 1000 946 854 708 622 342 198 19 0 0 0 0 34225 0 0 0 0 0 11 67 232 487 695 850 942 967 948 885 750 562 349 134 21 0 0 0 0 32926 0 0 0 0 0 14 112 298 508 703 854 954 995 982 909 764 591 381 127 20 0 0 0 0 34227 0 0 0 0 0 14 119 281 519 707 858 957 994 982 912 774 596 384 171 22 0 0 0 0 34528 0 0 0 0 0 15 126 303 507 705 872 945 988 976 910 762 579 386 174 25 0 0 0 0 34529 0 0 0 0 0 11 59 212 493 624 607 927 987 990 887 782 601 394 175 23 0 0 0 0 32430 0 0 0 0 0 9 55 139 439 732 883 978 1015 998 926 793 611 325 69 13 0 0 0 0 33331 0 0 0 0 0 10 62 139 331 539 859 936 856 822 731 412 319 230 113 16 0 0 0 0 266I 0 0 0 0 0 9 36 63 124 205 376 637 763 823 768 745 582 336 123 32 0 0 0 0 2342 0 0 0 0 0 12 89 259 427 501 746 954 979 911 849 514 577 309 109 15 0 0 0 0 3023 0 0 0 0 0 11 53 186 458 720 864 955 993 982 915 780 586 379 216 29 0 0 0 0 3394 0 0 0 0 0 16 137 299 521 715 859 954 987 977 911 775 601 401 195 29 0 0 0 0 3495 0 0 0 0 0 10 51 135 266 449 448 454 646 776 839 773 545 309 91 15 0 0 0 0 2426 5 5 5 5 5 11 41 83 155 210 336 733 896 880 813 729 522 371 5 5 5 5 2657 0 0 0 0 0 7 43 165 216 317 327 795 823 870 769 709 569 315 158 25 0 0 0 0 2558 0 0 0 0 0 9 38 140 429 645 773 844 946 929 856 728 544 288 99 21 0 0 0 0 3049 0 0 0 0 0 12 65 116 200 377 513 384 183 66 138 192 242 212 173 29 0 0 0 0 121
10 0 0 0 0 0 18 98 182 357 559 819 910 949 919 849 728 568 366 154 19 0 0 0 0 31211 0 0 0 0 0 11 79 285 493 675 819 919 955 934 864 735 570 377 183 30 0 0 0 0 33012 0 0 0 0 0 13 47 143 402 643 824 793 784 931 867 764 616 429 226 40 0 0 0 0 31313 0 0 0 0 0 12I111 310 510 684 480 797 599 842 793 721 523 155 96 22 0 0 0 0 27714 0 0 0 0 0 12 78 180 347 420 661 912 942 927 858 730 558 354 115 13 0 0 0 0 29615 0 0 0 0 0 7 30 84 137 216 443 686 894 872 812 621 431 139 59 10 0 0 0 0 22716 0 0 0 0 0 7 18 45 111 92 332 438 515 623 848 727 558 363 159 18 0 0 0 0 20617 0 0 0 0 0 8 24 60 141 213 346 712 743 725 491 261 190 0 0 0 0 18618 0 0 0 0 0 0 0 216 434 273 573 617 425 326 230 81 30 8 3 0 0 0 14619 0 0 0 0 0 0 0 31 182 257 371 532 624 532 430 295 248 239 94 16 5 5 5 5 161
Mean 0 0 0 0 0 11 69 191 368 527 676 809 860 866 803 671 524 329 144 21 1 0 0 0
Total Number of Observations = 727 Mean = 290* Indicates Insufficient Data Capture; Not Included in Summaries
TABLE X-X
Hourly Values of TIN In DEGF for Station 001For Period 5/20/96 -- 6/19/96
Hour
0 1 2 3 4 5 6 7 6 9 10 11 12 13 14 15 16 17 18 19 20 21 22 23 MeanDay20 23 22 23 23 22 22 22 22 22 23 23 24 23 23 23*21 23 23 23 24 24 24 24 23 24 23 25 26 24 26 25 25 24 24 23 23 24 24 24 24 2422 24 24 24 24 25 25 24 24 24 24 24 24 24 24 24 24 24 24 24 24 23 24 24 24 2423 25 24 25 24 24 24 24 24 24 24 23 23 23 24 24 24 24 22 24 23 23 23 23 24 2424 23 23 23 23 23 23 23 23 23 23 23 22 21 24 24 23 23 23 23 23 23 23 22 22 2325 23 23 23 23 23 23 22 22 22 22 22 23 23 23 23 23 23 23 23 23 22 22 22 22 2326 22 23 23 23 23 23 22 22 22 22 23 23 23 22 22 22 22 22 22 22 22 22 22 22 2227 22 22 22 22 22 22 22 22 22 22 22 22 22 22 22 22 22 22 22 22 22 22 22 22 2228 22 22 22 22 22 22 22 22 22 22 23 24 25 25 26 26 26 26 26 26 26 26 26 26 2429 26 26 26 26 26 26 26 26 24 21 22 22 22 22 22 22 22 22 22 22 22 22 21 21 2330 21 22 22 22 22 22 22 21 22 22 22 22 22 22 22 22 22 22 22 22 22 22 22 22 2231 22 22 22 22 22 22 22 22 22 22 22 22 22 21 22 22 22 22 22 22 22 22 22 22 221 22 22 22 22 22 22 22 22 22 21 21 21 21 21 21 21 21 21 21 21 21 21 21 21 212 21 21 21 21 21 21 21 20 21 20 20 20 20 21 20 20 20 20 21 21 21 21 21 21 213 21 20 21 20 20 20 21 20 20 20 20 20 20 20 20 20 20 20 20 20 21 21 21 21 204 21 21 21 21 21 21 20 21 21 21 21 21 21 22 24 23 23 23 23 23 23 24 24 24 225 24 23 24 24 24 24 24 24 23 24 23 21 19 19 19 19 19 19 19 19 19 19 19 19 216 19 19 19 19 19 19 19 19 19 19 19 19 19 19 19 19 20 22 23 24 23 23 207 23 23 23 23 23 23 23 23 23 23 23 22 21 21 21 22 21 21 21 21 21 21 21 21 228 21 21 21 21 21 21 21 21 21 21 21 21 21 21 21 21 21 21 20 21 21 21 21 21 219 21 21 21 21 21 21 21 21 21 21 21 21 21 21 21 21 21 21 21 21 21 21 21 21 2110 21 21 21 21 21 21 21 20 20 20 23 25 25 24 23 23 23 23 23 23 23 23 23 23 2211 23 23 23 23 23 23 23 23 23 23 23 23 23 23 23 23 23 23 23 23 23 23 23 23 2312 23 23 23 23 23 23 23 23 23 23 23 23 23 23 23 ?3 23 23 23 23 23 23 23 23 2313 23 23 23 23 23 23 23 23 23 23 23 23 23 23 2 23 25 25 25 25 25 25 25 2414 25 25 25 25 25 25 25 24 24 25 24 24 24 24 25 c0 25 25 25 25 25 25 25 25 2515 25 25 25 25 25 25 24 24 24 24 24 25 25 25 25 25 25 25 25 25 25 25 25 24 2516 25 25 25 25 25 25 25 24 24 24 24 25 25 25 25 25 25 25 25 25 24 25 25 25 2517 25 25 25 24 25 24 25 24 24 24 23 25 25 25 ?' 25 25 23 23 23 23 23 23 23 2418 23 23 23 23 23 23 23 24 26 25 24 24 24 24 > I1 24 24 24 24 25 24 24 24 2419 24 24 24 24 24 24 24 24 23 23 23 24 24 24 24 24 24 24 24 24 24 24 24 24 24Mean 23 23 23 23 23 23 23 23 23 22 22 23 23 23 23 23 23 23 23 23 23 23 23 23
Total Number of Observations = 732 Mean = 23* Indicates Insufficient Data Capture; Not Included in Summaries
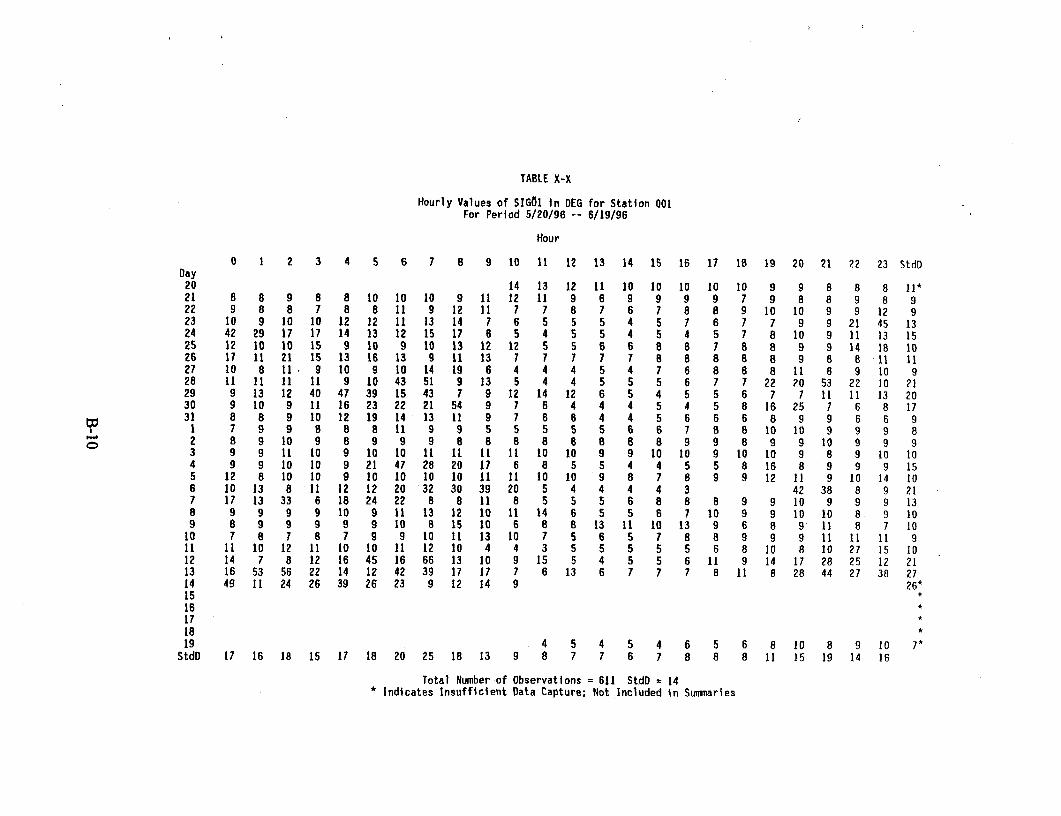
TABLE X-X
Hourly Values of SIG61 in DEG for Station 001For Period 5/20/96 -- 6/19/96
Hour
0 1 2 3 4 5 6 7 8 9 10 11 12 13 14 15 16 17 18 19 20 21 22 23 StdDDay20 14 13 12 11 10 10 10 10 10 9 9 8 8 8 11*21 8 8 9 8 8 10 10 10 9 11 12 11 9 6 9 9 9 9 7 9 8 8 9 8 922 9 8 8 7 8 8 11 9 12 11 7 7 8 7 6 7 8 8 9 10 10 9 9 12 923 10 9 10 10 12 12 11 13 14 7 6 5 5 5 4 5 7 6 7 7 9 9 21 45 1324 42 29 17 17 14 13 12 15 17 6 5 4 5 5 4 5 4 5 7 8 10 9 11 13 1525 12 10 10 15 9 10 9 10 13 12 12 5 5 6 6 8 8 7 8 8 9 9 14 18 1026 17 11 21 15 13 16 13 9 11 13 7 7 7 7 7 8 8 8 8 8 9 8 8 11 1127 10 8 11 9 10 9 10 14 19 6 4 4 4 5 4 7 6 8 8 8 11 8 9 10 928 11 11 11 11 9 10 43 51 9 13 5 4 4 5 5 5 6 7 7 22 20 53 22 10 2129 9 13 12 40 47 39 15 43 7 9 12 14 12 6 5 4 5 5 6 7 7 11 11 13 2030 9 10 9 11 16 23 22 21 54 9 7 6 4 4 4 5 4 5 8 16 25 7 6 8 1731 8 8 9 10 12 19 14 13 11 9 7 6 6 4 4 5 6 6 6 8 9 9 6 6 91 7 9 9 8 8 8 11 9 9 5 5 5 5 5 6 6 7 8 8 10 10 9 9 9 82 8 9 1O 9 8 9 9 9 8 8 8 8 8 8 8 8 9 9 8 9 9 10 9 9 93 9 9 11 1O 9 10 10 11 11 11 11 10 10 9 9 10 10 9 10 10 9 8 9 10 to4 9 9 10 10 9 21 47 28 20 17 6 8 5 5 4 4 5 5 8 16 8 9 9 9 155 12 8 10 10 9 10 10 10 10 11 11 10 10 9 8 7 8 9 9 12 11 9 10 14 106 10 13 8 11 12 12 20 32 30 39 20 5 4 4 4 4 3 42 38 8 9 217 17 13 33 6 18 24 22 8 8 11 8 5 5 5 6 8 8 8 9 9 10 9 9 9 138 9 9 9 9 10 9 11 13 12 10 11 14 6 5 5 6 7 10 9 9 10 10 8 9 109 8 9 9 9 9 9 10 8 15 10 6 8 8 13 11 10 13 9 6 8 9 11 8 7 1010 7 8 7 8 7 9 9 10 11 13 10 7 5 6 5 7 8 8 9 9 9 11 11 11 911 11 10 12 11 10 10 11 12 10 4 4 3 5 5 5 5 5 6 8 10 8 10 27 15 1012 14 7 8 12 16 45 16 66 13 10 9 15 5 4 5 5 6 11 9 14 17 28 25 12 2113 16 53 56 22 14 12 42 39 17 17 7 6 13 6 7 7 7 8 11 8 28 44 27 38 2714 49 11 24 26 39 26 23 9 12 14 9 26*15 *16 *1718 *19 4 5 4 5 4 6 5 6 8 10 8 9 10 7*StdO 17 16 18 15 17 18 20 25 18 13 9 8 7 7 6 7 8 8 8 11 15 19 14 16
Total Number of Observations = 611 StdD = 14* Indicates Insufficient Data Capture; Not Included in Summaries

I I I
Appendix C
Trip Reports

I I I I
CORPORACION
RADIANS.A. de C.V.
TO: STEVEN MISCHLER JULY 4,1996
FROM: RAFAEL RAMOS 8 PAGES{.*4**v****e*4..**..***v4.***** ,4*.**.*4***.4**v**4***4** §.*. *4*..*.*44
COPY OF MY FIRST TRAVEL REPORT*{******4****-*40**-**-****4F*****v***4****44**4*4*** 44***
TECHNICAL REPORT AND A LIST OF INITIAL RECOMMENDATIONS FOR THE OPERATION OFTHE JORF LASFAR AMBIENT AIR MONITORING STATION.
GENERAL INFORMATION
NAME: RAFAEL RAMOS-VILLEGAS
LOCATION: CORPORACION RADIAN, S.A. DE C.V.ARQUIMEDES 209, PISO 1COL. POLANCO, 11560, MEXICO, D.F.TEL: (525) 250 2345 / 250 3006 / 254 3940FAX: 1525) 254 3864RADIAN'S E-MAIL ENTRY: MEXICOINTERNET ADDRESS: [email protected]
DATE OF DEPARTUREFROM MEXICO CITY: MAY 14, 1996
DATE OF ARRIVAL TOJORF LASFAR: MAY 15, 1996
DATE OF DEPARTUREFROM JORF LASFAR: MAY 21, 1996
DATE OF ARRIVAL TOMEXICO CITY: MAY 21, 1996
DESCRIPTION OF ACTIVTITES
1. ERECTION OF THE 10-METER METEOROLOGICAL TOWER ; PLACEMENT OFMETEOROLOGICAL SENSORS IN TOWER AND ITS WIRING TO THE JUNCTION BOX;ALIGNMENT OF THE WIND DIRECTION SENSOR TO COMPENSATE THE MAGNETICDECLINATION OF THE MONITORING SITE ; DEBUG THE INTERNAL WIRING IN THEJUNCTION BOX ; WIRE JUNCTION BOX TO TRANSLATOR; REWIRE TRANSLATOR AND
C-2
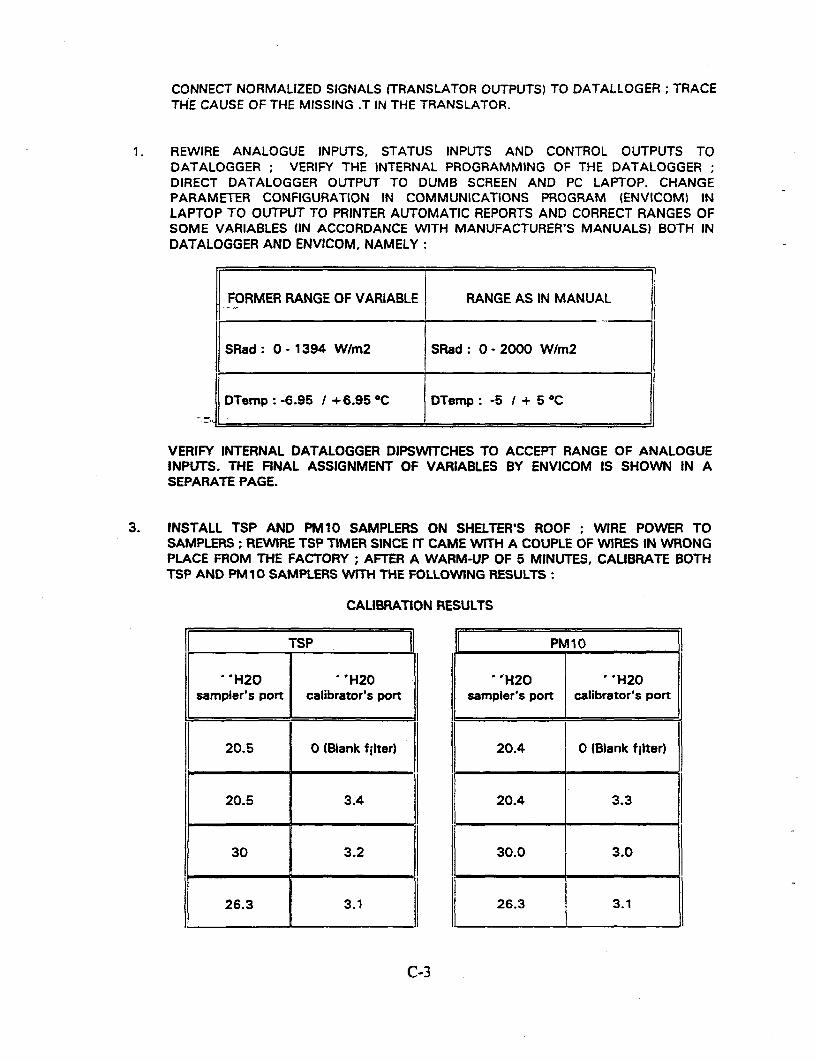
CONNECT NORMALIZED SIGNALS (TRANSLATOR OUTPUTS) TO DATALLOGER; TRACETHE CAUSE OF THE MISSING .T IN THE TRANSLATOR.
REWIRE ANALOGUE INPUTS, STATUS INPUTS AND CONTROL OUTPUTS TODATALOGGER ; VERIFY THE INTERNAL PROGRAMMING OF THE DATALOGGER;DIRECT DATALOGGER OUTPUT TO DUMB SCREEN AND PC LAPTOP. CHANGEPARAMETER CONFIGURATION IN COMMUNICATIONS PROGRAM (ENVICOM) INLAPTOP TO OUTPUT TO PRINTER AUTOMATIC REPORTS AND CORRECT RANGES OFSOME VARIABLES (IN ACCORDANCE WITH MANUFACTURER'S MANUALS) BOTH INDATALOGGER AND ENVICOM, NAMELY:
FORMER RANGE OF VARIABLE RANGE AS IN MANUAL
SRad: 0 - 1394 W/m2 SRad: 0 - 2000 W/m2
jDTemp: -6.95 / + 6.95 °C DTemp: -5 / + 5 °C
VERIFY INTERNAL DATALOGGER DIPSWrTCHES TO ACCEPT RANGE OF ANALOGUEINPUTS. THE FINAL ASSIGNMENT OF VARIABLES BY ENVICOM IS SHOWN IN ASEPARATE PAGE.
3. INSTALL TSP AND PM10 SAMPLERS ON SHELTER'S ROOF ; WIRE POWER TOSAMPLERS; REWIRE TSP TIMER SINCE IT CAME WITH A COUPLE OF WIRES IN WRONGPLACE FROM THE FACTORY; AFTER A WARM-UP OF 5 MINUTES, CALIBRATE BOTHTSP AND PM 10 SAMPLERS WITH THE FOLLOWING RESULTS:
CALIBRATION RESULTS
l ____________ TSP PM10
l H20 | H20 "ll H20 | H20 lsampler's port calibrator's port sampler's port calibrator's port
~I IH0"2 H0 ~ 2
20.5 0 (Blank fjilter) 20.4 0 (Blank filter)
20.5 3.4 20.4 3.3
30 3.2 30.0 3.0
26.3 3.1 26.3 3.1
C-3
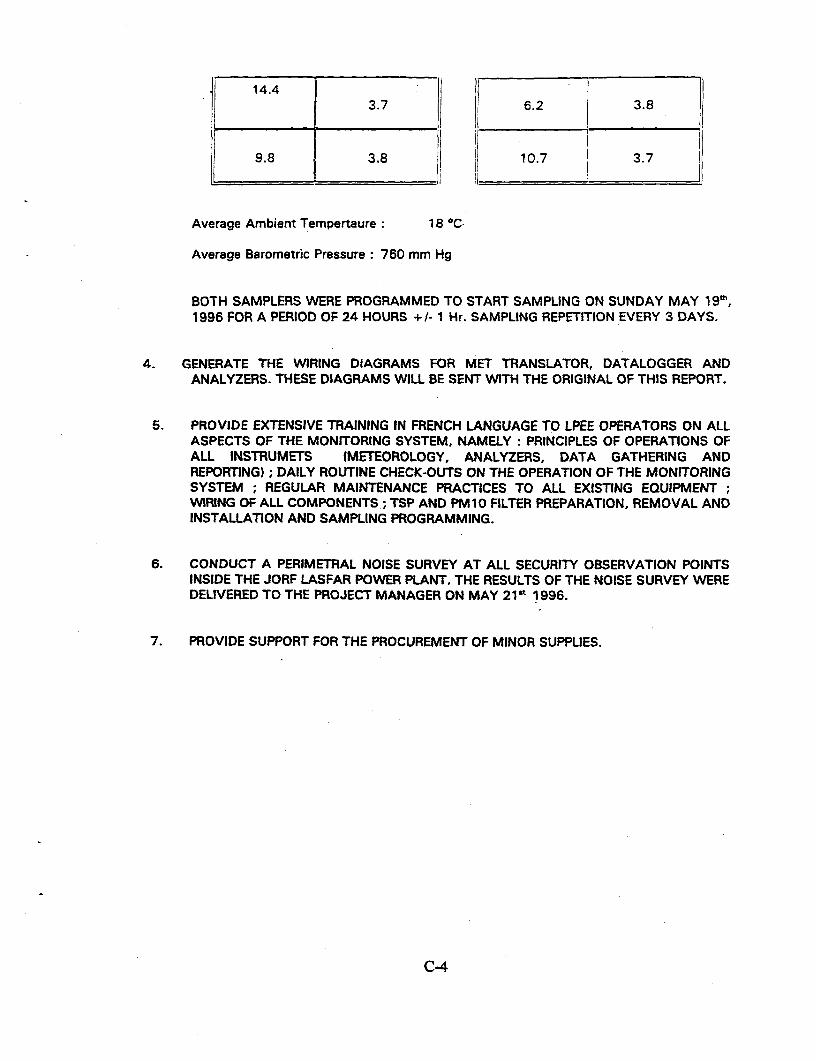
14.4 3.7 6.2 3.8
9.8 3.8 10.7 3.7
Average Ambient Tempertaure: 18 °C-
Average Barometric Pressure: 760 mm Hg
BOTH SAMPLERS WERE PROGRAMMED TO START SAMPLING ON SUNDAY MAY 19th,1996 FOR A PERIOD OF 24 HOURS +/- 1 Hr. SAMPLING REPETITION EVERY 3 DAYS.
4. GENERATE THE WIRING DIAGRAMS FOR MET TRANSLATOR, DATALOGGER ANDANALYZERS. THESE DIAGRAMS WILL BE SENT WITH THE ORIGINAL OF THIS REPORT.
5. PROVIDE EXTENSIVE TRAINING IN FRENCH LANGUAGE TO LPEE OPERATORS ON ALLASPECTS OF THE MONITORING SYSTEM, NAMELY: PRINCIPLES OF OPERATIONS OFALL INSTRUMETS (METEOROLOGY, ANALYZERS, DATA GATHERING ANDREPORTING) ; DAILY ROUTINE CHECK-OUTS ON THE OPERATION OF THE MONITORINGSYSTEM ; REGULAR MAINTENANCE PRACTICES TO ALL EXISTING EQUIPMENT;WIRING OF ALL COMPONENTS; TSP AND PM10 FILTER PREPARATION, REMOVAL ANDINSTALLATION AND SAMPLING PROGRAMMING.
6. CONDUCT A PERIMETRAL NOISE SURVEY AT ALL SECURITY OBSERVATION POINTSINSIDE THE JORF LASFAR POWER PLANT. THE RESULTS OF THE NOISE SURVEY WEREDELIVERED TO THE PROJECT MANAGER ON MAY 211 1996.
7. PROVIDE SUPPORT FOR THE PROCUREMENT OF MINOR SUPPLIES.
C-4
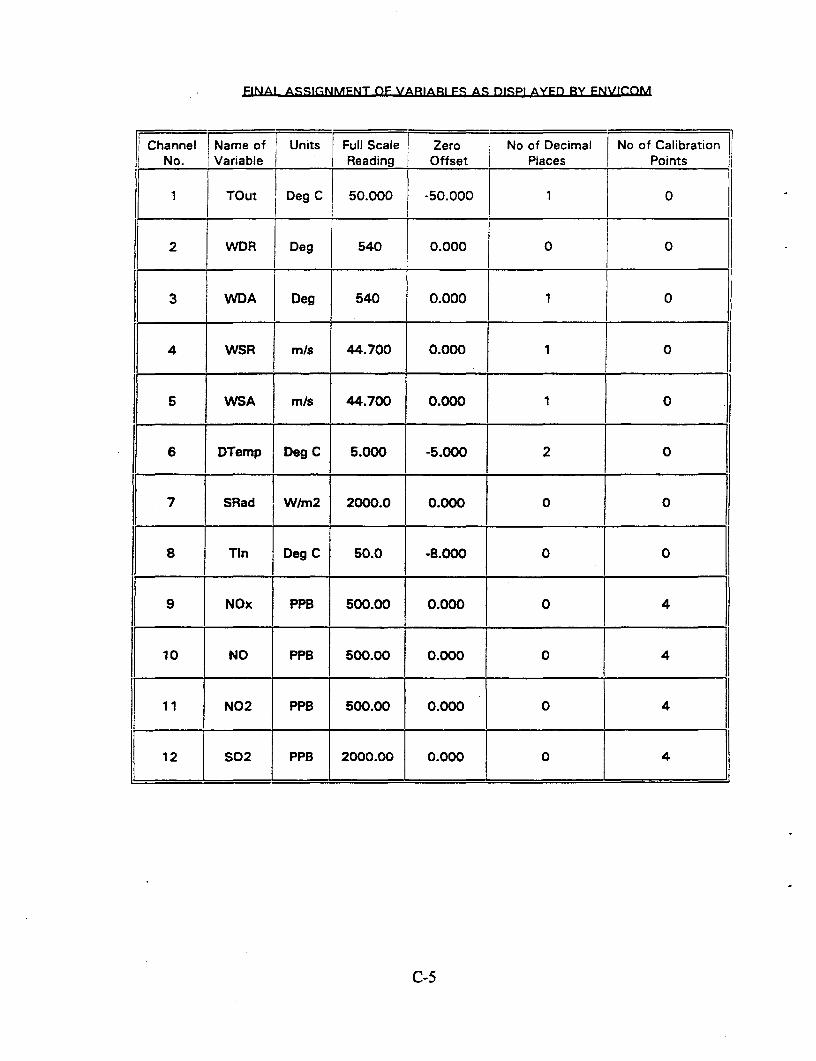
FINAL ASSIGNMFNT OF VARIARI FS AS DISPI AYFQ RY ENVICOM
Channel Name of Units | Full Scale Zero No of Decimal No of CalibrationNo. Variable | Reading Offset Places Points
I| 1 TOut I Deg C 50.000 -50.000 1 0
2 WDR Deg 540 0.000 0 0
3 WDA Deg 540 0.000 1 0
4 WSR mIs 44.700 0.000 1 0
5 . WSA m/s 44.700 0.000 1 O
6 DTemp Deg C 5.000 -5.000 2 0
7 SRad Wlm2 2000.0 0.000 0 O
f| 8 Tin Deg C 150.0 -8.000 0 O
|| 9 1 NOx PPB 500.00 0.000 0 4
10 NO PPB 500.00 0.0001 0 4
:; : N02 ::PPB 500.00 0.000 0 4__
1 12 S02 PPB |2000.00 0 oa0 0 0 C 4-5
C-5
CORPORACION
RADDIANS.A de CV.
TO: STEVEN MISCHLER JULY 2, 1996
FROM: RAFAE_' RAMOS 6 PAGES
TECHNICAL REPORT O ACTIVITIES PERFORMED FOR THE AMBIENT AIR MONITORINGSTATION A7 JORF LASFAR POWER PLANT
GENERAL !NFORMATION
NAME: RAFAEL RAMOS-ViLLEGAS
LOCATiON CORPORACION RADIAN. S.A. DE C.VARQUIMEDES 209, PISO 1COL POLANCO, 11560, MEXICO, D.F.TEL: (525) 250 23451250 3006 / 254 3940FAX: (525) 254 3864RADIAN'S E-MAIL ENTRY: MEXICOINTERNET ADDRESS: rudianAdata. net. mex
1TINERARY
WUNE 14,1996: DEPARTURE FROM MEXICC CITY AND ARRIVAL TO SAN DIEGO TO PICKUP API SPARE PARTS.
JUNE 15, 1996. TRAVEL TO NEW YORK AND CONNECTING FLIGHT TO MOROCCO.
JUNE 16, 1996. ARRIVAL AT CASABLANCA. CUSTOMS OFFICIALS RETAINED SPAREPARTS.
JUNE 17. 1996. SPARE PARTS CLEARED AND LATE ARRIVAL TO EL JADIDA.
JUNE 21, 1996.: LEAVE JORF LASFAR AND HAVE A MEETING WITH MR. KARIOUN INCASABLANCA LEAVE MOROCCO IN THE AFT ERNOCN.
JUNE 27, 1996: ARRIVAL AT MEXICO C;TY AFTER SPENCING 3 DAYS IN NASHVILLcA! ENDING THE A&WMA ANNUAL MEETING.
C-6
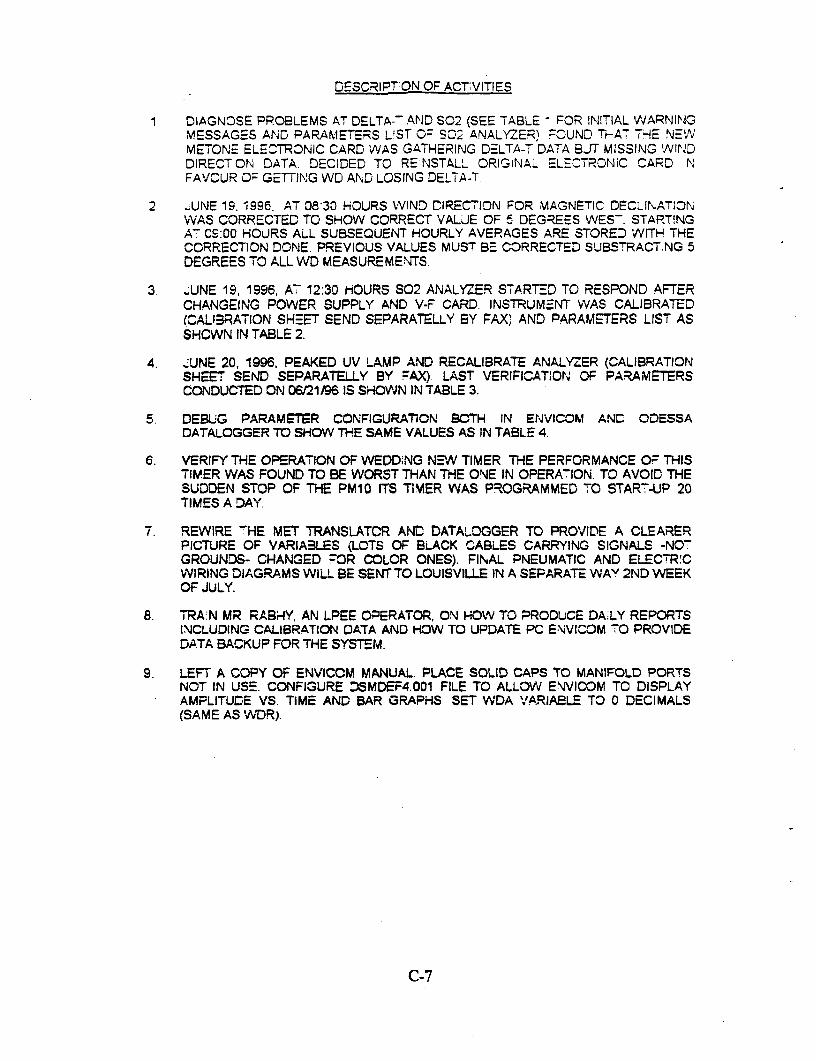
QESCRIPT ON OF ACT;VITIES
1 D4IAGNOSE PROBLEMS AT DELTA-- AND S02 (SEE TABLE - FOR INITIAL WARNINGMESSAGES AND PARAMETERS LIST G- SC02 ANALYZER). rCUND THAT THE NEWNMETONE ELECTRONIC CARDi WAS GATHERING DELTA-T DATA B3J MISSING WINDDIRECT ON DATA. DECIDED TO RE NSTALL ORIGINAL ELECTRONIC CARD NFAVCUR 0: GETTING WD AND LOSING DELTA-T
2 _UNE 19, 1996. AT 08:30 HOURS WIND DIRECTION FOR MAGNETIC DECLINATIONWAS CORRECTED TO SHOW CORRECT VALJE OF 5 DEGREES WNES7 STAPT!NGA- CS:00 HOURS ALL SUBSEQUENT HOURLY AVERAGES ARE STORED WITH THECORRECTION DONE. PREVIOUS VALUES MUST BE CORRECTED SUBSTRACT.NG 5DEGREES TO ALL WD MEASUREMESNTS.
3 _UNE 19, 1996, A- 12:30 HOURS S02 ANALYZER S7ARTED TO RESPOND AFTtRCHANGEING POWER SUPPLY AND V-F CARD. INSTRUMENT WAS CALIBRATED(CALIBRATION SHEET SEND SEPARATELLY BY FAX' AND PARAMETERS LIST ASSHCWN IN TABLE 2.
4. _UNE 20, 1996, PEAKED UV LAMP AND RECALIBRATE ANALYZER (CALIBRATIONSHEET SEND SEPARATELLY BY FAX) LAST VERIFICATION OF PARAMETERSCONDUCTED ON 06/21J96 IS SHOWN IN TABLE 3.
5. DEBUG PARAMETER CONFIGIURATiON BOTH IN ENVICOM ANDl ODESSADATALOGGER TO SHOW THE SAME VALUES AS IN TABLE 4.
6. VERIFY THE OPERATION OF WEDDNG NEN TIMER THE PERFORMANCE OX THISTIMER WAS FOUND TO BE WORST THAN THE ONE IN OPERA-ION. TO AVOID THESUDDEN STOP OF THE PM10 ITS T;IMER WAS PROGRAMMED TO START-UP 20TIMES A DAY.
7. REWIRE -HE MET TRANSLATOR AND DATALOGGER TO PROVIDE A CLEARERPICTURE OF VARIABLES kLOTS OF BLACK CABLES CARRYING SIGNALS -NO-GROUNDS- CHANGED ;-OR COLOR ONES). FINAL PNEUMATIC AND ELECTROCWIRING DIAGRAMS WILL BE SENT TO LOUISVILLE IN A SEPARATE WAVY 2ND WEEKOF JULY.
8. TRAXN MR RABHY AN LPEE OPERATOR, ON) HOW TO PRODUCE DALY REPORTSINCLUDING CALIBRATION DATA AND HOW TO UPDATE PC ENVICOM 7O PROVIDEDATA BACKUP FOR THE SYSTEM.
9. LEFT A COPY OF ENVICOM MANUAL. PLACE SOLID CAPS TO MANIFOLD PORTSNOT IN USE. CONFIGURE DSMDEF4.001 FILE TO ALLOWt ElVICOM TO DISPLAYAMPLITUDE VS. TIME AND BAR GRAPHS SET WDA VAPRIABLE TO 0 DECIMALS(SAME AS WDR).
C-7
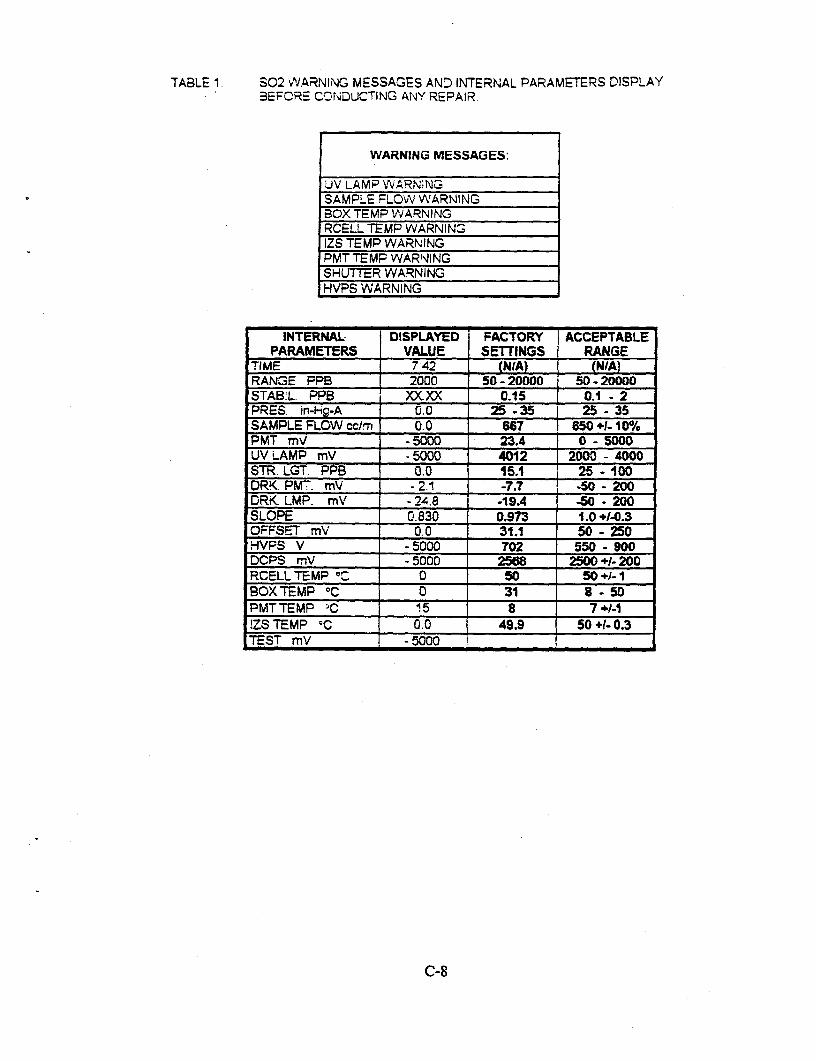
TABLE 1 S02 WJARNING MESSAGES AND INTERNAL PARAMtERS DISPLAYBEFCRE COtNDUCTING ANY REPAIR.
WARNING MESSAGES:
UV LAMP VVARNiNGSAMPLE FLOW WARNINGBOX TEMP WNARNINGRCELL TEMP WARNINGIZS TEMP WARNINGPMT TEMP WAR?NJINGSHUTTER WARNINGHVPS WARNING
INTERNAL DISPLAYED FACTORY ACCEPTABLEPARAMETERS VALUE SEtIINGS RANGE
TIME 7 42 (NIA) (N/A)RANGE FPB 2000 50- 20000 50- 20000STAB'L. PPB )XCXX 0.15 0.1 - 2PRES. in-Hg-A 0.0 25 -35 1 25 - 35SAMPLE FLOW cc/r, 0.0 667 1 650 +1-10%PMT mV -5000 23.4 0 - 5000UV LAMP mV - 5000 4012 2000 - 4000STR. LGT. PPB 0.0 15.1 25 - 100DRK. PM-. mV - 2.1 -7.7 -50 - 200ORK LMP. mV - 24.8 -19A. -50 - 200SLOPE 0.830 0.973 1.0 +1-0.3OFFSET mV 0.0 31.1 50 - 250HVPS V - 5000 702 550 - 900DCPS rnV - 5000 2568 2500 +1 200RCELL TEMP 0 50 50/-1BOXTEMP OC 0 31 8 - 50PMTTEMP iC 15 8 7_1-1!ZS TEMP ^C 0.0 49.9 50 +1- 0.3TEST mV - 5000
C-8
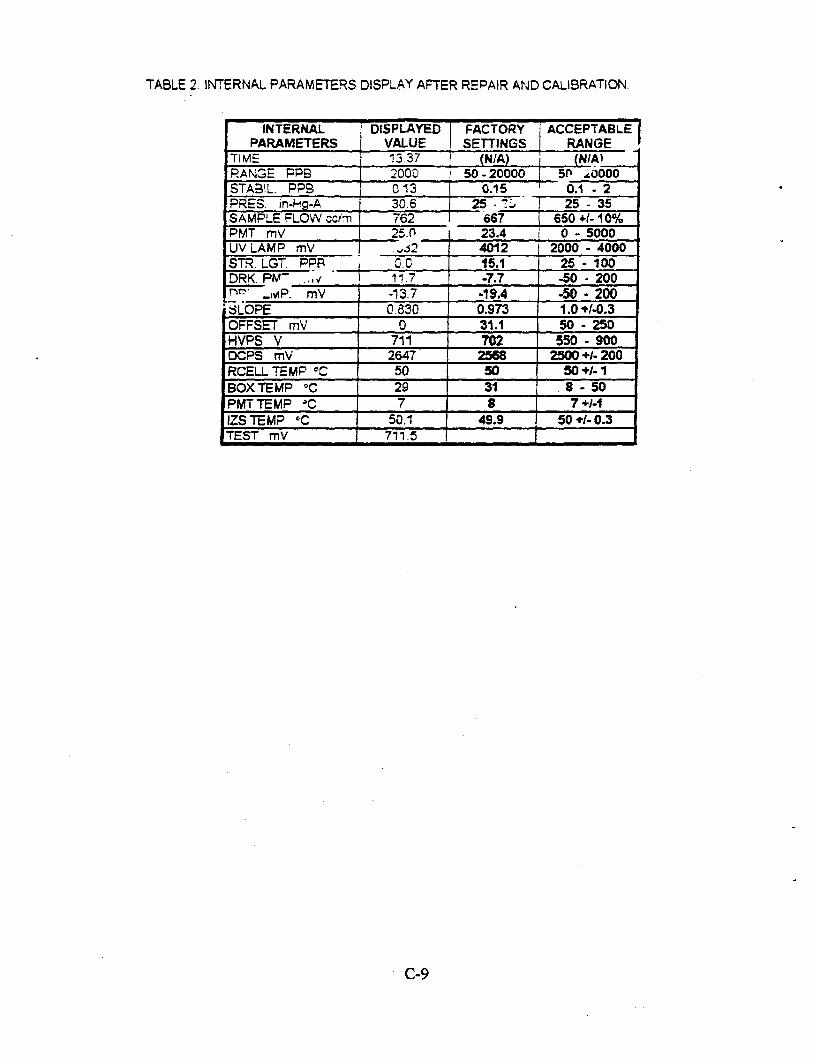
TABLE 2. INTERNAL PARAMETERS DISPLAY AFTER REPAIR AND CALIBRATION.
INTERNAL DISPLAYED FACTORY ACCEPTABLEPARAMETERS VALUE SETTINGS RANGE '
T7ME 13537 (NJA) (NIA!PAN G E RPP 2000 50 - 20000 [5D .0 0000STAB!L. PPB 013 0.15 0.1 - 2PRES in-kg-A 30.6 25 - 25 - 35SAMPLE FLOW c/lm 762 667 650 +1-10%PMT mV 2591. 23.4 0 - 5000UVLAMP mV \ J22 4012 2000 - 4000STR. LGT. PP _ 5.0 15.1 25 - 100DRK. PIV- ..v _ 11.7 -7.7 -50 - 200m' .._,0VP. mV -13.7 -19.4 -50 - 200;;LOPE 0830 0.973 1.0 J-.0.3OFFSET mV 0 31.1 50 - 250HVPS V 711 702 550 - 900DCPS mV 2647 2568 2500 +- 200RCELLTEMP £ C 50 50 50 +1-1BOXTEMP °C 29 31 8 - 50PMT TEMP 'C 7 8 7 +-1IZS TEMP OC 50.1 49.9 , 50 1-0.3TEST mV 711.5 _
C-9
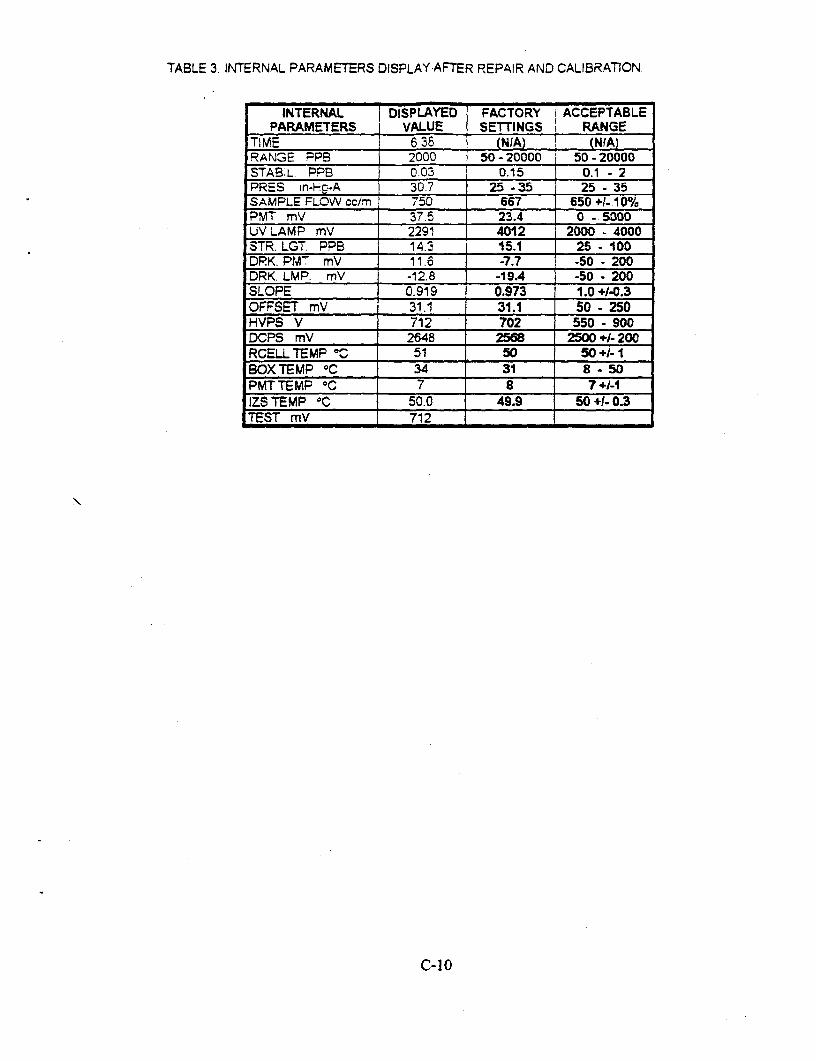
TABLE 3. INTERNAL PARAMETERS DISPLAY AFTER REPAIR AND CALIBRATION
INTERNAL DISPLAYED FACTORY ACCEPTABLEPARAMETERS I VALUE SETTINGS RANGE
TIME 6 36 (NIA)L (N!ARANGE PPB 2000 50 - 20000 50 - 20000STABL. PPB 0.03 0.15 0.1 - 2PRES. in-k-A 30.7 25 -35 25 - 35SAMPLE FLOW cc/m 750 667 650 +1-10%PMT mV 37.5 23.4 0 - 5000UV LAMP mV 2291 4012 2000 - 4000STR. LGT. PPB 14.3 15.1 25 - 100DRK. PM-. mV 11.6 -7.7 -50 - 200DRK. LMP. mV -12.8 -19A -50 - 200SLOPE 0.919 0.973 1.0 +/-0.3OFFSET mV 31.1 31.1 50 - 250HVPS V 712 702 550 - 900DCPS mV 2648 2568 2500 +- 200RCELLTEMP °C 51 50 50 1-1BOXTE MP °C 34 31 8 - 50PMTTEMP OC 7 a 7 +i-1IZS TEMP _C 50.0 49.9 50 +1-0.3TEST mV 712 _
C-10

I I
RADUIANINTERNATIONALM3
EIA AddendumAttachment 7
Analysis of JLPP Ash

I I
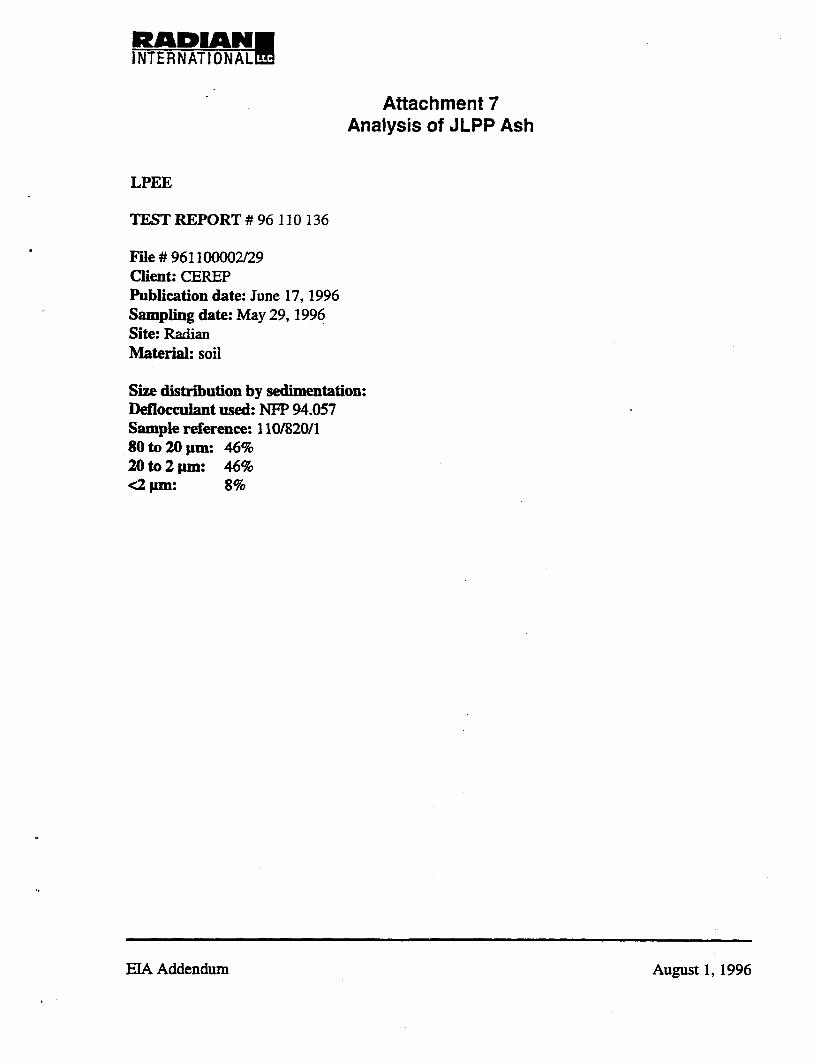
RADIAN-INTERNATIONALrM
Attachment 7Analysis of JLPP Ash
LPEE
TEST REPORT # 96 110 136
File #961100002/29Client: CEREPPublication date: June 17, 1996Sampling date: May 29, 1996Site: RadianMaterial: soil
Size distribution by sedimentation:Deflocculant used: NFP 94.057Sample reference: 110/820/1°O to 20 pm: 46%20 to 2 pm: 46%<2 pm: 8%
EIA Addendum August 1, 1996
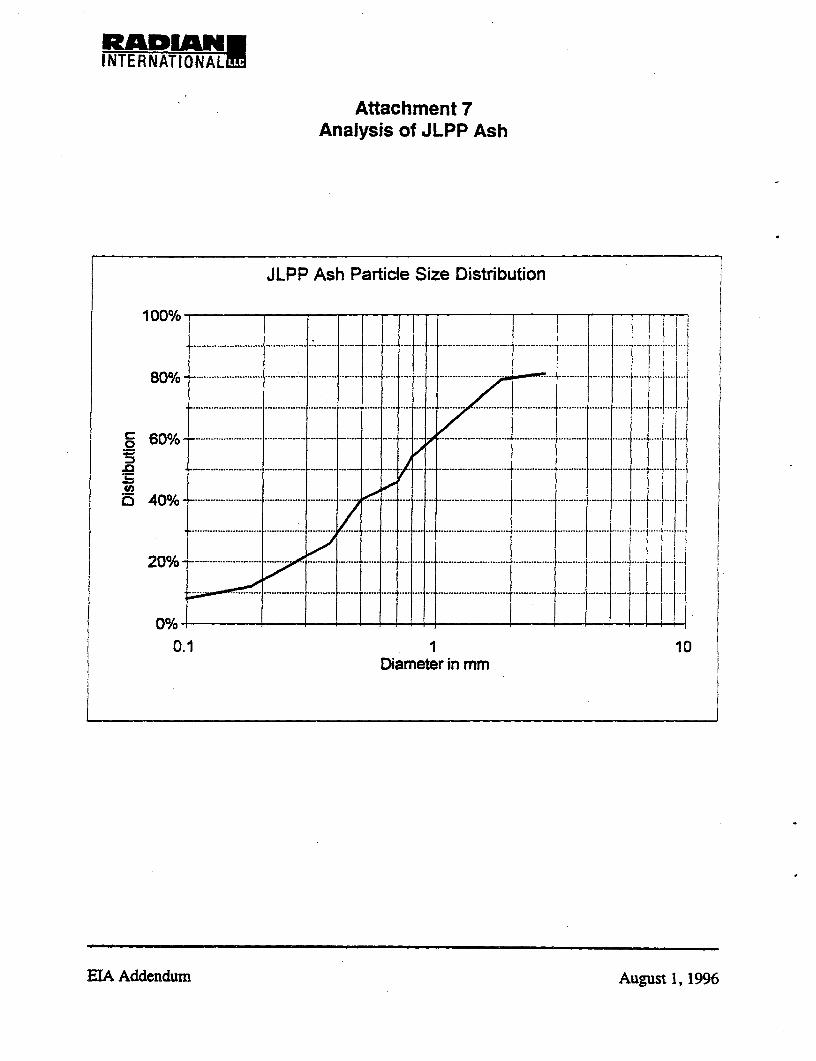
RADIANPI NTERNATIONAL
Attachment 7Analysis of JLPP Ash
JLPP Ash Particle Size Distribution
100%- __ _- -7J~. . -..... . ... . ...... .. .. ...... ..... . ......... ... .....................
80% .-.------- -------- ---------------- ---- ---I--- ---I ... ! 1
60% ......................-.... ........ ... .... ........ .. .... ...... .... ...... ........ ....... ..... ... ........................ ............ .... ..... .... . .. ........ ., .... .............. ........... ....... ........ ....... ..... ... ......
o5 40%0/o - .. .. .t X .- :: ..... .... ...
20%t........ ...... . . .
0%-_ _ _ _ __ _ _-
0.1 1 10Diameter in mm
EIA Addendum August 1, 1996
INTERNATIONAL
EIA AddendumAttachment 8
Phase 11 Environmental Assessmentof Jorf Lasfar Power Plant, Morocco

I
PHASE IIENVIRONMENTAL ASSESSMENT OF THE
JORF LASFAR POWER PLANT, MOROCCO
Prepared for:CMS Generation
Dearborm, Michigan 48126&
ABB Energy Ventures Inc.Princeton, NJ 08540
Prepared by:Radian Coxporation
9300 Shelbyville RoadLouisville, KY 40222
USA
March 6, 1996

f~~ ~~~~~~~~~~~~~~~~~~~~~~~~ I
TABLE OF CONTENTS
Page
1.0 EXECUTIVE STNUMMARY .............................................. 1-1
2.0 INTRODUCTION . 2-1
3.0 WORLD BANK GUIDELINES .3-1
3.1 1995 World Bank Environmental Standards .. 3-13.2 Project Analysis .. 3-1
3.2.1 New Plants (Jorf Lasfar Units 3 and 4) .3-23.2.2 Existing Plant Projects (Jorf Lasfar Units 1 and 2) .3-3
3.3 Air Quality Requirements.. 3-43.3.1 Airbome Particulate Matter. 3-43.3.2 Nitrogen Oxides .3-53.3.3 Sulfur Dioxide .3-6
3.4 liquid Effluent Requirements .. 3-73.5 Solid Waste Management .. 3-73.6 Monitoring and Reporting .. 3-7
4.0 JN]TED STATES EXPORT-IMPORT BANK GUIDELINES .4-1
4.1 Air Quality. 4-14.2 Water Quality. 4-24.3 Other Environmental Requirements .4-34.4 Solid and Liquid Non-hazardous Wastes .4-44.5 Hazardous and Toxic Materials and Wastes .4-4
5.0 ENVIRONMENTAL POLICIES AND PROCEDURES .5-1
5.1 Overview . 5-15.2 Current Status of Morocco Environmental Laws and Regulations .5-25.3 How Environmental Laws are Developed in Morocco .5-35.4 Other Fonral Developments .5-55.5 Environmental Inpact Assessment .5-55.6 Moroccan Attitude Towards Development of Environmental Standards . 5-65.7 Permitting Process .5-7
6.0 WASTEWATER DISCHARGE .. 6-1
6.1 Water Supply and Wastewater Discharge Configuration .6-1
TABLE OF CONTENTS(CONTINUED)
Page
6.2 Sampling Strategy ................. 6-26.2.1 Sample Collection ................ 6-2
6.3 Sampling Methodology ................. 6-36.4 Results .................... 6-5
7.0 SOIL AND GROUNDWATER ..................... 7-1
7.1 Site Description ......... ............ 7-17.2 Sampling Strategy ........ ............. 7-17.3 Methodology .................... 7-27.4 Results ..................... 7-8
7.4.1 Soil .................... 7-87.4.2 Groundwater .................... 7-10
8.0 TBERMAL DISCHARGE . 8-1
8.1 Overview . 8-18.2 Analysis Procedure . 8-28.3 Analysis Results . 8-38.4 Summary .8-4
9.0 ATMOSPHERIC EMISSIONS . 9-1
9.1 Overview . 9-19.2 SO2 Emissions . 9-29.3 NO, Emissions . 9-39.4 Particulate . 9-3
10.0 CONCLUSIONS . 10-1
10.1 World Bank and Ex-Im Guidelines ............. .................... 10-110.2 Moroccan Environmental Regulations, Laws, and Permitting ..... ....... 10-210.3 Wastewater Discharges ................. 3...., 10310.4 Soil and Groundwater Quality ..................... 10-310.5 Thermal Discharge ..................... 10-410.6 Atmospheric Emissions ..................... 10-4
ii
List of Figures
1-1 Map Showing Air Monitoring Site ........................................ 1-2
2-1 Polution Rose for Oxides of Nitrogen ..................................... 2-2
2-2 Pollution Rose for Nitrogen Dioxide.2-3
2-3 Pollution Rose for Nitric Oxide ........................................... 2-4
2-4 Pollution Rose for Sulfir Dioxide ... ...................................... 2-5
2-5 Pollution Rose for JLPP Air Quality Monitoring Site .......... ................ 2-6
iii

I t I
LIST OF TABLES
Page
3-1 World Bank Air Quality Environmental Guidelines ......... .................. 3-9
3-2 World Bank Wastewater Quality Environmental Guidelines ...... ............. 3-11
4-1 U.S. Export-Import Bank Air Quality Guidelines .......... ................... 4-1
4-2 Export-Import Bank Water Quality Criteria ............... .................. 4-3
6-1 Summary of the Wastewater Analytical Results ............ .................. 6-6
7-1 Soil Boring Locations . .......................................... 7-3
7-2 Piezometer Configurations ........................................... 7-4
7-3 Groundwater Surface Elevations .......................................... 7-6
7-4 Soil Sample Analytical Results ........................................... 7-9
7-5 Groundwater Sample Analyses Results . .................................... 7-11
8-1 Thermal Discharge Modeling Assumptions ..... 8-5
8-2 Thermal Discharge Modeling Results .8-5
9-1 CMS Generation/ABBEV JLCT Units 1&2 Fuel Sulfur Content vs. S02 Emissions . 9-5
9-2 CMS Generation/ABBEV JLCT Units 1-4 Fuel Sulfur Content vs. S02 Emissions .. 9-6
iv

I I
LIST OF FIGURES
Page
3-1 Correlation of Uncontrolled NOx Emissions to Generation Capacity of T-FiredBoilers ................................. 3-11
3-2 Correlation of Uncontrolled NOx Emissions to Vintage Year of T-Fired Boilers from 245MNWto 600 MW .................................. 3-12
5-1 Permitting Process ..................................... 5-8
6-1 JLCT Site Plan ..................................... -5
6-2 Condensor Discharge of RIUl . ..................................... 6-7
6-3 Condensor Discharge of R2U2 . ..................................... 6-8
6-4 Wastewater Discharge RSD ................ ..................... 6-9
6-5 Wastewater Dischae RCD The Intake Station ............... 6.............. 610
7-1 Piezometer Construction ..................... 7-5
7-2 Wells Evaluation at JLCT ..................... 7-7
8-1 Condensor Cooling Water Temperature Profile .8-6
8-2 Maximum Temperature Increase of Ocean Water Receiving JLCT Cooling WaterDischarge .8-7
8-3 JLCT Colling Water Discharge Dilution Rate in Receiving Waters ............... 8-8
v

I
RADIANCORPOKATION
1.0 EXECUTIVE SUMMARY
The CMS Generation/ABB Energy Ventures Corporation, herein referred to as the
ABB/CMS Partnership, contracted with Radian Corporation to conduct a Phase II environmental
assessment at the Jorf Lasfar Centrale Thermique (JLCT) in Morocco. The Phase II assessment
included the following activities:
* Review of the Draft 1995 World Bank (WB) Guidelines;
* tReview of the U.S. Export-Import (Ex-Im) Bank Guidelines;
* Review of the Morocco environmental regulations and permitting process;
3 JLCT wastewater discharge compliance assessment;
- JLCr soil and groundwater characterization;
* JLCr thermal discharge compliance analysis; and
* JLCI atmospheric emissions compliance analysis.
The major findings of this Phase II assessment are as follows:
* Assuming that financing will be sought from the WB, the WB Guidelineswill be applied to the JLCT project. An Environmental AuditReport(EAR) of units 1 and 2 and a comprehensive Environmental ImpactAssessment (EIA) of units 3 and 4 will be required by the WB;
* The WB Guidelines are more stringent than the Ex-Im Guidelines and willthus take priority;
There are currently no specific environmental regulations in Moroccowhich will impact the operation of Jorf Lasfar. The Ministry ofEnvironment is drafting regulations to protect the air, water, and soil;
* Future environmental regulations will be developed in concert withMorocco industries including the Jorf Lasfar Partnership. The new
1-1
RADIANCORP ORATION
regulations will be compatible with other countries in the region, whileaddressing the unique needs of Morocco and the Moroccan economy;
The construction permit for Units 3 and 4 is obtained by filing a requestfor extension of the existing permit governing the construction of Units 1and 2 and a request for extension of the existing permit governing the fueloil reservoirs;
Tested emissions of NO. and Particulates from JLCT units 1 and 2 arewithin the WB and the Ex-Im Guidelines. Sulfur Dioxide controls will beneeded if high sulfur coal is burned in order to meet WB and Ex-ImGuidelines;
* The wastewater quality analysis indicate that periodic pH excursionsexceed WB and Ex-Im Guidelines. The cause of these elevated values isunknown. Chromium concentration also exceeded WB and Ex-ImGuidelines;
* Soil contation is documented in the fuel oil handling and storage area.The data suggests that the contamination is likely to be pervasivethroughout the area A site investigation and mitigation strategy should bedeveloped and implemented;
- Groundwater analyses indicate a strong link to the ocean water quality andtidal movements. The groundwater quality was consistent with the oceanwater quality. Contamination of the ocean water was documented;
* The units 1 and 2 thermal discharges are within the WB and the Ex-lmGuidelines. Evaluation of four (4) unit operation is recommended; and
* A one year ambient momtonng program will be required at JLCT. RadianCorporation recommends that the ABB/CMS Partnership begin this effortimmediately so that the requisite background ambient concentrations ofpollutants will be available for the EIA.
1-2
RADIANCORPORATION
2.0 INTRODUCTION
The ABB/CMS Partnership contracted with Radian Corporation to conduct an
Environmental Assessment of the JLCT as part of its due diligence effort. The goals of this
investigation were to:
* a) Evaluate the compliance status of the JLCT unit 1 and 2 with Morocco,WB, and Ex-Im Bank requirements; and
*> * b) Document existing environmental site conditions and to the extentpossible identify the sources of pollution and the types of pollutantspresent at the power planL The process of identifying these sources ofpollution was conducted in a phased approach.
Radian conducted a Phase I environmental assessment during the month of June,
1995. The Phase I assessment draft report was presented to the ABB/CMS Partnership in July
1995. The Phase I tasks included a survey of the facility, a prehminary evaluation of potential
sources of soil, water and air contamination. Additionally, the Phase I report included a
preliminary review of the relevant Moroccan environmental regulations applicable to Jorf Lasfar.
The Phase I assessment identified the following recommended Phase I activities:
- Review of the WB Guidelines;
- Review of the Ex-Im Bank Guidelines;
- Review of the Morocco environmental and permitting regulations;
- Evaluation of the surface wastewater discharges;
- Assessment of the soil and groundwater quality,
- Modeling of thermal discharges at Jorf Lasfar,
- Evaluation of the plant atmospheric emissions; and
- Implementation of an arnbient monitoring network.
2-1
RADIANCONNORATION
The Phase II assessment was conducted during the month of September 1995.
The Phase II activities authorized by the ABB/CMS Partnership included an evaluation of the
following:
* New and current WB Guidelines;
* Current Ex-Im Bank Guidelines;
* Morocco environmental laws review;
* Documentation of the JLCT units 3 and 4 construction and operatingpermit process;
* Compliance evaluation of wastewater discharges;
* Soil and groundwater characterization;
* JLCT units I and 2 thermal discharge compliance analysis; and
* Units 1 and 2 stack emissions compliance evaluation.
The assessment of the new WB and the Ex-Im Bank guidelines was completed
based on extensive literature review and phone interviews with representatives from the WB and
the Ex-Im Bank. The review of Morocco environmental laws, and the JLCr 3 and 4 construction
and operating permit process are based on interviews at the Ministry of Environment, the ONE,
the Commune of Moulay Abdellah, and the Office d'Exploitation des Ports (ODEP). The result
of these interviews is a clarification of the WB Guidelines, the Ex-Im Guidelines, Morocco
environmental regulations, and a JLCI 3 and 4 construction and operation permit road map.
Radian Corporation contracted with the Morocco Laboratoire Publique d'Essais et
d'Etudes (LPEE) to conduct parts of the site investigation.
The LPEE 'Agence Centrale de Reconnaissance et d'Essais In-Situ' (ACREI)
conducted the site drilling and granulometric analysis. The ACREI team drilled 6 borings and
2-2
RADIANCORNP ORATAO
collected 12 undisturbed soil samples from the site in the presence of a Radian site
representative. Soil granulometric analysis was performed by the ACREI in their laboratory.
Four (4) borings were converted into piezometers.
The Morocco 'Centre d'Etudes et de Recherches sur l'Environment et la
Pollution' (CEREP), another LPEE division, performed the wastewater and groundwater sample
collection, and chemical analysis of all the soil and water samples. Groundwater samples and
wastewater samples were collected by the (CEREP) in the presence of a Radian site
representative. The soil and water samples were analyzed at the CEREP water and soil chemical
analysis and physical laboratories. Both the ACREI and the CEREP are ISO 9000 certified. The
sample collection procedures and analysis techniques are based using the AFNOR analysis
procedures. The final ACREI and CEREP reports include descriptions of the sampling and
analysis procedures utilized.
The JLCT 1 and 2 thermal discharge mixing zone length and temperature at the
edge of the mixing zone were obtained using a combined approach of field temperature data.
scaling length analysis, and three dimensional computational fluid dynamics modeling of the
cooling jet discharging into a shallow ocean region with cross flow.
JLCT units 1 and 2 stack NO, and particulate matter (PM) emissions were
evaluated for compliance with ONE permit conditions and the WB and Ex-Im Bank Guidelines.
The emissions data was obtained from a preliminary GEC Alsthom performance guarantee test
report. The expected SO, emissions levels were computed for various types of coals.
2-3

I I I

RADIANCORP ORAT ION
3.0 WORLD BANK GUIDELINES
3.1 1995 World Bank Environmental Standards
The WB Environmental Department has issued new environmental guidelines.
These guidelines, although in a draft format, are applicable to new projects. The Industrial
Pollution Prevention and Abatement Handbook, Preliminary Version, (Environmental
Handbook) dated July 1995 is the first re-write of the WB Guidelines since the 1988 (dated
1984) guidelines were adopted. The new regulations are intended to promote a more progressive
approach to environmental management by stressing the need for pollution prevention and a
focused environmental management approach at WB funded projects.
The Environmental Handbook is organized into three sections, although not all
the sections have been completely developed. Part I is the introduction which includes a
discussion of pollution prevention, good management practices, projects involving new plants,
projects involving existing plants and environmental regulations. Part I of the handbook (to be
developed) will contain information on establishing site specific or sectional requirements related
to WB projects. This section is not complete and was not part of the distribution copy. Part m of
the handbook contains the industry sector guidelines, including one for fossil fuel based thermal
power plants. The four main sections of Part m include discussions on pollutants of concern,
control technologies for those pollutants, key industrial pollution management issues that will be
classed as "good management practices" and sector specific guidelines, including pollution
prevention targets and minimum emission requirements.
3.2 Proiect Analysis
The procedure that is generally followed by the WB for analyzing industrial
projects consists of three steps. The following is a description of these steps:
3-1
RADIANCORPORATION
* An appropriate environmental assessment which addresses the countries
environmental legislation in Morocco is performed; and
An economic analysis which includes an analysis of the benefits of
altemative environmental measures available for the new and existing
units is performed. This study also examines the relative ambient impact
of the project under the various environmental management strategies
evaluated; and
* On the basis of the above two analyses, site specific requirements related
to the local conditions and resources available are established that will
adequately protect human health and maximize environmental benefits.
3±1 New Plants (Jorf Lasfar Units 3 and 4)
The WB Guidelines require the development of an Environmental Impact
Assessment (EIA) for new construction projects. The EIA for the new units determines the
environmental impact of the project and identifies altemative options for achieving project goals
at an equal or lower cost. This requirement is applicable to the construction of Jorf Lasfar units 3
and 4. Thus, the environmental assessment needs to address a broad range of alternative ways of
reducing pollution and health effects nsks by taking into account the contribution of other
pollution sources (units I and 2, the OCP, and the Port). If the EIA indicates there is no
significant deterioration in ambient conditions, then units 3 and 4 are required to comply with the
measures stipulated in the Environmental Handbook.
If the environmental assessment indicates there is the potential for significant
deterioration in ambient conditions, then the project (units 3 and 4) must conform to the
following:
* Adherence to the measures specified in the Environmental Handbook(numerical emission limitations);
3-2
RADIANCORPORATION
* Additional measures based upon site specific conditions; and
* The WB may require that further measures be taken to address othersources within the project area, where there is a more cost effectivemanner of reducing the overall impacts.
The Environmental Handbook does not provide any further guidance relative to
what is meant by "further measures".
3.22 Existing Plant Projects (Jorf Lasfar Units 1 and 2)
The Environmental Handbook specifies a different set of protocols for projects
that involve significant modifications to existing plants. The WB Guidelines require an
environmental audit report (EAR) as part of the project design. The EAR should assess the
following:
Past and current releases to land, air, surface water and ground water;
3Good housekeeping and maintenance practices, process modifications, andend-of-pipe measures that improve the environmental performance of thefacility; and
Recommendations of site specific targets (for emissions and pollutionreductions) and a time table for achieving the targets.
The WB encourages the host govemment to undertake a process of negotiation
between the plant owners, the plant management, and local regulators in the development of the
site specific targets. Realistic goals and targets are based upon an analysis of the technical and
economic feasibility of various management and process modification options.
The WB advocates an approach that includes the development of a public
schedule that indicates the facility plans for both short term measures (control equipment,
management improvements, etc), and long term continuing compliance. The Environmental
3-3
RADIANCORPORATION
Handbook states that "ongoing compliance should be measured by compliance monitoring
performed by the owner and an independent source."
3.3 Air Oualit' Reauirements
The Environmental Handbook specifies both ambient concentration limitations
which are designed to protect human health and stack emission limitations. The following
subsections specify the limitations that will likely be imposed on Jorf Lasfar Units 1&2 and Units
3&4.
3.3.1 Airborne Particulate Matter
The Environmental Handbook recommends that in the long-term, countries
should seek to comply with the World Health Organization (WHO) recommended guidelines for
both PM and PM.o. In the short-term countries must at a minimum establish ambient standards
for PM and/or PM,o that are responsive to: (a) the need to protect human health; (b) the levels
achievable by pollution prevention and control measures; and ( c) the economic impact
associated with achieving the specified level. Appropriate phase-in periods are allowed and
where appropriate, for economic or technical reasons, case-by-case ambient limits are
established.
The WB also recommends that countries establish "trigger" values for ambient
exposure to PM, as a criterion for WB projects. If the trigger is expected to be exceeded, the EIA
must address and resolve these exceedances.. The Environmental Handbook suggests that the
trigger value should be at or below the country's ambient PM standard and that the European
Union (EU), the United States (US), or the WHO guidelines or standards should be the trigger
value. The trigger value should be agreed to by the WB and the host country prior to beginning
the EIA. If there is no established trigger value, the WB uses 50 ug/M3 annual average for PMto
and 80 ug/m3 for total suspended particulate (TSP).
Table 3-1 provides a comparison of the 1988 and 199 WB Guidelines.
3-4
RADIANCORP ORATION
Stack emissions of TSP from units 3 and 4 are required to achieve 98% removal
efficiency for PM1o and 99% removal efficiency for TSP. These removal levels are required to
be achieved 95% of the time. The control technologies considered standard practice include
electrostatic precipitators and bag houses.
3.3.2 Nitrogen Oxides
As is the case with particulate matter, the Enviromnental Handbook recommends
that on a long-term basis the ambient concentration limits should not exceed the WHO
guidelines. On a short-term basis, levels higher than the WHO guidelines are acceptable if
economic and technical reasons make it prohibitive to achieve the WHO levels.
A trigger value is also used for the EIA. The recommended trigger vlue is at or
below the WHO, US, or EU guidelines or standards. In the absence of established trigger levels,
the WB assumes a value of 200 ug/m3 one-hour average if this is exceeded more than seven day
in the year, or 400 ug/m3 any one hour period during the year. Table3- 1 provides a comparison
of the 1988 WB Guidelines and the 1995 WB Environmental Handbook guidelines.
Stack emission of nitrogen oxides from units 3 and 4, while buming coal, are
required to achieve a 40% reduction from uncontrolled levels, and not to exceed 230 ng)J (0.54
#/MMBtu) or 650 mg/Nm3 based on 6% excess oxygen. Figure 3-1 presents a compilation of
the nitrogen oxide emissions from tangentially fired boilers in the United States. The data
indicates that uncontrolled emissions of the majority of US T-fired boilers are less than or equal
to 426 ng/J (1.0 #/IMtu). A 40% reduction from uncontrolled levels yields nitrogen oxides
emissions of 256 ng/J (0.6 #/IMBtu). Thus, the maximum allowed emission rate from JLCT
Units 3 and 4, while burniing coal must not exceed 230 ng/J. This emission rate should be
achieved at least 95% of the time. Emissions of nitrogen oxides from units 3 and 4 while
burning fuel oil, are required to a achieve a 25% reduction from uncontrolled levels and should
3-5
RADIANCoRPORATI.o
not exceed an emission rate of 100 ng/J (0.23 #/MMBtu). The use of a combination of low NOx
burners and combustion optimization techniques should be considered standard practice.
3.3.3 Sulfur Dioxide
As is the case with particulate matter and nitrogen oxides, the Environmental
Handbook recommends that on a long-term basis the ambient concentration limits should not
exceed the WHO guidelines. On a short-term basis, levels higher than the WHO guidelines are
acceptable if economic and technical reasons make it prohibitive to achieve the WHO levels.
A trigger value is also used for the ETA that is recommended to be at or below the
WHO, US, or EU guidelines or standards. In the absence of established trigger levels, the WB
wil use a trigger value of 80 ug/mn3 median of daily values taken throughout the year and 250
ug/m' for 24 hour exposure for more than seven days in the year. Table 3-1 provides a
comparison of the 1988 WB Guidelines and the 1995 WB Environmental Handbook guidelines.
Stack emissions from units 1 through 4 are limited to less than 0.2 tonnes per day
per MW for the first 1000 megawatts and 0.10 tonnes per day per MW for the increment above
1000 megawatts. The total allowable SO2 emission from Jorf Lasfar units 1 and 2 must be less
than 132 tonnes per day. The total allowable S02 emission from units 1, 2, 3, and 4 must be less
than 232 tonnes per day. This limitation may in turn prohibit the units from buming coal with
greater than 1.0% sulfur without some type of SO2 control equipment. The Enviroranental
Handbook states that, "in general, for low sulfur, high calorific fuels (<1 percent S), specific
control may not be required". Although this statement can not assure that S02 abatement
controls are not required, it does provide enough direction to proceed with specification of the
fuel quality that will be burned in units 3 and 4.
3-6
RADIAANCORPORUATION
3.4 Liquid EMuent Requirements
The Environmental Handbook specifies more liquid effluent limitations than the
1988 guidelines. Table 3-2 provides a comparison of the two different WB Guidelines. Not only
have the limitations been tightened for some parameters, several new parameters of concern were
added to the list. They include total chromium, hexavalent chromium, copper, iron, nickel, and
zinc. The allowable differential temperature at the edge of the mixing zone was reduced from 5
degrees Celsius to 3 degrees Celsius. The new guidelines also provide additional clarification on
the definition of the edge of the thermal mixing zone.
3.5 Solid Waste Manaaement
Under the new guidelines, disposal of dry ash (dewatered) is limited to:
(a)landfills in areas of low permeability with deep groundwater tables; (b) lined disposal cells
where groundwater seepage is a concern; or ( c) underground mines provided that any risks of
groundwater or surface water contamination are appropriately managed. In the case of Jorf
Lasfar, although areas of low permeability soils are likely to be located near the plant, the
groundwater table is shallow. Options (b) or (c) are most likely to be applicable to JLCT. A cost
fesibility analysis will evaluate the opfimal option. The selected disposal method should
incorporate leachate control and collection systems to minimize the migration of contaminants to
ground or surface waters.
3.6 Monitorins and Revorting
The Environmental Handbook provides clarification of the monitoring and
reporting expectations for a facility financed by the WB. For Jorf Lasfar units 3 and 4
continuous emission monitors (CEMs) for particulates, SO2, NO., "can be installed at
reasonable cost." Stack testing for PMto, SO2, NO, is to be performed once per year. The CEMs
are to be calibrated once per year, at the same time as the stack tests.
3-7
RADIANCON BP OK IT o
An ambient air quality monitoring network around the plant is required by the
Environmental Handbook. The guidelines specify that at least three monitors shall be installed in
off-site locations which measure the background concentrations, maximum concentrations, and
concentrations near sensitive receptors. Each of the monitoring locations must be capable of
measuring PM1o, SO2, and NO1.
Continuous monitoring of wastewater pH and temperature are required. Monthly
sampLing and analysis of suspended solids, residual chlorine, heavy metals, and other pollutants
(BODS and Oils and Grease) are performed if any form of treatment is provided.
All monitoring data are to be analyzed, reviewed routinely, and compared to the
operating limitations and/or standards. Corrective actions are undertaken as necessary and all
data/reports are mantained in an acceptable format Emissions above the standards and/or
operating limitations are reported to the responsible authorities, as required by the site permiL
3-8
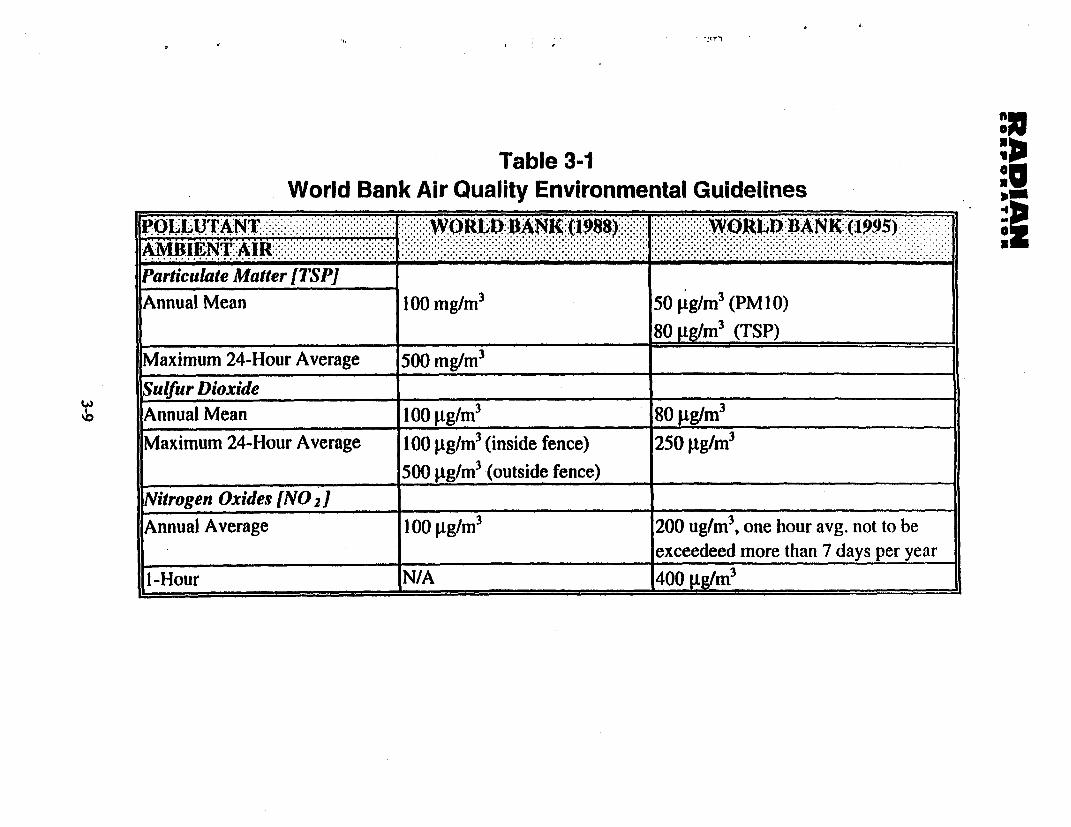
Table 3-1World Bank Air Quality Environmental Guidelines
. . . ,. . . . . . . . . . . . . -. - --.. . . . . . - --. . . . . . . . . . . . . . . . . . . ...,..... .... POLUTANT :.ELJ .::::::::... .:::::..:Aw NK (t:988).::: ::::: WRLE IBA:N# (1299 ::-:::)
Particulate Matter [TSPJAnnual Mean 100 mg/m 3 50 [tg/M3 (PM 10)
80 jLg/m3 (TSP)Maximum 24-Hour Average 500 mg/r 3
Sulfur DioxideAnnual Mean 100 jig/r 80 jg/r
Maximum 24-Hour Average 100 1g/m3 (inside fence) 250 jig/rn3
500 .ig/m 3 (outside fence)
Nitrogen Oxides [NO21 .
Annual Average 100 ,og/mr 200 ug/m 3 , one hour avg. not to beexceedeed more than 7 days per year
1-Hour N/A 400 jigrn3
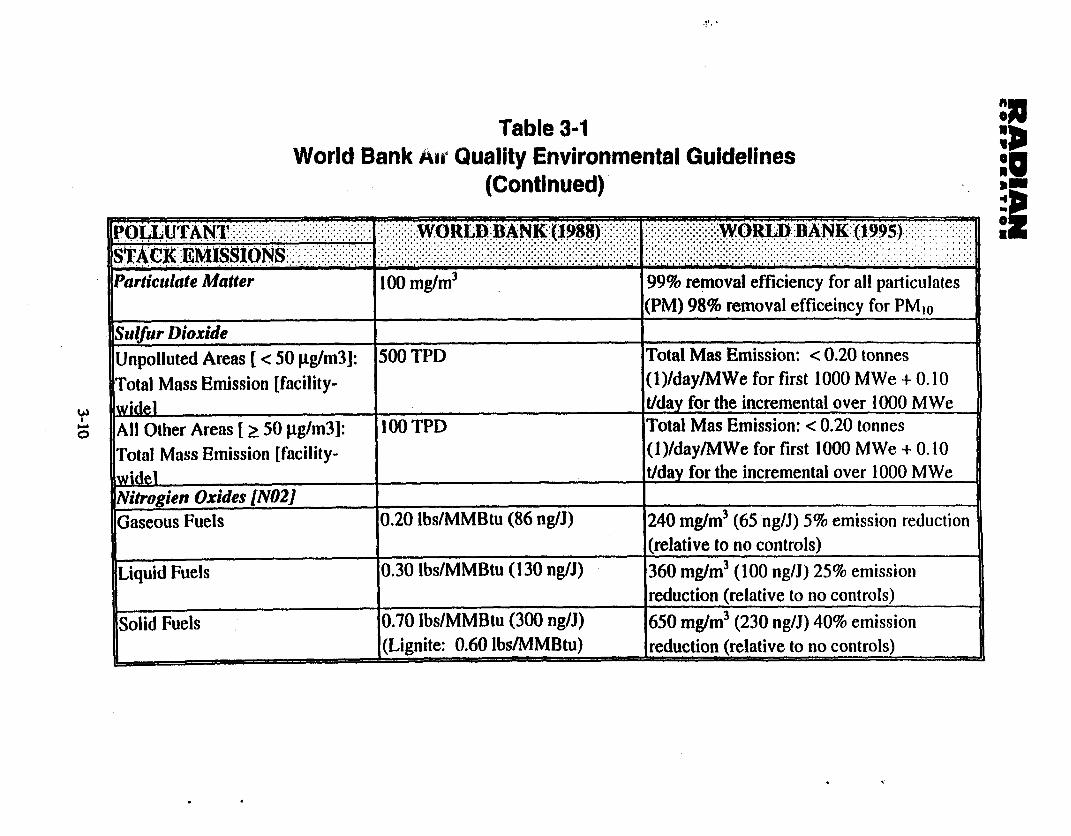
!', '
Table 3-1 ">World Bank Ai Quality Environmental Guidelines
(Continued)
POLLT N.T. ::.....W.L B. :WOLDBANK (8) :.WORL : ANK (1995).:-...
Particulate Matter 100 mg/rn 3 99%9 removal efficiency for all particulates_____________________ ______________________(PM) 98% removal efficeincy for PM 0
Sulfur DVioxide _____________
Unpolluted Areas [ < 50 plg/rn31: 500 TPD Total Mas Emission: < 0.20 tonnesTotal Mass Emission [facility- (1)/day/MWe for first 1000 MWe + 0.10wie ______________ t/dav for the incremental over 1000 MWe
W ~ ~ ~ ~ ~ ~ . . . .. . . .. . . . .. . . . . .. . . ... . . .. .. .. . .. . .
All1 Other Areas 1Ž250 jtg/m3J: 100 TPD Total Mas Emission: < 0.20 tonnesTotal Mass Emission [facility- (l)/day/MWe for first 1000 MWe + 0.10
wid.. t/dav for the incremental over 1000 MWe
w lueC. ,.' ........ ....
Nitrogien Oxides fNO2JGaseous Fuels 0.20 Ibs/MMBtu (86 ng/J) 240 mg/r3 (65 ngEJ) 5% emission reduction
wide]_________________________ (relative to no controls)Liquid Fuels 0.30 lbs/MMBtu (130 ng/J) 360 mg/m3 (100 ng/J) 25% emission
reduction (relative to no controls)Solid Fuels 0.70 lbs/MMBtu (300 ng/J) 650 mg/M3 (230 ng/J) 40% emission
(Lignite: 0.60 lbs/MMBtu) reduction (relative to no controls)
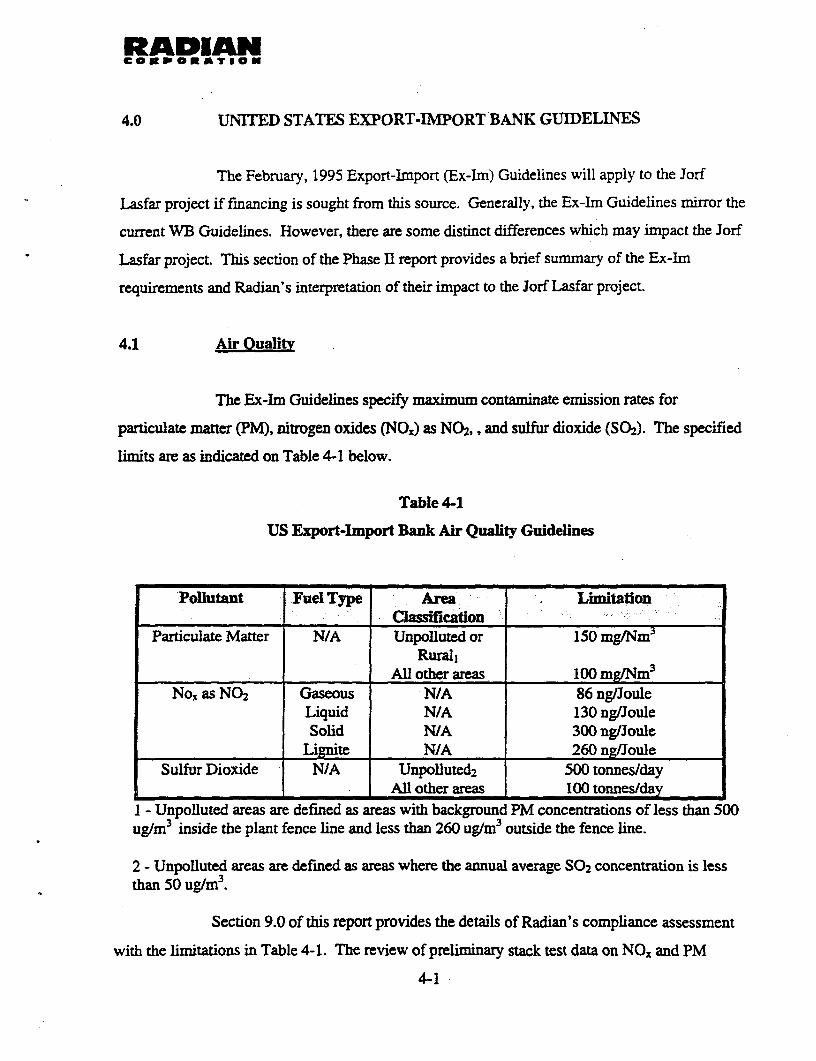
RADIANCOUP ORATION
4.0 UNITED STATES EXPORT-IMPORT BANK GUIDELINES
The February, 1995 Export-Import (Ex-Im) Guidelines will apply to the Jorf
Lasfar project if fmancing is sought from this source. Generally, the Ex-Im Guidelines mirror the
current WB Guidelines. However, there are some distinct differences which may impact the Jorf
Lasfar project This section of the Phase II report provides a brief summary of the Ex-Im
requirements and Radian's interpretation of their impact to the Jorf Lasfar project.
4.1 Air Ouality
The Ex-Im Guidelines specify maximum contaminate emission rates for
particulate matter (PM), nitrogen oxides (NO.) as NO2,, and sulfur dioxide (SO2). The specified
limits are as indicated on Table 4-1 below.
Table 4-1
US Export-Import Bank Air Quality Guidelines
Pollutant Fuel Type A _ _ _ _ Lnnation-_____C lassification
Particulate Matter N/A Unpolluted or 150 mg/Nm3
Rural,All other areas 100 mg/Nm3
No. as NO2 Gaseous N/A 86 ng/JouleLiquid N/A 130 ng/JouleSolid N/A 300 ng/Joule
Lignite N/A 260 ng/JouleSulfur Dioxide N/A Unpolluted2 500 tonnes/day
All other areas 100 tonnes/day
I - Unpolluted areas are defined as areas with background PM concentrations of less than 500ug/m 3 inside the plant fence line and less than 260 ug/m3 outside the fence line.
2 - Unpolluted areas are defined as areas where the annual average S02 concentration is lessthan 50 uglm 3 .
Section 9.0 of this report provides the details of Radian's compliance assessment
with the limitations in Table 4- l. The review of preliminary stack test data on NOx and PM
4-1
RADIANCORPORATION
emissions indicates that units 1 and 2 are currently in compliance with the Ex-Im Guidelines for
these pollutants.
The fact that no annual average SO2 ambient levels are available complicates the
assessment of compliance with the S02 daily tonnage limitation. Representatives of the Ex-Im
Bank have verbally confirmed to Radian that the tonnage limitations apply per flue gas duct
Thus, even in the worst case, namely a polluted area, the allowable emissions from each unit
would be 100 tonnes per day of S02. Based upon this interpretation, units I and 2 are in
compliance with the Ex-Im Guidelines. Allowable emissions of S02 from all four units will be
400 tonnes per day, and thus the WB Guidelines are more restictive.
It is important to note that compliance with the WB Guidelines will allow the
project to be eligible for special financing incentives from the Ex-Im Bank. Because S02
emissions from each unit are limited to less than 100 tonnes per day per duct, the project will
qualify for the "Environmental Exports Program" which offers support through provisions for
15% support, and financial coverage of interest during construction on the Ex-Im portion of the
financing. Additionally, this program allows for the maximum repayment terms permitted under
the OECD guidelines. The Ex-Im Bank may, at its discretion decline financing to projects not in
compliance with the Ex-Im Bank guidelines.
4.2 Water Oualitv
All liquid effluents from the Jorf Lasfar plant must conform to the criteria
specified in table 4-2 to assure approval for Ex-Im Bank financing. Because these criteria are
guidelines, consideration will be given to circumstances which cause these criteria to be
exceeded.
4-2
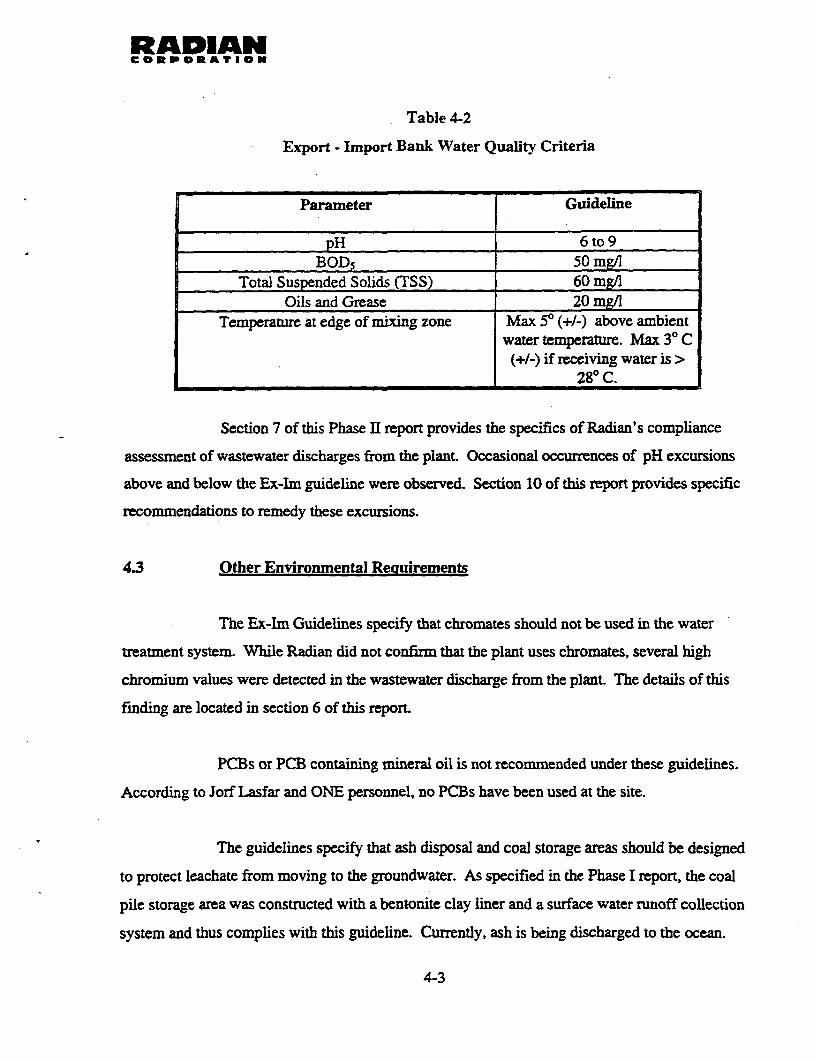
RADIANCORPORATION
Table 4-2
Export - Import Bank Water Quality Criteria
Parameter Guideline
pH 6 to 9BOD5 50 mg/
Total Suspended Solids (TSS) 60 mg/lOils and Grease 20 mg/i
Temperature at edge of mixing zone Max 5° (+1-) above ambientwater temperature. Max 30 C(+/-) if receiving water is >
280 C.
Section 7 of this Phase II report provides the specifics of Radian's compliance
assessment of wastewater discharges from the plant. Occasional occurrences of pH excursions
above and below the Ex-Im guideline were observed. Section 10 of this report provides specific
recommendations to remedy these excursions.
4.3 Other Envirommental Requirements
The Ex-Im Guidelines specify that chromates should not be used in the water
treatment system. While Radian did not confirm that the plant uses chromates, several high
chromium values were detected in the wastewater discharge from the plant. The details of this
finding are located in section 6 of this report.
PCBs or PCB containing mineral oil is not recommended under these guidelines.
According to Jorf Lasfar and ONE personnel, no PCBs have been used at the site.
The guidelines specify that ash disposal and coal storage areas should be designed
to protect leachate from moving to the groundwater. As specified in the Phase I report, the coal
pile storage area was constructed with a bentonite clay liner and a surface water runoff collection
system and thus complies with this guideline. Currently, ash is being discharged to the ocean.
4-3
RADIANCORPORATIO N
The Ex-Im Bank guidelines dictate cessation of ocean disposal of flyash and bottom ash. The
new disposal facility must be designed with a liner to meet this Ex-Im Guideline.
4.4 Solid and Liauid Non-hazardous Wastes
The Ex-Im Guidelines recommend the development of a comprehensive waste
management plan that establishes safe waste management and disposal practices. Recycling and
reclamation is strongly encouraged. The design of units 3 and 4 should incorporate recycling and
reclamation wherever possible and operations must follow best management practices.
4S Hazardous and Toxic Materials and Wastes
The Ex-Im Guidelines prohibit the use of cholorofluorocarbons (CFCs) and PCBs.
A hazardous waste management plan is required to ensure that proper handling and disposal
procedures are followed. Current plant management practices dealing with hazardous wastes
were not available. Some of these wastes may be disposed of through the wastewater collection
system in the plant. Further investigation will be required as part of the WB Guidelines EIA for
the construction of JLCT units 3 and 4.
4-4
RADIANCOEPORATION
5.0 ENVIRONMENTAL POLICIES AND PROCEDURES
5.1 Overview
This section describes the status of environmental laws in Morocco and the
potential specific impact on the ABB/CMS Partnership as it assumes management responsibility
of the JLCT. Additionally, this review identifies the specific requirements needed to construct
and operate the future JLCT Units 3 and 4.
During Phase I of this project, the Radian team interviewed a relevant public
official of the Ministry of Environment (Mme. Bani Layachi, Director of the Department
"Observation des Etudes et de la Coordination"). As reported in the Phase I report, Mme.
Layachi stated that "Morocco was in the process of developing legislation that could affect JLCT
but that no specific legislation is in place."
During Phase II, further research on this legal process was conducted to help
assess the potential impact on ABB/CMS Partnership fute operations in Morocco. The task
activity was conducted via telephone and personal interviews with relevant officials at the
Ministry of Environment and the Office Nationale de l'Electricite (ONE).
To this end, Radian requested a full one day meeting with Mme. Layachi and her
colleagues at the Ministry of Environment. This interview was conducted on September 18,
1995. The Ministry was presented by:
1. Mme. Layachi Directrice de l'Environment
2. M. Benyahia Coordinator de Projets
A second interview was arranged at the ONE to discuss the permit process for
construction and operation of Units 3 and 4. The meeting was held on September 19, 1995. The
ONE was represented by:
5-1
RADIANCORVORATION
1. M. Abdslam Boudlal Direction d'Etudes et d'Analyses
2. M. Brehmi Ben Yunis Ingenieur du Projets.
O-, September 19, Radian personnel met with the administrator of the commune
of Moulay Abdelah, "kaid" Abd-El-Aziz. The discussion focused on JLCT 3 and 4 plant
permitting. On September 20, the Radian personnel met with the ODEP "Chef de Service
Commercial et Juridique" M. Nadrni Mostafa. The discussion focused on the plans of the ODEP
for the industrial development at the Jorf Lasfar industrial zone.
5.2 Current Status of Morocco Environmental Laws and Rezulations
During the last few years, several environmental laws have been discussed and
written in Morocco (see approval procedure for environmental laws below). Currently none of
these laws are in effect. However, Morocco does have an Environmental Policy whose principles
are based on the widely accepted ideas of sustainable development.
Morocco intends to develop standards comparable to those of its neighbor
countries and it has been suggested by the Ministry of Environment that the model to foUow is
that of the European Union (EU). It was mentioned during meetings with the Ministry of
Environment that Morocco eventually intends to come close to EU standards but they do not
intend, in any case, to exceed these standards. Within the EU, the following countries were
mentioned as particularly relevant for Morocco public officials: Greece, Portugal, Spain and
Turkey.
The approach Morocco is following in developing their legal environmental
framework is to develop specific laws for each media, i.e. water, air, waste, soil. These laws are
still far from the integrated pollution prevention control approach, now favored by many
developed countries.
5-2

RADIANComVoKATIoN
One regulation which is in the advanced development stage concems "water".
This regulation was approved last June by all relevant Morocco goverm-nent bodies. It is
currently pending final publication. The regulation is not available to the public at this time. The
remainder of the environmental laws under consideration lag behind the water law and are at
different stages within the discussion and review process.
It is expected that the water regulation and the other laws to follow (e.g.: the air
law which is under development) will define the general framework for action and that specific
emission or discharge standards will require the approval and publication of detailed codes of
lower legal level (i.e. riglement).
No current work is being done in regard to soil pollution or hazardous waste
managemenL A specific legal text mandating Environmental Impact Assessment requirements
for new facilities is also under development and is explained below. In addition to specific
media oriented laws, the so called "General Law for the Protection of the Environment" is also
under discussion. This one law has taken nearly ten years to be developed and it is intended to
serve as the framework in which other laws are to be modeled. This law explicitly includes the
so called "polluter pays" principle.
As it is explained in the next section, the process of environmental legal
development can be expected to take quite some time and it will probably be several years before
Morocco has in place specific and comprehensive legal standards applicable to industrial
operations, including JLCT.
5.3 How Environmental Laws are Developed in Morocco
The following section presents the process under which the environmental laws
referred to above are being developed. The discussion will help assess the expected time frame
in which this development can occur; and the ways in which the JLCT operator may by impacted
by the specific content of the laws and regulations being developed.
5-3
RADIAN
All norms are initiated and drafted at a working group named "Conseil National
d'Environement" (CNE). CNE is comprised of officials from various relevant Ministries (which
could be freely translated to Ministry of Envirornent, Public Works, Agriculture, Industry-
Conmmerce & Artisans, Energy & Mines, Transport, Health, etc) and also includes several Non
Governmental Organizations(NGOs). In particular, the following NGOs are represented on the
CNE: professional bodies; scientific institutions; and industrial associations. The CNE is chaired
by the Ministry of Environment.
The role of CNE is to initiate and draft the technical aspects of the laws. Once the
text reach a cerain degree of technical maturity it is passed to the legal cabinet of the Ministry of
Environment to shape the draft into a more legal document.
The CNE works in different committees that focus on specific topics (e.g., air
issues) and the Ministry encourages specific relevant industries to participate in these
committees. The time required for this level of technical preparation can range from six months
to six years, although in some cases (e.g., water law) it has taken ten years to pass. All along this
process, the Ministry of Enviromnent views itself in the role of a promoter and coordinator and
they encourage a discussion and negotiation as approaches to the development of'the laws.
Once the laws have been through this process, they are sent to the "Secretarie
General du Gouvernement (SGG)", a sort of counseling body whose job is to ensure that all new
legal texts (environmental and non environmental) are institutionally and legally sound. In
addition, the SGG has the responsibility to set priorities and to promote or postpone the
"approval" of laws. SGG approval is a real milestone in the process of approving any law in
Morocco.
Once SGG grants approval of a legal text, the text is sent to the Govemment and,
depending on the level of the text, sent to the Parliament for discussion and approval (real laws)
or directly discussed within the Government and published (regulations).
5-4

RADIANCORPORATION
The plan of the Ministry concerning the enforcement of laws includes a three
month period for the law to become effective once approved by the relevant body. Existing
facilities are given transition times to adjust.
5.4 Other Formal Developments
In addition to the law development initiatives mentioned above, the Ministry of
Environment has contracted a study with a multinational team of consultants to identify
economic and financial instruments that could be used to promote an environmentally sound
behavior of companies. The study is intended to be tanslated into specific legal instruments,
which are expected to be defined by 1997. The Ministry intends to use this framework to
encourage the development of responsible investment pattems. Their stated intention is for
"foreign companies investing in Morocco to act as examples that could be followed by local
companies."
5.5 Environmental Impact Assessment
An important aspect of the new legal developments taking place in Morocco is the
discussion of the 'Environmental Impact Assessment". This concept, which is still to be drafted,
classifies industrial facilities in two "Lists". List I includes facilities wbich are required to
complete a formal Environmental Impact Assessment (EIA) process before approval of
construction and operation of a new facility is granted. List II includes those facilities that are
not required to complete this process. Even though access to the text of the draft was not granted
to Radian, the comments of the ministry personnel suggested that Jorf Lasfar Power Plant will be
included on List I.
As has been the case with other environmental legal developments, it may be
quite sometime until the new concept is formally developed into law. The Ministry intends to
require new industries to complete what could be translated as an "Environmental Evaluation
5-5
RADIANcouVOKaTIOw
Study (EES)" (Etude d'Evaluation Environnemental). This would be similar to the
"Environmental Impact Assessment (EIA)."
The Ministry indicated that the successful completion of an EIA or EES would
play a role in the permit evaluation process for any new facility of significant potential
environmental impact and, especially, if proposed by foreign investors. The EIAIEES should
view the impact of the new facility in the perspective of "what are the aggregate impacts of the
new facility on the existing background levels." Specifically, the EIA/EES should point out to
what extent the emissions or discharges of the facility would increase the discharge levels. If the
new resulting levels present a significant hazard to the environment and human health, the
EIA/EES must address and resolve these issues.
5.6 Moroccan Approach Towards Develoyment of Environmental Standards
It has been mentioned above that the "approach" of the Ministry of Environment
is that of collaboration. They are starting to develop environmental standards and are willing to
develop these standards in cooperation with impacted industrial sectors. In this context, the
Ministry pointed out that the process of legal development is going to be slow and will give
ample margin for any company to adjust to, and to discuss new developments. Additionally, it
was made clear during the various converations that the Ministry does not intend to place
difficulties on foreign investors. They want to make sure that new industrial activities built in
Morocco are not located there at the expense of bringing old technology that has been discarded
in other more developed countries. Furthermore, the particular decision to bring private capital
to the energy sector in Morocco is in the best interest of the country. The Ministry of
Environment pointed out their requirements should not interfere with the privatization effort
which they interpret as good for their country.
5-6
RADIAN
5.7 Permittinz Process
In Morocco, application for a permit to construct and operate a new facility must
be presented at the relevant local authority. In this case the local authority is the Commune of
Moulay. Upon receipt of the application, the local authority will request the opinion of various
Ministries (Public Works, Civil Protection, Employment, Health, Environment, etc.).
Coordination of these authorities could eventually be done at the level of the corresponding
province rather than at the level of the city itself. The foUowing documents are needed to
complete the pernit application:
* A formal letter requesting the permit;
* Engneering drawings of the new facility and corresponding engineeringdescription;
- A particular study following the so called "Reglement pour idinagementintereur de depots d'hydrocarbures liquides" (basically a code for thedesign of tanks and tank farms); and
* -The previously mentioned Environmental Evaluation Study.
Figure 5-1 depicts the permitting process graphically for JLCT Units 3 and 4.
It was recommended to Radian that all these documents be personally presented,
in due time to the Commune, by an authorized ABB/CMS Partnership representative. The
Commune requires a few weeks (up to 6 weeks) to respond back with the pemiit. If the above
described consultation process runs into excessive delays, the Commune is able to issue a
temporary permit that would allow the start of the construction.
It was mentioned to Radian that the current permit for the JLCI includes an
allowance for construction of boilers 3 to 6. This should strengthen the background of any new
application and facilitate the evaluation process by the relevant local, regional and national
authorities.
5-7
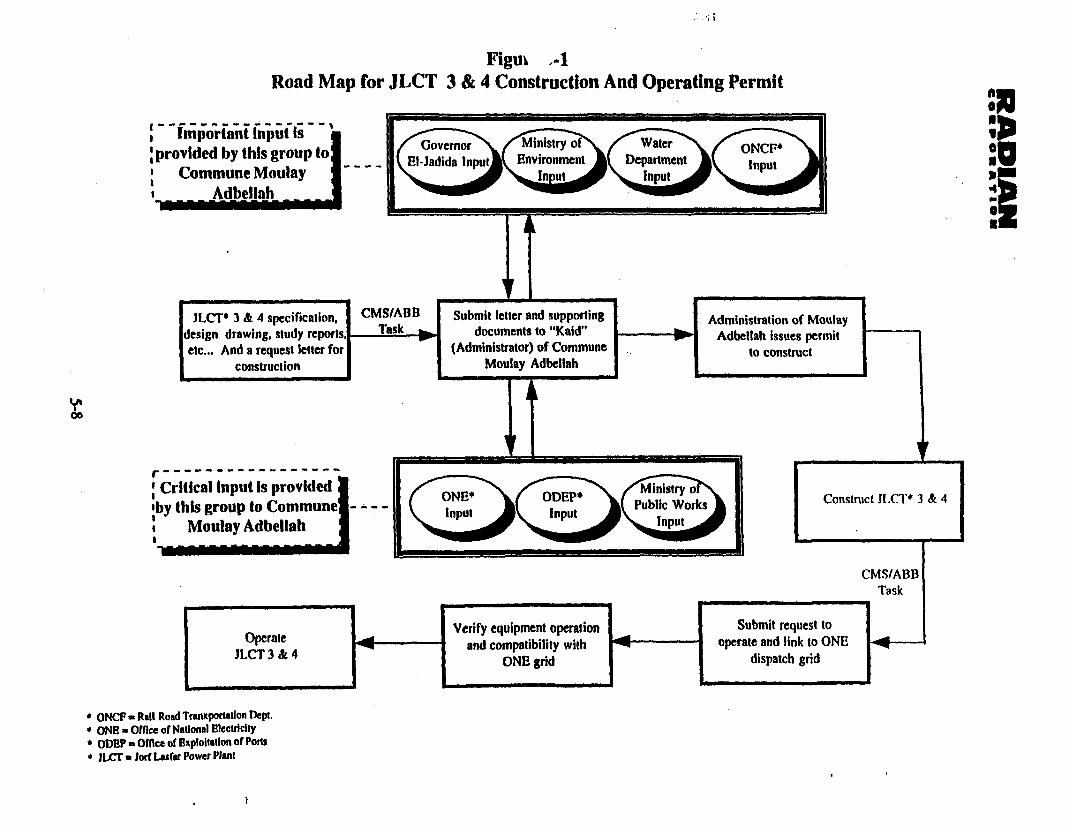
Figui -1Road Map for JLCT 3 & 4 Construction And Operating Permit
Important input is y ofprovided by this group to E-jadids Input Enironment DIanmnt
Commune Moulay ---- _ IAdbellah 1 ut __
______ H___, ______ :
JLC`T* 3 & 4 specirication, CMS/ABB Submit letter and supporting Administration of Moulaydesign drawing, study reports ask documnts to "Kaid" Adbellah issues permitetc... And a request letter for (Administrator) of Commune to construct
construction Moulay AdbellahU'~_
r------------_-___-______________ __ _
Critical Input Is provided nistry 1 Construct JLCT* 3 & 4'by this group to Cm ue - - -- IptI lcWr
Moulay Adbellahj I____ I
CMSIABBTask
Verify equipment operation Submit request toOperale 4 and compatibility with operate and link to ONEJLCT 3 k 4 ONE! grid dispatch grid
* ONCF eRail Road Tranxpordadon Dept.* ONE a OMce of Naional Electriclty* ODE? a ofice of Exploitation of Polts' JLCFr *n jarf( Air Power Plant
RADIAN
6.0 WASTEWATER DISCHARGE
The management and compliance evaluation of process water and resulting
wastewaters were examined by Radian as part of the Phase II activities. The following
subsections provide the details of this segment of the investigation.
6.1 Water Sunnlv and Wastewater Discharge Configuration
The sources of process water supplied to the JLCr include potable water and sea
water. Potable water is supplied to the site from a reservoir located in the Dauorat Region by the
Office National Eau Potable (ONEP). Potable water is used for the plant process operations and
for sanitary water supply.
Sanitary wastewater is treated for solids removal in septic tanks and the liquid
phase is discharged to the wastewater pipe network for discharge. Some biological degradation
of the liquid phase is anticipated but the BOD5 of the liquid effluent is currently unknown.
These liquid phase sanitary wastewaters are combined with other plant wastewater sources in one
of two 36 inch concrete pipes which ultimately discharge to the Atlantic ocean.
Demineralizer backwash/regeneration wastewater is collected in a neutralization
tank designed to buffer the stream prior to discharge to one of the 36 inch discharge pipes. pH
control is a manual operation according to JLCr personnel. In plant equipment cooling water
and washdown waters are also conveyed to either of the discharge pipes.
Sea water is pumped from the Atlantic Ocean and is used primarily for once-
through condenser cooling water. The sea water is chlorinated for biofouling control before
being pumped to the condensers.
6-1
RADIAND
Once through condenser cooling water from units 1 and 2 is conveyed directly to
the Atlantic ocean via a 1.5 kilometer long open channel.
Storm water runoff from the areas surrounding the powerhouse is directed to the
combined wastewater discharge pipes (36 inch concrete pipes). Storm water from areas away
from the power house is directed to an open channel and discharged directly to the ocean. At the
time of Radian's on-site Phase I and Phase I activities there was no observed flow from the
storm water discharge channel due to a period of drought experienced in the region.
6.2 SamDlinm Strateiv
The sampling strategy employed for this segment of the Phase I[ investigation was
developed to support the following goals:
1. To determine the compliance status of JLCT discharges with the WBGuidelines, Ex-Im Guidelines and the ONE permit conditions; and
2. To assess the impact of plant operations on wastewater quality bymeasuring specific water supply parameters and the same parameters ineach of the plant's wastewater discharges.
6.2.1 Sample Collection
Samples of wastewater streams and intake ocean water were collected from the
locations listed below. The sample designation is also listed for each of the corresponding
locations.
Location Sample Desi2nation
Unit 1 Condenser Discharge RIUl(Eau de Refroidissement 1)Unit 2 Condenser Discharge R2U2(Eau de Refroidissement 2)North Outfall RSD (Rejet Sur Digue)South Outfall RCD (Rejet Contre Digue)Ocean Water near Coal Pile Area EMI (Eau Marine 1)Ocean Water near Power House Area EM2 (Eau Marine 2)
6-2
RADIANCSONPOWATIo
The locations of each of these sample points are presented on figure 6-1.
6.3 Samplina methodolo2
Samples were obtained every two hours from each one of the four wastewater
sampling points (RIUI, R2U2, RCD, RSD), over a 24 hour period. Therefore, a total of 12
samples were collected at each sampling point. The pH, temperature, and conductivity of each
sample were recorded, along with the ambient temperature. Then, the samples were combined to
form a composite sample. Each resulting composite sample was prepared, refrigerated, and
delivered to the laboratory for chemical analysis.
Water samples were obtained at locations EMI and EM2. The samples at EM1
and EM2 determine the background ocean water quality at the intake to the plant and the coal
pile respectively. These samples were collected near the shore and immediately prepared,
refrigerated, and delivered to the laboratory for analysis.
All samples were prepared and analyzed using AFNOR (French Quality
Protocols). The laboratory that conducted the sample collection and analysis is ISO 9000
certified. The samples were analyzed for the following parameters:
* Total Petroleum Hydrocarbons (IPH);
* Oils and grease;
* Heavy metals;
* Total organics;
* Dissolved oxygen;
Total suspended solids;
* Redox potential; and
* Five day biological oxygen demand (BOD5).
6-3
RADIANCoRPORATIoN
Table 6-1 presents the results of the above analyses for all samples.
6.4 Results
During the sampling periods, the following observations were made:
1. The flow rate in the two waste water discharge points RCD and RSD wasirregular.
2. Flow rate at the open channel was nearly constant It was estimated to beabout 30,000 m31hr.
3. During the field work no water was observed at the other wastewaterdischarge points.
Table 6-1 presents the sample analysis results, as well as the WB Guidelines and
the Ex-Im Guidelines. Figures 6-2 through 6-5 present the time vs pH results from the sampling.
6-4
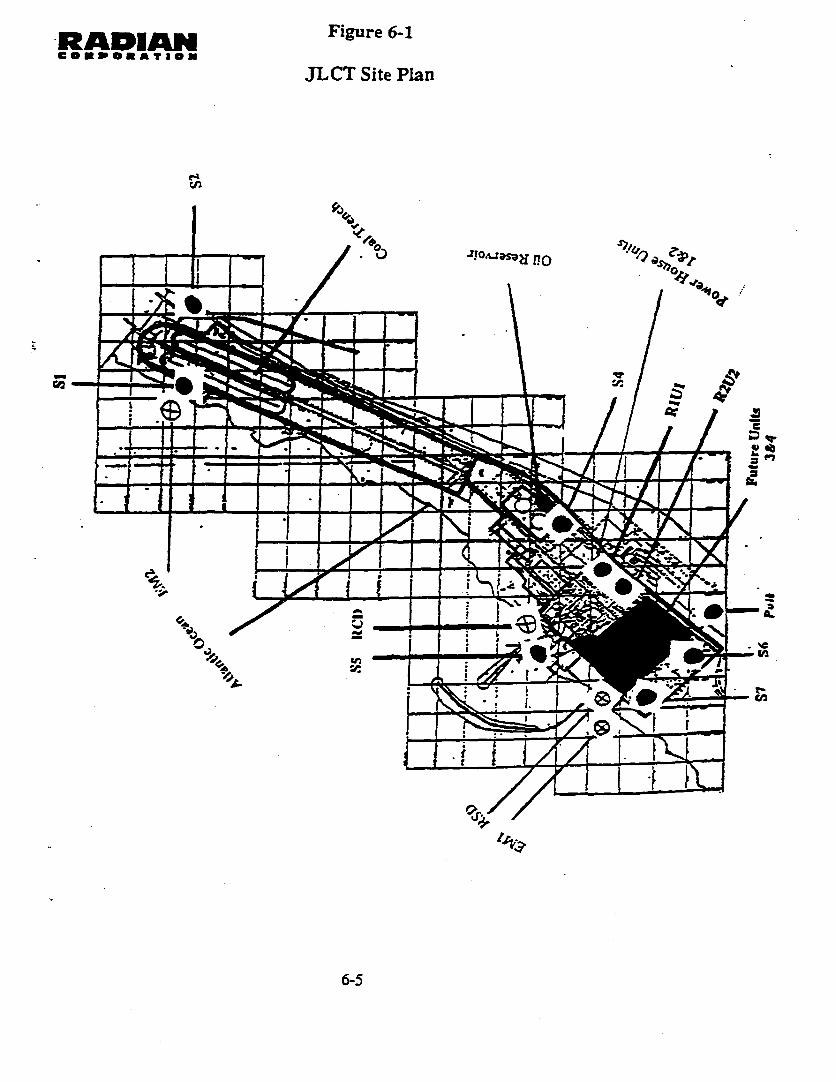
RADIAN Figure 6-1cONOR*.AION
JLCT Site Plan
Y.\
- I I 1 1 -- 1 ?&°D =^JOAJMj pO0
0~~~
- - > i1 ___ / t/
.___ b l}KEss,
I ~ ~ ~ ~ / ___1,
I~~~~~~~~~~~~I
A~~~~~~~~~~~~~~~~~,
4,1
6-5
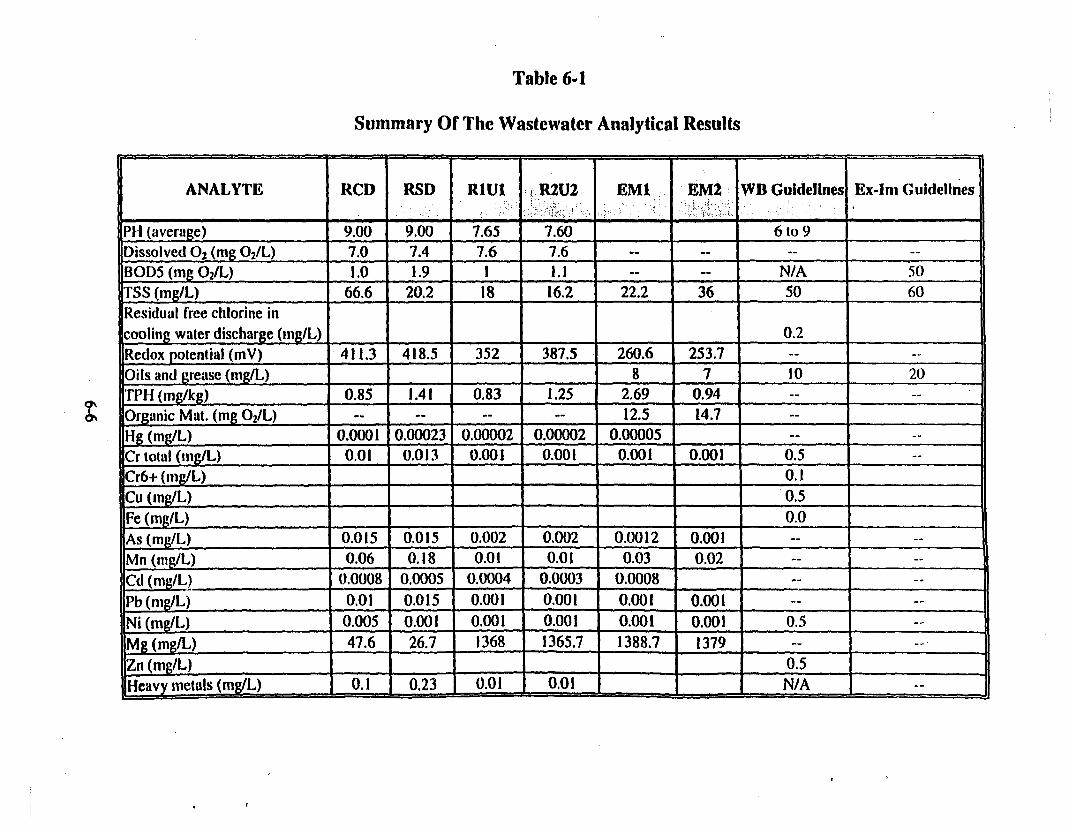
Table 6-1
Summary Of The Wastewater Analytical Results
ANALYTE RCD RSD RIUI R2U2 EMI EM2 WB Guidelines Ex-Im Guidelines
PH (average) 9.00 9.00 7.65 7.60 6 to 9Dissolved O2 (mg 02/L) 7.0 7.4 7.6 7.6 --BODS (mg 021L) 1.0 1.9 1 1.1 -- -- N/A 50TSS (mg/L) 66.6 20.2 18 16.2 22.2 36 50 60Residual free chlorine incooling water discharge (mg/L) . 0.2 .Redox potential (mV) 411.3 418.5 352 387.5 260.6 253.7 -- --Oils and grease (mg/L) 8 7 10 20TPH (mg/kg) 0.85 1.41 0.83 1.25 2.69 0.94 -- --
o't Organic Mat. (mg 02/L) -- -- -- 12.5 14.7H (mg/L) 0.0001 0.00023 0.00002 0.00002 0.00005 --Cr total (mg/L) 0.01 0.013 0.001 0.001 0.001 0.001 0.5Cr6+ (mg/L) - _ 0.1Cu (ing/L) _ _ 0.5Fe (mg/L) 0.0As (mg/L) 0.015 0.015 0.002 0.002 0.0012 0.001 --Mn (rng/L) 0.06 0.18 0.01 0.01 0.03 0.02 -
Cd (rng/L) 0.0008 0.0005 0.0004 0.0003 0.0008 -- .Pb (mg/L) 0.01 0.015 0.001 0.001 0.001 0.001 --Ni (mg/L) 0.005 0.001 0.001 0.001 0.001 0.001 0.5Mg (mg/L) 47.6 26.7 1368 1365.7 1388.7 1379 --Zn (mg/L) 0.5 __.Heav metals (mgJL) 0.1 0.23 0.01 0.01 N/A
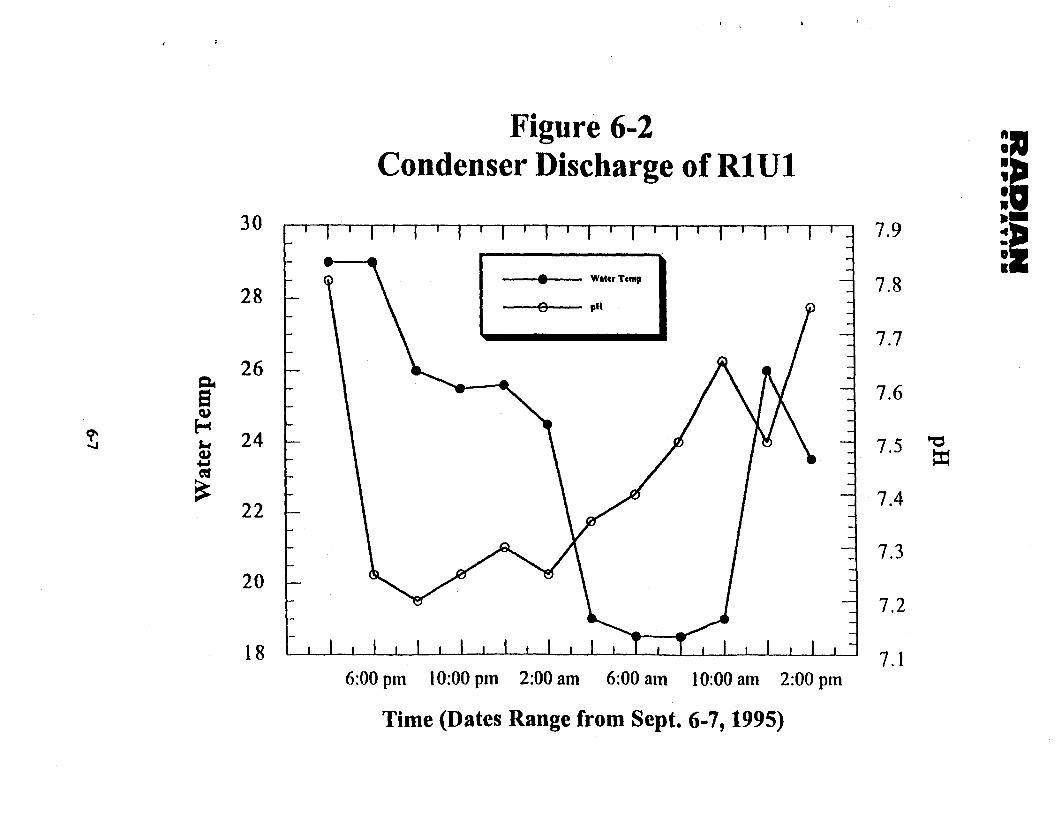
Figure 6-2Condenser Discharge of RlUl
30 , I '-I I ' I ' I ' I ' I I ' I r I I X I 7.9 ^
28 -,- 1 1 I ' I I I, I Wattr Temp 7.8
7.726
7.6
-J ~~, 24 7*5 O
7.422
7.320
7.2
1 8 7.16:00 pm 10:00 pm 2:00 am 6:00 am 10:00 am 2:00 pm
Time (Dates Range from Sept. 6-7, 1995)
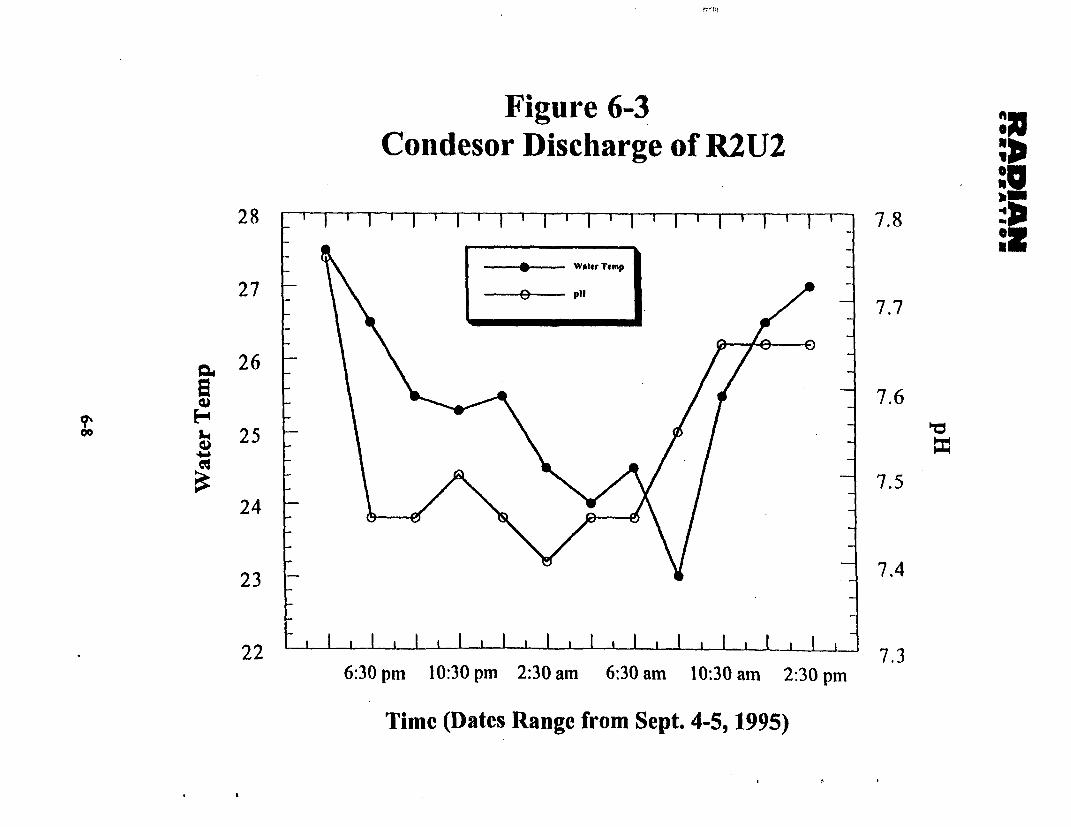
Figure 6-3Condesor Discharge of R2U2
277.7
267.6
25
7.5
24
23
22 I 1 -I X I ' I 1 ' l 7.36:30 pm 10:30 pm 2:30 am 6:30 am 10:30 am 2:30 pm
Time (Dates Range from Sept. 4-5, 1995)
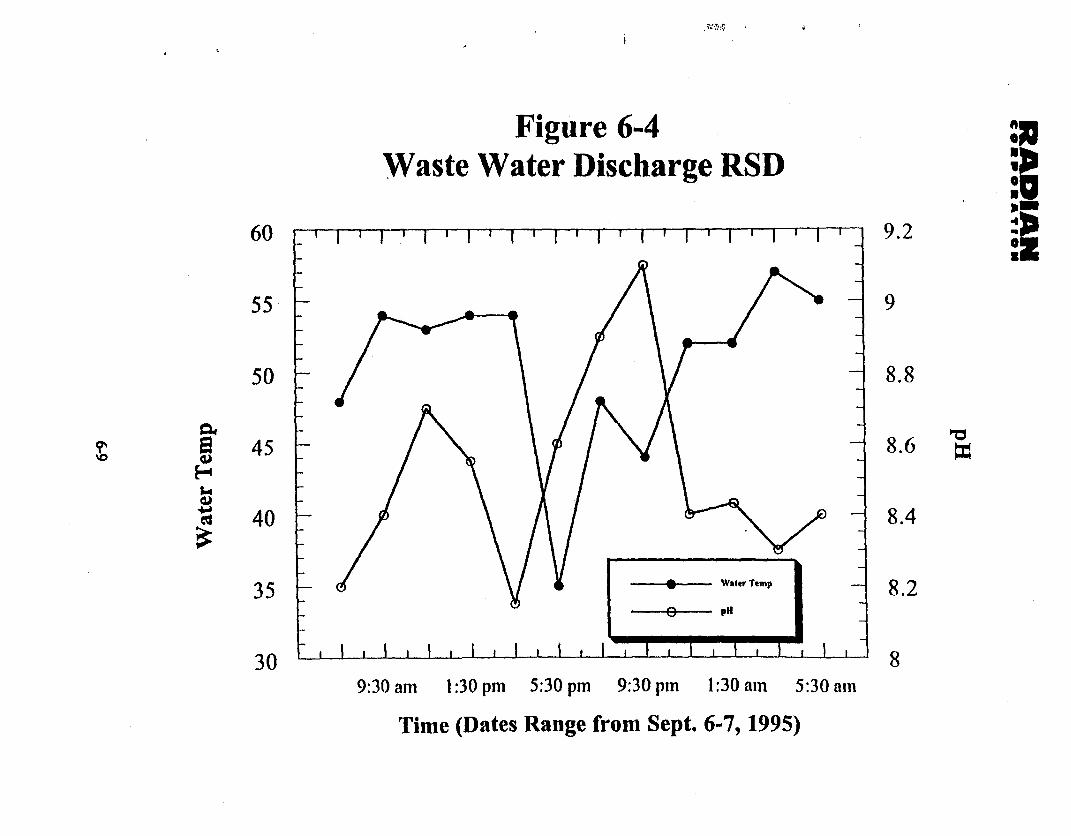
Figure 6-4Waste Water Discharge RSD
60 1 -I- Il I I I I9 .2 e
55 9
50 8.8
45 8.6
40 8.4
35 Water Temp 8.2_ - 9 ~~~~~~~~~~~~~~~pH
30 ' ' ' , j 89:30 am 1:30 pm 5:30 pm 9:30 pm 1:30 am 5:30 am
Time (Dates Range from Sept. 6-7, 1995)
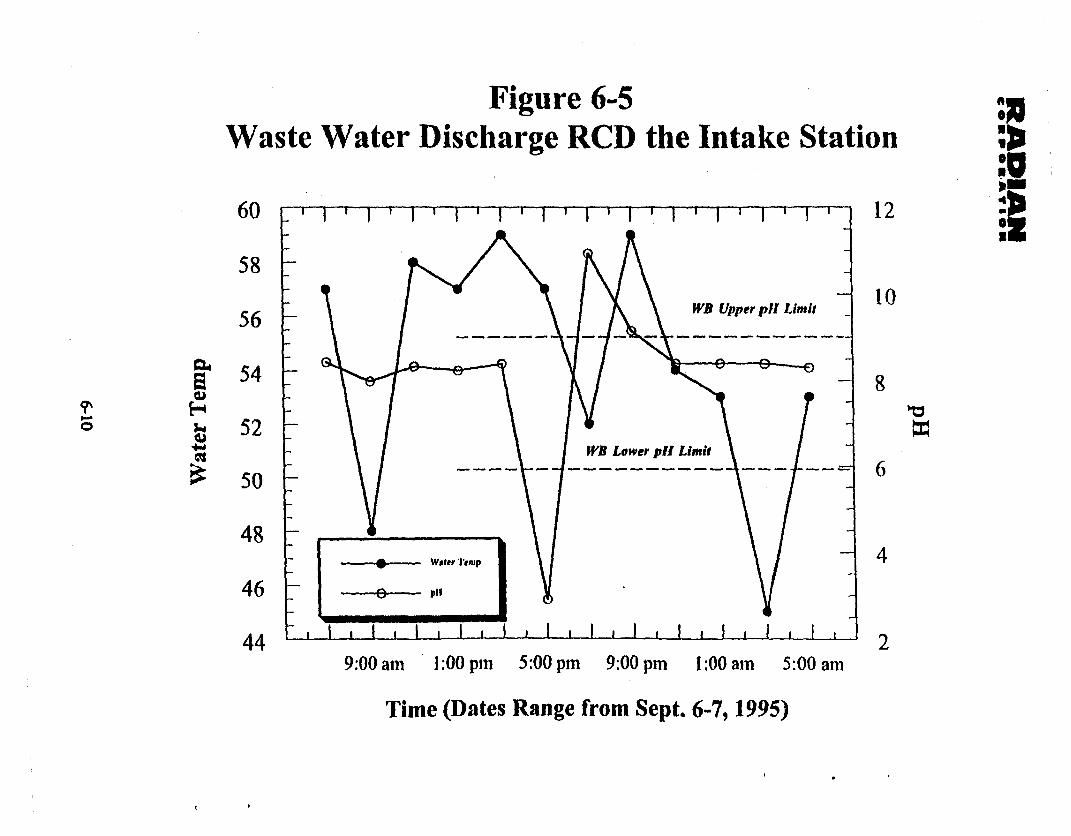
Figure 6-5Waste Water Discharge RCD the Intake Station
60 12
58
56 t I < t WB Upper pH1 Limit 10
52WB Lower pH Limit
506
484
46
44 29:00 am 1:00 pm 5:00 pm 9:00 pm 1:00 am 5:00 am
Time (Dates Range from Sept. 6-7, 1995)
RADIANC OR 0ORAT IO N
7.0 SOIL AND GROUNDWATER
The Phase II activities related to soil and groundwater were designed to assess the
current environmental conditions at the site. Site activities included the advancement of six (6) soil
borings, the development of four (4) piezometers and sampling of the piezometers.
7.1 Site Descrintion
The JLCT is constructed over a flat area consisting of consolidated detritic materials. The
soil consists of compacted sandstone, cemented by carbonates with a fine stratification, in which shells are
easily found, and with a depth of several tens of meters. The site elevation is about seven meters above the
Reference Level of Morrocco (NGM). Grotmdwater was detected at a depth of approximately six meters.
The aquiferous zone is porous and was formed by lateral fresbwater reliefs from the plains that exist
between Casablanca and Safi, and by salt water infiltration from the sea. Thus, the aquiferous zone is saline
and is influenced by the ocean waves and tidal movements.
A drinlkng water well used by local residents is located outside the plant fence line, near
the main entrance to JLCT.
7.2 Samnlins Strate2v
The sanpling strategy employed during Phase I1 was designed to meet the following
objectives:
I. To adequately assess the current environmental conditions of selected soils at thesite; and
2. To document the groundwater quality under the JLCT site in order to detennine ifcontamination from the site or off site sources has, or is, occurring.
The locations of the soil borings and piezometers were selected to obtain representative soil
samples, and upgradient and downgradient groundwater samnples. The actual locations of the soil borings
and piezometers are shown on Figure 6-1, in Section 6 of this report. A brief written description of each
7-1
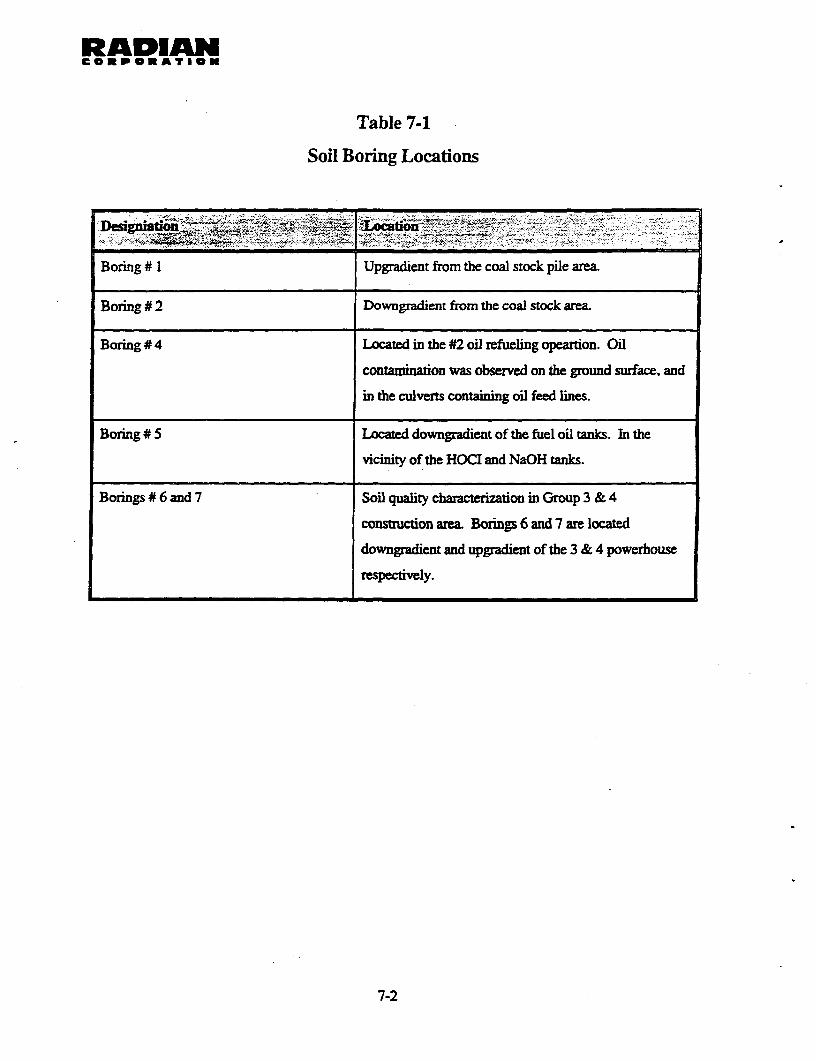
RADIANCORIPONATION
Table 7-1
Soil Boring Locations
Boring# 1 Upgradient from the coal stock pile area.
Boring #2 Downgradient from the coal stock area.
Boring # 4 Located in the #2 oil refueling opeartion. Oil
contamination was observed on the ground surface, and
in the culverts contining oil feed lines.
Borng # 5 downgradient of the fuel oil tanks. In the
vicinity of the HOCI and NaOH tanks.
Borings# 6 and 7 Soil quality characteization in Group 3 & 4
construction area Borings 6 and 7 are located
downgradient and upgradient of the 3 & 4 powerhouse
respectively.
7-2
RADIANCORPORATION
location is provided in Table 7-1.
Piezometers were installed at four (4) of the six (6) borings. The location and
design/configuration of these piezometers was selected so that they could be used for ongoing groundwater
quality and level surviellance.
Undisturbed soil samples were subjected to visual inspection and subsequent quantitative
analysis. The result of these analyses are presented in subsequent subsections.
Placement of soil boring and subsequent piezometers was coordinated closely with the
ONE and the JLCT personnel to ensure safe and successful drilling and soil and groundwater sampling
activities.
73 Methlodolofv
Drilling was accomplished with a hollow stem augur drill, model "Mobile Drill B-24",
with widia and diorite extraction devices. Six borings were made with a total of 44.7 meters and a boring
diameter of 101 mm. The depth of each of the borings was approximately 8 meters, except boring #6 and
#7, which were 6.1 and 6.0 meters respectively. Extracted soil was placed in an observation box to ease
visual analysis. Sample observation of the soil during drilling allowed Radian to document litological and
textual characteristics of the area, and to draw a geological profile of each boring point. Two soil samples,
at two different depths were collected from each boring. Probable hydrocarbon contamination was observed
in boring #4, at 4.3 and 4.6 meters deep, and in boring #7 at 1.5-2.0 meters deep. In both cases, samples
were collected for laboratory analysis.
After completion of drilling and soil sampling activities the installation of piezometers
began using 50 millimeter PVC pipe. The characteristics of the piezometers are showed in Table 7-2, and
the construction scheme is shown in Figure 7- 1. The piezometric pipe extends approximately 30
centimeters above the surface for ease of access. As a security and protection measure for the piezometer, a
concrete vault was constructed at the ground level. Each piezometer was closed with a metal cap - which
requires the use of a special wrench to be opened. This measure was taken to prevent direct penetration of
7-3
RADIANC@EP@3AYI@U Figure 7-1
Piezometer Construction.
0 < ~~~~ ~~~~~Vault|0~
-- Blank P.V.C. Pipe
Bentonite
3
4
- sLSlotted P.V.C. Pipe
Gravel Pack
4 ._. * * JORF LASFARPOWER PLA~NT
/ L -' §IZ"j - . : Co"s~~~~~~~~mmgtlee
74FIGURE 1
7-4
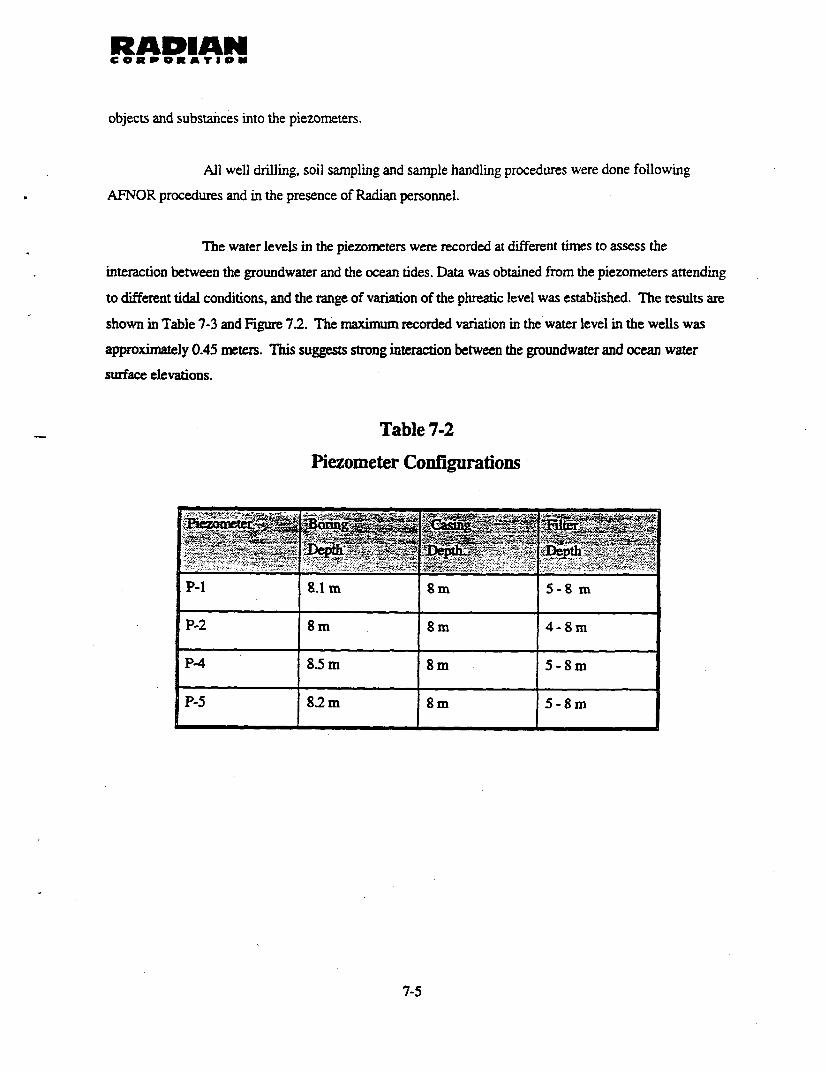
RADIAN
objects and substances into the piezometers.
All well drilling, soil sampling and sample handling procedures were done following
AFNOR procedures and in the presence of Radian personnel.
The water levels in the piezometers were recorded at different times to assess the
interaction between the groundwater and the ocean tides. Data was obtained from the piezometers attending
to different tidal conditions, and the range of variation of the phreatic level was established. The results are
shown in Table 7-3 and Figure 7.2. The maxinmm recorded variation in the water level in the wells was
approxinately 0.45 meters. This suggests srong interaction between the groundwater and ocean water
surface elevations.
Table 7-2
Piezometer Configurations
P-1 8.1m 8m 5-8m
P-2 8m gm 4-Sm
PA4 8.5m 8m 5-8m
P-5 8.2m 8m 5-8m
7-5
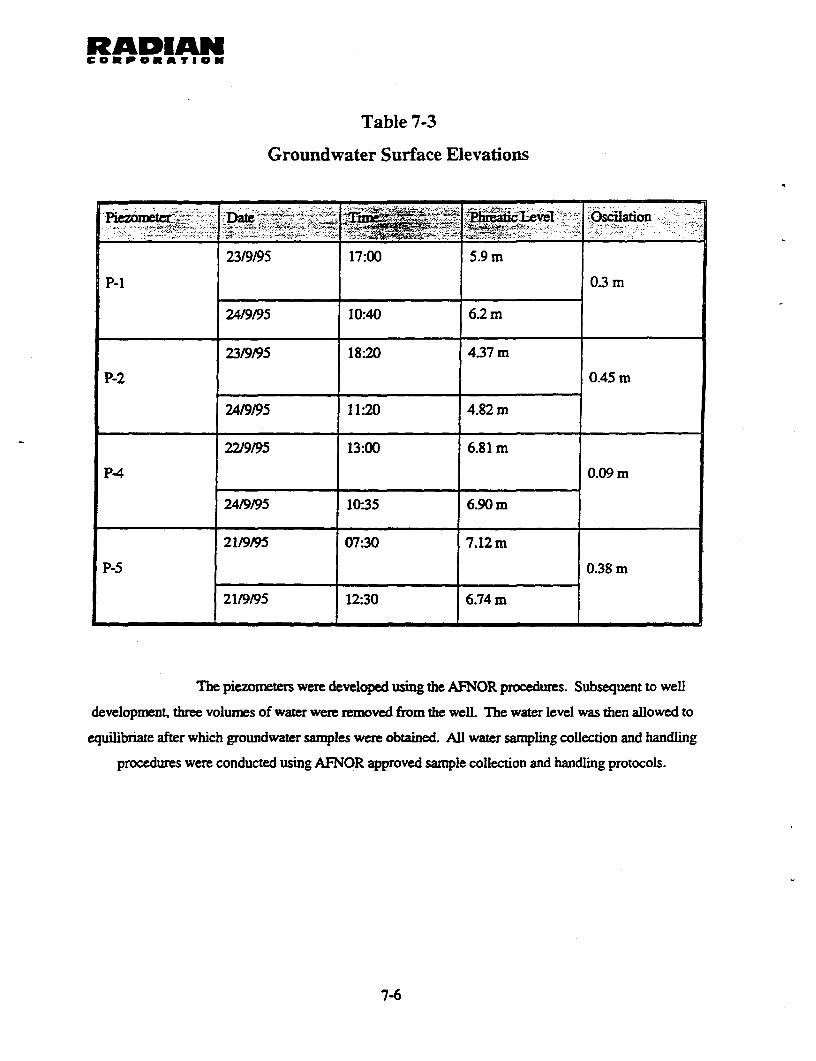
RADIANCORPORATIOM
Table 7-3
Groundwater Surface Elevations
23/9/95 17:00 5.9 m
P-1 0.3 m
24/9/95 10:40 6.2 m
2319/95 18:20 4.37 m_
P-2 0.45 m
24/9195 11:20 4.82 m
22/9195 13:00 6.81 m
P-4 0.09 m
24/9/95 10:35 6.90 m
21/9/95 07:30 7.12 m
P-5 0.38 m
21/9/95 12:30 6.74 m
The piezometers were developed using the AFNOR procedures. Subsequent to well
development, three volumes of water were removed from the well. The water level was then allowed to
equilibriate after which groundwater samples were obtained. All water sampling collection and handling
procedures were conducted using AFNOR approved sample collection and handling protocols.
7-6
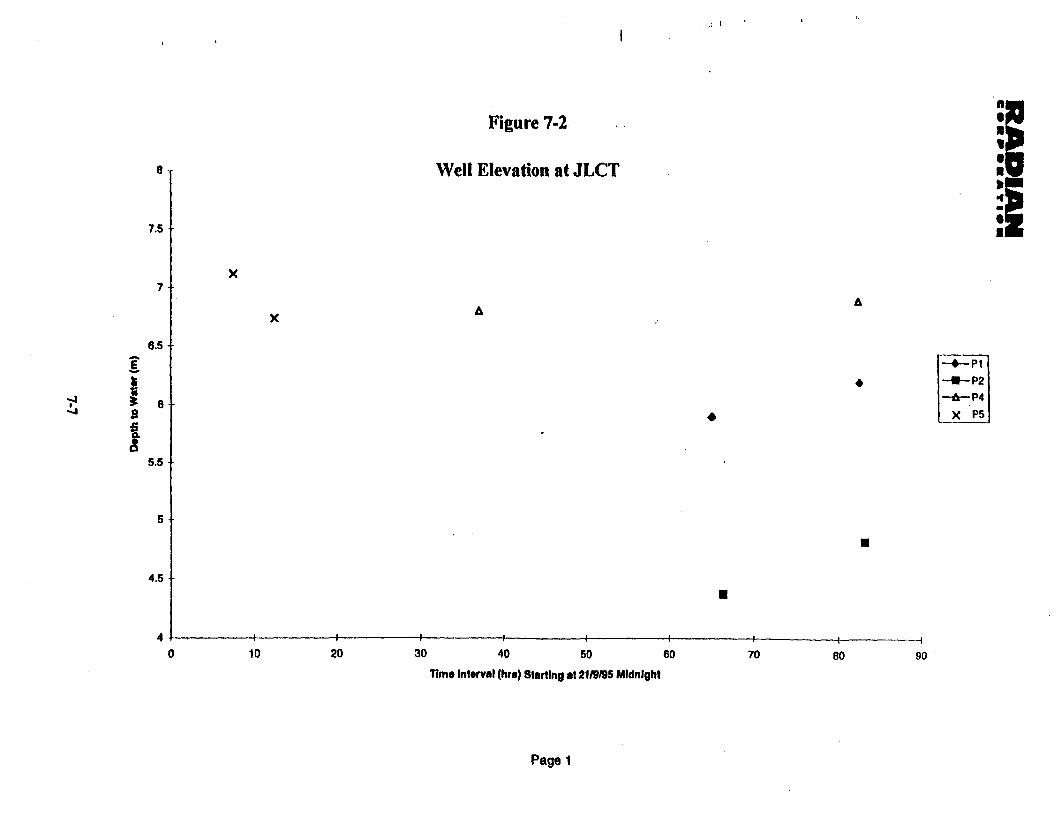
Figure 7-2
8 Well Elevation at JLCT I7.5 :1
x7
x A
6.5
* ~~6 6a x 'Ps
5.5
5
4.5
4~~~~~~~~~~~~~~~~~
4 . I I l I _@§
0 10 20 30 40 50 60 70 80 90
Time Interval (hr.) Starting at 21t995 Mldnight
Page 1
RADIANCOEP*RATISN
7.4 Results
Results of soil and groundwater analysis are discussed below.
7.4.1 Soil
The results of soil sample analyses are presented in Table 7-4.
No criteria are provided by the WB Guidelines or by the US Ex-Im Guidelines for soil
quality. The following observations have been made with regards to the above results.
1. The soil is alkaline. During the field work it was noted that the lithologyconsists of calcareous soils and rocks and there is a high content of Mg in thesoil. So it is believed, from a geological point of view, that the soils which arepresent at the site are dolomitic.
2. The salt content of soils appears to be low, as indicated by the conductivityvalues.
3. The measured organic carbon levels are high in sample S-4 taken at a depth of4.3 meters, and in samples S-7 taken at depths of 0.5 and 1.5 meters. Thesevalues should be put in context with observed staining of these samples. Itshould be noted that the TPH contents of these 3 samples is not high. However,this fact could be related to the low level of volatiles in the sample.Altematively, it is possible that the sample extraction procedure should bemodified. This issue is currently being evaluated.
4. Taking into account the location of the boreholes and the results obtained for theanalyses of metals, it seems that there is no relationship between the sampleslocation and depth and the concentrations measured. In general, the metalscontent is not high and corresponds to the regional concentration of metals,rather that being influenced by the JLCT activities.
7-8
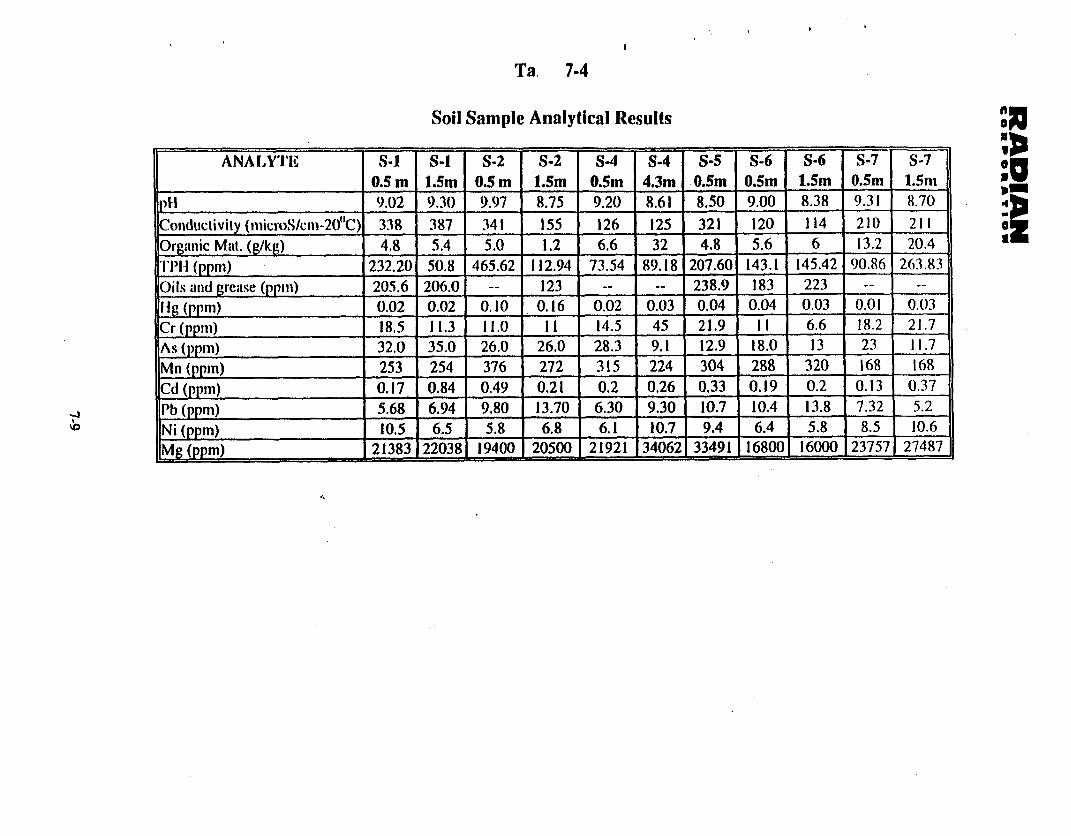
Ta. 7-4
Soil Sample Analytical Results
ANALYI'E S-1 S-I S-2 S-2 S-4 S-4 S-5 S-6 S-6 SO7 S-70.5 m 1.5m 0.5 m l.5m 0.5m 4.3m 0.5m 0.5m 1.Sm 0.5m 1.Smn 9
pt1 9.02 9.30) 9.97 8.75 9.20 8.61 8.50 9.00 8.38 9.31 8.70Conduictivity (microS/cm-20"C) 338 387 341 155 126 125 321 120 114 210 211 Organic Mat. (g/kg) 4.8 5.4 5.0 1.2 6.6 32 4.8 5.6 6 13.2 20.4ITH (ppm) 232.20 50.8 465.62 112.94 73.54 89.18 207.60 143.1 145.42 90.86 263.83Oils and grease (ppm) 205.6 206.0 -- 123 -- -- 238.9 183 223 -- --fig (ppm) 0.02 0.02 0.10 0.16 0.02 0.03 0.04 0.04 0.03 0.01 0.03Cr(ppin) 18.5 11.3 11.0 11 14.5 45 21.9 11 6.6 18.2 21.7As (ppm) 32.0 35.0 26.0 26.0 28.3 9.1 12.9 18.0 13 23 11.7Mn (ppm) 253 254 376 272 315 224 304 288 320 168 168Cd (ppm) 0.17 0.84 0.49 0.21 0.2 0.26 0.33 0.19 0.2 0.13 0.37Pb (ppm) 5.68 6.94 9.80 13.70 6.30 9.30 10.7 10.4 13.8 7.32 5.2Ni (ppm) 10.5 6.5 5.8 6.8 6.1 10.7 9.4 6.4 5.8 8.5 10.6Mg (ppm) 21383 22038 19400 20500 21921 34062 33491 16800 16000 23757 27487
RADIANcoRPoRATIoN
The analysis of the metals concentrations in the soil samples indicates significant
variability. No comparative background soil heavy metals data is available. However, the variation in
the data suggests that the heavy metals concentrations are not likely due to plant operations.
7A.2 Groundwater
Table 7-5 presents the results of the analyses perforned on the groundwater samples
collected at the JLCT site.
At this time; no criteria are provided in the WB Guidelines or by the US Ex-Im
Guidelines for groundwater. The WB wastewater discharge criteria will be employed for evaluation
purposes. A comparison between the values included in Table 7-5 and Table 6-3 (wastewater sampling
analysis results) is presented below.
1. Conductivity measurements appear to show that there is an influx of sea water
mto the site aquifer. Boreholes S-2 and S-5, which are quite close to the shore
line, have higher conductivity values. More in-land samples (S-1, S-4 and the
drinking well) have lower values.
2. The measured metals concentrations in the drinking well outside the site fence
are similar to those obtained in the piezometers installed in boreholes S-1, S-2,
S-4 and S-5. Assuming that the well is not affected by the JLCT activities, it
7-10
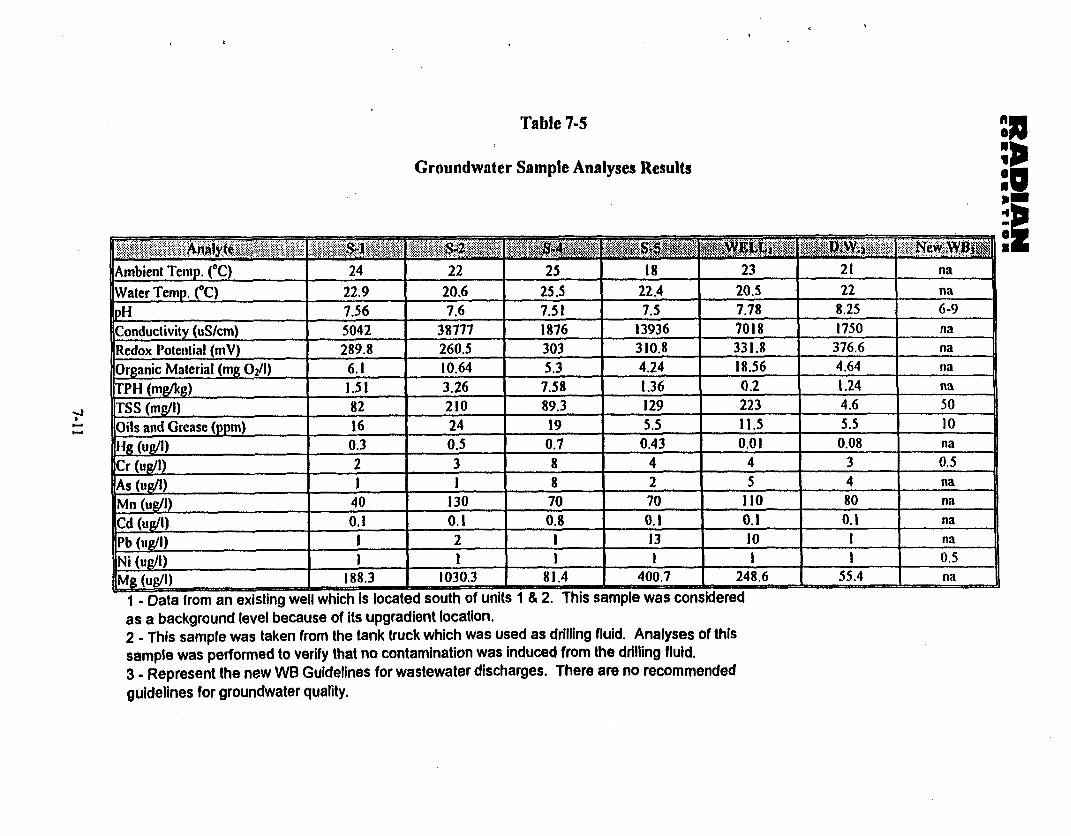
Table 7-5
Groundwater Sample Analyses Results
|: ?81y _ 6kll|?t'? .,s<?' .............................................. |o
Ambient Temp. (°C) 24 22 25 18 23 21 naWater Temp. (CC) 22.9 20.6 25.5 22.4 20.5 22 napH 7.56 7.6 7.51 7.5 7.78 8.25 6-9Conductivity (uS/cm) 5042 38177 1876 13936 7018 1750 naRedox Poteiitial (mV) 289.8 260.5 303 310.8 331.8 376.6 naOrganic Material (mg 02/1) 6.1 10.64 5.3 4.24 18.56 4.64 naTPH (mgtkg) I.S I 3.26 7.58 1.36 0.2 1.24 na
., ITSS (mgll) 82 210 89.3 129 223 4.6 50_ I .. Oils and Grease (ppm) 16 24 19 5.5 11.5 5.5 10
Hg (uNO) 0.3 O.5 0.7 0.43 0.01 0.08 vnaCr (ug/) 2 3 8 4 4 3 0.5
1As I_ _ __) I I 8 2 5 4 naMn (uNO) 40 130 70 70 110 80 naCd(Ug/l) 0.I 0.1 0.8 0.1 0.I 0.1 naPb (UgI) I 2 I 13 10 I naNi (ug/1) I I I I I I 0.5Mg (Ug/£) 188.3 1030.3 81.4 400.7 248.6 55.4 naI - Data from an existing well which Is located south of units 1 & 2. This sample was consideredas a background level because of Its upgradient location.2 - This sample was taken from the tank truck which was used as drilling fluid. Analyses of thissample was performed to verify that no contamination was induced from the drilling fluid.3 - Represent the new WB Guidelines for wastewater discharges. There are no recommendedguidelines for groundwater quality.
RADIANCOPOSRATIOM
appears that the metal concentrations detected in the groundwater samples are
related to the regional contents of these metals in the subsoil, rather than to the
site activities.
3. While the measured value of oils and grease in the drinking well sample
and the groundwater samples are similar, the measured values of TPH are
significantly different. The concentration of oils and grease (5.5 mg/1) and TPH
(1.24 mg/kg) in the drinking well sample suggest that at least part of the
concentration measured in the groundwater samples could be related to the
addition of water to the boreholes for drilling.
4. The pH measured in sample S-5 is 7.50. This sample was collected
downgradient of the Chlorine and NaOH storage tanks. This pH value indicates
no Chlorine or NaOH contamination.
7-12
RADIANCORP ORAT ION
8.0 THERMAL DISCHARGE
8.1 Overview
Units 1 and 2 are cooled via a once through cooling system using sea water. The
cooling water net temperature increase is subject to the WB and the Ex-Im Guidelines. The WB
Guidelines specify that the discharge water temperature increase must not exceed 3°C at the edge
of the mixing zone. The Ex-Im Guidelines specify the net temperature increase must not exceed
5°C. Furthermore, the Ex-Im Guidelines state that the edge of the mixing zone is 25% of the
receiving channel width. A rigorous definition of the edge of the mixing zone is the length at
which 90% of the jet is diluted in the receiving water. The temperature increase of the resulting
flly mixed plume should be about one tenth the excess of discharge temperature over the
receiving water temperature. The WB Guidelines indicate that for wide receiving bodies of
water, the designated edge of the mixing zone is 100 m away from the discharge location The
Phase II thermal discharge analysis objective is to compute the net temperature increase at the
edge of the mixing zone following the 90% dilution concept and the WB designated mixing
length.
The Jorf Lasfar cooling water flow rate is less than 76,000 m3/hr. The discharge
channel is 26 meters wide. Over a period of 24 hours, the ambient temperature and the water
temperature were measured every four hours at the following locations:
* The plant intake;
* The discharge point for condenser Unit 1;
* The discharge point for condenser Unit 2; and
* The point of channel discharge into the ocean.
8-1
RADIANCOPOREATION
Figure 8-1 presents the study results. These results indicate the net water
temperature increase at the ocean discharge point was about 9 degrees C. The ambient
temperature was typically high enough to have no measurable impact on the cooling of the
channel. The channel discharges into a relatively shallow ocean region with a negative slope of
1:10. The ocean region is subject to a south westerly current averaging about 0.25 m/s. The tidal
range is 3.5 meters maximum. The waves of tide and the south westerly current deflect the
thermnal jet toward the south west and significantly enhance the jet dilution.
8.2 Analysis Procedure
Extensive literature studies have been conducted to determine the mixing length
of rectangular jets in deep water with a uniform cross flow current. As a preliminary analysis of
the problem, a scaling length analysis was done using the theory developed by Jirka (1990) for
outfall mixing length with cross flow. An alternative mixmg length analysis was also done using
the theory developed by Baddour et al. (1991) for the discharge of a rectangular channel into a
deep body of water. The theory of Baddour does not consider cross flow. The results of these
analyses are shown in Appendix L. Both scaling analysis techniques yield the mixing length
required for greater than 90% dilution.
One particular feature of the thermal discharge at Jorf Lasfar is that the channel
discharges into a shallow ocean region. According to JLCT personnel, the receiving water depth
increases until a depth of 8 meters at about 80 meters away from shore. Afterwards, the water
depth continues to increase at a much slower rate. Although this information is preliminary, the
information is sufficient for a first order analysis of the plant thermal discharge. A three
dimensional computational fluid dynamics (CFD) tool was employed to model the discharge jet
mixing in shallow water subject to a cross current. A cross current value of 0.25 m/s was
reported in the ONE JLCI Site Information, Part IV, dated October 1994.
8-2
RADIANC OR BP ORA T IO N
The following are the assumptions employed in the scaling length analysis (where
appropriate) and the CFD model development:
* The discharge flow rate is 76,000 m3/hr corresponding to a dischargevelocity of 0.81m/sec;
* The Channel width is 26 meters, and the water depth in the channel is 1meter;
lThe channel discharge temperature is 9 degrees C above ambient watertemperature;
nThe average ocean current velocity is 0.25 mrs;
* Te ocean water is shallow at the discharge point with maximum depth of8 meters approximately 80 meters away from shore;
The density gradients between the discharge water and the receiving waterare neglected; and
Atmospheric cooling effects are neglected.
83 Analysis Results
The model results indicated that the mixing length is a strong function of the cross
current flow. At a discharge rate of 76,000 m&Ihr, the mixing length was determined at the
average cross current flow of 0.25 m/s. The mixing length was determined using three
methodologies:
Scaling length analysis based on available literature on the outfalldischarges in wide bodies of water with cross flow;
* Scaling length analysis based on available literature on rectangular channeldischarges in deep bodies of water without cross flow; and
* State of the art three dimensional CFD.
8-3
RADIAN
The World bank guidelines define the net temperature increase for an open body
of water to be less than 3 degrees C at about 100 m away from the discharge outlet. The scaling
length analyses and the numerical simulation results are presented in Table 8-1 and Table 8-2.
The Tables show the mixing lengths, and the water temperature at the edge of the mixing zone
and at 100 meters away from channel. The data indicated that the net temperature increase at 100
meters away from the discharge outlet is less than 1.0 degrees C.
The scaling length analyses and the numerical modeling results indicated that the
90% dilution length from the discharge point is obtained at 5.1 and 10.2 meters using the scaling
length analysis. The CFD analysis indicated the edge of the mixing zone is approximately 50
meters. Representative temperature profiles are shown in Figures 8-2 through 8-3 for the case of
average cross current velocity of 0.25 mls. These figures demonstrate the complex nature of the
mixing zone and the temperature profiles.
In summary, the scaling length analyses and CFD modeling results are
significantly different. This is due to the fact that the thermal discharge occurs in a shallow body
of water with a significant cross flow ocean current. For this reason, Radian decided to use the
C.FD modeling to calculate the mixing zone length and the temperature increase at the edge of
the mixing zone.
8A Summary
The results of the thermal modeling for the discharges from JLCT 1 and 2 indicate
that the thermal discharges from Jorf Lasfar comply with the WB and Ex-Im Guidelines. The
net temperature increase at the edge of the mixing length is less than 1.3 degrees C for the
scenarios modeled.
8-4
RADIANCORW ORAT I O
Table 8-1
Thermal Discharge Modeling Assumptions
Assumptions
Cooling Water Flow (m3/hr) 76,000
Cooling Water Velocity (mls) 0.81
Cooling Water Temperature 9Increase (c)
Ocean South Westerly Current 0.25
Velocity (m/s)
Table 8-2
Thermal Discharge Modeling Results
Method of Analysis 'Edge of Mixing Zone (m) Temperature Increase at_________________________ _________________________ Edge of Mixing Zone (c)
Scaling Length Method I (90% 5.1 0.9
dilution factor)
Scaling Length Method 11 10.2 0.9
(90% dilution factor)
CFD Model Results (90% 50 1.3
dilution factor)
CFD Model Results (WB 100 0.6
Guidelines
8-5
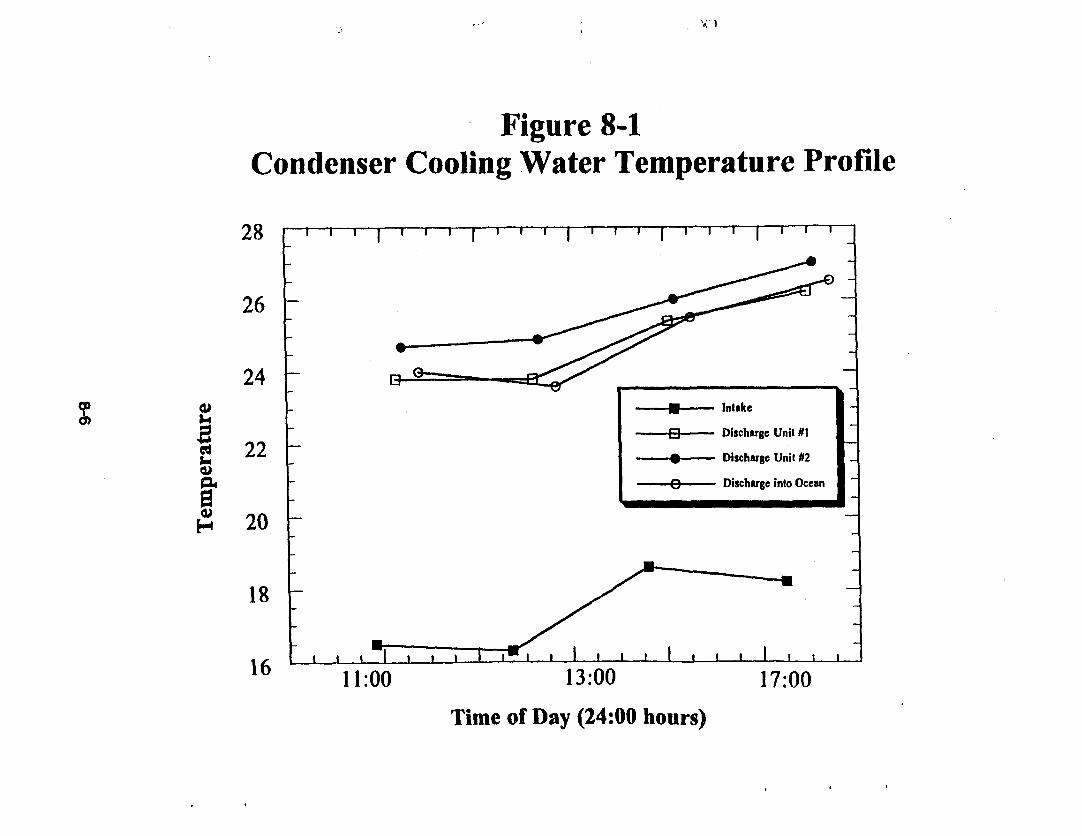
.1 ~~~~~~~~~~~~~~~~~: .1
Figure 8-1Condenser Cooling Water Temperature Profile
28 1 1 , 1 i 1
26
24 -_ _3_
_- Intake
_B------ Discharge Unit #l22 - Discharge Unit #2
-e--20-- Discharge into Ocean
20
18
11:00 13:00 17:00
Time of Day (24:00 hours)
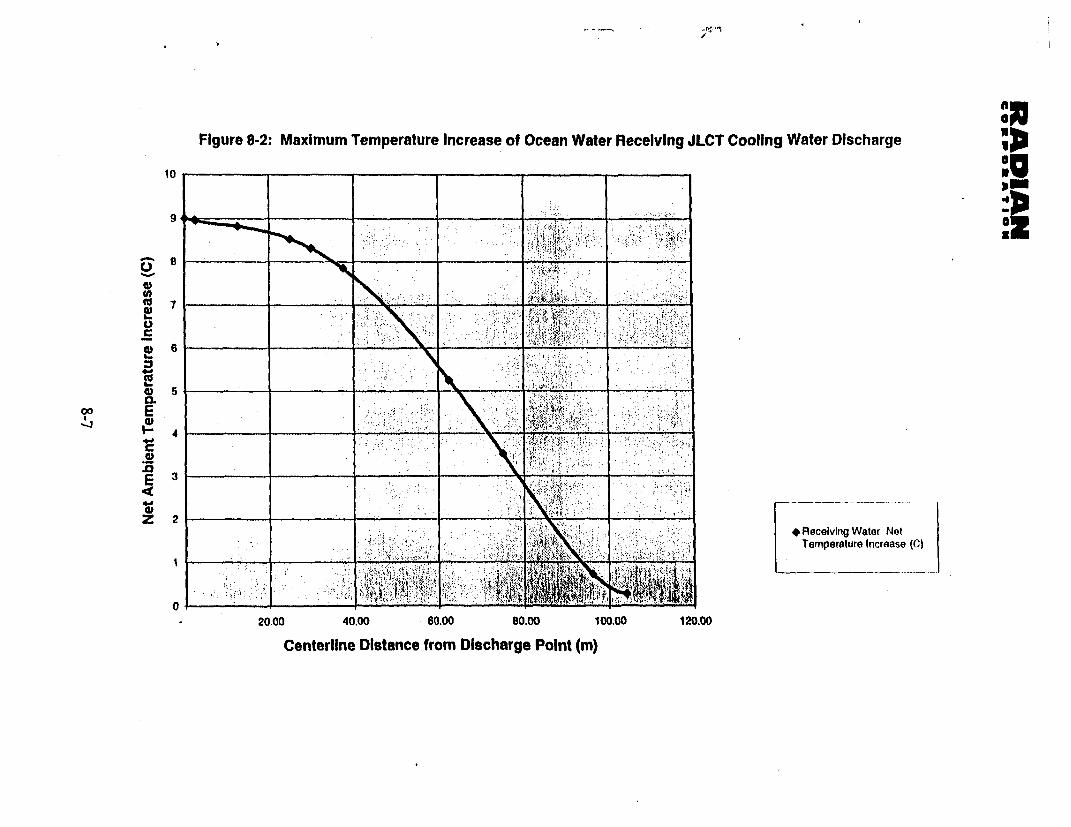
Figure 8-2: Maximum Temperature Increase of Ocean Water Receiving JLCT Cooling Water Discharge
10 _ _ __ _ __ _ Om
9 . 7 _ _ _ _ ii w,,
B
In 6 . , - Vt CLU00
S... : i- . ,
1 . .; . \,99;,, ,., 15 .,, j .> X |_ j''"'f'.'3.'d *Recelcevving Wter Not
0.
0 ___ _____
20.00 40.00 60.00 eo.oo 100.00 120.00
Centerilne Distance from Discharge Pomnt (m)
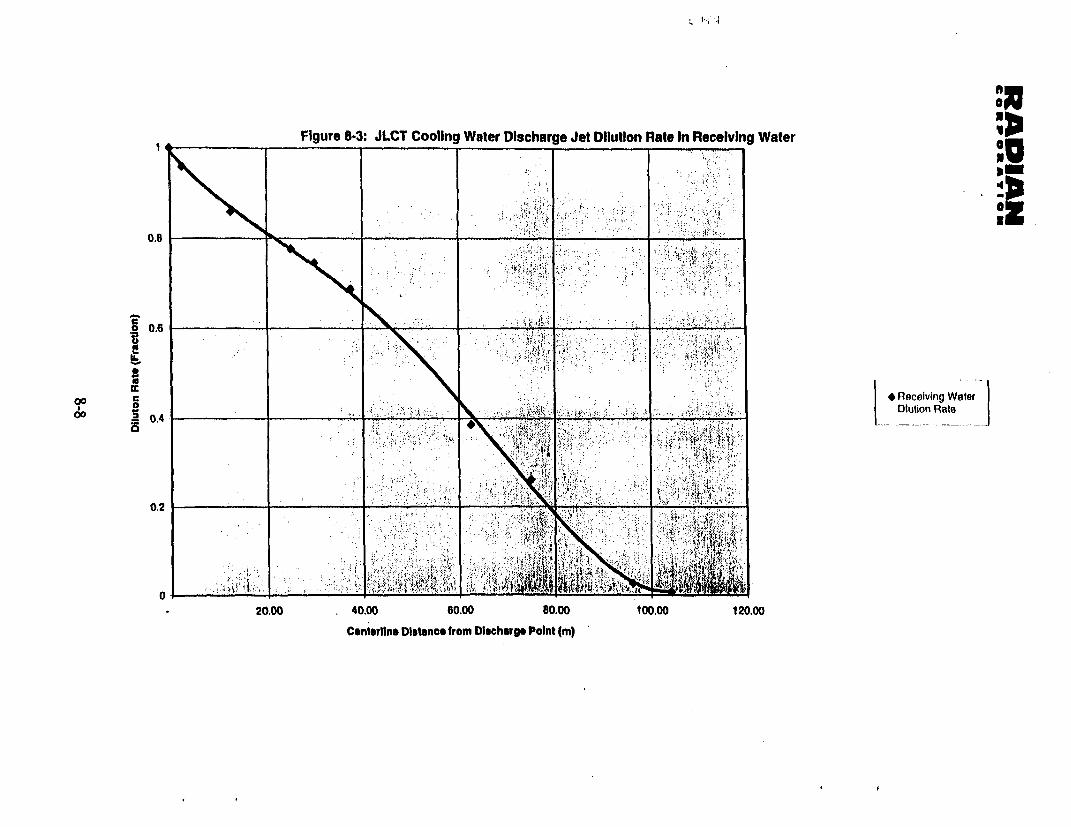
Figure 8-3: JLCT Cooling Water Discharge Jet Dilution Rate In Receiving Water
0.6 ~~~~~~~~~~~~~~~~~~~~~~~~~~~~~~~~~~~~~~~~~~X
a 0,6
10.4 _________ [. ., Otution Rate
1A~~~~~~~~
____________ __________ .. u.'~ .;~ .~ . _I I .
0~~~~ ~ _ _ _ _ _ _ _ ''_ _ _ _ _ _ _ _ _ _ _ _ '. . : ' ' 't, i , '; ,d 7 ' '' . ,i a
20.00 40,00 6000 90.00 100.00 120.00
CenterilineDistance from Discharge Point(in)
RADIANCORP ORATION
9.0 ATMOSPHERIC EMISSIONS
The Phase I assessment included a review of the emissions from JLCT units 1
and 2 in order to assess the compliance status of the plant. This section of the report provides the
background and results of the Phase II assessment as relates to atmospheric emissions.
9.1 Overview
The WB Guidelines and the Ex-Im Guidelines for gaseous emissions will both
apply to the JLCr project if financing is sought from these two organizations. The WB
Guidelines are equivalent to or more stringent than the Ex-Im Guidelines for all criteria
pollutants including particulate matter (PM), particulate matter less than 10 microns (PM10),
nitrogen oxides (NO. )as NO2. and sulfur dioxide (SO2). Therefore, this section only examines
the compliance status of the plant with respect to the WB Guidelines. The goal of this aspect of
the Phase II assessment was to determine the compliance status with all applicable requirements
including the WB Guidelines, the Ex-Im Guidelines, and the ONE permit requirements.
During the Phase II site activities, Radian was informed that GEC Alsthom
Corporation had conducted a performance guarantee test for Units 1 and 2 since the Radian
teams visit to the site in June. The performance test included an evaluation of gaseous emissions
at various boiler operating loads, bumer and dampers settings with and without overfire air.
According to the ONE, the test results are preliminary and the ONE and GEC Alsthom are in the
process of finalizing them. The Radian team was permitted to review the preliminary
atmospheric emissions data collected during the performance tests. The performance guarantee
test included NO,, CO and particulate data. S02 emissions were not measured. However, the
S02 emissions can be calculated accurately from available coal analysis data.
9-1
RADIANCORPORATION
9.2 SO7 Emissions
The WB Guidelines will permit up to 232 tonnes of SO2 per day (TPD) from a
four (4) unit operation at JLCT without giving consideration to the ambient levels of S02 and the
potential impact on allowable emissions . Limited data is available on the SO2 ambient
atrnospheric levels and thus a definitive determination of the final allowable emissions cannot be
made at this time. During a monitoring period of seven weeks conducted prior to the
construction of JLCT 1 and 2, the Morocco Office Cheriftain de Phosphate (OCP) was found to
be a major local SO2 pollution source. From this very limited data the SO2 emissions from the
OCP could cause the area to be considered polluted under the WB and Ex-Im Guidelines.
However, due to the limited amount of data, no firm conclusions can be made about the ambient
annual average SO2 levels or the impact that this may have on establishing an emissions
limitation for JLCT units. The WB Guidelines require information on a minimum of one year
ambient monitoring of the background atmospheric levels of NO., SO2, and PM. The results of
one year of ambient monitoring will determine the final classification of the region, and thus the
allowable SO% emissions.
As previously mentioned in section five of this report, Moroccan law abides by
the principle that 'the polluter pays'. Thus, it is reasonable to argue to the WB that the Jorf
Lasfar project is not responsible for the regional ambient SO2 levels and should not be required
to install S52 control equipment or to bum higher priced ultra low sulfur coal.
The S02 emissions at Jorf Lasfar were analyzed for coals from 5 different sources.
The different coals were classified in terms of sulfur levels into ultra low sulfur coal (0.25%),
low sulfur coal (0.8%, 1.0%), and high sulfur coal (2.5%). The expected SO2 emissions using
each type of coal was computed for the JLCT units, with a 65%, 80%, and 100% capacity
factors.
The analysis results are presented in Tables 9.2 and 9.3. This analysis shows that the JLCT
boilers may bum coal with a sulfur content of less than 1.0%, without the need for a scrubber.
9-2
RADIANCORPORATIO1
93 NO,, Emissions
The JLCT 1 and 2 boilers are tangential boilers capable of firing either oil or coal.
The units are designed with a "level I" overfire air system. For this class of boilers, the
maximum NO, emission rate is achieved at about 50% of full load, and is lower at very low
loads and at full load. Radian was allowed a brief review of the preliminary GEC Alsthom test
performance data. While bumning coal, the maximum NO. emission rate of 759 mg/m3. The
average NO. emissions rate while burning coal was computed to be 655 mg/m3. These values
exceed the WB guidelines. The fact that the NO, emissions from these boilers exceed the WB
guidelines should not be cause for immediate concern. Often there can be this level of variation
in emissions in normal day-to-day operation. This is usually due to subtle differences in control
setttings preferred by individual boiler operators, ambient conditions, or fuel changes. Radian
personnel have extensive experience reducing NO, emissions for boilers of all types, firing a
variety of fuels, using existing combustion controls. The extent of NO. reductions obtained is
largely site dependent. Typically, a NO. reduction of 20-25% has been obtained without
adversely affecting unit performance. In a few cases, up to 55% reduction in NOx was achieved
with the existing combustion controls. Combustion optimization for NO, control has the
additional benefit of improving heat rate. In many of the Radian programs, heat rate
improvements of up to 0.5% were obtained. It is worth noting that reduced NO1 emissions
should be achieved at a range of operating set points across the entire load range. These
operating settings should be given to the boiler operators in the form of training guidelines to
ensure continued compliance, and heat rate improvements.
9A Particulate
During the perfornance tests, the particulate emissions were measured at full load
conditions on Units 1 and 2. The preliminary average particulate emission rate was determined
to be 30 ug/m3. The limited data presented to Radian did not differentiate between Units 1 and
2. However, the final performance guarantee report will include the details of this data. This
9-3
RADIANCOKPORATION
emission rate is well within the WB and the Ex-Im Guidelines for particulate emissions. No
further action is required to demonstrate compliance with the WB and Ex-Im Guidelines.
9-4
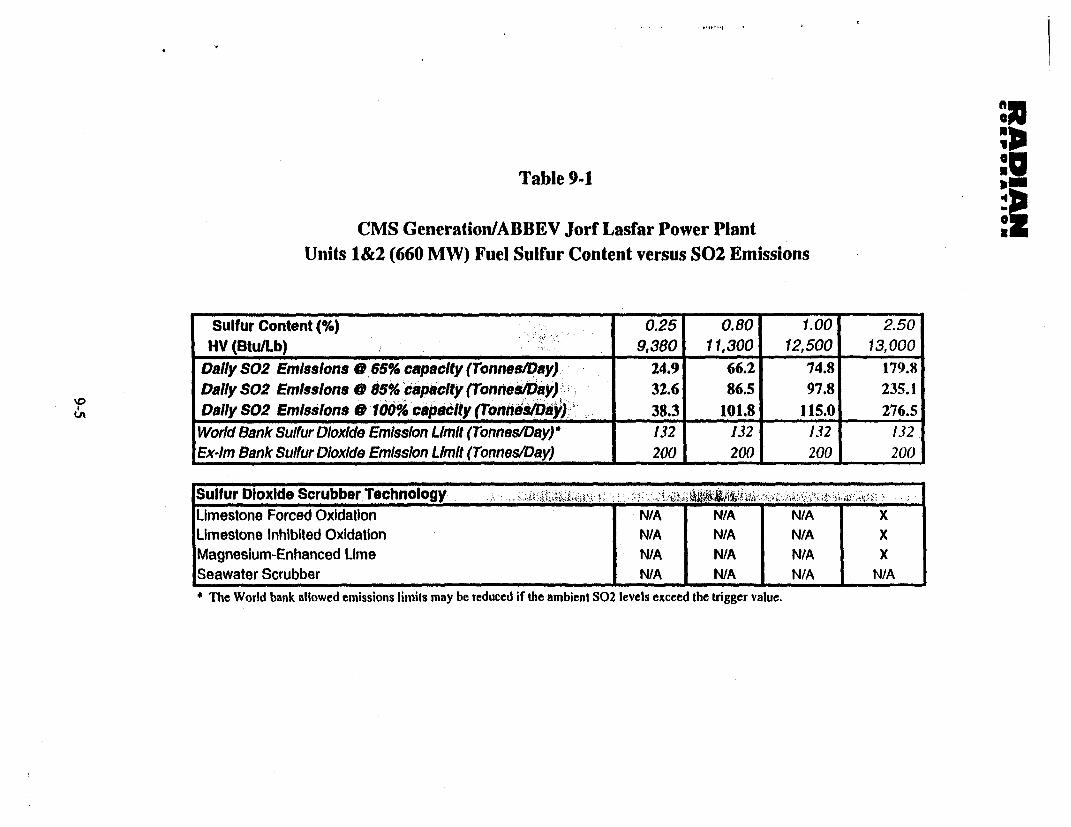
Table 9-1
CMS Generation/ABBEV Jorf Lasfar Power PlantUnits 1&2 (660 MW) Fuel Sulfur Content versus S02 Emissions
Sulfur Content (%) 0.25 0.80 1.00 2.50HV (Btu/Lb) 9,380 11, 300 12,500 13,000
Daily S02 Emissions 0 65% capacity (ronnes/Day) 24.9 66.2 74.8 179.8Daily S02 Emissions 0 85% capacity (Tonnes/Day) 32.6 86.5 97.8 235.1v0 Dally S02 Emissions 0 100% capacity (Tonnes/DayJ 38.3 101.8 115.0 276.5U'
__Diy_0_ms__n a16'caaiy rndsa)383 11. 1. 276__5
World Bank Sulfur Dioxide Emisslon Limit (Tonnes/Day)* 132 132 132 132Ex-im Bank Sulfur Dioxide Emisslon Limit (Tonnes/Day) 200 200 200 200
Sulfur Dioxide Scrubber Technology ___-_______
Limestone Forced Oxidation N/A N/A N/A xLimestone Inhibited Oxidation N/A N/A N/A XMagnesium-Enhanced Lime N/A N/A N/A XSeawater Scrubber N/A N/A N/A IN/A* The World bank allowed emissions limits may be reduced if the ambient S02 levels exceed the trigger value.
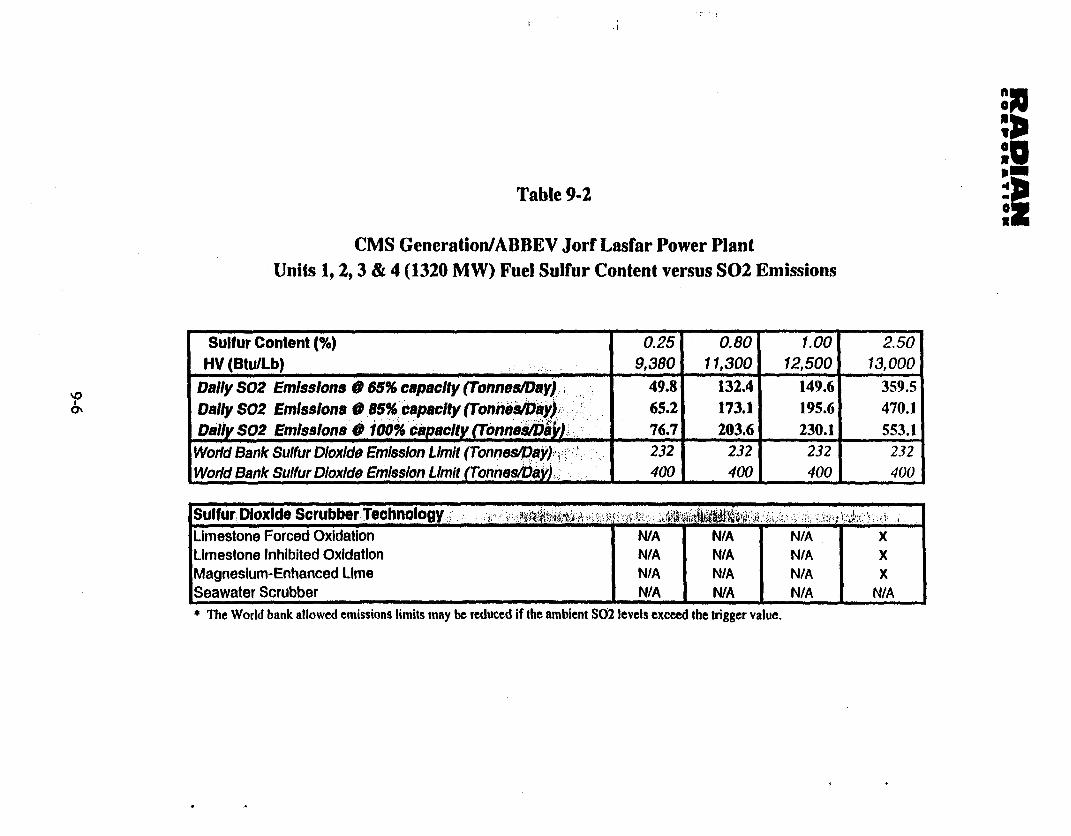
.1
, m
Table 9-2
CMS Generation/ABBEV Jorf Lasfar Power PlantUnits 1, 2, 3 & 4 (1320 MW) Fuel Sulfur Content versus S02 Emissions
Sulfur Content (%) 0.25 0.80 1.00 2.50HV (Btu/Lb) 9,380 11,300 12,500 13,000
Daily S02 Emissions 0 65% capacity (Tonnes/Day) 49.8 132.4 149.6 359.5Daily S02 Emissions 0 65% capacity fTonnehDay) 65.2 173.1 195.6 470.1Dailiy S02 Emissions 0 100% capacity (Tonnesi ) 76.7 203.6 230.1 553.1World Bank Sulfur Dloxlde Emission Limit (Tonnes/Day)4. 232 232 232 232World Bank Sulfur Dloxide Emission Llmit (TonneVay) . 400 400 400 400
Sulfur Dioxlde Scrubber Technology ,4 _ _ ;__________Limestone Forced Oxidation N/A N/A N/A XLimestone Inhibited Oxidation N/A N/A N/A XMagnesium-Enhanced Lime N/A N/A N/A XSeawater Scrubber N/A N/A N/A N/A* TMe World bank allowed emissions limits may be reduced if the ambient S02 levels exceed the trigger value.
10.0 CONCLUSIONS
This section of the report provides Radian's conclusions and recommendations
pertaining to the Phase II investigation of the Jorf Lasfar power plant. It is organized in sections
corresponding to the WB and Ex-Im guidelines, the Morocco environmental regulations, and the
results of the site investigation.
10.1 World Bank and Ex-Im Guidelines
Conclusions pertaining to adherence with the new WB and Ex-Im guidelines areas detailed below.
1. The WB guidelines and the US Ex-Im guidelines will be applied to the JozfLasfar project and will require development of the following reports prior toapproval of the loan for the project:
e Development of an Environmental Audit Report (EA) of the existing unitI and 2 operations; and
- Development of an Environmental Impact Assessment (ELA) for theconstruction and operation of units 3 and 4.
2. In general, the WB guidelines are more restrictive than the Ex-Im guidelines.Both guidelines specify recommended emission levels and operating practicesfor the air, water and waste emission from the Jorf Lasfar plant. Due to thelack of ambient monitoring data, significant uncertainty remains concerningthe ultimate allowable emission of sulfur dioxide from all four units under theWB guidelines
3. Unlike the provision of the 1988 WB Guidelines, the 1995 guidelines appearto provide some relief from the rigid guidelines that would have applied toareas that would have been classified as "polluted". However, if the airquality in the vicinity of the plant is above the trigger value (to be establishedby the WB and the Moroccan government), a more comprehensive anddetailed EIA will be required to address and resolve the question of how theelevated values will be addressed on both a long term and short term basis.Once said ELA is completed and the conclusions approved by the WB,allowable sulfur dioxide emission rates can be definitively established.

4. The Ex-Im guidelines specify a 100 tonnes per day sulfur dioxide guidelinefor "polluted" areas which apply to individual units (400 tonnes/day total).Burning any of the low sulfur coals now under consideration the emissions ofsulfur dioxide on a per unit basis will be less than 100 tonnes per day. Theproject will thus be eligible for the Ex-Im "Environmental Exports Program"which would provide some increased economic incentives. However, Ex-Imfinancing will likely be approved if the project will comply with the WBguidelines.
5. Sulfur dioxide remains the pollutant of most concem. The WB Guidelinesstate that one year of ambient air quality data is required to assess whether thesite is above the trigger value. Additionally, the guidelines specify thatambient monitoring at three (3) locations outside the plant fence will berequired after operations begin.
10.2 Moroccan Environmental Reulations. Laws, and Permittinf
The following conclusion relative to the current and future status of Moroccan
environmental laws and regulations, as well as the construction and operating permit
requirements have been made:
1. The Morocco Legal Environmental famework is still mostly undeveloped.Only a general law conceming water has been approved and is stillpending final publication. As of today, no specific legal standards,besides the particular conditions included in the operation permit of units 1and 2, seem to apply to either the gaseous emissions, water discharges orsolid wastes produced at Jorf Lasfar. As a result, no significant economicinvestment seems to be required to comply with any existing Moroccanstandard. If and when new laws are passed that would require specificoperational changes or pollution control measures, existing facilities at thetime of publication will be either exempted from compliance or givenample time to achieve the new standards. Regulations that are adopted inMorocco will give due consideration to the economic impact on existingfacilities such as the Jorf Lasfar project.
2. Morocco intends to develop other specific laws that will focus on separateenvironmental media (e.g. soil, air, waste). However, this process can bequite protracted and will likely take many years. The Ministry ofEnvironment plans for the development of new envirommental laws andregulations include significant involvement and dialogue with theregulated community and all interested parties. Participation of both non-
government organizations (NGO's) and affected industries is encouragedat an early stage in the process of law development. There will be severalintermediate opportunities at which interested industries can lobby for theirinterests during development of an environmental law drafted by theMinistry of Environment. New affected facilities are required to completea formal Environmental Impact Assessment (EIA)process. Successfulcompletion of this step is needed to ensure approval of the new facilityconstruction and operating permit. Morocco has little experience with theEIA process and the Ministry of the Environrment would like to use thefirst few examples of foreign companies investing in Morocco to learn andset up examples that could be used by local Moroccan companies.
103 Wastewater Discharges
The following conclusions are forwarded concerning the compliance status of
wastewater discharges with respect to the new WB and Ex-Im guidelines:
1. Wastewater discharges from units I and 2 are not fully in compliance with theWB guidelines. Occasional pH excursions were observed in the outfall fromthe plant sump system and boiler water treatment system. Total Chromiumconcentrations also exceed the WB guidelines.
2. Sanitary water from the septic system is using dilution as a treatment method.This practice does not conform with the WB Guidelines.
10A Soil and Groundwater Quality
The following conclusions concerning the current soil and groundwater conditions
at the Jorf Lasfar plant are supported by field observations and analytical results:
1. Phase II soil and groundwater soil evaluation indicated that the phreaticsurface was at the ocean water level. This level ranged from -4.7 m to -7.3 mbelow ground surface;
2. There appears to be oil contamination in the soils at the site. Petroleumhydrocarbons were observed in the borings (Tony I assume that thecontamination was observed in all wells at the same kvel based upon thisstatement) at 4.0 to 4.3 meters below ground surface. This contamination wasdetermined to be predominantly in the vadoze zone; and
3. In the event of rain, the site groundwater level wilI likely rise and reach thecontaminated zone.
4. Given that the site groundwater is strongly connected to the ocean water tidalmovement, and in the event that the contamination reaches the groundwater,the contamination could rapidly move to the ocean water and could potentiallycontaminate the marine environment.
10.5 Thermal Discharge
The following conclusion is drawn relative to the compliance status of units 1 and
2 with the WB and Ex-Im thermal discharge gwdelines:
1. The thermal discharge from units 1 and 2 is in compliance with the new WBguideline of less than 3 degrees Celsius increase at the edge of the mixingzone.
10.6 AtmospheTic Emissions
Radian's review of preliminary emissions test data from units 1 and 2 guaranteed
performance tests led to the following preliminary conclusions:
1. Emissions of NO, exceeded WB Guidelines at low load conditions. This isnot a serious concern because combustion opimization will enablecompliance without additional hardware;
2. Particulate emission from each unit were below the new WB and Ex-Imguidelines;
3. Sulfur dioxide emissions levels from units I and 2 will continue to meet thepermined numerical limitation and the WB guidelines with current fuel sulfurlevels. However, because there is no annual ambient concentration data forA°2, strict compliance with the WB guidelines can not be determined at thistime;
4. Determination of the need for S02 emission controls for units 1 and 2, whilefiring low sulfur coal (< 1%) is not possible without annual ambientconcentration data. Buming solid fuels with greater than 1% sulfur on units Iand 2 will likely require the installation of S02 control equipment;
5. Compliance with the numerical emission rates of the WB guidelines(inrespective of the ambient considerations) under a four (4) unit operatingscenario can be achieved without SO2 control equipment if the maximumallowable sulfur in the fuel is limited to 1.0% (dry weight basis); and
6. Ambient concentrations of S02 are significantly impacted by the nearby OCPoperations and preliminary (limited) data suggest that the area is could beabove the new WB trigger levels and could also be classified as polluted underthe Ex-Im guidelines.

t

RAOW-INTERNATIONALM
EIA AddendumAttachment 9
Phase II Environmental Assessmentof Jorf Lasfar Power Plant, Morocco
Appendices

i~~~~~~~~~~~~~~~~~~~~~~~~~~~~~~~~~~~~~~~~~~~~~~~~~~~~~~~~~~~~~~~~~~~~~~~~~~~~~~~~~~~~~~~~~~~~~~~~~~~~~~~~~~~~~~~~~~~~~~~~~~~~~~~~~~~~~~~~~~~~~~~~~~~~~~~~~~~~~~~~~~~~~~~~~~~~~~~~~~~~~~~~~~~~~~~~~~~~~~~~~~~~~~~~~~~~~~~~~~~~~~~~~~
PHASE IIEnvironmental Assessment
of theJORF LASFAR POWER PLANT
Morocco
APPENDICIES
Prepared for:CMS Generation
Dearborn, Mchigan 48126
and
ABB Energy Ventures Inc.Princeton, New Jersey 08540
Prepared By:Radian Corporation
Louisville, Kentucky 40222

I I I I
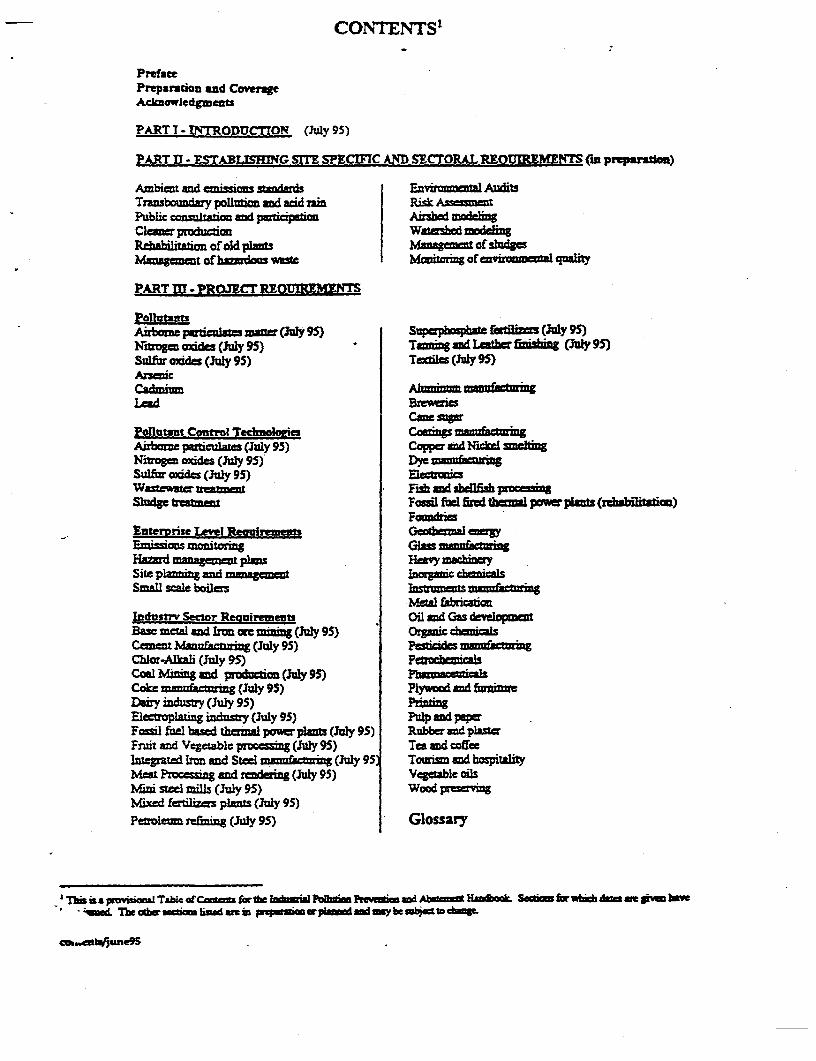
CONTENTS'
PrefacePreparsion and CoerageAckzowledgments
PART I * TRODUCTION (July 95)
PART II - ESTABUSBNG SITE SPECIFC AND SECTORAL REOUMEMET (in preparalom)
Amnbict and cnissi stndards E AuditsTnsbaimy polluion ad acid ram Risk As ectPublic cosultaton and puricipatio Arshed madlingClc production Wstarsba odlnReabilitatin of old plt Mnag=wae of sladgeManageto of hadots wc Monitming of cnviro tal quality
PART m - PROJECT REOTlS
PollutantsAfrboweprim ae ~a (J*l 95) Sumpp atffkiiru (Jul 95)NIuogu oxides (July 95) Taning and T f;ialh (Jy 95)Sur oxida (July 95) Tctl (y 9)ArscmicCadin A =Lead Breweies
MSWPollutant Contro Tecbolaies cAkboc pauricuLav (July 95) Coppa dMickelNio; oxdes (Jaly 95) Dye ma=acuringSuito oxides (Jul 95) EletoicsWas.zmz vemac Fish and AifishSludge urm Fosl fl fired t WpoWplant (dbftion)
Eaternrile Level Reram Csal yEmissions mmomrngmHazard mnaagmm pians HV aiSite planning and m%== horau2c chicalsSmall =clI* boilm lusmames mannfacuing
Me.a fbricatinIndustrv Sector Reonirements Oil and Gas developmtBase -c-l and kmoc toe ing (July 95) O-gic Ochadalscen_ mmua=ving (July 95) PeiCblr-Almali (July 95) P hCol Mini and proson (Jly 95)Coke tnanufeing (July 95) Plywood and 1Dairy indusoy (July 95) P2iningElecCplaAtzg i.d: (July 95) Pup nd ppsFossil fuel based tumal pow plans (July 95) Rubber and plstoFruit and Vegetable proces=g (July 95) Tea and coffeelutegated lro and Stel min=z&cmg (JuY 951 Toorun ad hospiWityMea Processing and rcdsing (July 95) Vegetable oilsMini stel fmills (July 95) WoodMixed fertilis plxs (July 95)Pemleu relning (July 95) Glossary
- ecw Th aeoee bin4 wxLad i pi wplmrtpIl mybe wc to d
em|une95

I I

APPENDIX A
1995 WORLD BANK GUIDELINES

II I
PREPARATION AND COVERAGE
PREPARATnON
This Handbook on Industrial Pollution Pevention and Abatement has been prepared by the Worid Bank'sEnvnment Deparment The task was managed by Anil Somani, Richard Ackcamim, Gordon Hughes, andDavid Hanruhan m the Envnmental Economics and Pollution Division (ENVE). General Guidance wasprovided by Isnail Serageldin (ESDVP) and Andrw Ster (ENVDR). Assistance was provided by the InternationalFinance Corpon (IFC) through Maryn Rddle.
The technical working group comprsed Anil Somani, Sanjeev Agprwal David Hanran (ENVPE) and ArtFizGerald (IFC). Addional mputs were provided by Wendy Ayres and Magda Lovei (E ). Edioriaoversight was provde by Kan Dazyk (ENVPE
COVERAGE
The Handbook is imended to be an ongomg resoce, cxpanding to coe th iformation requirements of the Bank andus borrwes h is trfore presented as a looselaf volume, wigb addional sections beng ssued as ttiey comletethe Bank's internal and extnal review proces Each secdion is dated so that the most r t version can be reailyidenfi0ed
The cvage of the document at any point is =marized in the shect which is mvied each tie that a newsecton (or sections) becomes available.
Copies of the complete Handbook cm be oblted from the Bank's Public Infmatio Centr, at a cost of US S30.00per copy or the equivalent in the local cency ofthe coumry in whih the documen arm being purdased. A separaevolume, containing a subset of "Selected Documents Related to Thermal Plants" is also available, at a cost ofUS$15.00or the equivalent in the local currency of the country in which the documents are being purchased. To order ttedocuments, please see the nextpage.
Electronic version
Trhe Baks public documents are being poesvelY made avilable on the btemet and the Handb6ok W I beco mepart of this SyeL
COMMNTS
Preparation of the Handbook is on-going. Comments on the guidelines which have been released are invited andconsultations will continue to be held with industy organizations, regulatory agencies and NGOs. Commentsshould be addressed to Richard Ackermann, Head of the Environcnt Departnent's Pollution Management Unit orAnil Somani at telephone no. (202)473-3456; fax no. (202)477-08.
-=egl(95

I I
INDUSTRIAL POLLUTIONPREVENTION AND ABATEMENT
PPART I
Introduction
PRELIMINARY VERSIONJune 1995

b b
Industrial Pollution Prevention and AbatenatJune 1995
GOOD MANAGEMENT
The Bank promotes good management and operating practices. including maintaining and operating productionprocesses and pollution control devices according to desien specifications; and it encourages the continualimprovement of processes, the installation of controls, and the monitoring of perfornance.
In support of this emphasis on pollution prevention, the new approach also stresses the human and organizationaldimensions of environmental management, which ar required to develop sound plant management and operationalpractices, and the need for a regulatory and resource pricing framework that provides incentives for continuousimprovements in environmental performance (in economic and sector work, the Bank asseses the role of prics,taxes, and other instunmnts to ensure that there are incentives to apply such measures).
THE HANDBOOK
In order to protect lman health and the envirmament. Bank financed indusrial projects must comply with poutionprevention and abatement measures acceptable to the Bank. This Handbook on industrial Pollution Preventon andAbatement has been prepared to assist Bank staff. its consultants and borrowes in ensuring that industrial projectsachieve adequate environmental performance. The Handbook describes measures that the Bank would consideracceptable for the purposes of deciding on Bank financing. It must be applied in conjunction with other Bankrequirements, in particular those on Environmental Assessmen
Principles.
The Handbook is based on good industrial practices. The cleaner production and waste miimizationrcommnendations cannot cover all possible proceses and products. but thy do indicate typical levels of
Irformance that should be achievable in a well designed and wedl managed planL The Bank supports continuing,.Provement in industrial efftciency and encourages enterprises tO achieve better performance than the Handbookrecommends.
Minimizing waste not only reduces the demand for resources. it also reduces the scale of final treatment requiredHowever, in most cases there will also be a need for pollution control measures to supplement cleaner productionefforts. The relevant treatment rquirements and the enissions leves given in the Handbook are based on goodpractice and reprsent minimum standards tha can be maintained in the long tenr with the skills and resourcesnornally available in industry in the countries in which the Bank operts.
The Handbook also stresses the need for good manament aRd for adequate opeating and monitoring resourcs toensure tat a plants proper environmental performance is mai=kai documented. and reviewed as a matter ofcourse. Good pollution management habits should be developed so that good performance becomes routine. Eachplant should also put in place measures to minimize accidental releases (such as spills) and emergency rsponscprocedurcs to manage such events.
Design and implementation of industrial projects to minimize the use of rsources must include energy conservationmeasures. Energy efficiency is frequently indistinguishable from environmental efficiency. whenever possible, bothissues should be addressed together.
2

Industrial Pollution Prvention and AbatementJune 199S
PROJECT ANALYSIS
Procedures.
Normas Bank procedures for analysis of industrial projects includes (a) an appropriate environmental assessment thatalkes into account reevant national legislation; and (b) an economic analysis that includes an assessment of the costs
and benefits of the alternative environmental measures available for new or existing plant. evaluating reductions inexposurc and improvements in ambient conditions as compared to the situation without such enviromnlmeasures. On the basis of these analyses. site-specific requirements related to the local conditions and rsurcesavailable are established (eg. emissions limits, special operating procedures) to ensure that human health isprotected and environmental benefits are maximized. Depending on the circumstances, these site specificrequirements will be as strict as or stricter than those set out in the Handbook.
The site-specific requirents detemine th level and type of pollution abatment measures required for a paticularprojecL Thse depend on (a) the impact of the poilutats from that plant on the overall ambient pollution level;(b) the environmental and health damage caused by pollutants relative to the costs of reducing emission levels: and(c) nost cost-effective options for reducing the ambient level of pollution, for example, through an approah thattakes into account sysgenwide technical and institutional solutions within a river basin, an airshed. or a power grid.
Projects inolving new planL
The environmental assessment for new industrial projects should determine not only the environmental itpact of theproject but should also identify altemnative options (including policy and institutional measure) for achieving theproject objectives at equal or lower cost Such options include sound natural resource pricing, the application ofaltrnative incentive mesurs to encourage natural resource savings. and comrehensive approaches to air- and
atershed managent.
When a project involves adding new plant in an area where there are plants alrady in opeaton, the environmentalassessment will examine a broad mnge of alternative ways of reducing the exposure of people and environment toharmful pollution by taking into account the contribution of other pollution sources. If the environmental assessmentindicates that there will be no significant deterioration in ambient conditions then the plant should comply with themeasures set out in the Handbook.
If the environmental assessment indicates that there may be a significant deterioraton in anbient conditions theoptions to be examined include: (i) the new project complies with the measums recommended in the Handbook (asbefore): (ii) the Bank may require additional masures applied to the plant based on the site-specific conditions; (iii)as part of the project, the Bank may require that further measurms be taken to address other sources within the projectare of influence, where this is a mnre cost effective approach tO reducing the overall impacts.
Projects involving existing planL
For any Bank financed industrial project involving significant modifications to an existing facility. the Bank mquiresthat the facility undergo an environmental audit (sometimcs called a -site assessment") as the basis for appropriateproject design. The report should (a) assess past and current rcleases to land. air. surface water. and groundwatzer(b) identify good housekeeping and maintenance practices. process modifications. and end-of-pipe measurs that canimprove the environmental performance of the facility; and (c) recommend site-specific targets and a timetable forachieving them
The economic prospects of an existing industrial plant should define the type of expenditure to be mnade to reducepollution. Plants with a longer expected economic life are required to focu to a greater cxtent on process-orovements to reduce their pollution emissions and should be held to standards that approach those of a new planL
4
INDUSTRIAL POLLUTIONPREVENTION AND ABATEMENT
PART III
Project Requirements
P1REUMINARY VERSIONJune 1995

I I
Wd=W PoUCaa Preveeo md AhmiAmBORNE PARCULATE AKM^
Jue 30. 1995
people under the age of 65. for daily average PMl,o concentrtons less than 70 percent of the U.S. air qualitY standard of150 tgfrnr. Several studies carried out in the U.S.. Germany. Canada and Switzerland (for a sunmnary. see Schwa,1991192) have found an association between respiratory symptoms and exposur to long-tem ambient particulateconcenrations of about 30-35 4frn3, without any evidence of a threshold level below which healh effects do not oceur.Kane (1994) demonstrated an association between mineral dusts such as silica or asbestos fibers accumulating in the
lungs. and a chw=rcrisic spectrum of disases Recently, the poteuial carcinogenic effet from cerain dustcompounds has also been analyzed. and in some cases (for example, for silica dust). limited evidence of carcinogniceffecsx has been found (see Ultm 1994).
Recent epidemiological evidence (for example. Schwart. 1991192: Schwarm and Dockery. 1992b; 'Ostro, 1994),suggt that ther may be no safe rshold for partilat matter below w health damage does not oCur and that ceffects are linearly relased to conce=tration.
Other EftectPlants exposed to the wet and dry deposition of patcular may be injurd whe particulas are combined wit oderpolluan Coae particl, such as dust. directly deoted an kaf ecan duce gas exchange andphotosytesis, leading to reduced plant growth. Heavy mels combined with particulats on leaves or on fhe soil maycontribute to the accumulation of toxic concertrations of meas within t plvat lisse rvltng in trducton of plantgrowth and yield. Additionally, particulates conmbutc to the soing and erosion of buildingSs. materil and pantresulting in incrsed ckaning and maintenance cost and loss of udlity.
Particulate emissions have their greaest impact on terruil ecosysm in the vicity of emision sources. Ecologicalaltmratons may be the result of particulate emissions tat include toxic elements. Futher, the accumulation ofpariculate emiions around uban areas and the aw.sport of fine padcles across regions fquently reduces visibility.The presence of fine particulates and reduced vsbilty may cae light scatcring. or atmospheric haz Reducedvisibility adversely affects tansportation safety. property values, and aesthetics
Ament Standards and GutdeinesTe most frequently used reference guidelines are those of the World Health Organizaion (WHO), the European Union(EU) and the standards of the U.S. Environment Prtection Agency (U.S EPA). The WHO and US. EPAguidelines/stndards have been set based on clinical. tozicological and epidemiological evidence. Guideline values ofambient particulate concentrations were established by detemining concentrations with the lowest-observed-advers-effect' (implicitly accepting the notion that a lower threshold cxists under which no adverse human health effes can bedetected), adjusted by an arbiuazy margin of safety factor to allow for uncertainties in extrapolaion from animls tohumans and from small groups of humans to lrger population Stndards determined by the U.S. EPA also reflect tetechnological feasibility of attainmenrL The EU gidelin have been deAmnined by conltaion and legislatvdecision-mauing processes that took into aount the environmental conditions and the economic and socialdevelopment of the various regions, and acknowledged a phased apprach to compliance A potetial tade-off was alsorecognized by the guidelines for the combined effacts of S02 and particulate maer (se Europen Community. 1992).
ConclusionsThe main objective of air quality guidelines and standards is the protection of human health. Since particulares in fineform (PMI0) are more likely to cause advere health effects than in coacse form, guidelines and stndards refenring tofine parLiculate concentrations are preferred to those referring to coare paricuate concentrations.
Scientific studies provide ample evidence of the relationship between exposum to short-term and long-term ambientparticulate concentrations and human mortality and morbidity effects However, the dose-response mechanisz is not yetfully understood. Futhermore, ther may be no safe thrshold levcl below which health damage does not occur.
IAdve effen is d z as 'any drte wamning in fimiwal i_aimnt midhor pszdaoWa lei s t may affln the pefornmaic ofhe wbokorpnism or wtich canuribud toa educd ability w mood wan altisra diaImz (m U5. EPA. 198O
The information in this sunmauy is (oa wc by World Sank saff md _mulunts in rygout de poGicia aS out in OP 4.01. mi-s and eate da E
PapF3
AM ORNE PARTCULATE MATrEJune30. 1995
AIRBORNE PARTCULATE MATTER
General DescnptionAirborne particulate maner is a coiplex mrixure of organic and inorganic subsmnees, small cnough to be suspcnded inthe atmosphere. Particulazes include dust. dir. soot, smoke and liquid droplets emined into the air. Particulas can becharacterized by their (i) physical aibutzes; and (ii) chemical composition. While physical atributes influence deansport and deposition behavior of particles in the human rspiratory sysm chemical composition may determine
their impact on health.
Physical amibutes include mass concentration and size distribution clActristics. Mas concenaaion is measumd inmicrograms per cubic meter uglmn, whfilc size attributes are mos fequently measured in aerodynauic diame.Particulate matter exceeding 275 microns (pm) in aerodynamic diam:er arm generally defined as coarse pardcles, whilsizes smaller than 2.5 pm am called fie particles. The acid component of paicat maner, ad most of its cactivity is generally contained in fine partl Samples taken in the United States (US.) showed that about 30 pacentof parl manr was in finc fracion (Stan. 1984).
Particles colld wih varous ps0U o sid compound in ot us. forming orpanic or inolanic chemica conmpoudsThe most common combinations of fine paices aw dhose with sulfats Sulae ions accoumt for about 40 prcnt of
fine partculazes and may also be prsent in concenons exceeding 10 mN5e (U.S. EPA. 1982). Th cabonacoscomponent of fine particles contains both eleancal cbon (grphite and soot) and non-volatile orgai catbon(hydrocabons enrined in combustion exhaust and secondary organics fmed by oThese: species maybe the most abundant fine particles ar sulfte dditionally, amnosphaic ractions of nitogen oxides yield nitric acidvapor (HNO) that may accumulate as nitrate partcles in both fine and coarse foms The most common combination ofcoarse particles consist of oxides of aico alumninm calciut. and kmn.
Terms and Sampling Techiqueseveral terms am used to describe particulazes. Generally. they am associa wih th sampling mnhod.
7ozte Supended Partculwes (7P) iclue various size and incude a proporin of particls that may not be able toenter the huana respiratory tract. Thcfome TSP is not a good indicator of health-related exposure. TSP is measurdby a high volume gravirenic sampler that collects suspended particles ranging up to 45Spn in diameter on a glass fiberfilter. TSP sampling and TSP-based standards were used in the U.S. untl 1987. Several coutMries in Cenral andEastern Europe. Latin America and Asia still monitor and set stndards in TSP.
Parriculxe Moner (PM,o) includes only particles smaller than 10 pm in aerodynamic diamteer. Thes arc the pariclesmost likely to cause adverse health effects by reaching the t owrcic or lower regions of rspiatory tract. PM1o issampled using two types of insmn: (i) a high volume sampler with a size seleect inlet using quarm filter, or CM) adichotomous sampler that opertes at a slower flow raze, separang on a teflon fiter particlis snaller han 2.5 pm mdsizes between 2.5 and 10 mn. Although no generally accpted conversion mthod exists PM10 is estimated between SOand 60 percent of TSP (U.S. EPA. t982). Since only paicles less thn 10 pm can penetrate th lung and damagehealth, the U.S. Environmental Protecion Agency (EPA) changed its standards from TSP to PM10 in 1987. PMossandards have also been adopted in Japan. th Philippines and Bnzil.
BLack Smoke (BS) is a particulate measure ta typically includes respiable pariculaes smaller an 4.5 pmaerodynamic diameter. sampied by the British smokeshade menod. The reflectance of light is measured from the staincaused by pariculates on a filter. The result of BS sampling depends on the dtensity of th stain and the optcalpropries of the particulates. It use is reconmended in areas where coal smoske feo domestic fires is the domintcomponemt of ambient particulae since this method is based on reflectance from carbon in elemental form (WHO sadUNEP, 1992). Afte reviewing available dat. Osmo (1994) concluded that BS is roughly equivalent to PM.oi However.precise equivalence of the black smoke measurements with other methods does not exisL The BS mcasu is mostwidely used in Britain and Europe.
Ihe ionauon in this swumay is for uwe by Wodd Uk staff ad ne80=1am in aiwtg ot ce polci; i ut iu OP 4.01. EA<1i Lnt and Webrd ds ums.
PaFge
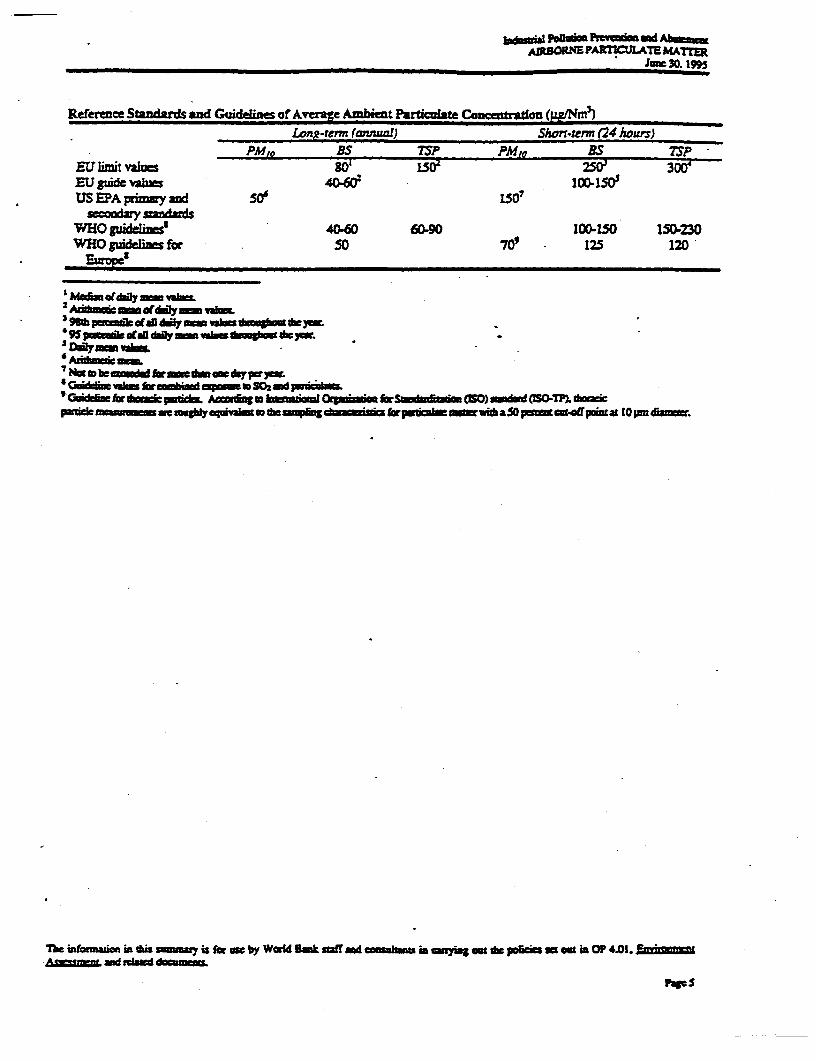
iaiuuw p.auIj Pmt sm md AbooAM3ORNEPAXTKUATEMA?rER
Jmue30. 1995
Reference Standards and Guidelies otAverae Ambient partculate Concauradon (gglNm -)Lone-tenr (annual) Short-nenn (24 hours)
-PM,0 ES tSP PM0l BS 75pEUlimit valus S0o 110 250 3OO'EU guide vals 40-2 I,D. 1I(US EPA prinny and so Ws'
seodr s=adsWHOpguideline? 40.60 60.90 100-ISO 150.230WHOguidelfr 50 70' - 125 120
1Median odiDy vae
I9SU - o( -a 1ty wa _ * . *
*zsc
7 NW wb==W formdmw dapwy* C vaim fw=ob_ 32S=dpwdw*GdcIw1br*=*;X A=tpwCiL b -- d"W==OSW& (=)2su)
tdck~..~acmusghIam so *ai r rFwpdm wvuint ar5nfccfpai t0atIzpm r.
The isfosmaian in dhis nuym is for ow by W=Wl Dank salffad imanm in ny so do pooimi S outin OP 04.01. Emd=An=L d tdud d_omc
np s
'dm ftoDwn Pmvt = A_om
Iu fAM m~ABORIE PAR2fL~3AA7E gMA7EpA~~Jma UE
1990. Rewew of the Natioa Ambien Air Quaity Stadard for Partculwe Matter Asrnmwn ofScienzifc and Technical bfotmazion Noah Caroliaaw Resch Triangle Par*:
World IHeakh Oraiation (WHO). 1979. 'Sulfr Oxides ard Suspended PazdcuLa Mater.' Enviro,mema HealthCGtei & Genea SwiUland.
_ 1987. AirQaaty G;dcuWbforAuocp Rgonal Of3icc forEhp Cop ag Swede.
Wold aldi d0o and Uo NdNos Evr Prop_me 1992. Lr*in rPacU s n MeAcgac&Lsof tie WMri Oxfod, tT.T BltweJ Refivace.
Tlhe ifo,mim am a is _ f r- by WWi DBk mfY1smin .y am m an X mOP 4DI. &mm=_SESLMM aad mtmd _ ,acwmmV
}Wc7

-olb PvftU dAbtoNi LROOENM "IME
ppliances for coolang may have a vey small eect on the human respiraory systm, especially for small children,at that the eet (if it exists) disappeass as the chir grow older (WH4O, 1987).
Available data fr=m animal toxicological experiments rarely indict effect of acute exposure to nitrogen dioxidecncnnaraions of less than 1,880 pgtm3 (WHO, 1987). Ashmatics are likely to be the most sesite group toexpxre to nitrogmxides Twolaboratis havereported rsible dicss on pulmoy fmion of ashm sexercising intittently afte 30 minu of exposure to nitrogen dioxide concentrations as low as S60 Ugtm(WHO, 1987). Howe. the hcalth impact of the dcange in pulmonary function is unclcar, the changc of aboct 10percn is within th rngeof physiological variaion and is not nesareily adver. At klvls above 3,760 pg .normal subjects bave demonstaed substantial changes in pulmonary finction (WHO, 198n.
Stiei with nimals have found that several weeks to months of exposure to nitrogen dioxide concentrations less
thn 1,880 ixgfm' caus both reversible and irrcvesle lumg drs and bichid l chages Animals exposedto trogen dioxid levels as low as .940 microgams per cubic meter for 6 months may experice destruction ofciia, ahllar tiae disruption, obstrion of the rpiratory bronchioles, and ineased susceptibility to bactlinfection of the lungs (WHO, 1987). Rats and rbbits exposed to higber ls 1aeience more severedamage, resembling emphysema.
Th availabled daa suggs tbat physiological des of nitrogen dioxi on huns andtanimaI aie de mor topeak loU-nUrtiU than to duraon or to totaldose.
Materials Nitrogen dioxide in reaction to textilc dyes, can caue fading or yellowing of fbrics. Exposure tonitrogen dioide can also weaken fabncs or reduce their afinity for certain dyes Industry has devoted
deable rsources to develop teiles and dyes resistant to nitrgen oxide exposure (Canada's Fedel-Provincial Advisory Commitce oan Air Quality, 987).
system and Other Effs Nitrogen oxides art p2s5 s both to a precipitation and to ozone, each ofwaich is bl for injury to plans While nitric acid is reponsible for only about 30-35 percent of hydogen (Er)ion conetration in wet and dry acid depositions, the contribution of nitroge oxie culissions to acid depositimis geater than e numbers indicate. It is nitrogen oxide that absozs sunlight initiating the photochemicalpr-c% that produce nitric acid.
The extent and severty of the damage due to acid depositions has not been estimated since impacts vary accordingto the soil type, plant species, atmospheric conditions, insect populations and other factors that are not wellUnderstood. Nitrates in precipitation may actua ly increase forest grwh in areas with nitrogen deficient soilsHow r, the fertilizing effect of nitrates (and sulfktes) n.y be I itetbalaneed by, the leaching of passium,maggresium, ccim and other niurients from forest soils. There is lt envidence that agricultual crops are beingintjured by exposur to nitrates in prepitation The amount of nitates in rain water is almost always wel belowthe levels applied as fertilizer (NAPAP, 1990).
The most evident damage due to acid depositions is to fresh water lakcc and strean ecosystems. Acid depositionscon lower the pH of the water with potentially serious consequences for fish, animal, and plant lfc. Lakes in areaswith soils containing little calcium or magnesium carbonats which could help neutalize acidified rain areespecally at risk. Few fish spees can suvive the sdden shifts in pH (and e£ects of soluble substances) rsultingfrom atmospheric depositions and runoff of contaminated waters much that affected lakes may become completelydevoid of fsh life. Acidification also decrases the species variety and abundance of otha animal and plant lifeoAcid pulses have been associated with the fish Idlls observed in sensitive watersheds during the spring meltdownof snowpack. Further, the atmospheric deposition of nitrogen oxides is a substantil source of utrients thatdamage estuaries by causing algae blooms and anoxic conditions (U. S. Envronmenal Protection Agency, 1992).
Mw h(0,mija in t1 s u' s f mm by Wjd BDk muff an dWiNinU sm at Ut paieisa G in OP 4.01. jIm#A d reloaed dacma
t%v2
J3tJ, 199S
expos= if tis is excsdo on monr than sevn days in the year, or 400 g4fm' for ay one-hour period during they.r
Rderiece Standards and Guidelines for Ambient Levels orNitrogn Dioxide (zgftn)AnnuawlA re 24-fourAverae 1-HorAveraWe
EU Limit Values (1985) 200 - -U.S. StuLdards(1992) 1002 - -WHO Guidelines (1977) - * 190-320WHO Guidenes for Emope ISO 400(1987)
Further Iaformatlo.Mme following are suggsted as u of additional infinnmioz (tm uw =s pwvvided fwr piaend amnot inteaded to be cprh; ve):
Caades Federal-Provincial Advsow Committee on Air Qliy. 1987. Reiew ofNVationdAmbient Air QualtykjvectiwforMrrogen Dioxide. Ottawa, Ontario: Envirnmat Cad
urpnComii D=ve 80203. arh 7, 1985.
jdsb Tbad 1991. Air QAality. Chels, Mchipn Lewis PubIis
National Acid Precipitation Asm t Program U. S. Govetnm Printing Ofrwe, WashinVgon, D. C Variouvolumes and years, 1987-1991.
Ostro, B. 1994. w!stiating the Health Effects of Air Poll=t A Method with an Applicati to waksai aPolicy Reseamii Working Paper 1301. Policy R_es Dqperte, Public Economics DivisionL Wa5hinD.C: World Bank.
Schwarn I and S. Zegler. 1990. Passive Smonig Air Polluation and Acute Respiratozy Symptoms in a DiatyStudy of Student Nurs Americwn ReWiew ofR .oraD iseose 141: 624;7.
U. S. En m al Protection Agecy (EA). 1990. NatioaAir Q-ulity and Zmion Trnds Repo. 1990.EPA-450/4-91-023 November. North Carolina: Raurb Trangle Park
U.S. Govrmen Printing Ofc= (GPO). 1992. 40 Code of FedeF RPguations, Pat 60.
World Halth og 1977. Oxides of N2iogen." Em4nmwrtal Health Gitena 4. Genva, Switzerland.
-. 1987. Air Qudity Guidelinecsfor Ewvpe. WHO Regional Publiaions, European Sies 23. RegnlOffice for Eurpe Copenhagan
World Resources Institue. 1994. World Resorces. 1994-95: A Gwide to the Global EinronmenL New Yor:Oxdord University Prts
The hf mYiin a t_h uy 1m -by Wld Sik af d kea 1 F _u * h 0 4.01 ,
Pap 4
SULWJR OXIP
Jume 30. I9
Trees and other plants exposed to wet and dry acid depositions some distance from the sowcc of emissions may also beinjured. Impacts on formst cosystems vary greatly according to the soil type, plant species. atmospheric conditions,insect populations and other factors that are not well undetood.
Agricultural crops may also be injured by exposurm to depositions. Alfalfa and rye grass are especially sensitive. Itappears that leaf damage must be extensive bform it affects the yields of most crops. It is possible that over the long-term. sulfur input to soils will affect yields (OECD. 1981 and NAPAP. Report 18, Effes of Polluion on Vegeation.1990). However, sulfur may not be the primay cause of plant injury and other pollutants such as ozone may have ageater i
Acid depositions can damage fieshwater lake and stream ecosystems by lowering the pH of the wate. Tak with lwbuffring capacity, which could help ntmalize acid rain. are especially at risl. Few fish species can survive large shiftsin pH1 and affected lakes could becomc completey devoid of fish life. Acidificadon also decreases the species varietyand abundance of other animal and plant life.
Sulfiae Iosos, convertd from sulfir dioxide in ct atmospher can rduce visibility by scattering ligh. Incombmiai with wam ueinperavs. abundant sunlight. high hmid. and reduced verical mnxing. such asols cancomributeto aies exedi ng ove large eas
Maigjala Sulfw enisons may affec building stone d fus and non-faro metals. Sfuric acid. produced fromthe oxidation of sulfur dioxide acceerates the corosion of iron and sted and zinc. Sulfur oxides react with copper tproduce dth gen patina of copper sulftie on its surce Acids in the form of gases aerosols, or prcipitation. maychemically erode building materials such as marbie. Iimest and dolomite. Of particular concrn is die chemicalerosion of historical monuments and works of ar. Sulfir dioxide may also danage paperand leather due to the catalticconversion of sulfur dioxide to sulfuric acid by metallic impurities.
Ambient Standards and Guidelinef'le main goal of almost all the major national and international stands and guideines produced over the last two
dedes has been to protect uman health. Erly rteaI appeaed to indicate a thrshold or 'no effects level belowwhich health impacts were negligible for even the most vulnerable groups such as asdthatics or smokces. Sandardswere then set below this level to provide a margin of safety. The European Commnmity (EC) standards recognize thepossibility that exposure to both sulfur dioxide and particulate matrr may have an additive or synergistic effect onhealth. This is also recognized by the World Health Organizaoon (WEO). The EC limit value for ambient sulfur dioxidetherefore varies depending on the concentration of particulate marer in the ambient air. The following table s izkey reference standards and guidelines for ambient sulfur dioxide concentrations.
Th inomrrnn in tbas sumnmny is for by Wedd Bc_ aft ad enstias in gmyis oe dout fssWear an cinOP 4.01. £i-tl=ZtL add relt darnew&
Page2
SULWUR o0Imme 30. I9M
In the long-tem countries should seek to ensr that ambient exposure to sulfur dioxide does not exceed the WHOrcmaended guidelincs. Ln the interim, countnes should set ambient stadards for sulfr dioxide which take account of(a) th benefits to humgan health and sensitic ecosysms of reducing exposure to sulfur dioxide, (b) the corcenanlevels achievable by poluiion prevention and control _easu, and (c) :he costs involved in meetng the sndads. Inadopting new ambient ai quality smntards or guidelis, countries should set appropriate phase-in peiods Wherethere we lage diffemnces in ether the costs or benefits of meeting air quality staadards/guidemes. it may beappropia to esablish ara-specific aibent stndards on a case-by-case bsis
For the purpose of caTymg out envuomnria asessme of projecm coue should establish a tigger value forambient exposu to sufizr dioxide. This trigger value is not an ambient air quality stanlard, but is simply a thresholdwhich. if exceeded in the area affected by thc projec wil mean tht a mr detd aile *ene a,vir W at tsholdbe caried ou. The TmggS value may be equal to or lowe than the countys anbin stmadard Counnie may wish toadopt EU, US, or WHO guidelin or sumdamds as dw vigger value. The tgger value should be agred by th counyand the Word Bankl before an environmental aesment is undenake In the abseci of an agmed value, the WrdBank wi use riggr val of 80 ugWm medin of day vals e thlrouhot tu e ry and 2SO p#m 3 for 24bouwexposm for cmo 2han seven days in tde yewr.
Furter InformationThe followg are suggested as sources of additional infoation (tese sources a provided for guidance and are notintended to be comprehensive):
Commission of the European Communities. 1992. Eurpa Cozmunity Envimnu egislation
Dockey. Douglas W. tal. 1993. 'An Associaion Bween AirPoluoand Morality in SixU. S. Cties. TheNew nglad Jomal fMedicew329 (24) 1753-9.
Godish. Thad. 1991. Air Quality. Chiesea Mfichiga Lewis Publishem
Federal-Provinal Advisory Co ite onAirQuaity. 19f7. Review f NionalAmbi Air QuatObjecsvesjfrSi4phur Diaoide. Deuirabk and Accepable Lvels. Govenment of Canada.
National Acid Precipitation Aessmet Program U. S. Govament Printing Office, Washington.D. C Various volumes and yes, 1987-1991.
Organisaion for Econominc Co-operation and Develpmnt (OEM). 1981. The Co= and Baetr of S4phur OidContm. Paris.
Ostro. B. 1994. Esimnatng the Health Effccts of Air Pollas: A Mcthod with an Application to JakartL' PolicyResearch Woradng Paper 1301. World Bank. Polky Research Depamu, Public Economics Division,Washington. D.C.
U. S. Enironmentsal Protection Agency. 1932. Air Quality Cnzerieafor Particulate Mauer and S4uur O;rdez EPA-600o8-82-029 December. Research Triangle Park. N. C
. 1986. Second Addendum to Air Qualiy Crena for Paicuate Matuer and Su#fr Oxides (1982). EPA-608-861020F December. Researh Triangle Par. N. C
. 1990. Review of the Nazi nal Ambiem Air Qualry Sandardfor Panrcua Maffer Assement of Scien4ficand Teehnicca Information. Research Triangle Park. N. C.
Th infonazm in this summny is for weby World sakffind am ram _yisague peipLsa out al OP4.01. _a-
Asm =d muiwad d _omm
Page 4
INDUSTRIAL POLLUTIONPREVENTION AND ABATEMENT
Pollutant Control Technologies
PRELNARY VESIONJuze 199.5

I
aWW p-au Pnwaim mbd AboooPArLTICULATE MA7 PoWU=ON ntVEITIO AND CONTROL
A 30, 1995
removal efEienCies of 99.9 pert or more. heaforc cYclones art often used at a pCliminrlY stage to other PMremoval mechansms. They typically cost about USSl/cuLt per min flow re (Coocr and Alley, 1986),
Electrostantic precipitators (ESP) remove partcles ung an dlecarstaaic field to amact the particles oanto theelectrodes. Efficincies of collecUton for well-desigped, well-operated, and well-maina systems are typicallyon the order of 99.9 per=nt or more of the inlet dust loading They are especiay dr:lent in collecting fieparculates and can also capture trace eissions of some toxic heavy metals such as arseic and cbromnum wiah aefficiency of 99 percent (Moore, 1994)'. ESPs are less sensitive to maximum temperatures than fabric files, andopeate with ve low pressure drop. Thr consumption of electricity is siai to those of the fabric filters (seeAnnex 1). ESP peformanc is affected by fDy-ash loAing, the resivity of fly-ash, and the sulfur contet of thefued. Lower sulfur ccentrations in the flue gas can lead to a decrease m the collecto efficiency (Babcocnrk &Wilcox, 1992). ESPs hav been used for the recovery of procss mateials (such as cement), as we1 as farpolltmon controL They typidly add I to 2 pect to the cpital cosL
Ft-iers and dt collectors ghowues=) colect dust by pasng fnue gases trug a fabric which acE as a fi .e mog comnoy wused is the bag filt or bgbous Thevarous kinds of fdi media include woven fbr,
needled felt pilasc, cmc and meal (Croom 1993). Tkebgh operaatig temperaturs the chaiceof fanc Aculated particles anremoved by mechancal shakng reversl of the las flow, or a snm of high-pressu air. Fabric filters arc effie (99.9 paremt removal) for both high and low conceations of partcls,but are sutable only for dry and he-fowig partil Ther dciency to remove to=c mtals such as arseic,cadmim chromiu lead and nicelc is gratr than 99 pacent (Moore, 1994). They also have the pote l benna the capture of SO2 in instalations downsucam of sorben injection and dry-scrubbing systm (Babcock &Wilcox, 1992). They typically add 1 to 2 percent to the capital ct.
Wet scmbber rcly on a liquid spray to removt dust partides fm a pas stmr Thy are primily used to coetacid gas ons, wit particulate contrl as a secondary fction. The major rypes avenmsi scrubbers, jet
-m) scrubbers and spray towrs or chambers. Venmri scrubbers consume Lar quaties of subbing iqid,.uc as wat) and eleric pwer and cur high prcs drpswps .t or f scm ubbes rely on th kinec eneof tt Lquid scma. Typical rmovl eciency of a jet or fume srubber (for parices 10 mm or less) is lorthan that of a vcni scrubber. Spray towers can handle lrg gs fow with mial press drop, therefor,they are often used as prt-coolers. Wet scrubbers may cotrbute to comson, therefoM the removl of wate fromthe efluent gas of the scrubbers may be neceszy. Also, the scrubbing results in a liquid cMlunL Wet scrubingtechnology is used whecr: (a) the contaminant cannot be reoved easily in a dry form; (b) soluble gases arepresent; (c) wettable particles are present; and (d) the contaminant wil indergo some subsequent wet process (suchas recovety, wet separation or setling, or alimtion). Gas flow ates range from 20 to 3,000 mz/nin withtypical applications for gas flow rates of a i,000 me/min and a crresponding pressure drp of 25 cmwater column (Bounicore and Davis, 1992).
Eqwupment SelectionThe selection of PM cmissions contml eipmnt is influenced by (a) environmental; (b) economic, and (c)engneering factors:
iHorvm. eaVUig _m of mw_ heavy mmLio w preds ua u== a fuulsacd as v. d and acy-u adfi wad b uhnod robkm
-- infoama zm th is umris for awc by Wald Bak RA d eaxn m inc g mr l thc e palia ad a in OP 4.01. E-_. d ml-ad etazad L
PARTZXXAJ A7,XT=POLLUMON4IPREVD4 TION AND COTRtOLjw 30.19M
Fur M_ther .uouuatkxThe folowing at sug_ssd as s of addiional information (the sowces ar prvided for gia and arenot intended to be corzprbL i):
Babcoci & Wilcox Co. 1992. Samn -its Gweration and Use. S.C Su and JB. Kio. eds. Barbero, Ohio:The Babcock & Wlx Cpy.
Bouic,m AJ. and W.T. Davis 1992. Air Pollgton EnLgineervMgm. New Yodc Van NOSrand Rcinhold.
Cooe. DD. and .C Alley. 1986. Air Potluton ConrL A Dc.gn App*c. PP,et, Hihtsc,&s oWavuald Puss, IDC.
ComMieks L Jl, 19. 'EffeldveSeeion oefiber Dst. Omuc ilEei n&
Bsl, Jim John Peulon. July, 1993. qmt Sdc onr Solid Gas S o.' a-
HgmaaU4m, DL E19. 9 Polbdw of owAmwspher BdSaL AAm Hll L
Je_uek, Kul C. et aL 1992. Srw Coalfor Pow mid Mz&0y. Iuay and EV Dqwpmz WorkingPaper, EnerV Sedis Paper No. 58. Washno, D.C.: The Wodd Bank.
Mooz Taylor. J=JPb. 1994. Hadoas Ak Polhda= Mauig in M=LgramL- EPRJOW,Z VOL 19.NO. 1.
Vatav*k MW M. M. 1990. Effmazia Costs ofAirPolbon Coul Cheua Mlcimr Lewis Publisherm.
doriddank. 199L Cbinaeficencyand MeMl "Imp ofColUse.-ReportNo.89L5-aIndnsyard En=V Division, Chin Depqtca, Asia Was_gon, D.C
m &mm ia dim _ ty s f m by WIl ald _ k D i n i1 td p_s Y t n OP 4.01. EME_R
?ap4
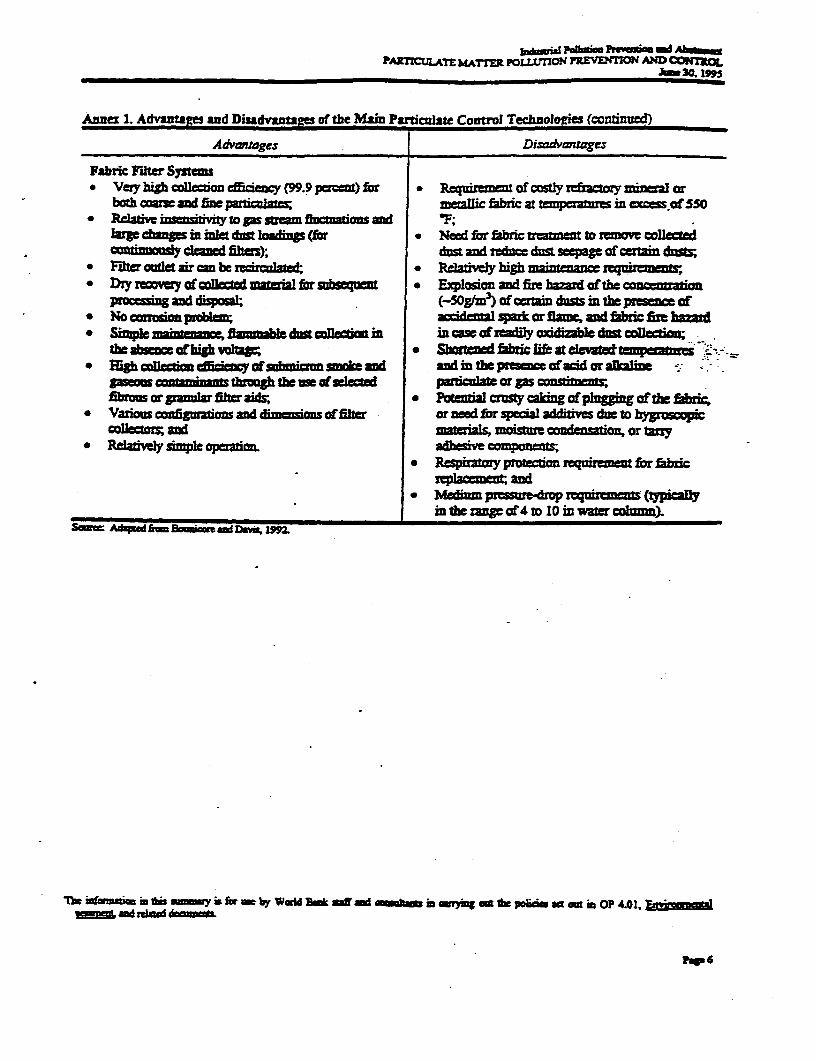
_iaw Pond Pie d A_omrIAxrnAT MATT. POLUMrNo PRVn ¢M AND CaNrmL
I- 30. 19
Anex 1. Advantage and Disadvantages of the Main Parniculte Control Technologies (continued)
Advantages Di.divanZages
Fabric Fle Systm* veY high Collecion effIcInq7 (99.9 pe ) s * of costly r or
both coarse and fi pa atll c at tes m QCCeSSof 5O* Pelative insendtivity to ps ream. cta andn F;
larechae it u diti loadias (for * Need for iibric tretmnt to rew1ove cledcontinuoycleaned fils); dSt a2nd seduce dus seepagS of certain dxt=
* Fibe oult a can ebe rercrlned; * Rlatiel high maintenance reqirct,* Dioy rovu of cllect mairal for ubs=m * Explosion and fim hmd of the conato
processing and disposal; (-50gfm) of certain du in the pre=ce of* No cmuion probL= acmdea spark or fLh, a fbric fre I* Simple maiutmeec fla le di colecto in in cast of radily oxizble ds wllectiem
the absenc of bigh volage; o Shortend bbtic lZf at cleWtatteniaU * fro eWbom cfilci=7 of sdbmcrm =wim and ad in the preece of acid or alale
cmmndnants thron& thc wsse ofwld _parcate or gPs cnsdmentfibrous or oan fil aidr; * Potential cmusty cang of p}n g of the lbri
* Variou cofigmatioms and dmensions offil or need for special addite due to hygroscoicand matcrias, moiste eondnsatiou or trzy
* Relativel SiI- operation. adhlesive Ionoet* ResPiAy protection requirement for buic
m andj M* umpmuedprtuiren= (typically
_ ____ in the of 4 to 10 in wat colmmn).Saw= AdnpWMkBcamMww 1Lv 192
Tatse imnmian in *is 9mnmwy is for =e by w=u smk 1ff _d manumim m yt ant *k pow an am in OP 4.01, I MMM?.6e ^ . _M ocnut
1OVG
J,&A1 - ?w d AENITR)MI 0OXDES POwmotMJ PREVENTON AND COWZTXOL
Jmc30. 199
NITROGEN OXESPOLLUION PREVEMNION AND CONTROL
The first priority in designig a strategy to control nitrogen oxides is to prote haoist bealth. H=nmn health im ts 7appea to be rclated to peak cposure to nitogen oxide (NO). In addition to potentaly damaghuan h oealth nitrog oxides am pmsors to ozomne (Os) formati which can harm human health andvegetation. Fialy, nitzogen o contribmt to acid depoion which damages vegean andecosystems Mo dttaflsc the impacts of nitrogen oxd on hn"i helth and the environme given in thedoMcn1 On aitro oxides.
Approaches to Limit Ground-Lvel Ambient Concentrations'The cxent to which NO emissions harm huzan health depends on ground-level concentrations and the an_ber ofpeople Sourcc location can affect the parmeters Gase e ed in aras wft etrologicalclizatlogimcl and topogrphcal fnrs that fvor di esiowl be less likely to couceuzme w the swun.Soaues away fro population ci s will ex c fewer people to harmful polltion Pant sizn is a iJesU in any ar polludion Fms V t tWeV. Houv, disperon of nig oi=des may contribute to mfoation and acid ouitson fr fm the so , and is not therefe a rommended stUatey. TMe Jong-objectivnuist be to meduce to_D missis
Approaches to Lmit EissionsEffecie control of NO. emissons wi e control from both stationary sources and mobile trsources. Fch of theS requir differet stateisL This docuzent wll focus on control stategies for Mtaioysource inarifossl-sfl fied electicty generAing staton).
Limiting Emit ons from Staionary SourcesNitrogen oxide ar produced in the combustion pyc by two diffeaent mechanism (a) frm buring the
ItJen in the fueL, prizarily ol or hban oi, (fuel NO.) and (b) from hugh temperatue odation of th.olcWu ztragen in the air used for combustion (thenra O). Fuel NO. fomalion depends on local
conditions, such as oxygen conwnation and mixing pats, and on the nitrogen content of the faeL Th lmaNOx formation depends on combustion eupseratr, bomming significat at temperatures aboe 153 C (230F). and rising exonentially with increasing tempercure (abcock and Wlcox, 1992). The relative contribution offuel NO. vss thermal NO. to emissions fom a partilar plant depends on ct combustion conditons, the typeof boiler, and the type of fue being buned.
Approaches to contml NO, from stationary sour can addrs fuei NO, or themal NO,. or both. One m=ams ofcontrolling NO, emissions is to use low-nitroge fuels. Another is to modif combustion conditions to ge tefew emissions of NO,. Finally flue gas uranent techniqu, sih as lectve catltc reduction (SCR)processs remove nitrogen from ps after cmabusion but befom etaiion to the atmisphem
Choice of FuelCoals and rsdual fud oils containing organialy bound nitrogen conbute over SO pernt of totl emisions ofNO, acrding to some cstimates. The itrogen content of Unitd States coal ranges beawecn 0.5 percent to 2pant, and that of residual ful oil bewn 0.1 perc and 0.5 peircL In may -= =s the mo cogst-eecive 'me of reducing NO. emssions wil be to use low ntgen fiels, scxh as natral Ps. Natural gas emits75 percent less NO. than coal when bumed and no particulate maer or sulfur oxides
Combustion ControlCombustion contml may involve any of thre: Sategies (a) reducing peak terperatur in the combutstion (b) reducing the gas residence time in the high-tempeature zone; and (c) rducing oxygen concentrations in thecombustion zone. Thse changcs to the combustion pro- can be achievtd by ither (a) modifying operangcondiLions on existing fuuaces, or (b) by using speially-designed low- NO. bunes or fiusaa. Combustion
mm j l gi i _ ,y is w s by WaId BEak gaff e i pSm a is OP 40t. Eaki_an seuW doaMMLz
PopI
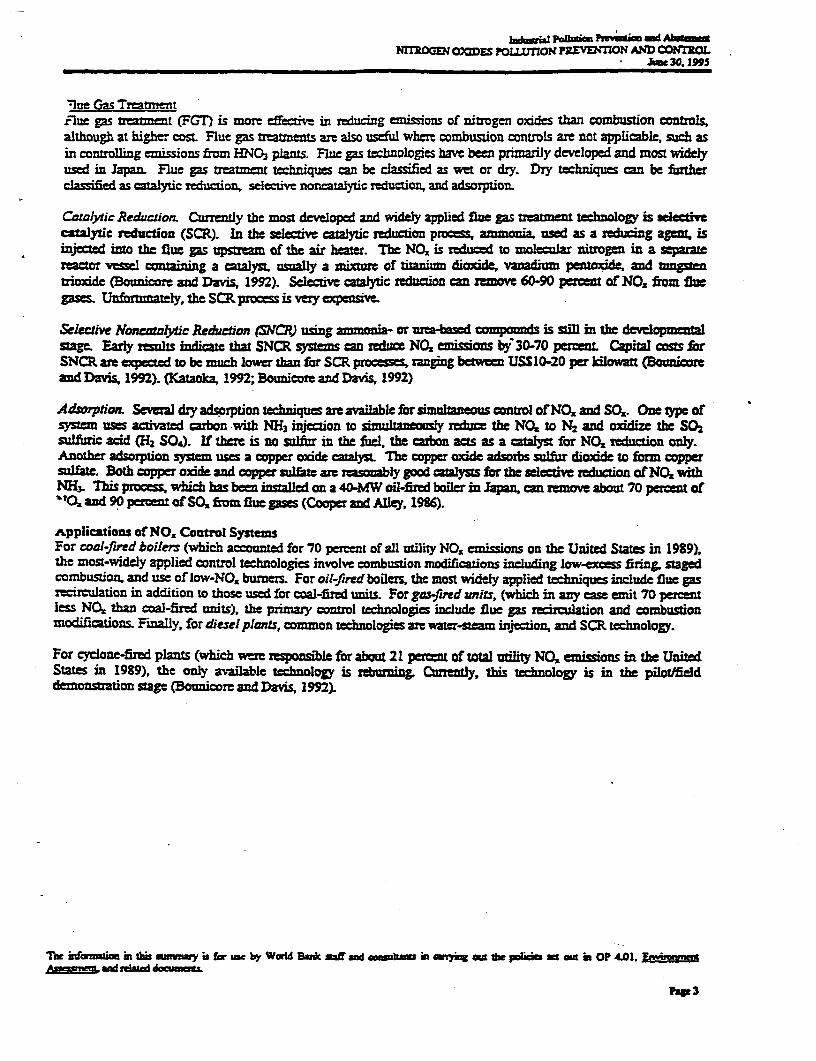
ha., PoImm Pmzwv md AbomNTrrOGDi wDEs PoumoNj PRvEvNON AND CONTROL
* _30. 99S
-Ine Gas Treawmentr-hue gas tetment (FGT) is more cedve m in rading emssions of nitrogen oxdes than combusion controls,although at higher cost Flue gas treaments are also uscfUil where combustion controls are not applicable, such asin controlling emissions from HNO, plants. Flue gas technologies hav been primarily developed and most widelyused in Japan. Flue gas reatment techniques can be classified as wet or dry. Dry techniques can be thercassified as catalytic reduclion, seleivt noncatatic reduction, and adsorption.
Catlytic Redurction. Currently the most deveoped and widely applied flue gas treatment technology is selecteeatalytic reduction (SCR). In the slectie ca2lytic reduction procs, ammonia used as a reduring age, isinjected into the flue gas upstream of the air hsser. The NO. is reduced to moleclar nitrogen in a separatereactor vessel containing a catalyst, usally a mixture of thanium dioxide, vanadium pentoxice, and tungstentioxide (Bounicore and Davis, 1992). Selective caalytic reduction can rmove 60-90 permw of NO, ftom fluegases Unforttly, t SCPprocss is veryexpesive
S&lectiv Nonca=lytic Reducion (CR) using ammon or ea-basd com ds is sti in the d estage. Eay reIus indicae that SNCR systscduNOemisiocn by 30-70 pecn Capital coforSNCR are expected to be much lower than for SCR processm rangg betwee USSIO-20 per 1lovtt (Bounicoreand Davis, 1992). (Katacka, 1992; Bounicore and Davis, 1992)
Admorfion. Several dry adtion techniques are avaable for smultno control of NO, and SQ,. One tpe ofsystem uses activated carbon with NH3 injection to simultaneously reduce the NO. to N2 and oxidize th SO2sulfuric acid (H2 SO4). If there is no mfur i the fuel. the carbon acts as a caayst for NO, reduction only.Another adsorption system uses a copper moxde catalys The coppr oaide adsorbs sulfr dioxie to fonm copprsulfate Both copp oxide and copper slf arrasomnby good lysts forthe selive reduction of NO wthNH3. Tbis pro, whichhas be inlled on a 4-MW ol-fredboiler in Japancn remo about 70 pcrt ofTO and 90 Percent of SO. from flue ps (Cooper and Alley, 198).
Applications of NO. Control SystemFor coal-fired boilers (which accounted for 70 pecent of all utility NO, emissions on the United States in 1989),the most-widely applied control technologies involve combustion modifications including low-excess fring, stagedcombustion, and use of low-NO, burnrs For oil-fired boilers, the most widely applied techniques include flue gasrcirculation in addition to those used for coal-fisrd units. For gas-fred units, (which in any case emit 70 percentless NOz than coal-fired units), the primary control technologies include flue gas recirculation and combustionmodifications. Finally, for diesel plants, common technologies are r-steam injecion, and SCR technology.
For cyclon-fired plants (which were responsible for about 21 perent of total utili NO. missios in the UnitedStates in 1989), the only arailable technology is mbarning. Corrently, this technology is in the pilotffelddemonstration stage (Bounicore and Davis, 1992).
at ifaciam i tis mmmy is for tue by WeMd B* af and amk in g IsA the patisim s amt 0 OP 4.01. E
Pap 3
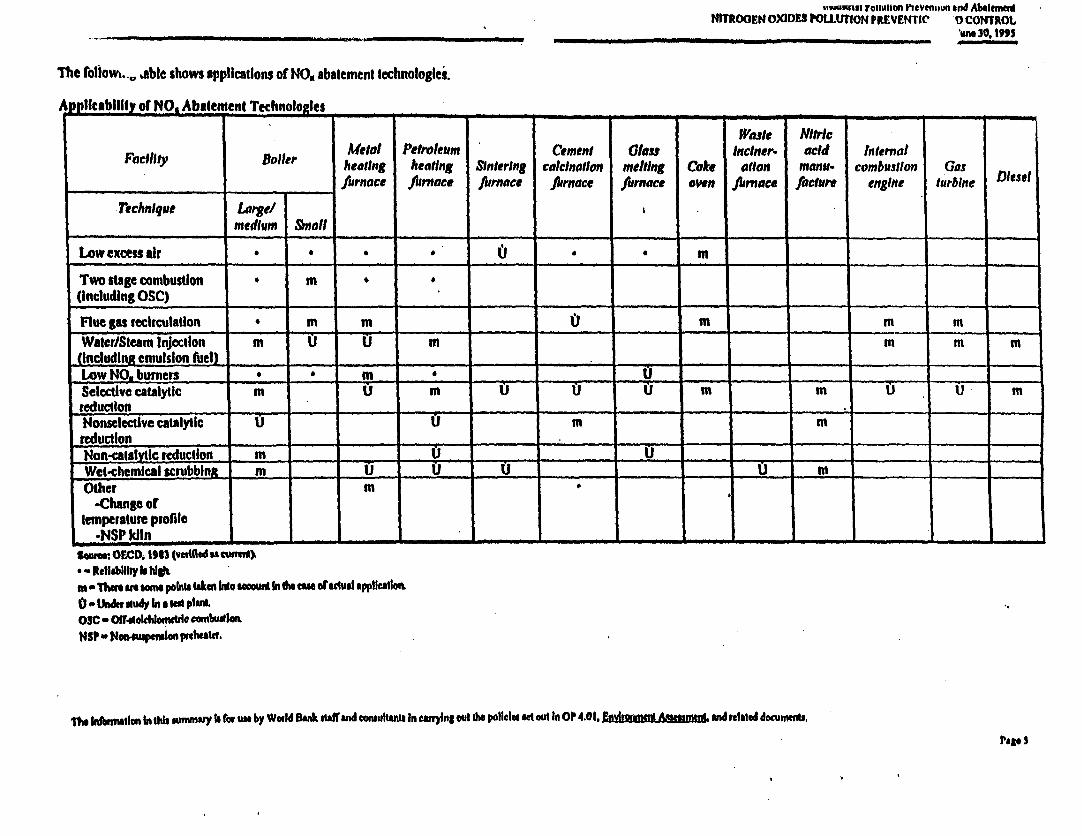
snwrgl rllullo 1-11VC11u nulw P.M10Ab Em iNITROOEN OXIDES POUIJrION ?RtVENtIC 0DCONTROL________________________________________________________ 'am 30. I"l
The fitovw.., Able shows applicatlons of NO. abatement technologies.
App iability of NO, Abule ent Technologi-
waite NitriMetal Petroleutm Cement lass Inciner- acid InternalFocII94t B oler heating heating Sintering calcination melting Coke alton manu- combustion GaOs
firnace firnace furnace furnace fiurnace own jfmace faclure engine turbine DiselTechnique Lar.el
medvium S$nall
Low exceus ir . mTwo stage combustion . m.
(including OSC) _ .__
Flue gu recirculaldon in m (1 m m mi_Water/Steam injection m U U _ m m m(including emulsion fuiel) , . . ._.,______Low NOA bumners M ...... USelecdvc catalytic m Cl m U U U in in U _ mteductlon , - - -
- -N4onselectivc catalytic U U m mreduction _ _ _ _ _ _ _ _ _ _ _
Non-calftic reductilon i m U --Wet-chemical scnibbint m _, U U U , U mOlher m
-change or(emperature profile
*NSP kiln -
Sourea2 O£ED, 19S (Vetwed am imt).* Reliability 1h AMi^ TM$ ar NM poila aken Wo d in thu h a O enftGdual applIcationo -t*ilWy In a id plaitOSC oIdolhlokhloc oendlbnsl-tJSP - t4oeuapas preheate.
11w Wbmailin in hlb unmiuy I frw we by Wauld Olan aff and cuttuanta In eanrAnt eout I policies ct ad In OP 4.01, ad relaed docuona,.
Pap 3
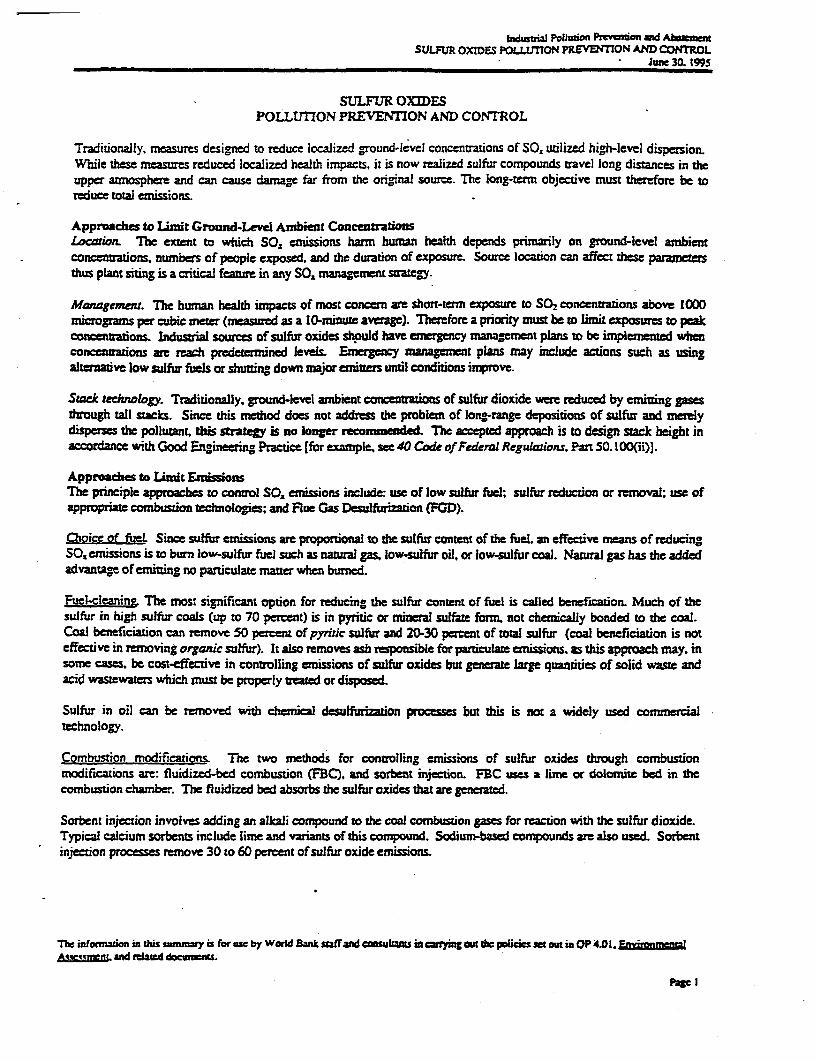
h,dtuii PoItkm P.evoaInand A4 afnuSULFUR OXIDES POLLUTION PREVEION AND CONTROL
June 30. 1995
SULFUR OXlESPOLLUTION PREVENTION AND CONTROL
Traditionally. measures designed to reduce localized ground-level concentations of SO. utilized high-level dispersion.While these measures reduced localized health impacts. it is now realized sulfur compounds tnavel long distances in theupper atmosphere and can cause damage far from the original source. The long-term objective must therefore be toreduce total ermissions.
Approaches to Limit Ground-Levd Ambient ConcentraionLocation he extent to which SO, cmissions harm human health depends primarily on ground-level ambientconcentrations, nunbers of people cxposed, and the duration of exposure. Source location can affect these paramerthus plam sitng is a critical featurm in any SO, management strategy.
Managemnu. The human health impacts of most concern are short-term exposure to SO- concenrations above 1000micrograms per cubic meter (measured as a 10-minute averag). Therefore a priority must be to limit exposures to peakconcentions. Inustrial sources of sulfur oxides should have aegnacy managemet plans to be impleented wheconctratzons are reach predeternined levels Emency management pbns may include acions such as usingalternative low sulfur feils or shutting down major emitters until conditions impove.
Stack techno1ogy. Traditionally, ground-level ambient concentrations of sulfur dioxide were reduced by emniting gasesthrough tall stacks. Since this method does not address the problem of long-range depositions of sulfur and maelydisps thc pollutant, this stategy is no longer recommnded. The accepted approach is to design stack height inaccordance with Good Engineering Practice (for example, see 40 Code of Federal Reguluions. Part 50. I 00(ii)].
Approaches to Limit EmissonsThe pnnciple approaches to control SO. emissions include: use of low sulfur fuel; sulfur reduion or removal: use ofapproprite combustion tchnologies; and Flue Gas Deulfiiion (POD).
Choicc of fueL Sinem sulfur emissions are proportional to the sulfur content of the fuel. an effective means of reducingSO, emissions is to burn low-sulfur fuel such as natWal gas, low-sulfur oil. or low-sulfur coal. Natural gas has the addedadvantage of emitting no particulate mate when burned.
Fuel-cleanin The most significant option for reducing the sulfur content of fuel is called benefcation. Much of thesulfur in high sulfur coals (up to 70 percent) is in pyritic or mineral sulfate form, not chemically bonded to the coal.Coal beneficiation can remove 50 percent of pyrzic sulfur and 20-30 percent of total sulfur (coal beneficiation is noteffective in rwmoving orsankc sulfur). It also removes ash responsible for particulate enissions, as this approach may. insome cases, be cost-effetive in controlling emissions of sulfur oxides but generate larg quantities of solid waste andacid wastewazers which must be properly treated or disposed.
Sulfur in oil can be removed with chemical desufuriation processes but tis is not a widely used commialtechnology.
Combustion modifications The two methods for controlling emissions of sulfur oxides through combustionmodifications are: fluidized-bed combustion (FBC). and sorbent injection. FBC uses a liTe or dolomite bed in thecombustion chamber. The fluidized bed absorbs the sulfur oxides that are generated.
Sorbent injection involves adding an alkali compound to the coal combustion gases for raction with the sulfur dioxide.Typical calcium sorbents include lism and variants of this compound. Sodium-based compounds are also used. Sorbentinjection processes remove 30 to 60 percent of sulfur oxide emissions.
The infonnauoa in zhis sanumey is for as by World Bank staffad COultas in CTying ou t C policies mt out in OP 4.01. £FadzUamlAtecqrwn and icated docmets.
PaeI
I S
I ifl S 13Ir 3 i I
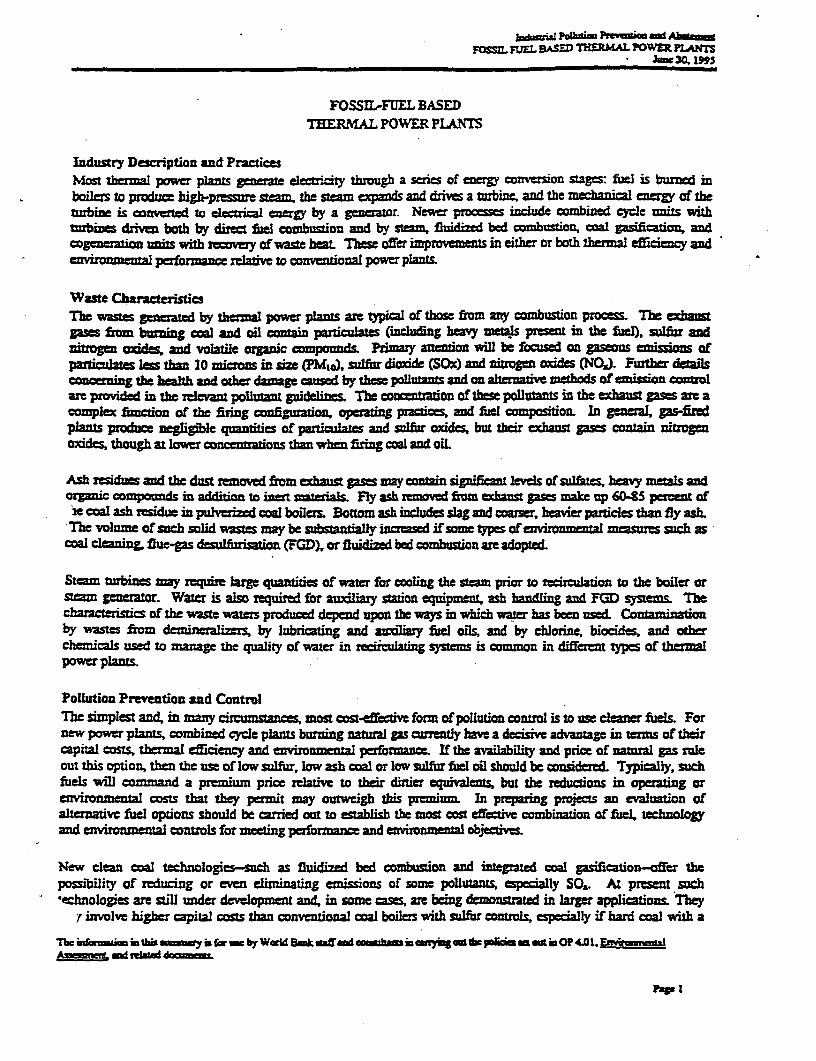
hdww Pld= Pmvb mdAnkuFOS= FREL BASE THEPMAL POWa PnTs
*m 30. 1995
FOSSIL-FU BASEDTERMAL POWER PLANTS
Lndustry Description and Practices
Most Ithrmal po. pla gnerate eletciy thrugh a senes of energy convemon stages: fuel is burnd mboiles to produce highprer steam- the Steam expands and dies a turbine, and the mechanical energy of theturbine is converted to electical eneray by a generator. Newer procI"es include COMbined CYCle uMits wtkhturbns drv both by direct fLue combion and by Steam, fl;4ized bed combustion, coal gasification, andcogeneration nits with =vy of wae at These offer improvements in either or both thermal eiciency andenvirnmental performance relmv to conventional power plants
Waste Characteiscs
The wastg ated by hermal power plants ar ptical of those fom any combustion procmss. The ehatgases fom burning coal and oil contin pmriculates iucluding heavy !et$s present in the fuel), ulfu andnogn odes md volatile orgnc compounds. Prmry attention will be focused on gaseos missi ofprticulates less than 10 microns in size (PM), tsul dioxi (SOx) and nitmgen oxi (NOj. Further detailsconcetning the health and other damage caused by the pollun and on aternatv mehod of mi conol
art provided in the relevant pollutant guiddei The concation of these pollutan in the exhaust gases e a
complex fntion of the fuing configurato opeing prac,ce and fuel composition. In general, gas-fied
plants poduce negligible quntites of partiwlates and ffur oxides, but tbeir exhaust gap contain nitrogen
cuies though at lower concentrations tha when firing coal and oiL
Ash residues and the dustemoved hor exhaust gase ny coutain sigifimi levels of late, heavy metal andOrganic comPounds in addition to incrt materials. Fly ash smoved fomn exhanst pss make up 6045 percent ofle oa ash redue in pulvc=ed coal boilers Bottoma ash includes slag and coarer, heavier particles than gy ash.'The Volume of such sold wastes may be subtantaly increased if some tes of environmental meares such as
coal cleaning, flue-as (PD), or fluidized bed combustion are adopted.
Steam turbines may require lr quantties of water for cooling the steam pnor to recirculaton to the boiler or
steam generator. Water is also required for auxiliary station equipment, ash adling and FGD systes Thec*aracristies of the waste waters produced depcnd upon the vays in which wae has been used.Con inaon
by waste frm de irs, by lubricating and auxiliary fied oils, and by elorine, biocides, and otherchenicals used to manage the quality of water in recirculating systems common in different rypes of themal
power plant
Pollution Prevention and ControlThe simplest and. i many mstaces, most cost-defie$ fonn of pollution control is to use cler fuels. Fornw power plants. combined cycle plants buning natual gas cently have a decisive advanage in terms of their
capital costs, thermal cfiiency and environmental performance. If the avaiabiity and pric of natural gas rule
out tis option, tein the use of low sufur, low ash coal or low sulfr fl oil shoud be condered. Typically, such
fuels wi comcand a premiun price relative to their diriia eqivalents, but the reductions in operaing ornvironmenal costs that they permit may outweigb tis premium. In prparing projects an evaluation of
altmative fuel options should be carried out to establish the most cost effectiv combination of fuel, technology
and vironal conmls for neeting performance and environmental objecives
New clean coal technologies-such as fluidized bed combustion and inegmated coal gasification-offer the
posiiliy of reducing or eveni eiminating emissions of some pollutants, especially SO,. At present such
*echnologies are still unda development and, in some cases, am being demonstrated in larger application Theyf involve higher capital costs than conventional coal boiles ih sulfur controls, espcially if hard coal wih a
_mde zsd
F.B.I
iuk2W PU pohgisi Nuwd AbdoFOSSLPUEL BASW TMAL POWER LANTS
-w, 30. I199
Emissions RequirementThe followg rcquircments must be met in all projec=s financed by the World Bank. The reqreMents typicllyare expressed as tcnc ons 2 facilimte monitonng. Dilution of air emissions or eluents to achien theserequimemeats is unaccptable.
Air EmissonsA ful cmnl asses t (F-A) must be carried ou before standards covering emissions of air pollutants fora new power plant or umit are sea This EA should, inter 4lia, establish baselin ambient concentrations of PM10.SQ.. NO. and ozone wihout the projet as well as idetfying the maw souwes contributing to total emssio ofthese pollutants within a dained irencom g the projec An apprpriate dispesion model that has beenociay recognized by some responsible authority should be used to investigate the impact of the project on theambient concentrations of these pollutants under altrfmatWC assumptions about envuotl controls, using GoodEngineering Pracuti stack hight (for examplc, see U.S. Government Printing Officc, 40 Code of FedeclRegdlaf)ow, Part 51.100 (ii)). Whe there is a reasonable likelihood that the power plant will be expanded in themedium or longer term, the analsis should take acomt of the impact on air quality within the airshed of theproposed plant design both immediately and aIkr any prbable pans= i capacty. Finally, the costs ofinsaling alterat emission conols sold be comparedwi thbe cots of other m=su dsignd to -inc-pollution expo1s within the airshed. If there a= significant concerns about the long range transport of acidpolln this analysis should be exended to identify la cost option for reducing total emissions of thesepollU s frm a region or a country, as appropriate.
The emisson requirements specified below represnt the basic minimum standards that should apply to alprojecs. More striagent mission requirements will be appropriate if the cavionmental ass _ ent indicates thatthe benefits of additional pollution consros as refleed by ambient exposure levels and by othe indicators ofenviromental damag outweigh the additional costs ilved. In paricula, if the environmenwal assmentCstablishes, for one or more of the pollutants covered in this doctuent that (a) te baseli exposure of signifit
laons witun the aished excds th triger value for ambient exposure spefied in the releant pollusantdelirgs and (b) the proposed project will remt in a significant vorsening in this expose level then the
gVoerMent and the Wodd Bank may agree either that the project should comply with stncter ssionrequiremets or thtt alternative mesr should be implemented to reducc emissions from other sources and tomitigat ambient cxposurcs withn the airehed
The environmental assssment should also adt other projec-speefic envir concerns such asemissions of cadmium, mercury, and other beavy metals resulting from burning certain types of coal or heay ieloiL In such cases, the governlent and the World Bank will agr on specific mesures to mitigte the impact ofsuch emissions and on the asociated emission requiremens
The guidelines apply to new fossil-fueled fired thermal power plants or units of 50 MWc or larger and have beenset at levels that can be achieved by adopting a variety of low cost options or techlogis, including the use ofclean fiels. For example, dust comntls capable of 98-99 peremtemoval efficiency. such as ESPs or baghouses,should always be ins:alled. Similarly, the use of low-NO, bmrnr, usualy with other cmabustion modifications,should be standard practice. The range of options for the control of SO. is gmate because of large differences inthe sulfur content of diffeet fiels and in control costs In general for low sufur, high calonific fuls (< 1 percnt5). specific conrls may not be required, while coal clening (when applicable), sorbet injecion or lidizd bedcombustion may be adequate for medium sulfur fuels (1-3 pernt S). FGDs or other dean coal technologiesshould be consideed for high sulfur fils (>3 pent S).
*. otb Evf AumwfK (see 0P4.013.
The intanuai m Os smawys for we by Wa1d Bank Omd osk is =ffying an The picist at in OP 4.01. EA.w"a.. iA_ uldwa _OL
Page 3
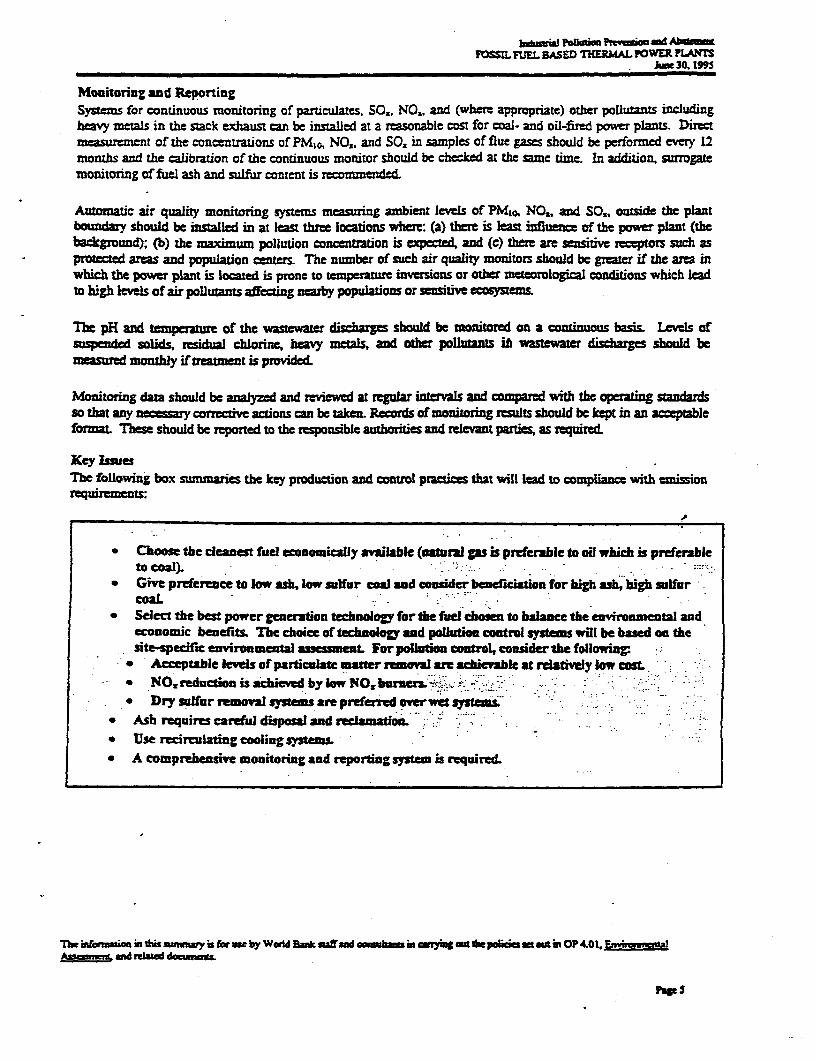
bum pouc -mmmodbnowFOSSLFUEL DML ED THERMAL POWER ?LANWS
Juic 30. 1995
Monitoring and ReportingSystems for continuous monitoring of particulates, SO., NO.. and (where appropriate) other pollutants includingheavy metals in the stack exhaust can be inslled at a reasonable cost for coal- and oil-fird power plants. Directmeasurement of the concentrations of PM0, NO,. and SO, in samples of flue gases should be performed eveiy 12months and the calibration of the continuous monitor should be checked at the same tim. In addition, surogatemonitoring of fuel ash and sufur content is recommended.
Automatic air quality monitoring systems measuring ambient levels of PMto, NO,, and SO,, outside the plantbomdry should be installtd in at lea thre locatons where: (a) there is least infuence of the power plant (thebackground); (b) the maximum pollution concentration is expected, and (c) there are sensitive reptors such asprotected areas and population centers. The number of such air quality monitors should be greater if the area inwhich the power plant is located is prone to temperature iversions or othe meteorologcal conditions which Ieadto high levels of air pollutants affecting nearby populations or sensitve ecosysems
The pH and temneature of the wasewater discharges should be smtored on a continuous basis Levels ofSuspended solids, residual chlorine, heaiy metals, and other polluans ib wasteater discharges sbhould bemeasured monthy if tratment is providedL
Monitoring data should be analyd and rviewed at rgular intRvs and compared witb the opeating standardsso that any nesy correcdie actions can be taken Records of monitoring results should be kept in an accptableformaL These should be rported to the rsponstble authorities and relevat parties, as requrcd.
Key lsuesThe following box summaries the key production and control praices that will lead to compliance with emissionrequirments
* Choose the cleanest fuel economically availabbk (natral Su is preferable to oil which is preferableto coal).
* Give preerence to low ash, low sulfur coal ad consider benercition for high ash, high sulfurcoaL
* Seect the best power generation technology for the fue chosen to balance the environmental andeconomic becefitL Tbe choice of techoly and polution contral systems will be based O thesite-specific environmental asessment. For po ruio control, consider -the following
* Aeptabie kvls of particula matter rmoval are achievable at neatively low cost.* NO reduction is achievd by low N-O, h.. .- -* Dry sulfurremoval systems are peferrd ovvrwet s..tems.
* Ash requires carefl disposal and reciamatiom.* Use recirculating cooling systems.
* A compreensive amonitoring and reporting system is required.
Tlw infnic m tis = mary sfar ew byWWe aik aad Blac m ucy aemiep==vAin P4esEui OP01.g.wrat
Pupd

I I I

APPENDIX B
1988 WORLD BANK GUIDELINES

I I I
- THERMALII &POWER ILANXS
LnRODUCnON
Undar the lFC EnvirnCsa Review Ioccbm aI powe plan wiU usually be c=cmy'A" prjects S~Ponor st thefors wnare ai fulad dFelt Enlrnm~ Aaua(BA). An outie &r a* EA s ac isd
Th frvirambet Diviniln mngly reczd& that the EA be pleted by ; indepmdmt-alified eoaulhtm,t ThxingZ the peparaion o the A, bIC reuiezte proje:t spomr2D
consuht wi± lcal = ned pam nd affcteld gps. A draft of the EA =at also be =adexvalble w ]cal merw.d prda and atod spoup by the projet apoa . TheEvir:O"MIDivisimo is priad to adv&se t proje* spoor on the fomat ad mm of anaIeable BA, as wel as on te deuails of a accpable bic omuloe and d4lmp~pam. If the apenso ha q~uonu about th- inquired idorml 2fia, ehisn ativiois avaIlble to claify any mam.
7he EA and an Enseish4lag"SO Execui Suimay preard by ft spor should beforwarded to the E!vyzon= t Divis for review a minimum of 90 days prior to the proposedLoad mecti. Afe obi8 the pons vaicn pmiaaion, IFC will place copes of thcEA and Rxeczti Summy i the Wodd BankBs Pubi nfmion C (pi p ot x I ha60 days piorto the proposed Board dates sad wil send the &eouive Summy to td,ew#s Dg1 mtoz tf for diaiutlo to &a Dirmr.
IuvCsmL= Apurmsm for ihuanl powa plant prajuww mot =Zmizouar sadard cluiuzequiw the sponsors ID:
sdfey policin ad guidcliu, and wi the stndards of te 0nty i v&ich te plo WCto be but
*b) an%&Uy pmyide z eMrIng repoar to IC s cmute ongoing coplnm wth relevane
World Bank cazvroment, bma and safety gp:ideines a provided ' atac c.
The aneA guideliaes are genem The sponson shoJl bear in mind that someof theguidelies wil not be spplicable to ther specfic projeCt and a Addidenal adiromezI; balhand sahNy Suidelins =ay be stipuluOd by UC buad o proj=cspedc infornaion.
OT0X GENMAL onNB Qa
a) FcmubUcts caft3fgt c as shoul b avdi m m z p1b) T.,fam rt qwpmui coi pobloknuod wps)ho P CPCBm) o
sbould n b1 ib nk 4 ad4 eisig m vo g ?CB# oR sdbe phsid ou and Ai;wuI of in aL m w mai sfttho e f the ho comy.
o) Pmmg*u auipt and ewl cooig@ wwgt& eavob* n dup or MUM to ula'* - c of elWomftommorwb (CFCa), inolaai Msics, Acmd wt be imbllsd, and *fr
wit s Y _ram= of* h Coutry.d tora and kaqu hn o r fcr &0ols =w and u-pnms mosius, soavmts WO
and psdnf io0aM be duipd wiX soduy cnmnt (04 dB^ bis) ipm%%W spisa nd the ooeineuim of sof, poundwa ad smfoa vat=
WCRKPLACE AIR QUALTrY
a) Peod mcaimw of iuv4I a quay should 1b ooad- fr sw .ominw imlevan toemployme zk ad the plaes opwai= -
b) VaWndco. atr moninna conm1 wquipma pratec&m zupkauAy equ#xmWn and &i qu.liy==koft e *mm! should be sill in-1ntalnd.Pr otasuve repntoy quipmu most be Use by employms whti the expowe f levlsr weldmgfLs .wivan nd oth ff izaials pzu in th w lau Xcod lol oracpa smdurds -or t h folowing 6rbol limk vane (LVs):
CarboNfim=dde 29 znxW'_ qag Dioxide 6 = sP I Omt ~Ner Niunc Due) 10 §512Mw Diaxld S W
WORQJL= NOS
a) Feasble admW=&za~e uud agizwing caols, includib soud-:mWnd aquipBeo ad c=rolzoms abomad be ampk7ed to vadnm to wwap mm mvsl in mnonal wark urnL
b) Plawt squipm=t sbould be well mainained to in;im jiwezo levels.*) Pa=wd. amut uw hawing protamm whman mpmed mm norn l"' ahws SS aL4.
a) Stict procduns must be followed for dp.mazingV ad checkg cf dectial equmct befor?n8iutewc wok
b) Suinc efety promdcdrs must be ips.d includin OxzSn? sUPWVisoa whan edbfrdmaintmart woik on enczi= equipmeat,
C) Pasiomel tiuiz miust be providd cm m,v*val aclmqua for elI=Wwn.
WVORK IN CONIIT.D SPACE-S
a) Pziar to cuy ad occqmcy. aUl confined space (4., ftanks amps vessLs, soma aavmics)mnast be uned for ft pruesm of todc, Samumble and eiplosive pine at vapan ad fcr felack of ryM.
b) AMequatc Yva-Loa must be providd b*xelbe y ad duing o=pmy of ib smsc) Parsonnel =ust mme air-supplied niztan wriez wczdg ia cornlad speew whh~ may b.cmw
Xbaa Paw. Ph -l
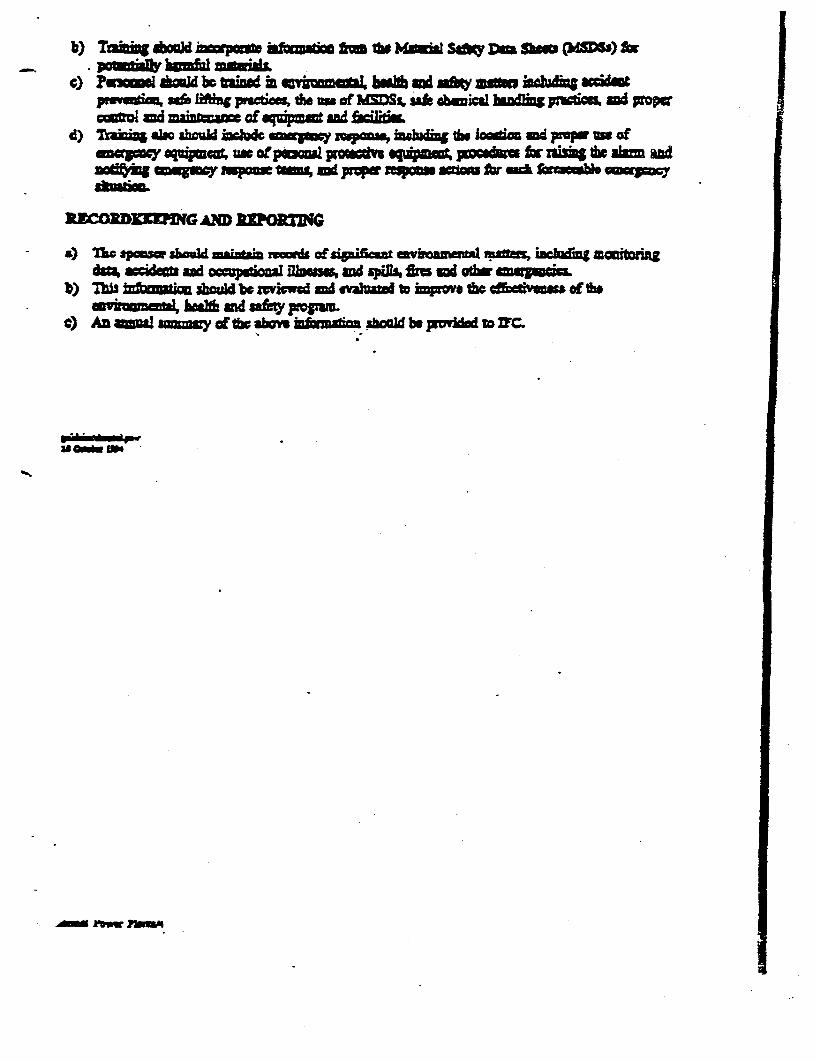
b) To.M afwum s t Sm Dm ()dnw SS) s- ~poun 'a bcmf ugasow
*)Puiin *k=d be mk uiun c vtio b" and mstW msoa icbadmg eCUMmrwnd SW an mdw the muof PAM. aah camiei, banding Pudi~m n.d ~PuA ad m awa of i md b
d) Trak&& &W -hcuM bclsac q wp_m, Xoha& ts locd= md -u ofaqm y q a us ofpqimZ tipole .qa PG8U f z 3 ts andnodfyug mumy poe and popw = WMa tQ -01 UMMOO ==F
DDCOeRD7DIG aP OTNG
a) Mm spcma sbould vnaa;in of sipihmct mvwoal y in, imd mtisatda, oe mad o=pdoug fllawm aid sp iR& iAnd &w
b) MMu tMmU should be nvviwa and muah= 10 impiov fth davmm of doeamvknnm~ hahh and aa&ty ogmin.
o) An =mda muwy of the abov tmism~o sboal be provided m 37C
3 _w we
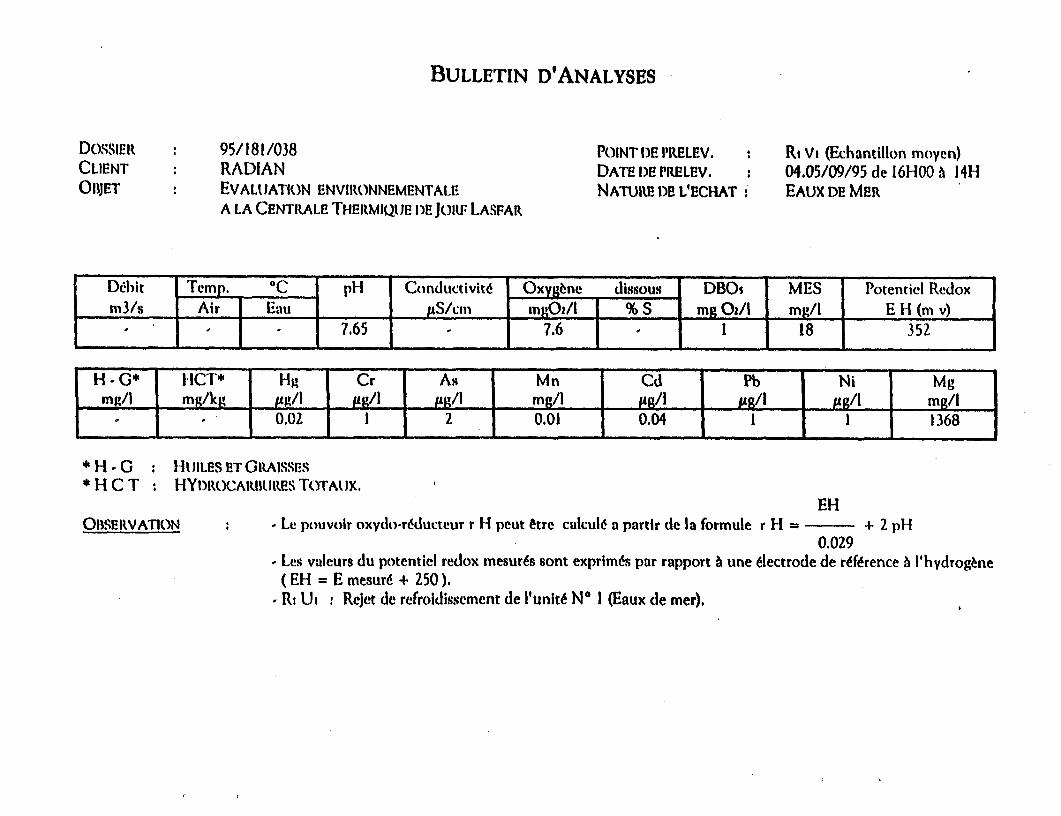
BULLETIN D'ANALYSES
DOSSIER 95/181/038 POINT DE PrELEV. Ri Vi (Echantiilon moyen)CLIENT RADIAN DATE DE ;'RELEV. 04.05/09/95 de 16H00 a 14HOBIJET EVALUATION ENVIRONNEMENTALE NATUIE DE L'ECHAT: EAUX DE MER
A LA CENTIRALE T-ERMIQUE I)E JOItF LASFAR
Dthit Temp. °C pH Conductivite Oxygbne dis,ous DBOs MES Potentiel Redoxm3/s Air Eau I gS/cm mLOz/I, % S mg 0*/I mg/l E H (m v)
. 1 6 7.65 7.6 1 18 352
H1 - G'' HCT* Hg Cr As Mn Cd Pb Ni Mg| mg/l | mg/kg | 0.0Z | g/I |g/g/I | mg/I | ig/I | g/l g/I mg/I
m mg/kg ~~0.02 1 2 0.01 0.04 1 1 1368 j*s H -0 : HuIILESETORIssEs* H C T : HYI)DROCAMIIRES TOTAtJX.
EHOBSERVATION - Le pouvoir oxy(do-rdducteur r H peut etre calcule a partir de la formule r H = + 2 pH
0.029. Les valeurs du potentiel redox mesures sont exprimes par rapport A une diectrode de reference b I'hydrogbne(EH = E mesurd + 250).
- Ri Ui : Rcjet de refroidissement de l'unit N° I (Eaux de mer).
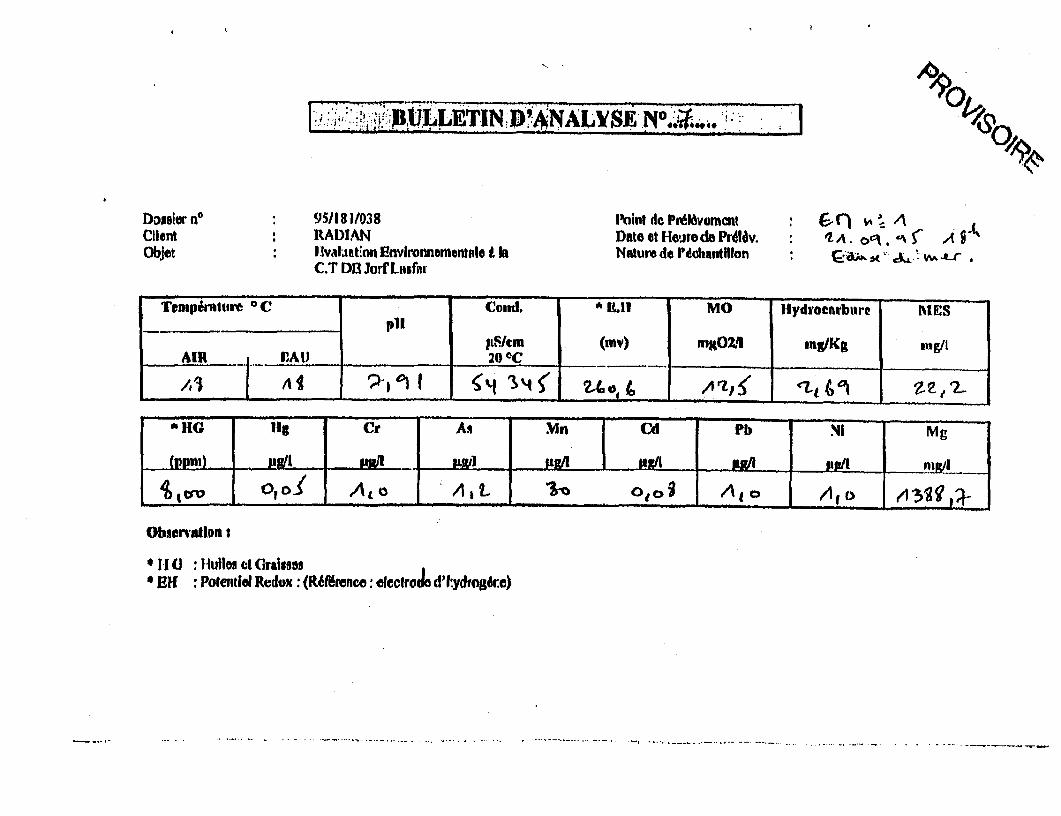
0 JILETIN D.'4NALVSE NO4.1.. !.::
ClmssiRrnA DI45/N8038 lnint de PMl6vmcnt : ii W AClbent RADIAN Date etHe'jtodePrdliv. : ZA. cai. . $ S 4 Ojeot Ihalat.Con Enviromemenileo t h 'taIure do lAchtllIon
C.T D13 JorfLasfitN
Tons pntr °C Cond. A ILII --ipMO Hydrocarbure RIES
ARAIcm (mv) 01g021 mng/ICzAIR I,AI _________ 20°C_. _ _. _ ._._. _______0_
AUNG Hg * iCr As mn Cd Pb .4l Mg
(IPPII1) Huggl Mg . "1 . 1 ,.I ,R/ - 0_,Ue_na
I__it_ _o__ At - At. 0 1 0 g I A¢ 1 ±3if a_Obsenaaloti
I H : Hluiles c el(alsDs* EH : Polentlel Redox: (R1Irenco: fecIroJo ct'l:ydrog6r.e)
5- ASSURANCE QUALFrE
4 tCERE[LPEE dispose d'un systOkme assurance quaIit afin de
garantir une flabilit£ des resultats. En effet, le CEREP dispose des
documents suivants:
* Manuel qualitk dir t I'organisation gnteraie du
. Plan qualift dectrvarnt les modes op&ratoires utiliss
*, I dans le. domaine d'analyses des eaux.
* Le mat6riei utlise est cornforme auc nornes en
vigueur et fait r'objet d'optrations penriodiques de
* verificayion et d'.talonnage.
* Par ailleurs, les risultats d'analyes sont valid6s, apres
; verfication, par le responsable du laboratoire (balance ionique,
auto-contr6le, essais inter-laboratoires,.) ,
* I
33 Sol
les analyses effectues sornt les suivantes:
. pH, conductivite
'MES
* Matieres organiques
a HS Cr, As, Mn, CD, Pb, Ni, Mg
4. METHODES D'ANALYSES LTILISEES
- pH: Norme ANOR T9O - 008
- Conducthvtt: Norne AFNORT90 - 031
- Oxydabilii au permarganate de Potassium Norme Afior
NFB 35.301
- Hydrocarbures : Nor-ne Afnor T 90 - 114
- Poteitiel Redox:
- Mtaux lourds:
* Pb, Cr, Cd, As, Ni : Norme Afnor T'90- 19 (four ectro
thermique)
* Mn : Norne Afnor NFT 90-112 (technique de flamme)
* Hg: Norme Afnor NTT9O - 113 (ginirateur de rdpeur)
3- PROGRAMME D'ANALYSES
IEaux usees
|J nniveau de chaque rejet, 12 pr&levements ont et effAchis
pendant 24 heures . Les analyses ont Ot effectuees sur
|I'.charrtil1on moyen.
Le programme d'analyse est comme suit:
. Echantillons ponctuels: pH, r. Conductiviti
. Echantillons rmnyens: MES, Oxygane dissous, DB05,
Hg, Cr, As, Mn, Cd, Pb, Ni Mg, pabentiel redox
| Concernant les hydrocarbures
*R1UL,RZUZ etR CD;
3 prilivements ont 6 effGectues sur z4 h, ranalyse effectu.e
sur l'echarntllon mrcyen.
1. INTRODUCTION
|ns le cadre de 1'&tude de l'evaluation de '4tat de
'ernrvironnemerit au stte de la centrale thermique de jarf-Lasfar,
RADIAN-CORPORATION a demande au Laboratoire Public
d'Essais et d'Etudes (LPEE) la rialisaion des campagnes de
pr4l-vements et d'analyses deaux soutprraines, dceaux usees,d'eaux de mer et de sal.
2. INVENTAIRE DES POINTS DE PRELEVEMENTS
! 4& polrrb- ydntfait I'objet de prilivements sont le sumdnth-:
Eaux usees:
4 rejets ont fait l'objet de sui 2 savoir:
* RIUl ; Rejet d2eau de refroidissment de l'unilt 1
I R2U2 : Rejet d'au de refroidissement de 1'unit6 2
i RSD : Rejet sur la digue. Cest ur rejet mixte
Gndustlel et domrsique)RCD :RRejet contre to digue . C'est un rejet mixte
Crndustriel et domestique)

I
ETUDE ENVIRONNEMENTALE
AU SITE DE LA CENTRALE
TEHRMIQUE DE JORF LASFAR
| (C.E.R.EP)

I I
4= R ULABORATOIRE PUBLIC D'Es;A ET D'ETUDES
j~ ~ ~~A - S zte d'Ekdes ot de ic 3iesrsh s
i tm et la Polhz±on (CXEL?)
(2| 12 2) 40.30.70 ,24.44.65
Csablanca. le -l
Moinnsir Tonry RT7KVWax : 00 1502425 9625
Monsi. E: S LArANBI
-* I 1!iiN3(212 2) 301550 / 446430Nfllef ~- 95f1SUW6461USUtlMki
Nbrede : 4CYcomprislapagedegrde).i * Objet E~zde CIw r0nDcu2c1ta1 = site dc )a ca1e
daq~e ads JcLs~rz
i T E XTE
Monsieur,
V Yeu;tuez trouver ci-joint les rapports re'ifs 'a rtude citEe en objet etablisI re-Tetivement par [e CEREP et I A
Saluttion.s diHingudes.
__L I
~ I
1M T:21s.~s7un.7 rtLs1t7147it.7 AW 530 _a.~O4O T6M: 3GtS.xo ,, L.J. -. B.P. tamg ,
Aid:_hIsap :LABOBAtIA-CASA^LACAC ... t).,i T"&-LA9A. .A27aM
avf o s_ttr *: ;' . 39 . _' Z rn NSRs__w_

f * l 6~~~~~~~~~~~~~~~~~~~~~~~~~~~~~~~~~~~~~~~~~~~~~~~~~~~~~~~~~~~~~~~~~~~~~~~~~~~~~~~~~~~~~~~~~~~~~~~~~

APPENDIX D
WASTEWATER ANALYSIS

I l I
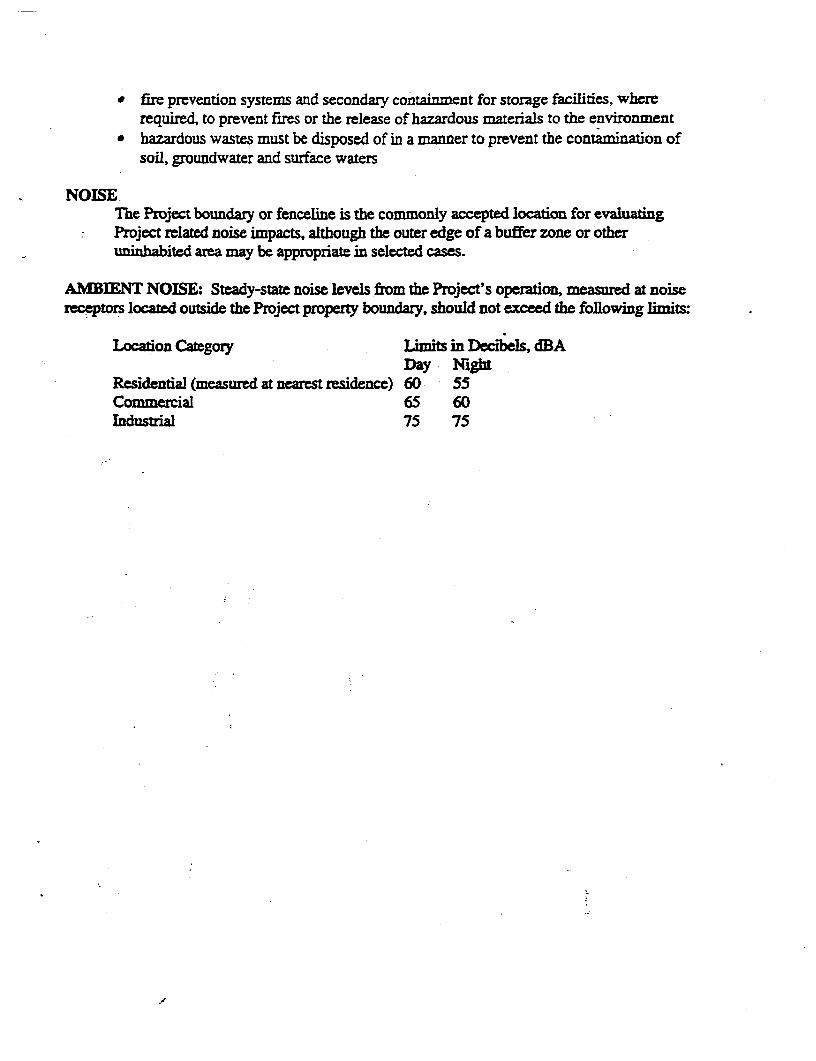
* fire prevention systems and secondary containnment for storage facilities, whererequired, to prevent fires or the release of hazardous materials to the environment
* hazardous wastes must be disposed of in a manner to prevent the contanmination ofsoil, groundwater and surface waters
NOISEThe Project boundary or fenceline is the commonly accepted location for evaluatingProject related noise impacts, although the outer edge of a buffer zone or otheruninhabited area may be appropriate in selected cases.
AMBIENT NOISE: Steady-state noise levels from the Project's operation, measured at noisereceptors located outside the Project property boundary, should not exceed the following limits:
Location Category Limits in Decibels, dBADay Night
Residential (measurd at nearest residence) 60 55Commercial 65 60Industial 75 75
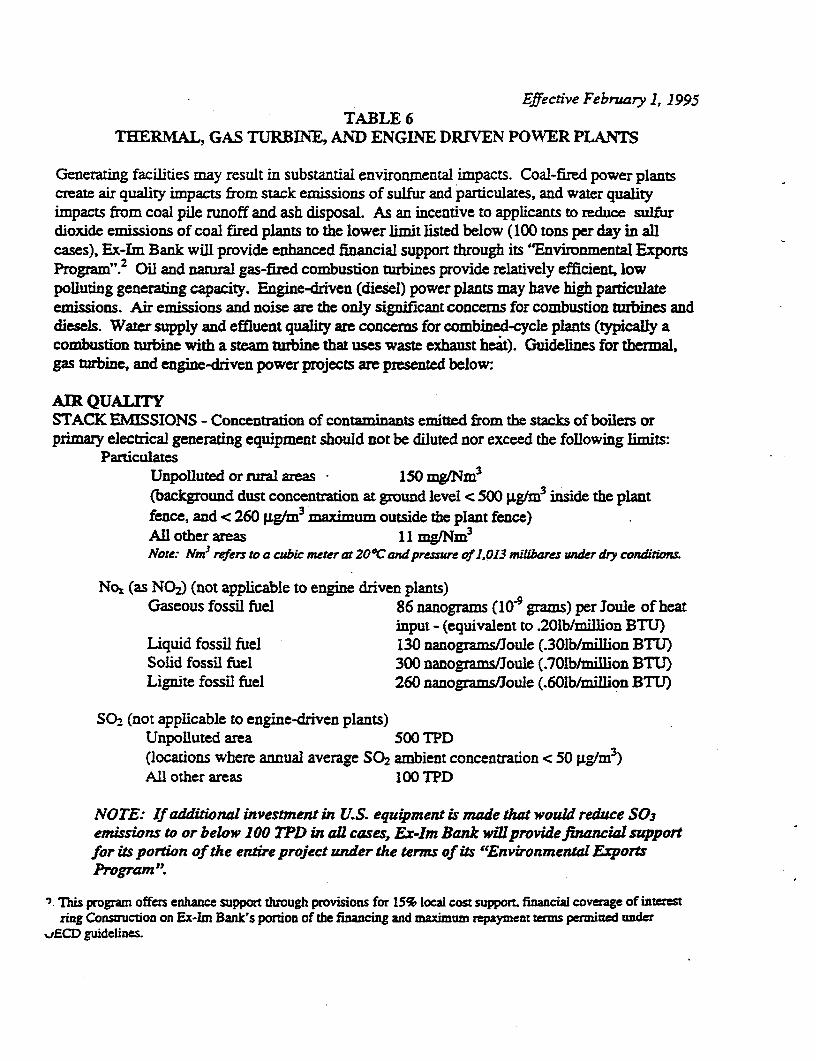
-Effective February 1, 1995TABLE 6
TEERMAL, GAS TURBINE, AND ENGINE DRIVEN POWER PLANTS
Generating facilities may result in substantial environmental imPacts. Coal-fired power plantscreate air quality impacts from stack emissions of sulfur and particulates, and water qualityimpacts from coal pile runoff and ash disposal. As an incentive to applicants to reduce sulfurdioxide emissions of coal fired plants to the lower limit listed below (100 tons per day in allcases), Ex-Im Bank will provide enhanced financial support through its "Environmental ExportsProgram .2 Oil and nantral gas-fired combustion turbines provide relatively efficient, lowpolluting generatng capacity. Engine-driven (diesel) power plants may have high particulateemissions. Air emissions and noise are the only significant concers for combustion turbines anddiesels. Wat supply and effluent quality are concerns for combined-cycle plants (typically acombustion turbine with a steam turbine that uses waste exhaust hcat). Guidelines for thermal,gas turbine, and engine-driven power projects are presented below:
AIR QUALITYSTACK EMISSIONS - Concentaton of contaminants emitted from the stacks of boilers orp,rimay electrical generating equipment should not be diluted nor exceed the following limits:
ParticulatesUnpolluted or mrual areas 150 mg/Nm3
(background dust concentration at ground level < 500 9Lg/m3 inside the plantfence, and < 260 ,Ug/m3 maximum outside the plant fence)All other areas II mgfNm3
Note: Nm3 referstoa cubic meterat20Cand pressre of 1,013milibares wider Yconditions.
Nox, (as NO2) (not applicable to engine driven plants)Gaseous fossil fuel 86 nanograms (109 grams) per Joule of heat
input - (equivalent to .201b/million BTU)Liquid fossil fuel 130 nanograms/Joule (.301b/million BTU)Solid fossil fuel 300 nanograms/Joule (.701b/million BTU)Lignite fossil fuel 260 nanograms/Joule (.601b/million BTU)
SO, (not applicable to engine-driven plants)Unpolluted area 500 TPD(locaEions where annual average SC2 ambient concentration < 50 Ag/m3)All other areas 100 TPD
NOTE: If additional investment in U.S. equipment is made that would reduce S03emissions to or below 100 TPD in a cases, Ex-im Bank willprovidefinancialsupportfor its portion of the entire project under the terms of its "Environmental ExportsProgram".
m lhis program offers enhance support through provisions for 15% local cost support. financial coverage of interestnag Construction on Ex-Im Bank's portion of the financing and maximum repayment terms permitzed under
vECD guidelines.

APPENDIX C
EXPORT IMPORT BANK GUIDELINES

I I
- 224 -
6. U.S. of Federal Regulations, Title 40, Part 50, Apperxix F."teasurneret Principle and Calibration Procedare for the Measurementof Nitrogen Dioxide in the Atr,sphere (Gas Phase Chemlurminescence)".ofice of the Federal Register. Washington (July 1, 1982).
7. American Society for Testing anri Materials. 'Standard Test Method forNitrogen Dioxide Coterzt cf the Atmosphere (Griess-Saltzman Reaction)".Method ANSI/ASTM D-1607-76. Philadelphia (1976).
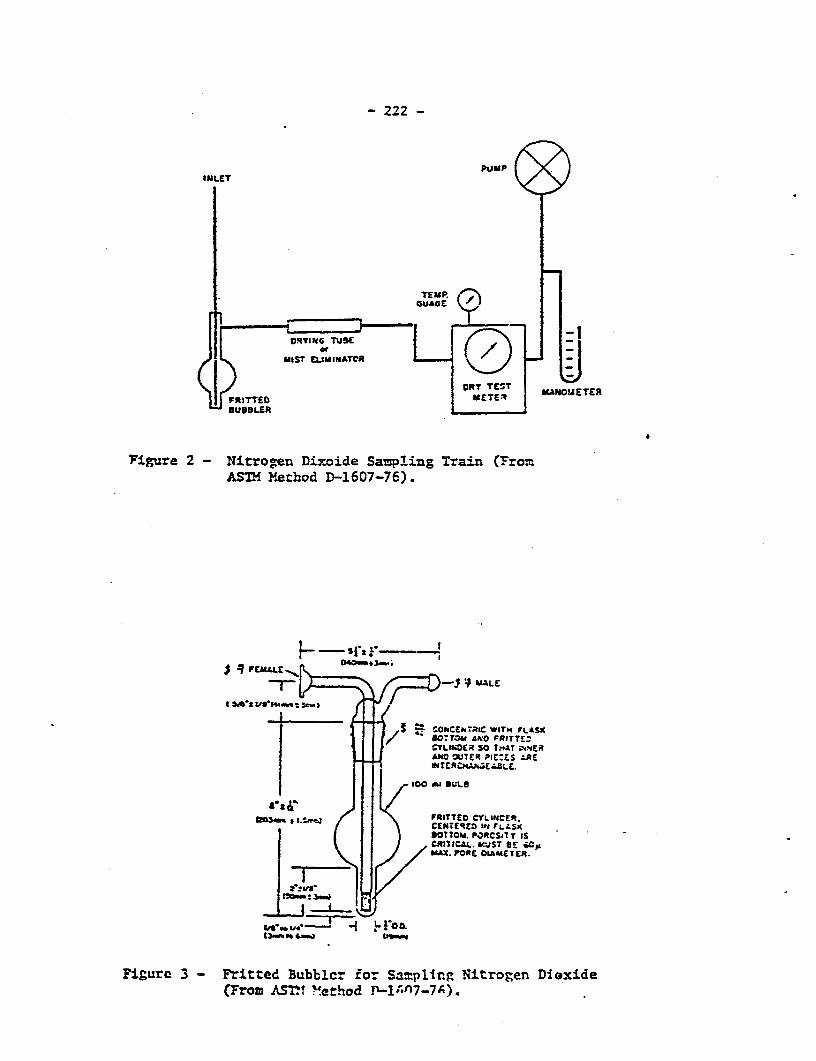
- 222 -
PUMAPINLET
TEMP
CRY TESTI TAOIETR
RITTED I4ETERVVTE-UE9LER .
Vigure 2 - Nitrogen Diroide Sampling Train (YromASTM Method D-1607-76).
j q FE£ALC
-~~~1~~~~- ~MALE
_ .CO1CEW7-RIC WIhr rLASX/ ' O0TOu AICO FRITT!ZCTLINDER SO T.4AT .NNERAND OUTER PIc:ZS AREWITERCHAiEAL.E
tOO Al BULB
t20. ,1# \ FRITTED CYLINCER.CEP -ERED II FLA SK*OTTO4. PORCSiT y ISCRITICAL. UJST BE icCpMAX. POREt DLAMETER.
fbana: 3 3oo
t " S_@ Gx_
Figure 3 - Frlitted Bubblc- for Sampllng Nitrogen Dioxide(From AST2t ".eehod P-1A17-7A).
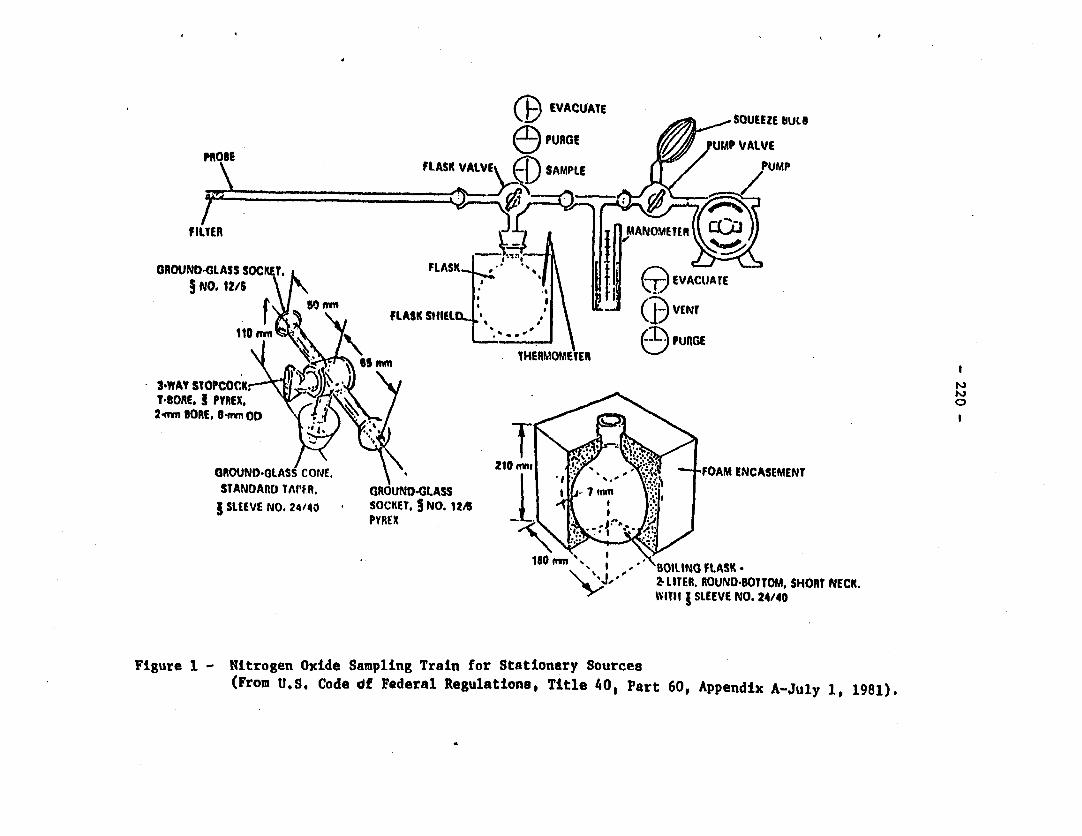
@ EVACUATEG EVAC_JAYSOUEEZE BUtL
PROS! ePURGE UM P VALVEPROBE FLASK VALVEF9 SAMPLE /PUMP
FILTER \ TMANOMETER J
GROUND-GLASS SOCKET. FLASK EVACUATE
NO. '12/S VCU
(I VENTFLASK SHIELD : \
1!0 ntt 5t 8 * w \ t vPURGE
3-WAY STOPCOCK f¢JL. T-tORE, I PYREX,' lXI°2-mt BORE. 0-nOD .B8/.I
24?wn SORE. 3-fiGLA Lor. \EOETR * ., , ; -FOAM ENCASEMENTGROUND-GLAASNSTANDARD TAPER. GROUND-GLASS : 1. n3 SLEEVE NO. 24/40 SOCKET. s NO. 12S I
180 ftwn: " $ ,S ' BOILING FLASK -2- LITER. ROUNO-BOTTOM. SHORT NECK.WITH I SLEEVE NO. 24/40
Figure 1 - Nltrogen Oxide Sampling Train for Stationary Sources(From U.S. Code df Federal Regulations, Title 40, Part 60, Appendix A-July 1, 1981).
- 218 -
HE WOILD BANK NVEMER 1982
CTICE OF EVIRIMETL AFFAIRS
NITROGN CXaDE SALI AND NALS
1. Ihis hcumert suplements a nicn Bank document, titled"Nitrogen Oxide Eiissions". It provides procedures required for samplingand analysis of stack emissions and the arabiert atsphere to deteninecowpli^A with NOX pollution limdts for Bank projects.
2. Major wn-cade emissions of nitrogen oxides are fossil fuel cci-bustion in stationary sources (heating, power generatio, etc.) and ex-hausts f*a nDtOr vhicles and ary mrvable ces utilizing internal c-busticn engines.
3. Lard areas nrmally bave natural background cxcentrations of ni-troge dioxide in the range of 0.4 to 9.0 icrrans per cubic neter. Inurban areas, world-wide, average annual 1n cyratiors myaryfn 20 to 90 microgram per cabic mter.
4. xides of nitrogen, for purposies of tes do.met, inlude nitricoxide (NO) ard nitroge dioxide (N2). At POint Of diLsarge fra m-Wadesources, the principal oxide is nitric ocide. This is rapidly onverted tonitrogen dioxide by atmospheric *eical reactions. Nitric oxide and ni-trogen dioxide can be neasured separately cr mllectively ty various teda-niques.
STPTIONAM SOURr-E MCNIORIM
5. Stationry soure samples are collected through cenings providedfor that purpose in stacks or other ducts carrying enissions fmn c xbzs-tion d ±ers. Sarpling ports sould be located at least eight stack di-ameters yond any bends, constrictions, a.atequiEuent, or othercauses of fl dist nce. If this is not possible then the sanpling lo-catim should be at least t stack diameters ahead of the flw disturb-ance. xe these conditions cannot be net, it my be necessary to extendthe stack.
6. Saipling ports sculd be flush with the stack walls, and extendoutsard fan the exterior wal1 for 5 to 20 cenatist. rtever, addition-al extensionay be required for installing valves or othr a rt c.
- 216 -
CONTROL TECfLOGY
22. Emission control measures must be designed for each individua.oplant, particularly since the system must be capable of reducing mcre thanane polludart in most situations.
23. Tihe rrost cmrtn method currertly used to reduce NO, emissionsfrom automobile exhausts (which are the major sources) is the catalyticconverter. 'Ihe method utiliz-es a catalyst instead of high temperatares toadhieve simultaneous oxidation of the reminiLng fuel, and reduction of NOxto N2 . The catalyst achieves the double goal of decreasing concentrationsof both Nox and hydrocarbons on a metal catalyst deposited cn ceranic ma-terial.
24. Mo*bile source emissions are also reduced through changes in com-bustion dban-ber design (such as lower caipression ratios), spark retar-dation (including both basic timing and a "slower" advance curve), and ex-haust gas recirculation.
25. The NOX eOmissions frroi oil-fired ocbition systems can be re-duced b mixing water with the oil before it is sprayed into the burners.Water decreases the crmbustion taiperatures, and can reduce N0, Omissionsfran light-weight oils by as iuch as 15 percent. Energy-wise, bowlever, tlbmethod is cznsidered to be costly.
26. Emissions from stationary smurces, such as utility and indrustrial*~zssicn installations, can be reuiced by a number of methods. hnongthese, staged carbustion, low excess air cperation, and flue gas recircula-tion are widely used.
27. Staged combustion is effective for control of both thermal andfuel nitrogen oxides. Ihe method consists of initaally providing less thanthe amurtt of air (02) required fcr cmplete oxrbustion. After a tine de-lay more air is aAAed in one or more steps or stages. The method is appli-cable to a wide range of fuels and facilities, from pulverized coal burnersto small scale industrial boilers. Addition of this rethod to exsstingcoal-buring installations has resulted in a 30 to 50 percent reductimn ofNbX eTmssicns.
28. In the low excess air method, the principal rechanism is also thelack of available oxygen for c=bining with either thermal activated orcracked fuel activated nitrogen atans. This method can be combined withthe staged combustion process, and can reduce nitrogen oxide emissicos by40 to 70 percent, without seriously increasing carbon cnoxide emissions.
29. Flue gas recirculation has been effective in controlling thermalnitrogen oxides. The recirculation cf exhaust gases to the flame regionrreduces peak temperatures and cxygen availability, thus reducing nitricoxide formation. This method is more difficult to apply, since it requiresincreased operation controls and greater capital investment.
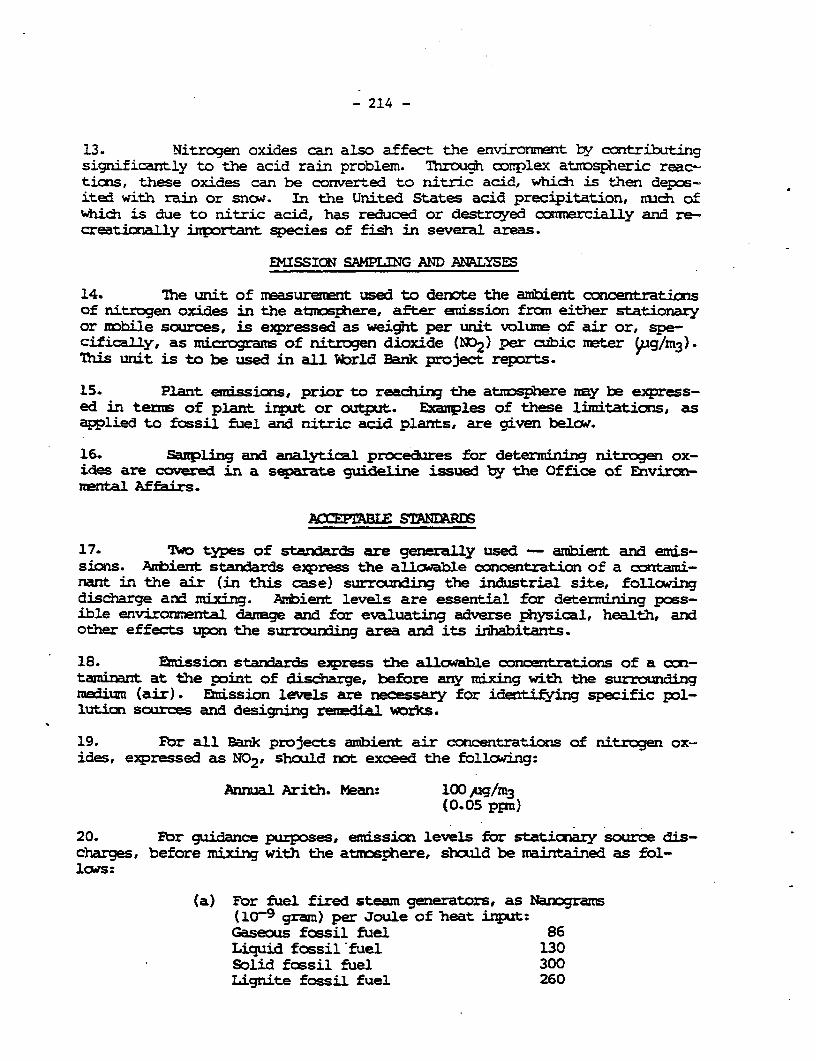
- 214 -
13. Nitrogen oxides can also affect the environrrmnt by contributingsignificantly to the acid rain problem. Through corrplex atm3spheric reac-tions, these oxides can be converted to nitric acid, which is then depos-ited with rain or snow. In the United States acid precipitation, much ofwhich is due to nitric acid, has reduced or destroyed commercially and re-creaticnally important species of fish in several areas.
EMISSION SAMPLING AND ANALYSES
14. The unit of measurement used to denote the ambient concentrationsof nitrogen oxides in the atmosphere, after emission frcm either stationaryor mobile sources, is expressed as weight per unit voAlume of air or, spe-cifically, as micrograms of nitrogen dioxide (NO2) per cubic neter W4g/m3 ).This unit is to be used in all World Bank project reports.
15. Plant emissions, prior to reaching the atmosphere may be express-ed in terrs of plant input or output. Examples of these limitations, asapplied to fossil fuel and nitric acid plants, are given below.
16. Saipling and analytical procedures for determining nitrogen ox-ides are covered in a separate guideline issued by the Office of Envircn-mental Affairs.
ACXE?nBLE ST
17. Two types of standards are generally used - ambienL and emis-sions. Ambient standards express the allcw-able Concentration of a contami-nant in the air (in this case) surrounding the industrial site, foflwingdischarge and mixing. Arbient levels are essential for determining poss-ible environnental damage and for evaluating adverse physical, health, andother effects upon the surrounding area and its inhabitants.
18. Emission standards express the allcwable concentrations of a con-tamiinant at the point of discharge, before any mixing with the surroundingmedium (air). .zEission levels are necessary for identifying specific pol-lution sources and designing remedial works.
19. Fbr all Bank projects ambient air concentrations of nitrogen ox-ides, expressed as N0 2 , should not exceed the following:
Annual Arith. Mean: 100 ,ug/m 3(0.05 ppm)
20. F br guidance purposes, emission levels for stationary source dis-charges, before mixing with the atmosphere, should be maintained as fol-lows:
(a) For fuel fired steam generators, as Nanograms(10-9 gram) per Joule of heat input:
Gaseous fossil fuel 86Liquid fossil fuel 130Solid fossil fuel 300Lignite fossil fuel 260
- 212 -
IHE WORLD BANK NOVER 1982
OmCE OF E2V I}L AFFAIRS
NITROG CIDE EMISSICNS
1. Oxides of nitrogen present in the atns*lpere originate from bothnatural and man-usde sources. Natural sources include lightning, volcanicenptions, and bacterial acticn in the soil. Although these natural eais-sicns far exceed those generated frm nan-nnde activities they are no,t con-sidered siict. They ae over the entire earth, and theresulting air cocentratins are practically negligible. The backgrandcocentration of nitrogen dioxide in land areas generally ranges betwee0.4 and 9.4 micrograms per cubic neter.
2. This docununt will concer itself with those oxides of nitrogendischarged frmm can-made sources. They include nitric oxide (NO) and ni-trogen dioxide (N°2). At the point of discharge the predordnant fcrm isnitric oxide, but this is readily converted to nitrogen dioxide thrzxghchemnica reactions in the at:shere.
SOURES AND ErS
3. The principal source of ran-rde emissions is the catimtiai offossil fuels. In this context fossil fuels include coal, oil and its de-rivatives, and natural gas. The predominant oxide of nitrogen emitted bycarbisticn processes is nitric oxide, with small amrunts of nitrogen diox-ide. Emissions originate f ran bout stationary and mobile sources. Specif-ically, emissions originate from transporaticn (principally aut=bile ex-hausts); fuel i sn for poer generation and industrial production;and certain non-caorstion sources. Hc ccatustim of fuels nay also nokesi gnficant contributions in scme locations. Other industrial sources in-clude fertilizers, glass, iron ore preparation (sintering and pelletizing)plants, and petroleum refineries.
4. Stationary carbstion scurces will generally account for 50 per-cent or more of the total nitrogen oxide emissions. Eor example, the pro-porticns are estinrated to be 60 percent in Japan, 59 percent in the Nether-.lands, 82 percent in the United Kingd, but only 44 percent in the UnitedStates. HEre cmbiustion of fuels is said to contribute between 5 and 6percent of the emissions in the United Kingdan and the United States.
5. Transportation scurces include personal autamcbiles, buses,trucks, railroad vehicles, aircraft, and ships on inland waterways. Gaso-line pcwered vehicles are by far the largest ccntributors among these. Ofthe total emissions, transportation facilities contribute approximately 40percent in Japan, 41 percent in the Netherlands, 18 percent in the UnitedKinsgdom and 51 percent in the United States.
- 445 -
5. U.S. Ehvironintal Protetion Agncy. 'IHanrscontinuous Air Pollu-tion Source Monitoring System". Dcument EPA 625/6-79-005. WashLng-ton, D. C. (June 1979).
6. U.S. Coe of Federal Regula, Title 40, Supter C, Part 50, Ap-perdix A. "Referenc Method for eternination of Sulfur Dioxide in theAtmnosphere (Paraailine M4ethd)-. Office of the Federal Regier,GSA. shington. (July 2, 1981).
7. SalU, R.J. and Andersoa, G.E. "Opti4urn Site ExPOsure Citeria for So2Monitoring". USEPA Publication Fb. EPA-470/3-77-013. Pesearch Tri-anjle Paric, N. C. (April 1977).
- 443 -
17. ¶he dYrinac and continuous sar:pling units usually consist of asystem inC0rporating several pcrie-nts, as shown in Figure 2. A typicaldynamic collecticn systerrs wauld include an inlet secticn, absorptic- sec-ticn, flow regulatimn device, and a pmp, as the prime rrover.
18. A typical cntinuous uronitoring devi;e wuld consist of an inletsecticn, gas pretreatment section, dletector, photo.ultipLier, spectraneter,and rea&dut device. .epending upon the conditions of the gas to be mcni-tored, the pretreatment section could include pressure adjustment, renmvalof particulates (usually a filter), removal of wristure (usually a silicagel column) and tenperature adjustment (usually a condenser).
Analyses
19. The U.S. Envircnmental Protection Agency, after examination ofthe various methods used world-wide, has adopted the pararosaniline methodfor deterimination of sulfur dioxide in the atmDsphere. In this method thesulfur dioxide is absorbed in a solution of potassium tetrachlorcnercu-rate. A coxplex is then formed, -hidh is stable to strnng oxidants. Ihecomplex is reacted with pararosaniline and fornaMldehyde to form paraosani-line methyl sulfonic acid. The absorbance of the solution is then measur-ed spectrodhotcmetrical1y. This is the method to be used in onnectinuith World Bank projects. lThe methcd is applicable to the measure.ent ofsulfur dioxide in ambient air, using sanpling periods of up to 24 hours.
20. Concentrations of sulfur dioxide in t,-e range of 25 to 1050 mic-rograms per cubic meter (ug/m 3 ) can be measured by this method. Concentra-.icns below 25 ug/m 3 can be measured ty sarpling larger vlumnes of air, butonly if the abrcrption efficiency of the particular systen is first deter-mrined. Tigf concentrations rmay be analyzed ty using sr aller gas samrples, alarger collection volume, or a suitable aliquot of the collected sam-ple.
1. UN Eomixn c and Social Council, rEM. "Draft Report on Effects of Sul-fur Corpoxunds on Soil, Groundwater, and Vegetation". Doc. ENV/IEB/wG.1/R.5. New York (28 June 1982).
2. "Pollution Engineering Practice Handbok'". Edited ty P.N. Cheremini-soff and R.A. Young. Ann Arbor Science Publishers, Ann Arbor, Micdi-gan (1976).
3. UN Econodmic and Social Council, B=, :Cooperative Programie for Mxii-toring and Evaluation of Lang-Range Transmission of Air Pollutants in
iro=pe (EMEP)". Doc. NV/IEB/R.12. Nbw York (5 August 1981).
4. U.S. Enviromuental Protection Agency . "Handbcok-Industrial Guide forAir Pollution Control". Document EPA-625/6-7S-004. Washington (June1978).
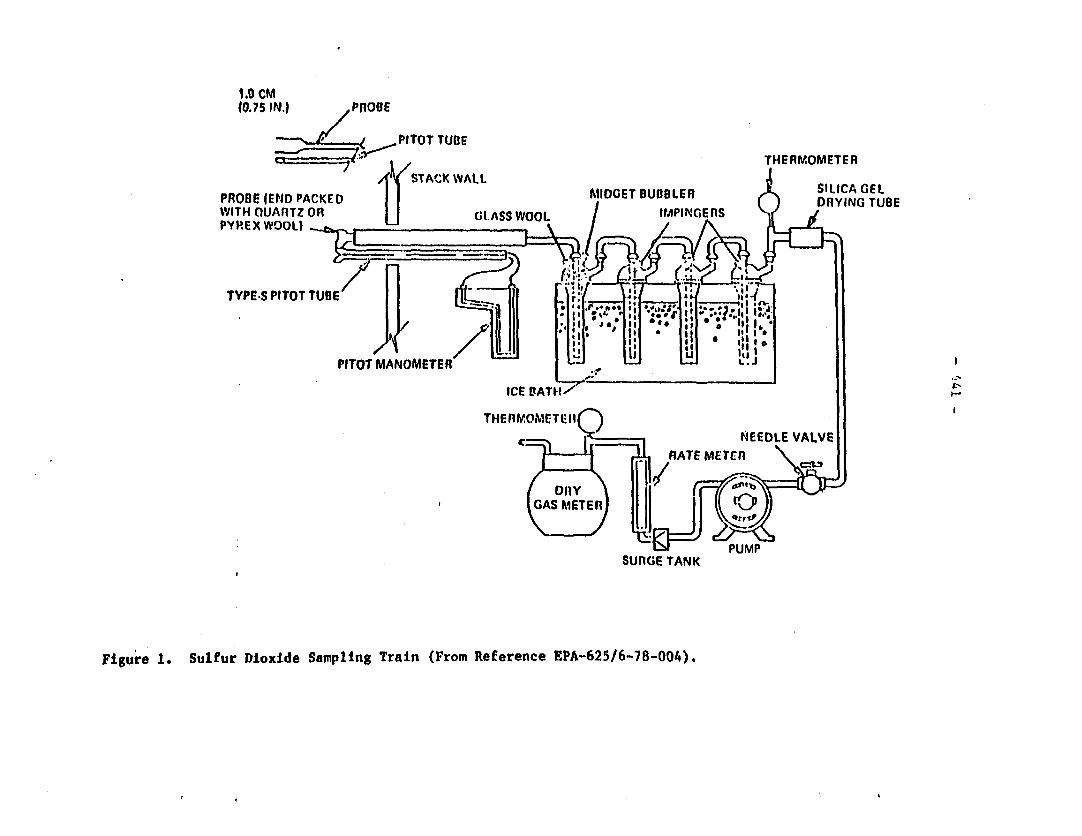
1.0 CM(0.75 IN.) PROBE
PITOT TUBE
THERMOMETERA 'STA'CK WALL A
PROBE {END PACKED l W1IDGET BUDBLER RSILICA GELWITH OUARTZ OR J GL.ASS WOOL ItlPINGE nS DI TPYPEX WOOL)
TYPE-S PITOT TUBE
PITOT MANOMETER
ICE OATH-- _
THEnMOMETElIl-~~~~~~ N EEDLE VALVE
GAS MERATE METn
PUMPSUnGE TANK
Figure 1. Sulfur Dioxide Sampling Train (From Reference EPA-625/6-78-004).
-- 4J'- -
THE WORLD BANK D~'ECEAR 1982
OFIEm' OF EVIRCMqL AFRS
SULFUR DI~CIDE SAMPLI AND ANALYSES
1. This dcurzent sulements an earlier Bank doc=ielnt, titled "Sul-fur Dioxide Emissions", by providing specific cetails on the collection andanalysis of sanples. Both documents should be reviewed and the guidelinesapplied as required in situations involving sulfur dioxide emissions, andrelated oxides.
2. When released to the atnxsphere, sulfur or its compourxs will re-act with the oxygen in the air to for. mainly sulfur dioxide. When exposedto moisture the dioxide can undergo the following reactions:
S02 + E20 12S03
SO2 + 1/202 - S03
SO3 + H20 E2 S04
3. TIW types of mcnitoring will e required in connectimi with in-dustrial operations: The first is stationary source or stack emissiontesting, to letermine e,ission concentrations at the source. The secondtype is arbient mcnitoring, Widch rmeasures the pollutant concentrations intle areas surrourylr a plant.
SMrTCNARY SOR MONITORIh
4. Stack sampling ports shoid be provided, and located at leasteight stack diameters "dowmstream" of any bends, constrictions, abatementequiprent, or other flow disturbances. If this is n,t possible then thesazmplirrj location should be at least two stack diameters "upstream" of thestack exit or other flow disturbance. Where these criteria cw=t be met astack extension -ay he required. Ports should be installed flush with theinterior stack wall, and extend outward frnn the exterior stack all forbeween 5 and 20 centimeters, unless additional length is needed forinstallation of gate valves or other appurtenances.
5. If the smu of the stack inside diameter plus one port length isless than 3 meters, tWD ports should be installed cn diameters, go degreesipart. If this sum is greater than 3 meters, then four ports should be in-stalled cn diameters 90 degrees apart.
- 437 -
technique is not effective. Oil and gas desul-furization is effected with catalytic hydrogena-tion to hydrogen sulfide and subsequent removalby any nurber of re=rval processes.
(b) Fuel comversion-any numier of processes whichconvert the entire feedtodc to a li*rter form;oil to gas, coal to liquid fuel, coal to gaswit]h subsequernt hydrogen sulfide removal by pro-cesses referred to abxve.
(c)- Process aodiftionsdand especially mrodificaticnof ccrstin techniques-in sane courtries sulfurIs efectively recovered and either recycled in thecperation or sold as a byproduct. flis situaticnarises in chemical wood-processing, pup and paper,nor-ferrcus smeltirg, foundries, oil refining andsulfuric acid pAtfacturing plants.
F llidied bed combstion with liz or limestoneinjection and recirculaton of L2Istion gasesoffers a significant re i of sulfur dioxideelssiasC. This process is new, but vendors arewilling to provide perf ne guaratees. As longas the purchaser re ies he will be cperatingmcre of a dhenmcal process unit rather than a con-ventiaial boiler, this can be an attractive possi-bility.
gd) Flue gas desulfurization-consists of processeswhich scrub sulfur dioxide from the flue gas intoa liqid. Scrubbing liquids can remwve the sulfurdioxide pereanerntly (non-regenerable processes suchas line-Limwstone slurry) or teaporarIly (regener-able processes such as magiesiwm slurry or sodium so-lution). generable syste release acentratedsulfur dioxide for further use or sale (as sulfur,sulfuric acid, etc.) and allcw the scnrbbing liquidto be recycled. Nonregenerable systens have enjoyedthe greatest level of o=r;rcial success. Regener-able systems are not as develcped camercially.
These systers are cumberscme and expensive, and thencnrqenerable systerrs require large azrnts of waterand create a sludge whose disposal requires carefulenvir n considerations and large land areas.
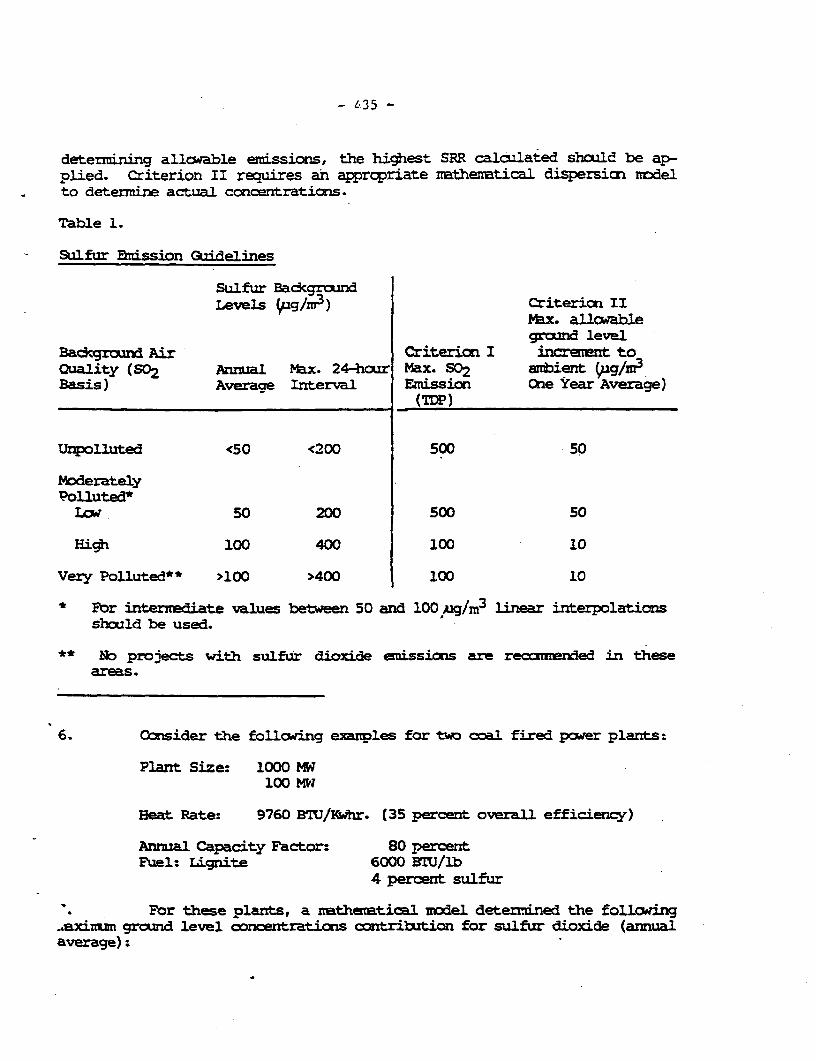
_ L35 -
determining allawable emissions, the highest SRR calculated shoIld be ap-plied. Criterion II reuires an aprcpriate matheratical. dispersimn rdelto determine actual concentrations.
Table 1.
SuLfur Rmission Guidelines
Sulfur BadcgrcundLevels (,Ug/; 3) Critericn II
Max. allcwablegrnd level
Badcground Air Criterion I irest toQuality (S°2 Annual Max. 24-boar Max. S02 awient 5ug/m3
Basis) Averace Interval Emission One Year Average)_ _ _ _ _ _ _ _ _ _ _ _ _ CIV~~~~~(T5P)
Unpolluted <50 <200 500 50
ModeratelyPolluted*
W so50 200 500 50
High 100 400 100 10
Very Polluted** >100 >400 100 10
- br interediate values between 50 and 100 ug/m3 linear interpolaticnsshould be used.
** N pro'ects with sulfur dioxide emissions are reIded in theseareas.
6. Consider the followsing e-azTples for t4n coal fired pcaer plants:
Plarrt Size: 1000 MW100 Ml
Beat Rate: 9760 B7U/Kihr. (35 percent overall efficiency)
Annual Capacity Factor: 80 percentFuel: Lignite 6000 BTU/lb
4 percent sulfur
'. For these plants, a ithettical model determined t'he following..exizu grcund level concentraticns xzrrtribution for sulfur dioxide (annualaverage):
- 43 -
10. Proceedings - "Seminar c. Control of Enissions fran the Non-FerrousMetallurgical Irdustries". tN Ecanic CarTnissian for Eurcpe. Held in1ubrovnik, 19-24 Nobvember 1973. Doc. .=/ENV/5. ULited Nations, wYark (1974).
11. U.S. Eivirrmwnta Protection Agency. "Perfornance Test Methods'.Doc. EPA 340/2-78-011. Washington, D. C. (1978).
- 431 -
- Nn-ferrous metal smelters - Substitutions offlash or electric furnaces ray be necessary tomeet guideline reqdureanerts.
17. The existing US national ambient air quality standards are givenbelow for c:xparison with the above figures.
- Primary - based mn health effects on humans
Annual arith. mean: 8 P gIM3
Max. 24-hr. - once yearly: 365 ,g/r3
- Secxtdary - based cn esnvirnmental effects
Annual arith. mean: 60 ug/m 3
Max. 24-hr. - once yearly: 260 pg/m 3
Max. 3-hr. - once yearly: 1300 ug/.m3
CONXTIROL 7ESHO1 Y
18. Technology to be applied for control of emissions must bedesigned for each individual case sin-ce, in nost instances, the system usedmt-st be capable of rezoving cr reducing more than one pollutant at the sametime.
19. Since S02 emissions are due principally to the content of sulfurand its oxarou nds in the ocal and oil used for fuel, the first measure tobe cDnsidered is the substitution of low sulfur fuels or natural gas. Anyincrease in fuel costs should be balanced against tŽe cost of treatinj thegaseols wastes.
20. Emissions may be reduced through process changes. In-plant meas-ures culd include changing raw materials, modifying process cperations, orrecovering and reusing materials otherwise being wasted thrwugh the stack.Raising the point of discharge above the ground, by increasing the stackheight, will reduce contaminant concentrations at ground level.
21. When measures sudc as those outlined above camnnt be applied,chemical or Thysical processes shxxld be utilized. Sulfur dioxide may bereroved by adsorption,- absorption, or a chemical process such as catalyticconversicn. In some of these processes, the SO2 can be removed and serveas the raw material for sulfuric acid production.
22. One of the proising methods for flue gas desulfurization utiliz-is the reaction of magnesi2um oxide with S°2 to form uagnesium sulfIte. lheagnesiLm sulfite solids are separatbd y centrifuging, dried to rerove the
moisture, and then calcined to regenerate the magnesium axide for recy-cling, and generate concentrated S02 to be used for sulfuric acid produc-ticn.
- 429 -
EISSION SAMPLI5 G AN MEASURJ7
11. Athough several units have been used in the past to express theoxncentrations of sulfur dioxide in the air, the unit in nost c=mn usetoday is in terms of weight per unit volume of air-m icrograms of S2 percubic mster of air (pg/mr). This unit should be used ty the Brik's staffin their reports dealing with this pollutant. Where analytical results areiven .in parts per milcino (,m) of S)2, the Lta can be converted toPg/m3 as follacws:
1 Epn S02 = 2620pg/m3
It is inportant to note that this conversin factor applies to SJ2 only,and will no t apply to any other sutance having a different nolecularweidht.
12. Because industrial operatios my involve freuerL cyclicchanges, the timing of testing or nrnitaring mist e prcperly crdinated.Individual polluting substances should be identified aid fluctuations ofpeak loadings determined in advance. Al the variabl associated with"curce testing should be considered so that the sanpling and analytical re-.jults will be representative of the entire source process.
13. Procedures for Uwe collection and analysis of both stationary andanbient source sanples, for *-etenrining sulfur dioxide levels, are contain-ed in the guideline titled "Sulfur Dioxide Sanplirg and Analyses", avail-ble iraL the Bank's Office of Environmental Affairs.
AOEPTALE STANRAE
.14. Standards are generally of to types - enssin and ambient.&-missiao standards apply to allowable crncentrations at the surce, sudh asstacks, ventilating systerm and oter discharge points. Aibient standardsapply to the allcable conentrations of a contaminrnt in the air surroud-ing an industrial area. or coumuity. Emission levels are necessary foridentification of specific pollution sources ai design of redial warks.Ambient levels are essential for deterntning possible environmental damagesand for avoiding adverse physical, health and other effects upon the sur-rounding area aid its ihabitas. The standards presented below represerntthe concentrations of S02 which rray he penritted in the area surroundingthe emissici source.
,- ,-
THE WORLD BANK APRIL 1984
OFFICE OF ENV ROUNTAL AEFAIRS
SULFUR DIOCIDE AMBIENT LEVLS
GUIDEINS
1. lMan-made emissions of sulfur dioxide originate fron a variety ofsources discharging to the atmosphere. The major source is from theccmbustion of fossil fuels such as coal and oil. Sawe 90 to 95 percent ofpollution-related sulfur oxide emissicns are in the form of sulfur diox-ide. Another source of sulfur dioxide is auto exhaust gases, although itaccounts for a relatively small portion of such discharges to the at-mosphere. This guideline will concern itself with stationary sources only,particularly those resulting fran ccibustion of fuels containing sulfur.
2. Sulfur dioxide oxidizes in the atmosphere to form sulfates, anarticulate form of sulfur conpounds. These conqponds may have adverse ef-
acts on human health and property, depending upon particle sizes, the par-_iculate forn of sulfur present, dispersion as affected by weather cxidit-icns, and the presence of other pollutants which ray magnify the effects.
SOURCES AND EFFi=S
3. Sulfur dioxide, has a sharp and chch ng odor, and is consideredto be one of the nst dangerous gases to man. It is one of several fornmin which sulfur circulates globally. The sulfur cycle also includeshydrogen sulfide gas, sulfuric acid aerosol, and several sulfate salts inaerosol form. For purposes of this discussion, an aerosol is defined as asuspension of liquid drcplets or solid particles in a gas.
4. The coicentration of populations into large rtetrzolitan areas,with the resulting energy needs and industrial activity, causes the emiss-icns to accumulate over these areas and disperse slowly. A US study, mEdein 1968, showed naticrwide distributicn of sulfur oxide eaission sources tobe as follws:
Fuel carbustion 73.5%Coal 60.5%Residual fuel oil 11.8%Distillate fuel oil 1.2%
Industrial Processes 22.0%Transportation 2.4%Coal Refuse 1.8%Solid Waste Disposal 0.3%
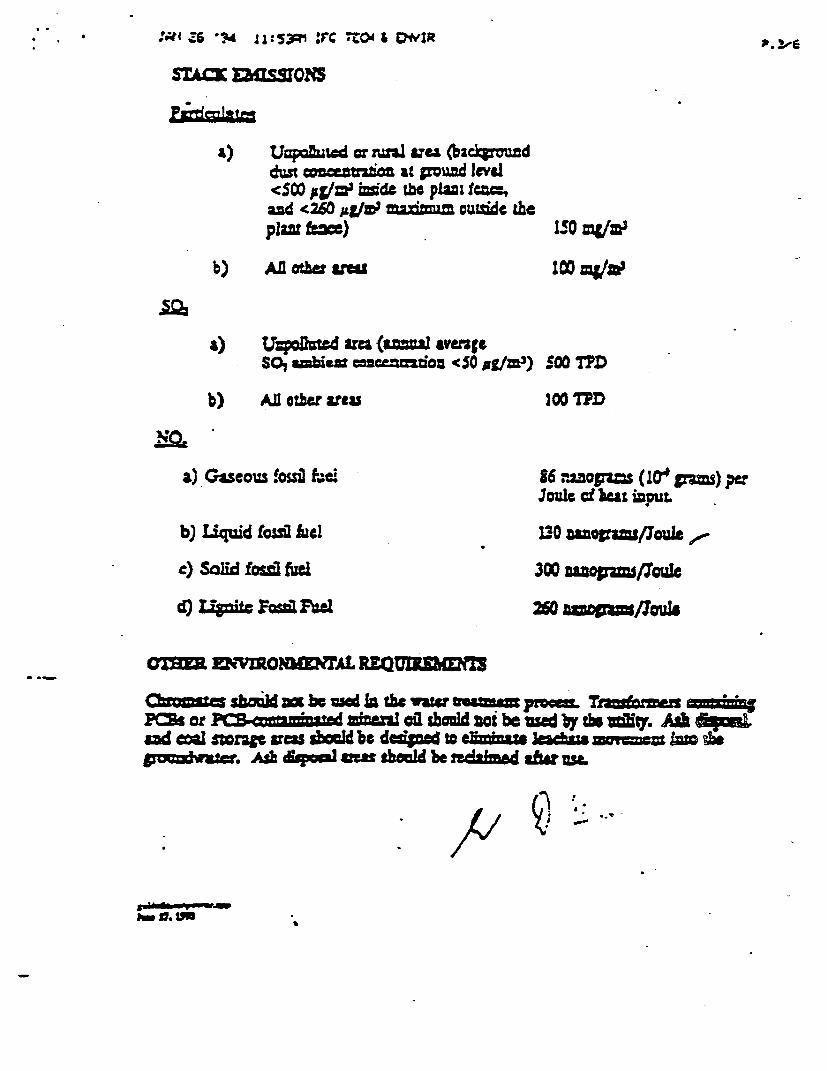
:T1 Z6 'M i:SW :C Z.0 & Owl
s?ac DGWQSS0
a) UqoAuwd arzua sue (backgwndd= cc=on at poud 1eva.cS00 pgfms ic4e the pIaz ftc:,ad <2260 ,sg/' rd=rn ouLudc the
Plw k=) ISO , 2 /
b) AJlotha 10 I0mg/w
a) TJ:oDtcd ara (*u1 averq.SOl smbiMn moncamaou <50 pg/m3) 500 TTD
b) All otcwraeu I00 I7D
a) G*scous !ossi f:C! 86 :asopws F (OX F=) perJoukC cL Uta i2puL
b) Liquid fouel 010 snag=70ou!.
c) Soaid fos. fuc 300 Los./70e
d) Upzitc h Fa 260 a=opi/ouls
a~1 DvOmwT REQDU'X
Cbms sbaWd=bc uwWIath bcw xmm uprPE r l oil odt be =ad t * £. Aand cWJ mr4arteas socid be de.4 to c^au kabzs p = cwm. AA dqiouI urn *hecd be ndairne afiw =Le
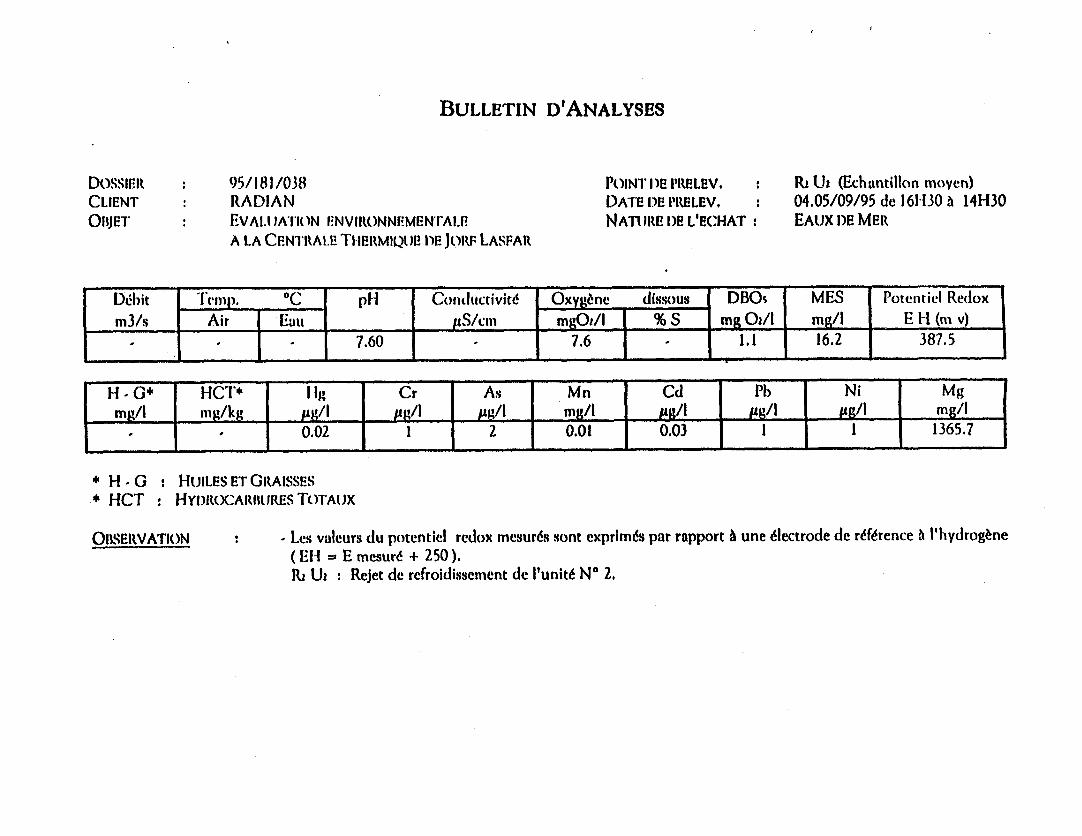
BULLETIN D'ANALYSES
DOSSIErit 95/181/038 POINT 1)2 IPtELEV. : Ri U (Echuntillon moyen)CLIENT RADIAN DATE D2E Pl(ELEV. 04.05/09/95 de 161130 . 14H30O11JET EVALWATIrN ENVIRONNEMENIAI.! NAnTitE )E L'E(HAT: EAX I)E MERA LA CFNT1IWALE THERMIQUP i)E JoitF LASFAR
Dehit Temp. pc pH Condicttivitd Oxyg6nc dissous DBOs MES Potentiel Redox_m3/xs Air Eau pS/Cm mgOi/I % S mg O/l mg/[ E H (ni v)
' - -S 7.60 7.6 . 1.1 16.2 387.5
H C* HCT* Fig Cr As Mn Cd Pb Ni Mgmg/l n g/kg ,g/I g/_ g/l rn/I Pg/I L g/i pg/l I mg/i. ^ 0.02 1 2 0.01 0.03 1 1 1365.7
* H - : HUILES ET GIUAISSES* HCT: HYI)VRXARIl(RjES ToTAIJX
OIBSEltVATION : Les valeurs du potentiel redox mcsurds sont exprimds par rapport A une electrode de r6f6rence t I'hydrogene(EH-= E mesurd + 250).Ri Uz: Rejet de refroidissement de 'unitn N° 2.
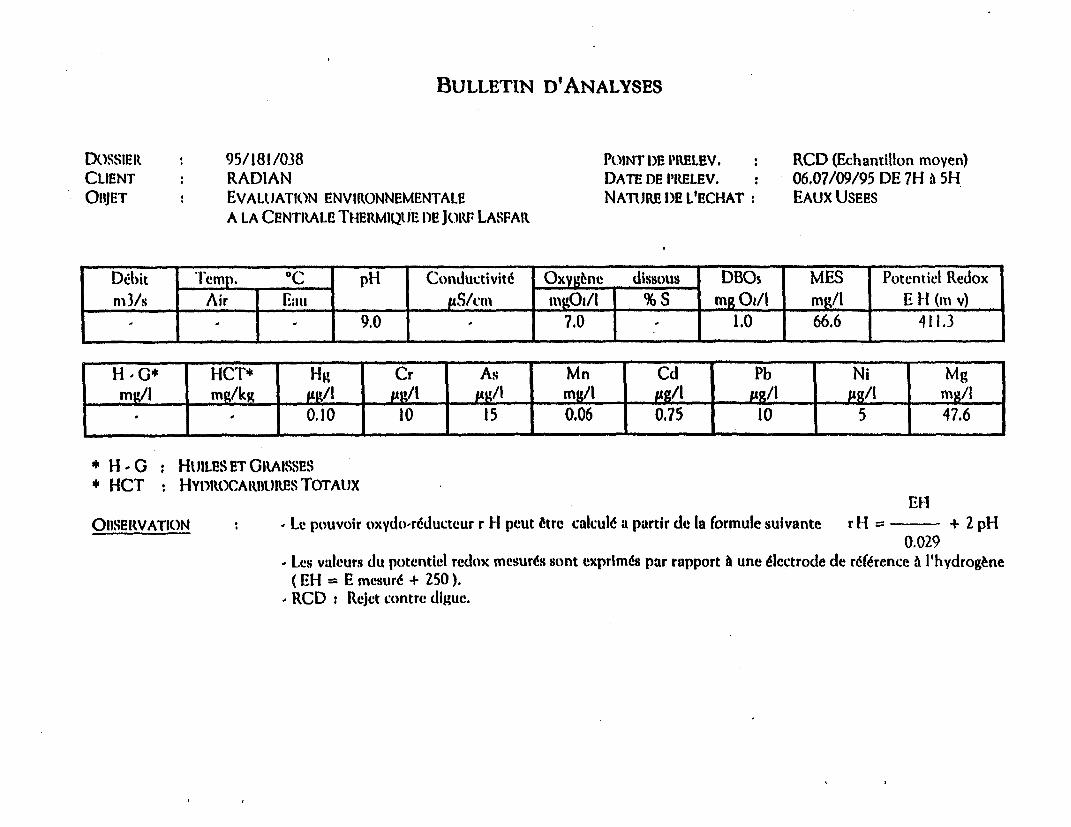
BULLETIN D'ANALYSES
DOsSIEt : 95/181/038 P0INT I)E I'RELEV. : RCD (Echantillon moyen)CLIENT RADIAN DATE DI! PRELEV. 06,07/09/95 DE 7H A 5HOBJET EVALtUATION ENVIRtONNEMENTALE NAnTUE D)E L'ECHAT: EAUX USEES
A LA CENTIRALE THERMIQUE li) JoItr LASFAR
Debit *I'emp. °C pH Conductivitd Oxyg6ne dissous DBOs MES Potentiel Redoxnmts- Air Eau, ps/cill tiiot/lI % s _mg O/l mE/l E It (m v)
_ ' ~I 9 9.0 7.0 1.0 66.6 411.3
H G* HCT* Hg Cr As Mn Cd Pb _ _mg/I m 1kg pu/l 'g/l1 vg/i mg/i O/ A Agl mg/r
. ' 0.10 10 15 0.06 0.75 10 5
* H G : HUILES ET GILAISSES* HCT : HYI)ROCARH1IUns TOTAUX
ElOBSERVATION L c pouvoir oxydo-rtducteur r H peut etre calcuI6 a partir de la formule suivante r H- - + 2 pH
0.029Les valeurs du potentiel redox mesurds sont exprimds par rapport A une diectrode de rdf6rence A I'hydrogene( EH = E mesur6 + 250).RCD: Rejet contre digue.
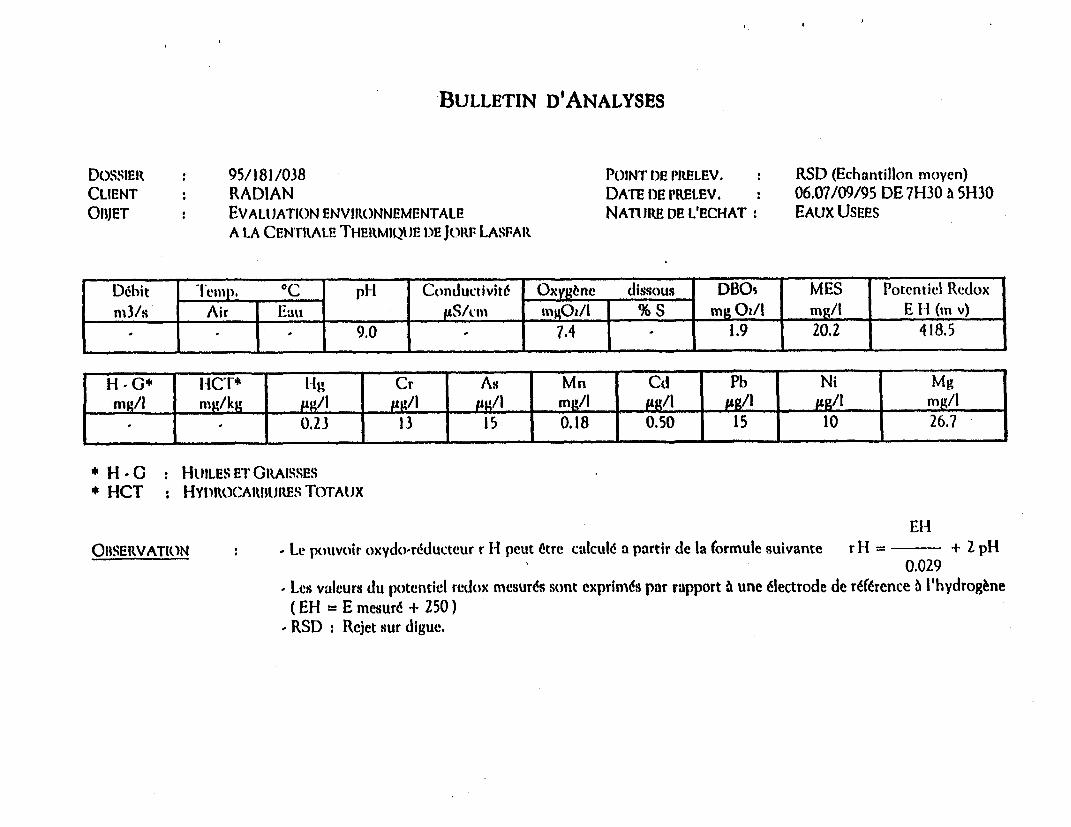
BULLETIN D'ANALYSES
DOSSIER 95/181/038 POINT I)E PRELEV. : RSD (Echantillon moyen)CLIENT RADIAN DATE D)E PRELEV. 06.07/09/95 DE 71130 i 51130O13JET EVALlATION ENVIIUONNEMENTALE NATu)RE DE L'ECHAT: EAUX USEES
A LA CENTRIAL! THEiMIQuE i)E Joitr LASFArR
DeCbit c1'emp. 0C pFI Conductivit6 Oxyg nc dissous DBOs MES Potentiel Redoxm3/s Air Eau _S/Cinl _i mOg/I % S my Oz/l mg/1 E H (n v)
.- - 9.0 7.4 1.9 20.2 418.5
H - G* FlC* flig Cr As Mn Cd Pb Ni Mgmg/i nmg/kg wg/1 '1/1 PE/1 mU/I A/I /1 /1 mv/I
. 0.23 13 15 0.18 0.50 15 10 26.7
* H - C : HJILES ET GILAISSES* HCT : HYPtOCAmmuRESTOTAuX
EliOBSERVATION - Le pouvoir oxydo-r6ducteur r H peut etre calculd a partir de la formule suivante r H = + Z pH
0.029, Lcs valcurs du potentiel red(ox mesurds sont exprims pat rapport A une clectrode de ref6rence 6 V'hydrogene
(EH = E mesurd + 250)RSD: Rejet sur diguc.

I I I

APPENDIX E
DRILLING DESCRIPTION

I II
t NOMBIkE DE PAGE DE-Texte - 03 -
* jOD DOSSIER I-lUDIE PAR: M. K0UMSK
;ij
* *I.~~~~~~~~~~~~B F~~. " . PRJE
R~~~P ! TA O
LOCUMF1 1 2DATE
Dft'ECTEUR DE VACREI
14.4A. &OU"HEN
' _~~~~~-
TAAGCOh7j: ASM4T CAZMANCA~ t ~/ a.Tn AAh R~. - - -- _.
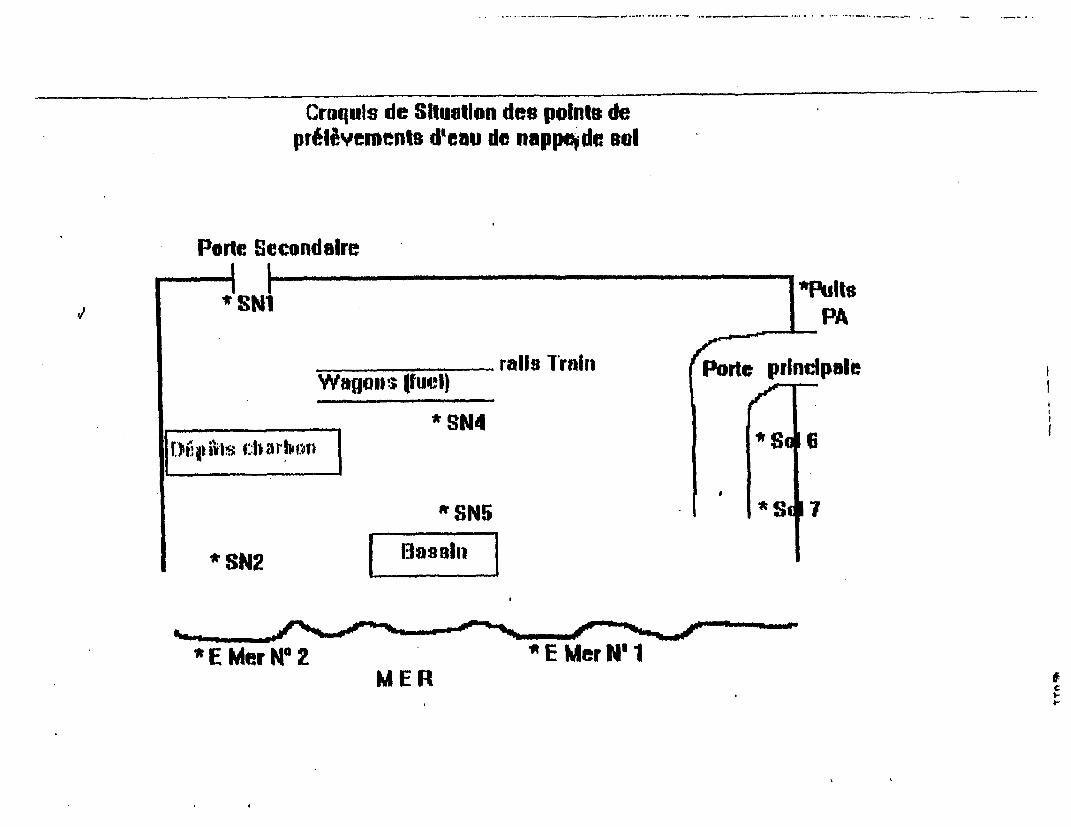
Croquls de Situetlon des poIntb deprIWlements d'eau de nappo,d sal
Porte Secondalre
SNI PA
Wagoui rails Urniin fPwrte prlndpaleWagolm. Ifue'l} r
*SN4
tSN *SI 17
*SN2
*E Met N' 2 E Mier N' IMERt
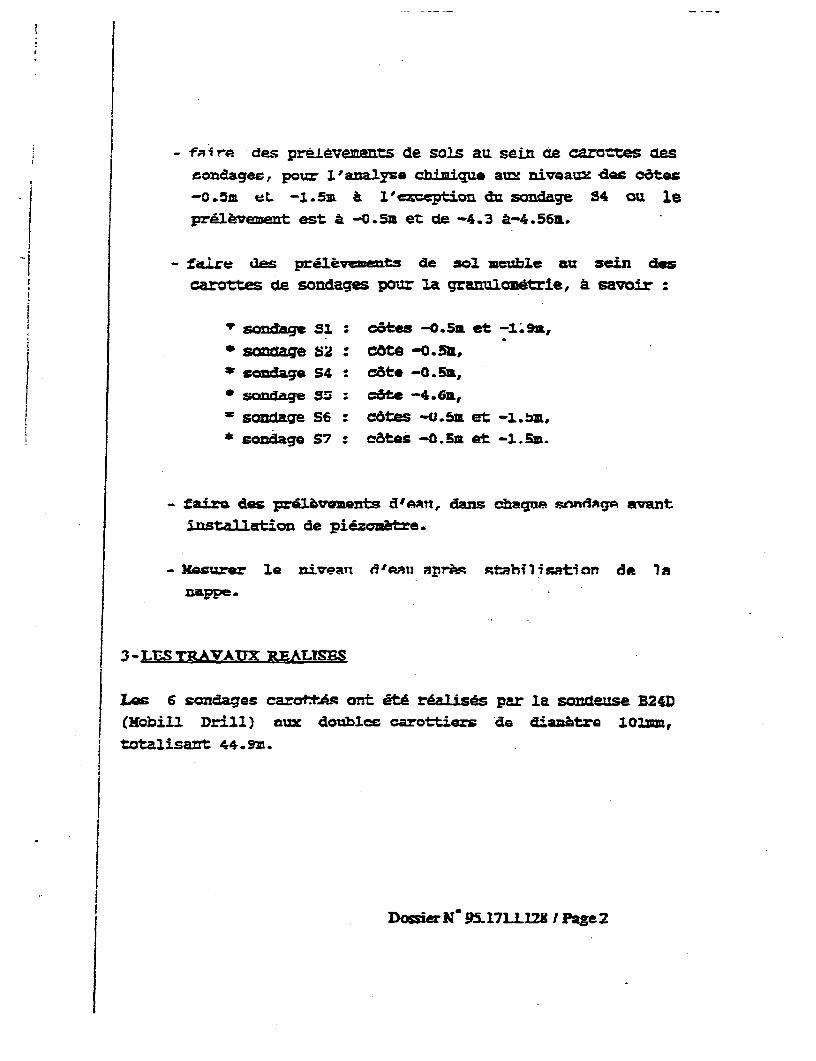
*, I _ fa i r des preievenmts de sols au sain de carotes des
condagee, pour 1 'analyze cbimiqu. a= nivoauz da6 06t*6
-O.Zm utL -1.53 & 1'c=cptimn dua sage 34 ou la
pra&veuent est A -0.5u et de -4.3 &-4.56a.
fre: des prAl6v=ewts de sol suble au scn des
carottes dce rondages pour la granul trie, savor
i sondags 51 : Ctes -0.s et -1.9,* sgai7e S2 : c8te -0.5,* soda S4 : c6t* -0.5M,
* sondage S5i: c6t -4.6m,
sondage S: c6tes -U.5m et -3.but,. condage S7 : e8tas -O.Sm at -l.Sa.
- fa3ir des pLvmnts d' Ip, dans taiws smdxgv avantS-staliatio de piezomnre.
- 31sursr le nivean dIprmn mprow stabiication de In
nappe f
3-LUSTRAVAUX REALTSBS
Lec 6 sondaqes carrl .< ant ct4 rdaIisds par la sodeuse B24D(Nobill Drill) aux doubleo carottiecs de aibtra lOzm,
totalisart 44 .9I.
{ ~~~~~~~~DosirN- 9117L = IA Page 2
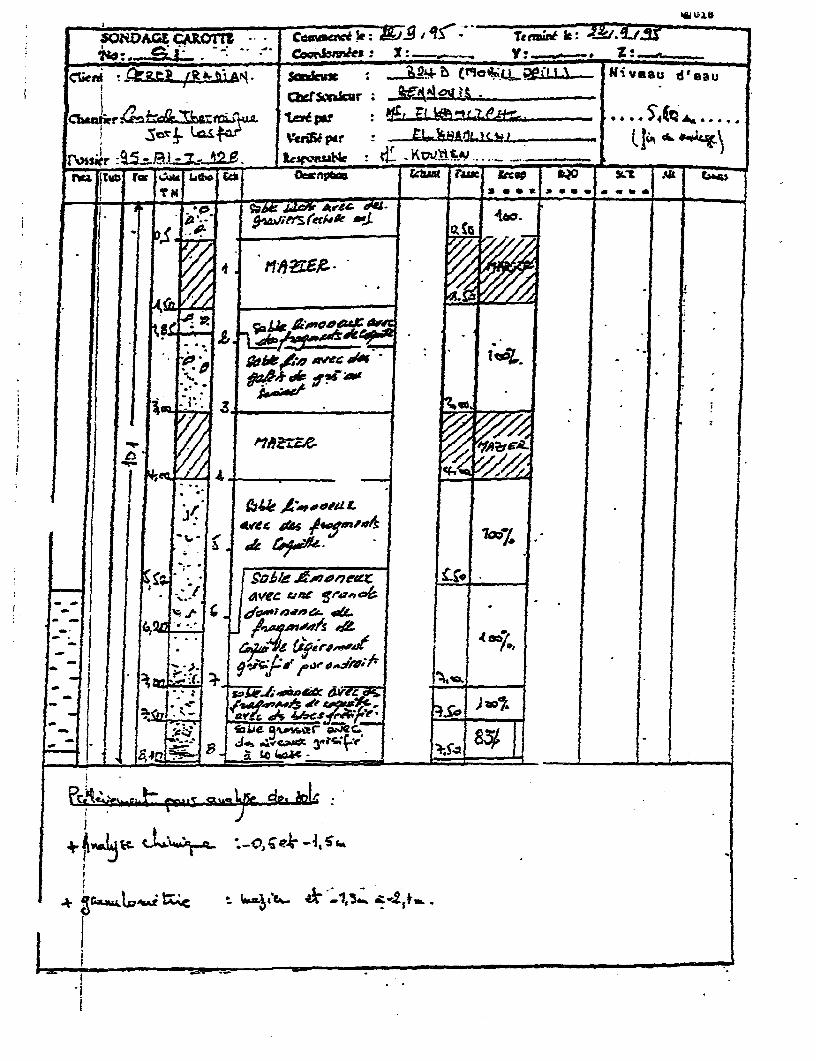
:~~~~~~- 7X: CokI#3 1:- . -. - :
A Qrt5Lie3cuapr : 34t tLeLL&.^,
fl>sc :vvJsL~J~ d45 $- VW'~ -s : _? _ ,,( _
-wr 95=el - 7w4e X Amt eL.F .. ; -A - _ a _
rw.a jK n e- CcX tcAa Fufcp QLt aR
'lIIfitSX0Lt4 g'& III l.*~~~~~T 3 *fu a.... e
___ . -;.. h av9e EQS.
.1 1 i~ i-fi-:
-Ii .6* .
777
-~~~~~~ML -,.! £6
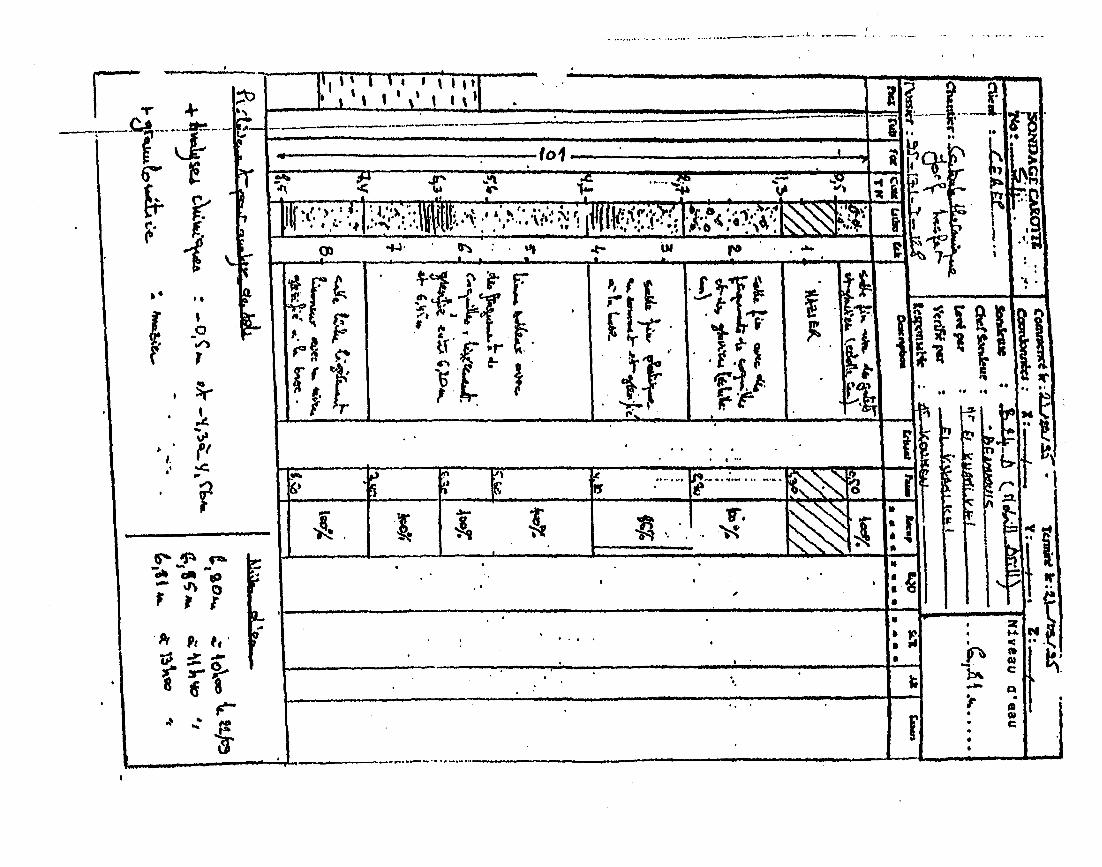
V _.'_-
q.. + [IF-t::s=.i.2.>~|
§~~~~~~~~~~~~~~~~~~~~~~~~~~~~~~~~~~~~~~~~~~~~~~~~~~~~~~~~~bI
4, 4 0 '
4. I 1*
t:Ie ls; \ | |'
.4 .4 *1~~~~~~.4
__i$ I I .
-l
0 lie v t I .. '- C ;-'=' S~~1 1 1K1W Cot 1 -'
---- -to
~' Ie Ce 9 .. _>0
l , .... I _ , - - _I
*.................................. 8
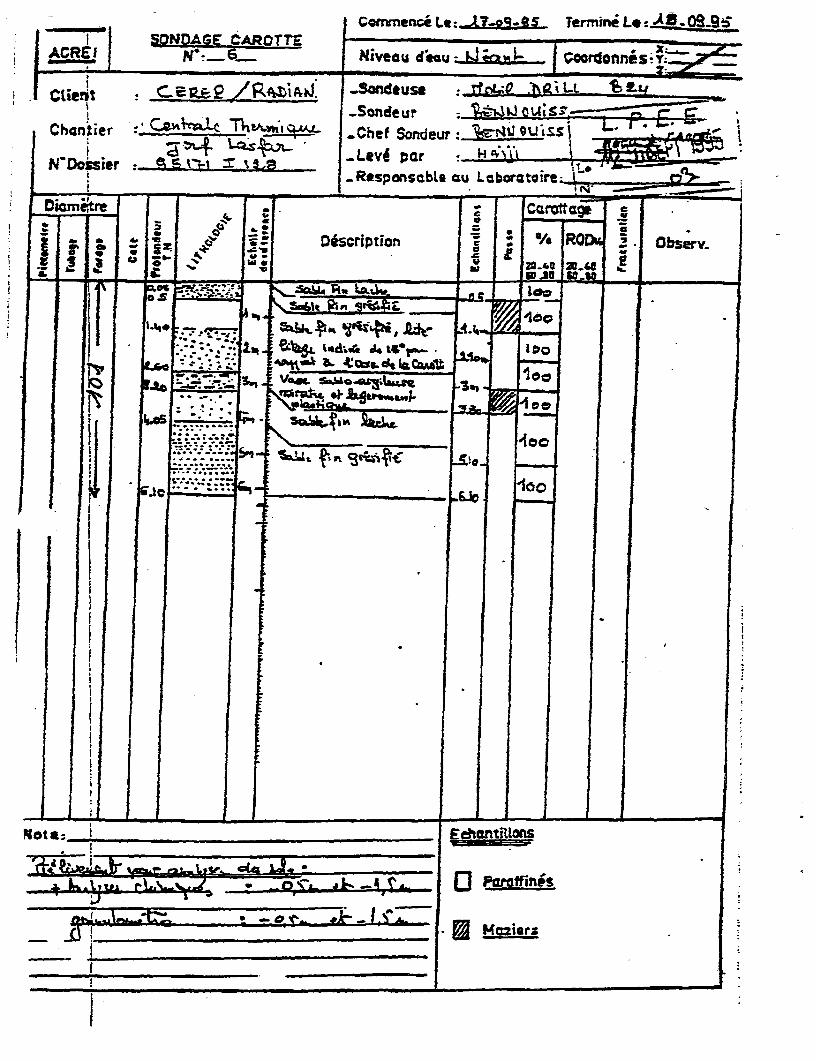
C_c.rnence Lt: lLZg3jS Termini Le:> . 9AOSI SONDAjjE CAROTTE
ACREI IY'-_6 Niveau d zAJ |Cooronn es .
CLie.t C /R4LJ. _SOfndeUSe T O LL E
...Sondeur ; __ _ _ _ _ __i_
Chantier : C c 1 Chef Sonddeur .
tCDossimr ~ ~ ~ -LvipaResponscbLa cLu Lborataire-
a 4. A * S oSj Discription |,. V. R O | Obsev }
>g 2.. L C o X 1 tI O
, I,.
Lam~~. _c.ON- L [email protected]
_ ..
It_

APPENDIX F
GRANULOTMETRIC ANALYSIS

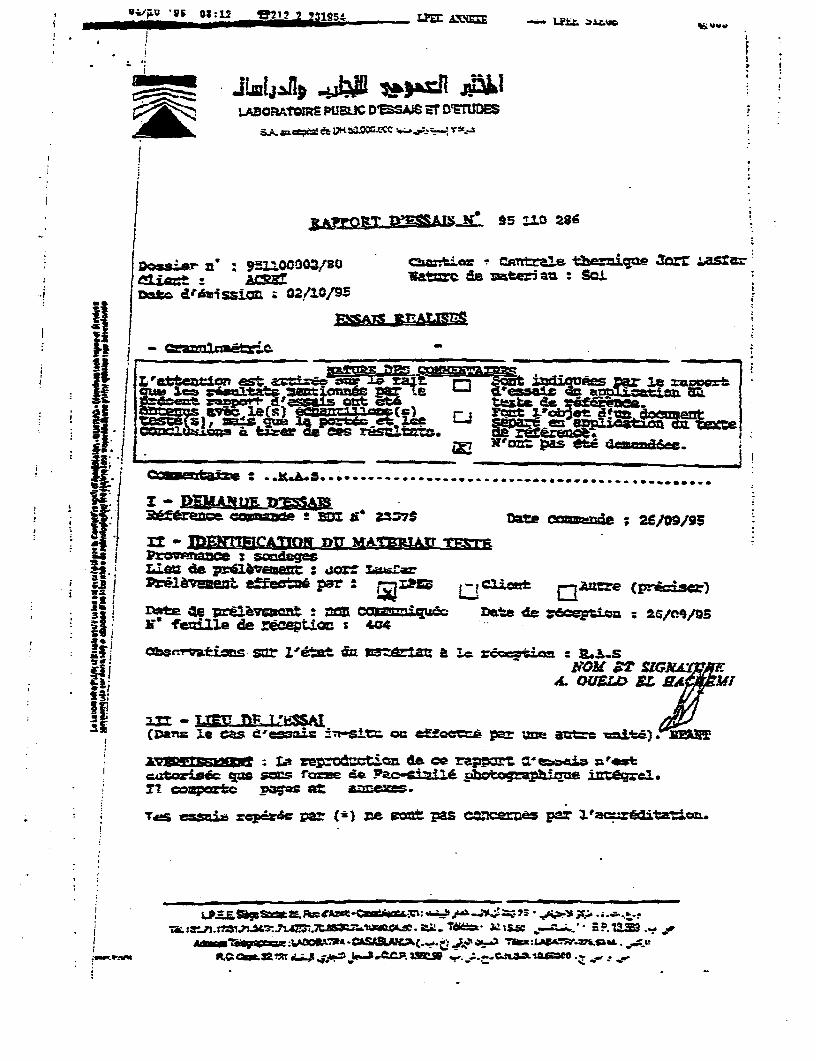
LAGORAtOCRW PUBU D'SSA1r -f 0%
;MSM M w t 95 al : 2861
_- I' -
Dosso no 9XtXfooo2su chr- or 1 acmlete%iae3 aa: * * k&>TA WtiC=: de umter5au : Scfi
.' , ~~do4iX=; co3A ..................
I -r ARI2J~ =
U: R±e £l 37S t wade x; 2e/O.9
- ID MEMCAMM DU Mn UP1A ai TR-TM
* / p??WS de :qoz Q e ( &*; z - ~D LL~S
CDa',st J. ca B'.i $7-s. o:37 1fae lme 2 £±c /9N|* Xl compaz*c pam act 4 p
* Ti erin*taeS r.pfefe par ~ :a Q;£ zs clwoit paZ A=:r acEriciave
,,f,1~~~72 d.LJ -' i.e.c.p xE sa. t..C?s.3O
to;~~~~~~~~~~~~~~~~~~~~o d^ 1OSfr SfG,. FA
wn~~~L w e oftrd:ct._en dp ce =app= * =otc
+ + ~Tes case-' rcp&r&-c P2t()= as scrn FrA Poanzot psY
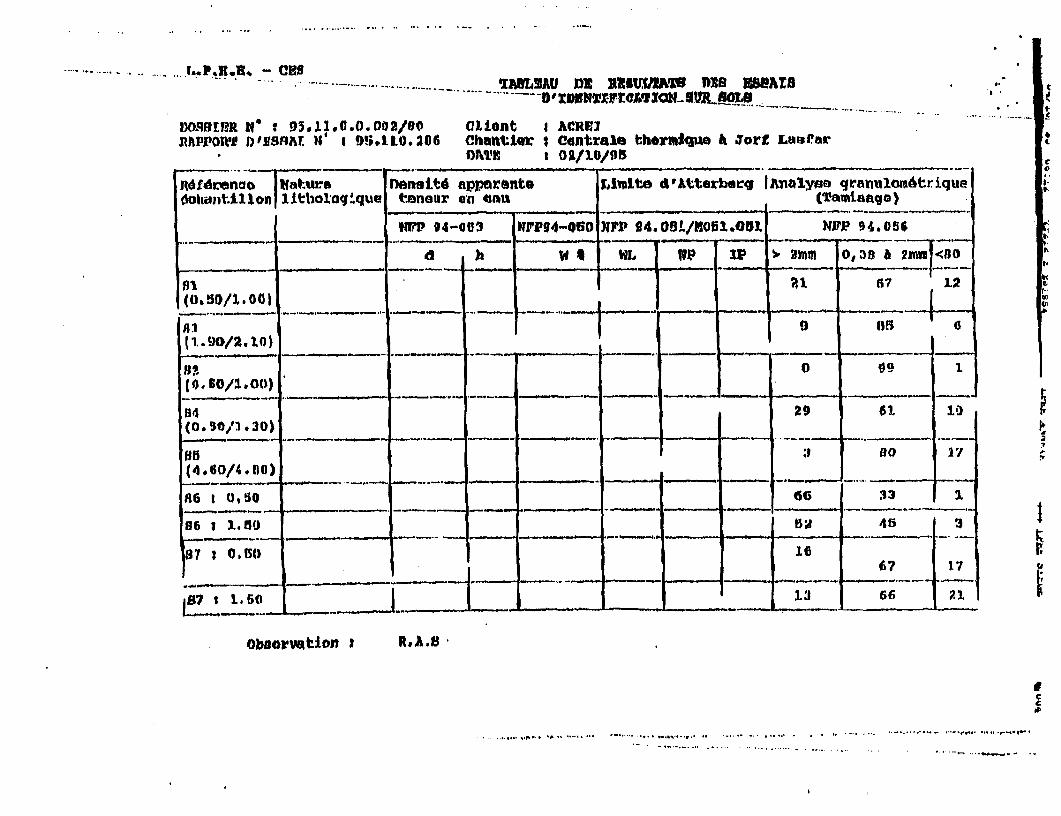
...... ~... ^P,!1J - OHS¶MMJLMAU D' RRIUVMW MBI S&Z~~~~~~~~~~~~~~ --. - - . -- - - - - - . .. . .. _ S!UUll cwfa B " t
D3OUBRk N' s 93511.0.0.002/00 Client J ACRUIflIIPPOnL' nD3ISfw. N' I 9'1L0.206 Chuanwter S Contrale tb*rmiqum IA Jorf Lamrar
ONTE Ia 0oaj10/9B ____________
R6td nao nnasrte I)Ai01 app3arants Livotte 4'Atterberg IMalyoe qralnuloamtriqueO ntiOdltloI 1Jthokog'que t.enear ene4i traitnqo)
tWP 94-003 R P94-Oi0 XFP 94.0BL/M05I.05L. )WP 94.056,,,_ ____ _ _e_-_ __ ,- - - -.. _ .- ._
d h w W "L VP W s, arn O," 3 2n a kI00
fll 1 Al 67 12(0.50/1.00i -
A.10 09 1.
54 29 6F(o 0.3/. 30)
(4.8/.00)........ ._, .. __ ..__. __ __ ,, :1 no ,
36 i 0,15( I 16
______ - - - I .7 -I-*___ _ 6717
7071 . 1 66 217
0baoivqtlion a .J.
cC
, . , ... ... , , .. .. - -- ........ . -.HP *v--~~~~~~~~~~~~~eD~
t~~~~~~~~.* ., ... ... ... .....
0*
o *¢J-| aa.4
0 -M~Ii
m t g q g XS I I I m~~~~~~~~~~~~~~~~~A A.
g f f i E I h iHos __ _____ _____ .. 1:1
g~~~~~~ -
1W = -- S
C .~~~~~~~0
u W IM11 | 1 1 1 NbG I 1 1 1S V~Oc
* ~~Tj~~ 2 2~~~gSJ Latean~ 121=P SZECE
uB~~~~~ 4= ssmia
1 -4 ~ I
aa f w mE _ i _ i .'f
=-= f=_t =X__
go& 40. D 6 0 SW 313 20 la~ am 315 WEX
_~~~. _ -I 5_ " _ __ _ .~~~~~__ ___ =___. __t- _ = __ -_
I L P
,j Y~~~~
V-1- in .dW _Gt ~- F=AALYSE 6ROIULOMEtQtJE -I I1~S :I_~1 _ - . * :_ I_[ _ =- .__________________R
7 L
.. e ,;~ ~ f. . .. .
X 4 @- m e _ 4 4 -
+-4 - _,, I s.- _ _=.
.. ,e- 1 1 _1~~~1_w J g =P_ -=
= _ 1._I I .
I _ ___ as , ,s t_
AMLYSE UWULUMETIQUE
HAR,
.Ifl~~~~~~~~~o
w~~~- - l'll nuul nmr
i w _ t. | H E EI i i:HM I4 .. 1= = :X--'1.S .2 1 t nAL qERd
B . 0 . 0 i 3 93 BE 3 S SE E I | g ED~~130ll|9lW, 4gl
1:- I C E1 S.°'"gEM~~~~~~~~~03
I c | I I W I I 1 1 X t1S1 l~~~~~~~~~~~~~~~ird
U311 HSJEl
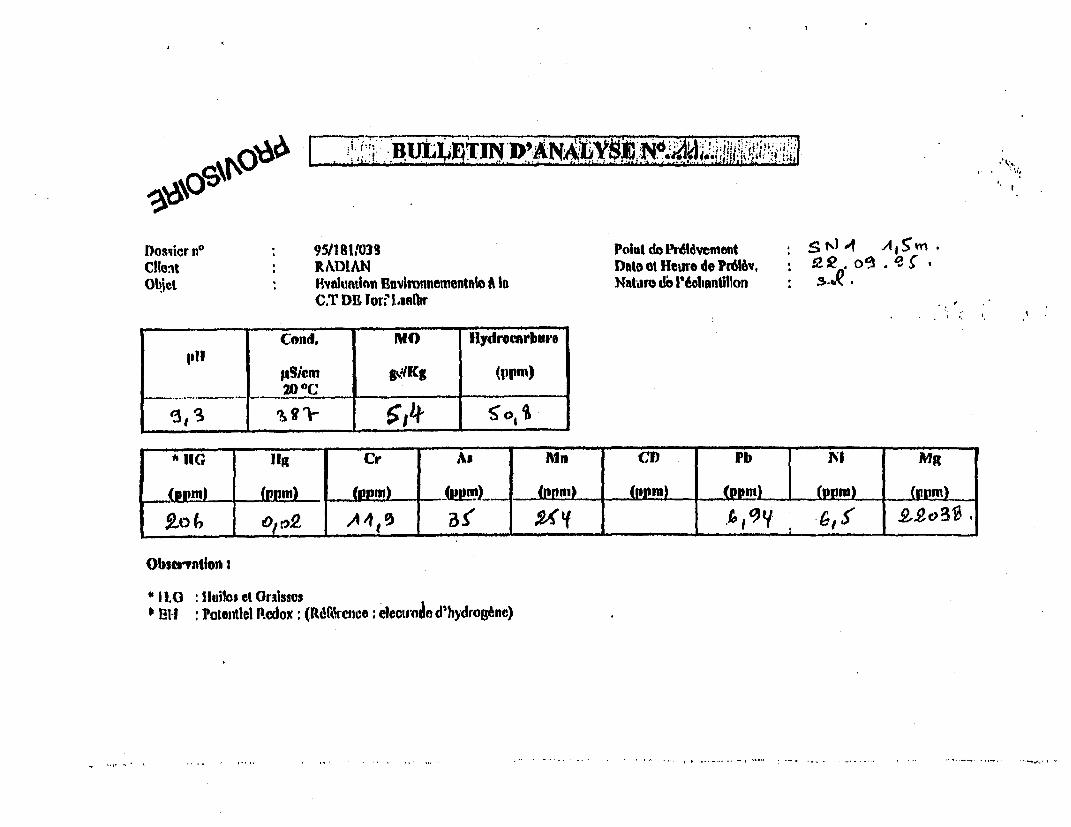
I)csqicrn0 ~95/181,1033 PoimI de 'r6t6veinent :S''V ,~hCiIeft RAMIAN Ditoet Heuro de?nP6v, e 0.'3
Objet . ~~~iWuluattkrn Eu4vlnrnncwentMko A In Nat-are db 1'6o1t,ntfllonCT DBI for1i'nIbr
(end, ~MO 0 lydrocsrbureo
~u~icm gq19KS (ppm) _ _ _ ~20 OC _ _ _ _ _ _ _ _ _
j *1G fig Cr As Mit C, Pb xi Mg
1-p (pL. (gem) L- -- m) - ppm)'
011.0 Ilio tOiss
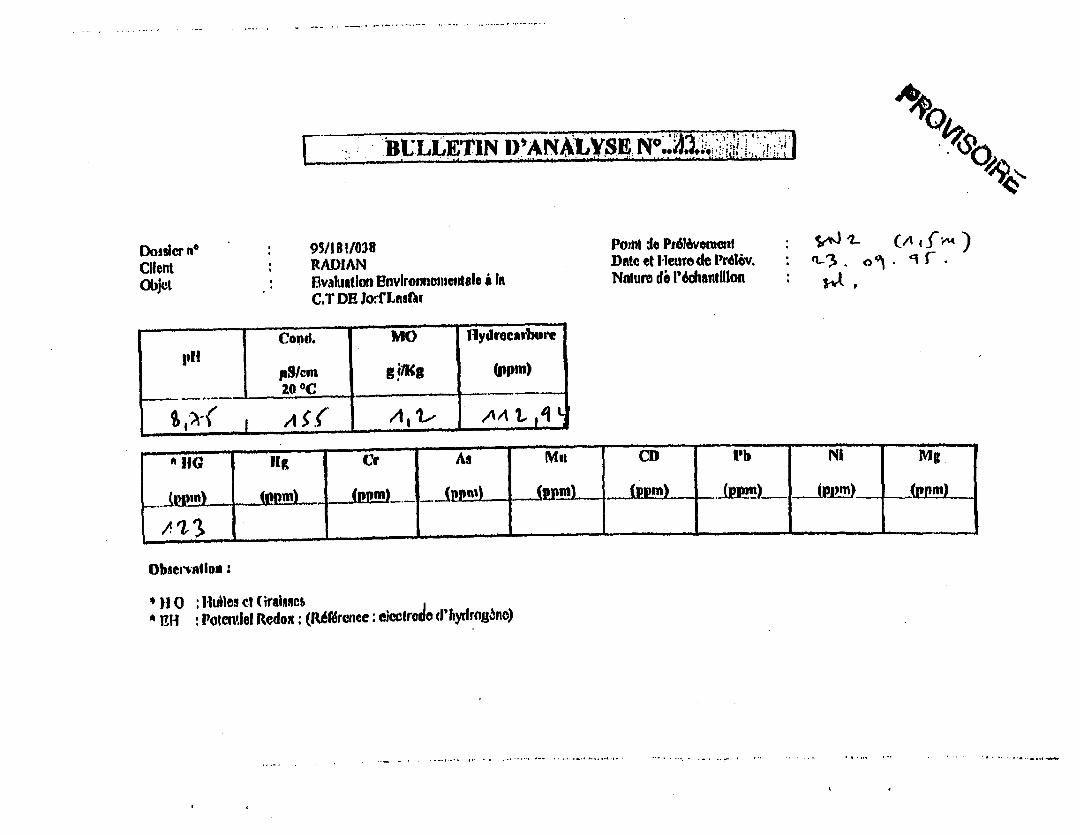
r: BELLETIN D'AN,YSE i il
Dossicr it' 95/1B1/038 Point de Pr6l6voenl: St V 2 44 ' )Client RADIAN DatcetlleuvedePrdl6ov. : .og qObjel * Evalutlion Environnotiuenteel i Int Nature di l'6chsnsillon :
C.T* DE 3o:ftLasIAr
Cond. MO Hydrocaibure
pSlcm B (ppm)20°C . ____ _
xfA 31,'t AA t 1'I
I jJ~ I 1g cr IAs MD Pb NI Mg.
. ' 3 |______ ______ _| ____ ______) _____ | t ) _ _ ______
Obserintloa:
' H : lluiles et (GraISCSE :, rotcn'iol Redox : (RMf6reLnc: eiccIroie d'hydroagn4)
... . ...,,,,, ,,,,. , ............................ ........ ,. ... , , * .. ... ..,.,....... ....................,.,,,... .
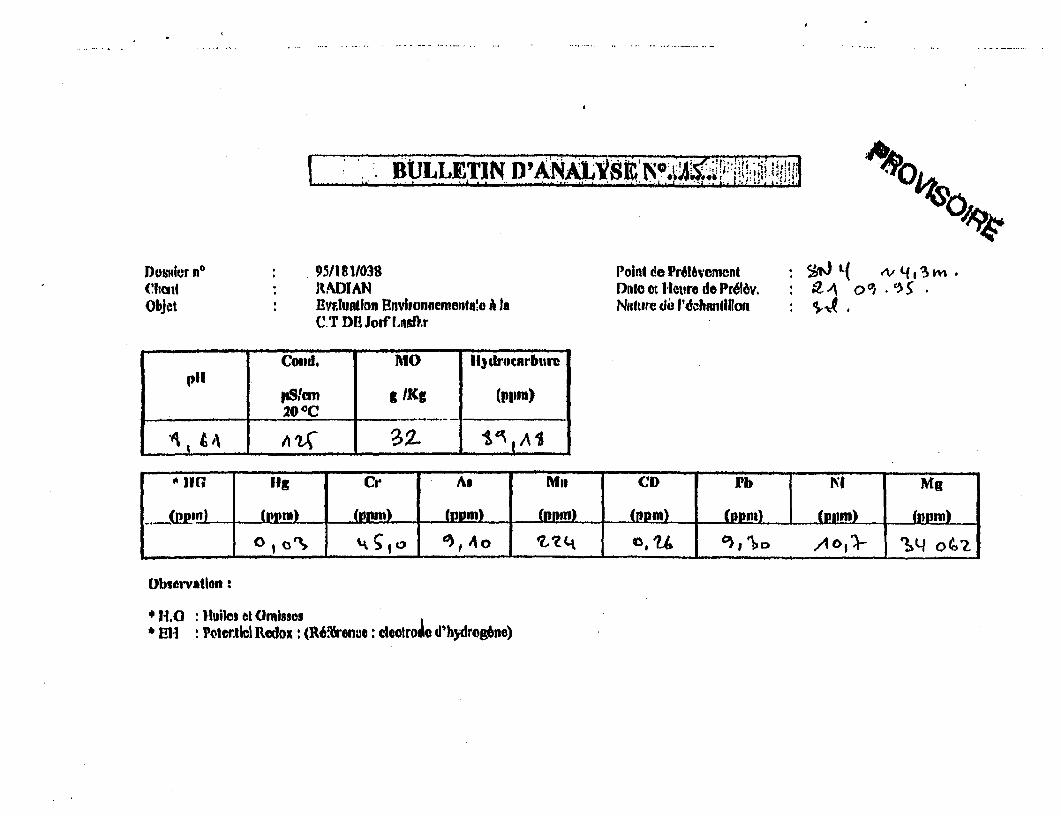
BULLETIN DYANOALVIN, ;!'w
D1oider n: 95/181/038 Point de PrOlvcment *V 4'm ?('all : N RADIAN DitootIleurodoPtirvd : MZA o° * 3SObjet EnTtuallDn amilonnemenla'e A Ia NiUtrCe I'dohahillon :
C.T DP, Jotf I,ms11r
Couid, ,-. o Ut)droarbureP1)1
jgS'uin £ lKg (p1"u)20 QC
'A HIG hIg Cr As Nl CD Pb Ni Mg
. Xm) {(Rpm (opm) lPpm) (nnm (Rn) pm) (Pllm)_ (Rpm)
Observation:
* 110 iluilos at Ornissos* E[ : PotertllC Redox: (RiU enue: cleolroio d'hydrogmne)
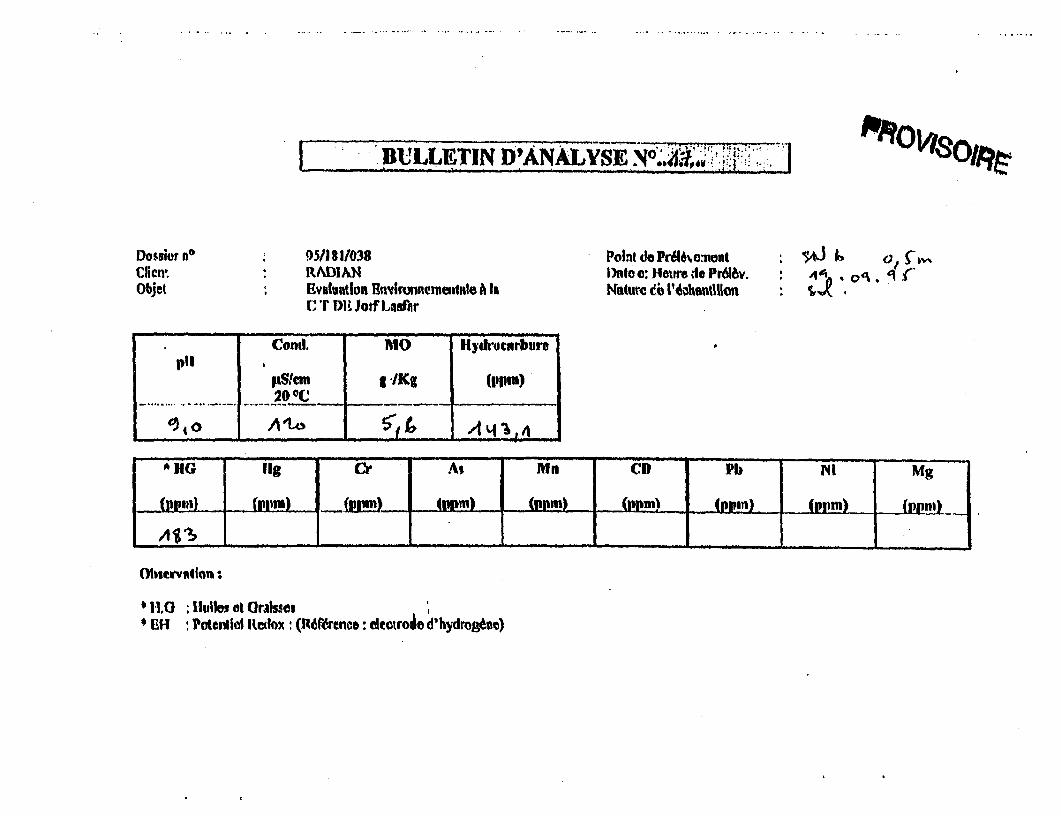
| _BU'LLETIN D'ANAIJYSE NO4. : /O4s
Dossier n 9511:1/038 Pont do Pril4a-neat ;Client R/ADIAN Iatloo : Heatire dPrilft. : ' * ,qObjet Evuluntlon Environnemnenile A Ill Nt(urc I'dohanio :
tU r D1' JotfI,LfiAr
Conti, MO HIydrocarbure
PSI Ce g IKg (I|pm)20 'C
9 4 o AtA X Li "4q 4
01 HG fg j At 1W biMAu _0' Mn Cll - ,__M
{DrZ) | 1 1ll | ppm Ir" .J|... .JtppL(pn~) {p"n |(rrrn)
Obsurvallo{n;
1l.O : lulvls at Oraisses* El- : Potential I&culox : (nRf; renco: eIeotroJe d'hydrogpno)
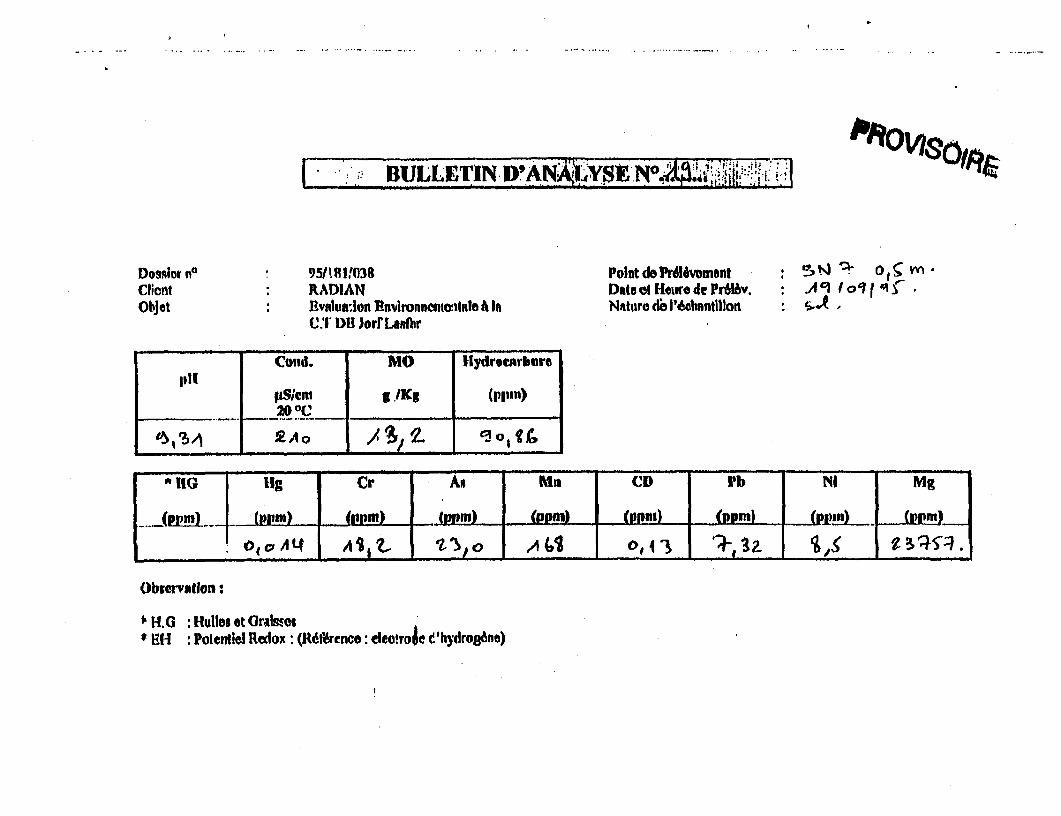
BULLETIN. D'A. A L$ 0m '~
Dossiior n0 95/!8111103 Point de Prdlivoment : t . m °Clien t RADIAN Date of Hoewr de Pi6l6v. : A'i fowlObjet Evalue:lon EnvinmnnD ltontale A la Naturtte d I'66nntillont : s
C.T1' 1 JorrLAs1br
Coind. MO llydro.nrIbre
pS;cm g 1Kg (Ii,ng)20 'C ________ _
(51s'l 2Ao el _______
^uG Gg Cr As MO CD lib Ni 1 Mg
OolALt Z5 IV!,o _ ___ __,34
Obgervagtion:
' H-.0 : Huilmes et Orals-sgtElI : PotentIel Redox: (Rltrenco: leo!rode c'hydrogsne)
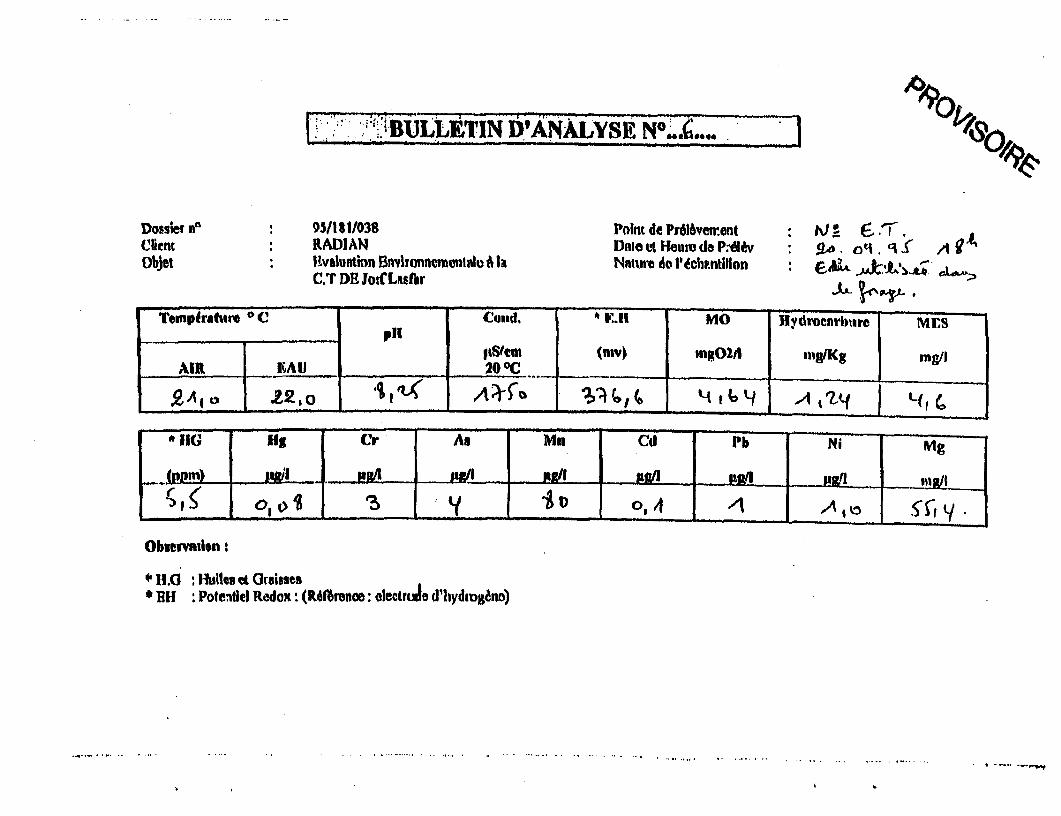
|: :. iLLEiTIN WANALYENodY ,Co,
DosWer n0 95/181/038 Point de PrOIvenent : J IJ ,Clent RADIAN Dni el Heut da RPWv : 2c. .q S A Objei 1: valuntaio BnYlTonncmentale la Natur. de 1'chr.ntillon : E 4. .
C.T DE Iotflasbr
Temnpirshrer °C' , Cend. MO Bydroecrbmerc | MIES
_SVem (nwv mng02A1 mn#gKg mg/IAlIt KAI 20 QC
R,A 2, t AITO -;- °.!o 4 9 __tYt
I* G 11a Cr As Mn | C Pb Mg
_ _ _ _ _ _ _1 3 - _ _ _A I ____a .l j S o
1 l.0 Mie eut01 d Orisses* RH : Pole:llel Redox : (Rdf6reun: olectrale I'bIydaDgdno)
. ...... ... ....
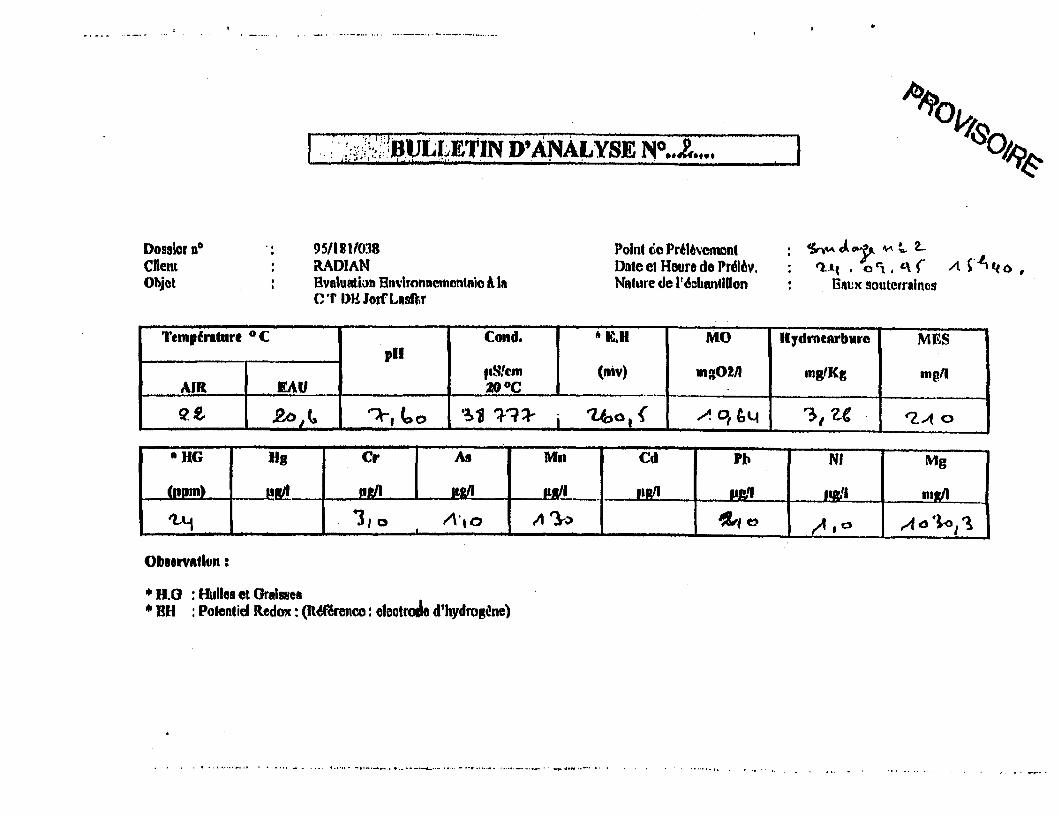
I BULLETIN D'ANALYSE NO.~&,.
Dossier e 95/181/038 Point l PrAl6vemrnt : 5n-Ae A ' 4
Clent RADIAN Dateel Houre do Pr6Av. e) * oc', . A l t6Objet . : valuation Invironnementaio A la Nnture de l'6ahandllon B sux soutcrrainrs
(r DV, Jo' Lwe*tr
Tempnrature C Cond. B IfCI MO Hydraearbura MES
104t1m (i)m-.0211 1lngfKg gAMI I ) 20 C _ _
Q t >,6 '}, Go 39 T?> j ~~~~~~~~,A , ( , 43, tf ij
*HG Nig Cr As Mn Cd P 1 Ni Mg
("Pm) "i pg11 11t/ JI . PR/j g/I 14 lj n___ _
tLj A,o A2 Io 1 A , A a 115'
Olisoryatlun:
* H.0 : Mlles et Oralte.* R!H : Potentid Redox : (RdtfArenco: elaotrals d'hydmgne)
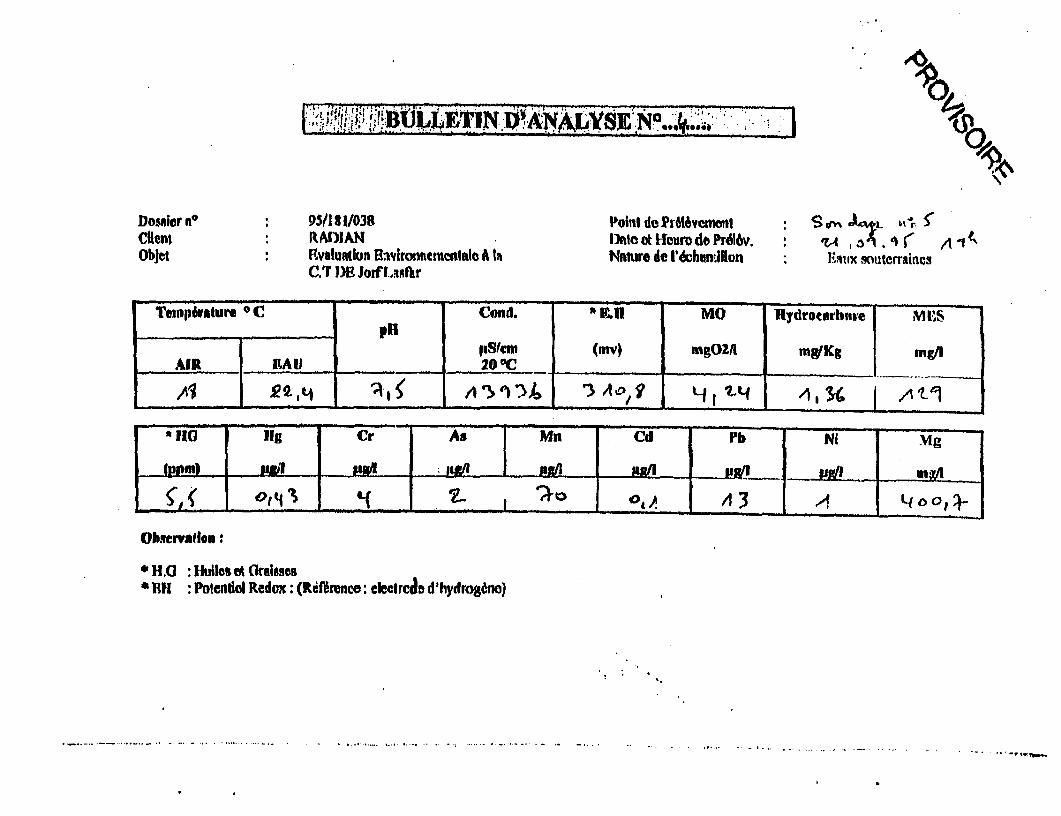
DosRior e 95/181l/038 Poitil do Pi66v~enmin S TClient ~~~~RADIAN Dnltcet Heuro do Prdl6v. : 4 ~.1 4 ( A
Objet [.ValumbIn Bakvironnetunatlat A tm Nalure de I'hkonlIIvo itnix souterratinesC.7I DEB JorfELislkr
TemIp6rafure C ComE. EUMO Ilydroeerhurie im 1S
Itstcm (WV) mgOZA1 mgKg Mg/iAIR MDI1_AlU__ 20O~C ____
[IG I jg Cr As mu JCd rb N 1 Mg
olmen'aleon:
*RH :PotenditolRedwcx: (3effznco: elect rcJe d'hiydrog6no)
J-itBa464Vq.U> CRLMOP' e z3 'rA:: of rrit,z &-s
_ _ _ _ _ _ _ _ _ _ it_| _ _ _ r_ _ _1 T (c ). i __ _ _ _~%~I4? .4 __R. t - --- a
t - Xt. | HCh &,5 | ~~~~~431L | 63 ju |lf 7
-I .. .. _-.--*O-_.---- - . 1 -.-. .- -.-.--- .--- * .- .- ...
~~~~~~~~~~~~~~I _____________ ___ ______________
R { !t § A41kiS 4 6 .,#19 |St |tt' | FU4|
I~~ I I1_ gt14k84h 4o <4 14)hY 45,S
e. _.. _._ r -n AsA

| .,.B,ULL LETTIN',S%>
Ebi : VfOUS 81101"Reme'e i la Ni urde 1I a ,-C.T DU Jort lAd)r
Cold. MOIIr ela ure
204C~~~~~~~~~~~~~~~~~~~~~~~~~~~~~~~~~~~~~~~~~~~~~~~~~~~~~~~~~~~~~~~~~~~~0
.~ ~ RDA .so~ereorIy , .L .~ .__
, ̂ - Cmii, MO t^t)I'crb I
_ - 1- ---- -- -- -*m)
110 liHg Cr As M CD j l N1 Mg
.(Jem A LLm) (fl Lm ( { ) (s(a ! (suN.)o Oji9'\ 1 j, Li u ' 3o4z
Obueivwtlan i
'1H.0 : tui1obs at O(imlsc* 1H : Poteril Redox: (R6M.:oe : deotrood'hydrogbno)
I~~ I
BULLETIN D'AN4V No:ij,xOvs,,?l
Dossiere * 95/t81,03S Polstd9ol#vlnt : v oW SeClient : RADIAN D)deelH.urodePrU. : .9 folf f .Objet RvmluwlouDsvIwnmsienso l& I NAItuse l'ntIbn : -
C:r DR JorrLA.br
Centd. MO Hydr.wlmrop'1
MD °C g Kg .
t*sK i~~Ao '^}t9 ;.,.
IIG __Hg Cr As M CD NI Mg
_ _ ~~~~~~~~~~~~~(PPFi (RX {pm) W-PM} pll)r (@P.m)oAAqL AP} L 13L .L Anl JFE3L fA r?
ObmvatIn: -
FLO : Huiles et OraksesR eH : Potenlel Redox: (W*cnco: dootro4 d'hydroeAao)
0.
r : :BEL.L...N D 'ANAL $I ,No"'6 .�. j:: ;;,ff,tjt. l4'v
Dosdael 95/l81I038 PoistisPr6wovena : Stl CAtf4) P
alent R ADIAN DateetilcurodaPrdv. : E3. q. 5 r.Ob)et : ivauatlon Bnvkonnwoe,tslo i I Nature di rPWI.aUlo :
C.T DIE JofrLautkr
0C
--a g r Mu ri .4
(PefIml 11LML fm:
H O : H0i3 el (irsihetR H : rlentd Redox: (Rd.Qrence: e roJe Whydrogaur)
pK~~~~~~~~~~~~~~~~~~~~~~~~~~~~~~~~~~~~~~~~~~~~~~~~~~~~~~~i,pS/cm g~~~/ICg (ppm)~~20 C _________ __ ___________
I~~~~~~~~~~~~~~*@~ AAt~~*~~*-@|0 ^~.1 ~@*-'.-I--- *-_In
| IBIrBULLETIN D'ANALY91.NEdl';"',>',:i.
Dosser n° 95:/S11/038 Polnt dePrg6,tbeo,mt : S4i o fClent RADIAN le : H^A, de P . AObjelt: IRVaIattIom Rnvifoeltmtwalle A In N{klura io l'nDaldon : Wt fi .
C '1 DLE Jotf Ladbr
Conil. MO By*ocnrvunr
PSICM g .Kg (FPO)20. '
S 6 o ~A1~ AI,'
| *HC | g 1A As Mu | CD 1 b | g l
____ ____ -(r1m) | pm)1 (Ppm) (Ppm) I (Ppm l
ObASiSl:
* H.O : IluNes iOarlsics,
* Elf : PotenieA Redox d(R6fCrenco deoiroao d'hydroB6o)
0,0.

a It

APPENDIX H
GROUNDWATER ANALYSIS
'I

b
Dossiern : 95/1811(038 Point Pr6lfveaml : -A J 4.tClen : %DIAN Dat HaRouhIrdtAvk : Q4a . ti,'1( A'Io,Objet Evaluation Rnuironnementa1o IA Nature do 1'6ohmtiltn Baix soutetrtines
cT:r DE Joif LmeOtr
Temnbtre °C Cond. 'I;H No Hydrrbure MRSpIE
ItS.em (nuv) X02A4 m:fg msIAIRt EAU 'I}C .
~~J2~~L ___.__ ?4Th AOti .~Z - -^ RG lhg Cr As Mn Cd I Pb Ni Mg
t1~ _1 . 1'V, ,|o [ -o, __ _ .I . A/e° o
H.0 : Miulo ot Orales* RH : Poeati Radwc : (It'hronco: eldotrjo d'hydrognbo)
Do a0 b nn 93/1 t1/038 Poit de PrOvers.tn : I'- . ,lient : RADIIAN DatoetHoue deP.I : 90 9A Af
Ob)eI : Ivbs Biw1vcnnoiatAa Natuis do 'Eohutlon : ,jJ. d_,CT DE lorttLafhl rta S
1'mpr.u ° e0 CCwid. A t MlO Hydwureai1ou MESPK
,aSI e (uiv) .M n#Xg agnAMl_ EAU 200C E I
iAz o s2,o t . AS 3)SC4/ ; t 16 Li 'A 9
G fig Cr M Cd b Ni Mg
Sl _ __ L_ _ __ _ __ _ __ _ A ._ _ ito,d____ FJy
Ob tI. e .r...
* H.O :THlaut0d rakac* pH : PoenId Redado: (Rtoe: okeclJo d'hydragAM)
... ....... ~~~~~~~~~~~~~~~~~~~~~~~~~~~~~~~
Dosi&W 5/ 1/038 Point de PrMymvmet : u event RADIAN Dg)aateetfriwde Prdlv. : Ai
Objet Fi~~valuatklo hvlwronacsncniale A lit Natur de Idcbuitilon Eaux miuciminesC.7 DRI Jortf0iNfir
Teampkature ~C Cmi., EILH MO Ilydrioadmire MCS
P81Cm (mw~ I * AMBKAIR IRAt 20 OC ______
.Al ____ AI ~ AO,? 4j Lf 1V4 A j
n 1 f Cr As jMn C [_____ Mg
N H :Potenld ReWax: (Rdigmae: cecewrJe d'hydrog6ne)
"*1~~~~~~~~~~~~~~~~~~~~~~~~~~~~~
I,~ ~ ~ ~ ~~rv
z@~~~~~wt~~~~~~
, .. .~~~~~~~~~
r$s~~~
Dosior° : 95lAU38 o;nilPrO*teen e* . -. -. ,........... ....,F

It

APPENDIX I
THBERMAL DISCHARGE ANALYSIS

:OR" BPORA VI ONCALCULATION SHEETCALC NO._
IGNATURF DATE ° q 5 &CHECKED DLAT -
R _ JOB NO____
UBJECT Cc e.Se. Thl-to D SHEET_ OF iSHEETS
Ch,erie) c- L. 1-1 ; .c
C- Lc-. rv -o.-v-icc-s or 4"~ cyv7 :; 3e
-Di--P +;_zo c r ;dt ia(
ln 5 e-it VoJsl c7cvt C L 6 O.g /Sschcctt;-c~~~ d;sQhcl;rguo3
- 1l o cqcs JA<cm a \
10-88-30702
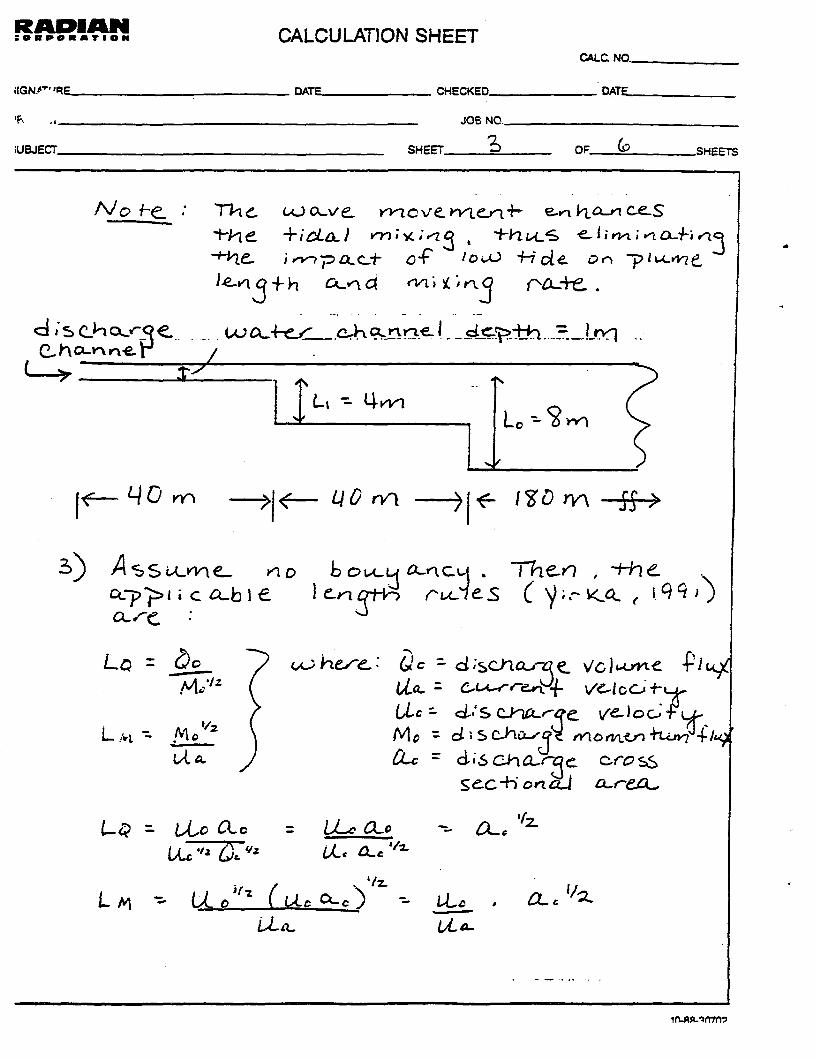
RPApDIAN CALCULATION SHEETCALC NO__ __
;fGNP'' 'RE DATE .CHECKED DATE_
-__ _ _ _ _ _ _ _ _ _ _ _ _ _ _ _ _ _ _ _ _ _ JOB NO.
iUBJECT SHEET_ OF & SHEETS
"i~~ ~ e: .iL& .1.'7 ,*l
+;1e ~ ~ o- loa) ;H<;e, tors Cli L<ve_
<4 C-tin es =--L"
3) 0 Ass nrc . Lo bC CLb I e- Ltl e-bS LI
L'I (i c' 1 key& C c v;sww- I -Pa) Assbeme ncz bovU~- tcL-.ScJ-cv- VCo,
Uc se-hor ea v~e-4.oc~La -A.c " 9 LL O-c -"tQ 4,flm
L1/a
L.-vt al J Mc = d;s rE3< sS&C S6 I' onck Q
C Lt LI., LoC
.~~ ~ . Li R
L-LiL ~ ~ ~ ~ ~ ~ ~ ~ 1 t
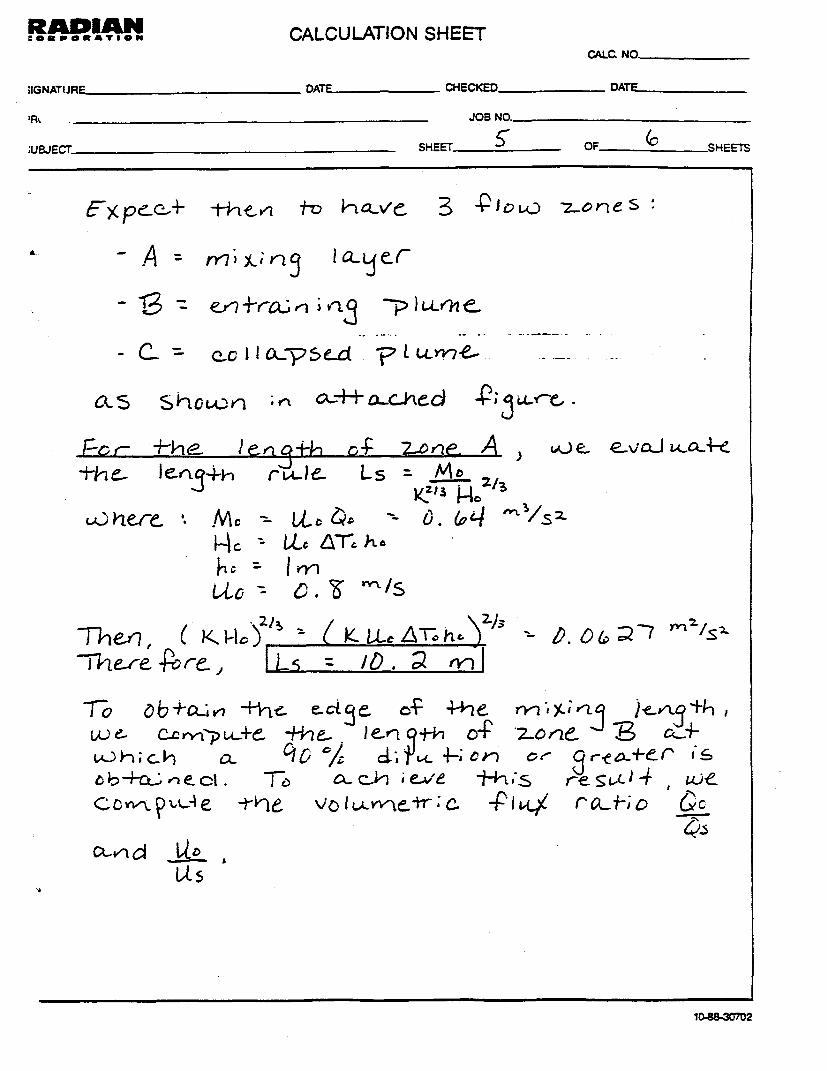
COMM OR AT IO PI CALCULATION SHEETCALC. NO_
;IGNATUJRF DATF CHECKED DATF
'R_ . JOB NO._
;UBJECT_ SHEET__ _ OF SHEETS
CXpecc+ -i--he0 -vo ko 3 lo z-ones
- A rn;y' X n I aQ er
- >3- c.cIfLCp$Ld ?LY?
~t-vs +4la etn-h 1i 2 ee A l eI ac aJLc
Th e I ed-t h le 1 eJ L s - e J zZ
LAL)P2ere- c-- .tr
.-c L- c ATc h7
Tll,rl Ko oO C. Z2/
j >-e-re re z<1< - /1)% 3-@ 0 2zS
rO ~+,VI +h; e. ctci o-A 4+1e ry; ;LJ) )r agiI ,u~) e- Lj-e 'J-e.. 1t q4,O 2cre
DVC~~~~~c CkC;6t+&If 4tho Zr& k-)c 47Q, eC k- ret) s;c a- 14^er
COYh A4 e -t-)-e, vo I-Lv+r;c- -Pi4 rccl-;c Cc
4-4I,1s
10-88-30702
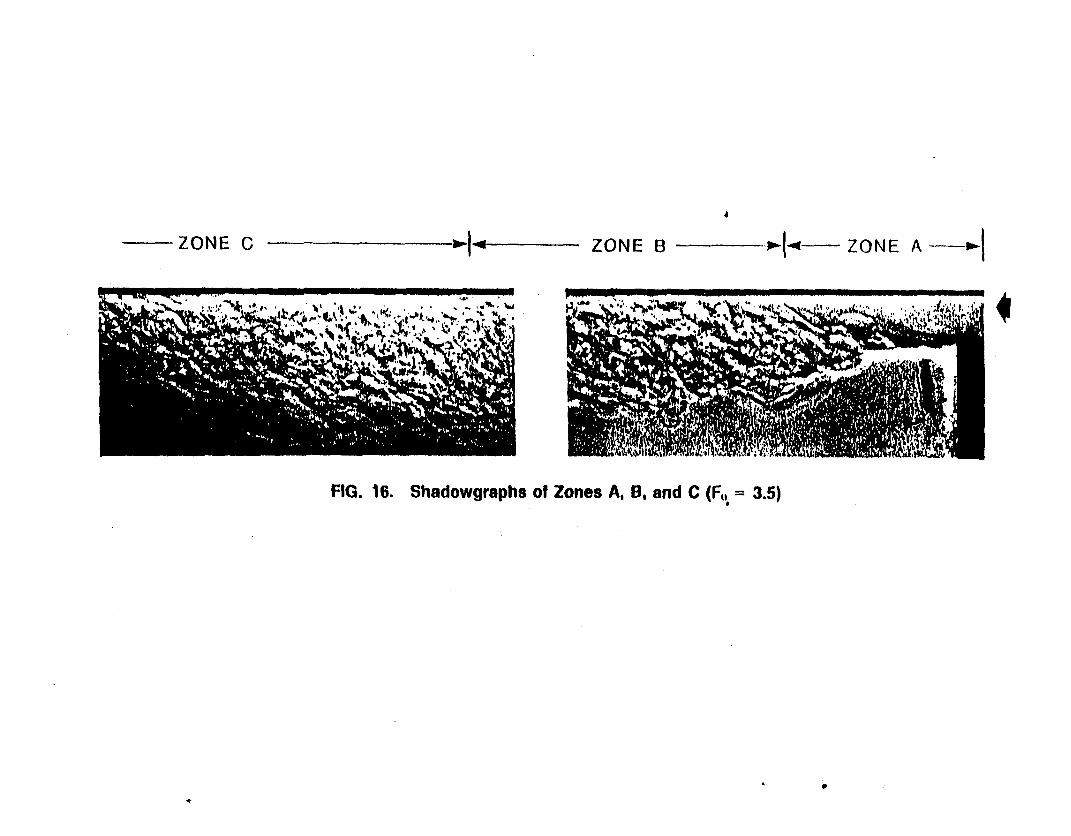
ZONE C 4'. ZONE B --4 -ZONE A->|
FIG. 16. Shadowgraphs of Zones A, B, and C (F,. = 3.5)
Dossiern: PolhtdeP 6vemt : SI'Ji1 cx'en, EClienst ; nRADIAN Dteoetl-lrodoePr6W. Af- : .Ojet vaIu3ldon Envlroienatnle & o ri Naturedi 1 a6dUiu J SI
C.T Ei lorf Lnatr I
, it Coud. MO Hydrocsars bur
200cn g /Kg (ppm)
*~~~~~~C l As Mu Cr . Nl
_1 ~~~~~~~~~~~~~~~(ppm) (prn tI!) (Bo" P" pm) -- ppm)
2~LL. o4ot 32 ___(_____0 __4__ A__ _
Obwyallo,u:
* H.0 : Huilt ot Ormisem* R3H : Potenltl Redox: Q(It8;rcnoo : dtroJe'1ydroyi#c)
- .. . . .- ~ **'.~*....**d.* ~ **-A- ****- . ,
q v,t. c ; Aw ^ j,
.T
UU."~~~~~~~~~~~~~~~~~~~~~~~~~~~~~~~~~~~~~~~~~~~~~~~~~~~~~~~~~~~~"
avM *~~~~~~~~~~~~~~~~~~~~~~~~~~~~
)osiesrn : 95/18191039 PolmtdoWl1dveinnt : SA15m ."' ). Cilh:t RtADIAN DaoatHei o o, : Hu of* de NW ,Objet : lvaluntion Hfviroinnem antlo A le Ndatirre PdIAiUIn : s
CT DE for oL.rs . ;*
Comad, -O HydremrbegIH
psiem gi4 K (ppm)- 20C __-
_3, __ _ _ ____so=-_
_ _ _ _ . .,_ _ . , _ _ ' 9 . . , S . _ _ _ _
*IIG fig Cr As Mn CD Pb NI Mg
(an)ppl),PRO) Q,(lop,) IP) (appl) (W-
Obsavatloi I
1-1.0 : Iluilos at rabscsli3H : Poteitlel Redox: (R.irdrc,co : decto Jod'hydrog&ol) *
a
,,,, ,, ~.. . ........ ,. .-... ..... ...... ,...............,. ..... . , -....... .. . , ..- , ..........-.. ~ _-..... -....... ._,_,,,,,,_.. -.. ...-. -.-........... .,,. _, , ,, * ,,_..
. f ^ ~~~~~~~~~~~~~~~~~~~~~~~~~~~~~~~~~~~~~~~~~~~~~i.

APPENDIX G
SOIL ANALYSIS
A

i! ,
I A 0 f


![CACG/CAHG CACH/CAHH - EMI RetroAire · 2016-01-18 · CACG/CAHG/CACH/CAHH Cssett ar nlrs t Ei arsr Connrs Comfort where it counts 4 P/N 240007992, Rev. A [0609] FEaturE Qty. sizE](https://img.pdfslide.net/doc/110x75/5e9648aacf3908219f6da026/cacgcahg-cachcahh-emi-retroaire-2016-01-18-cacgcahgcachcahh-cssett-ar-nlrs.jpg)