Embed Size (px)
Citation preview

Radon-based assessment of stability affects on
potential radiological releases
Scott Chambers1, Alastair Williams1, Dan Galeriu2, Anca Melintescu2 and Marin Duma2
1 ANSTO, NSTLI - Environmental Division, Sydney, NSW, Australia
2 “Horia Hulubei” National Institute for Physics & Nuclear Engineering, Bucharest-Magurele, Romania
H17-001 (Session 8: Modelling air dispersion and exposure to accidental releases)
17th International Conference on Harmonisation within Atmospheric Dispersion Modelling
for Regulatory Purposes
Monday 9th May 2016, Budapest, Hungary

Background and motivation
• Atmospheric mixing volume changes
diurnally, largely as a function of
atmospheric stability
• Wide range of stability classifications
• More accurate techniques (e.g. L, RiBulk)
expensive, labour intensive, derived for
idealised fetch conditions
• Common alternatives (e.g. Pasquill-Gifford) approximate / categorical
• Surface-emitted tracers give a direct measure of mixing intensity / extent;
better than met. proxies in characterising the outcomes of vertical mixing
• Personal risk and exposure directly related to concentration and time
• Concentration of pollutants or accidental releases related to
source strength and mixing volume

• Radon is the only gas in the Uranium-238 decay chain
• Surface-only source
• Mostly from land (unsaturated / unfrozen) not water
• Source function changes relatively little in space & time
• Unreactive / poorly soluble: sole atmospheric sink is radioactive decay
• Short half-life (3.8d) (a) doesn’t accumulate in the atmosphere
(b) large ABL / troposphere gradient
• Rn half-life >> mixing timescale of the ABL (1-hour)
• Over 1 night (10-12h) Rn is an approximately conservative (>90%) tracer
Ideal, versatile and powerful atmospheric tracer
Atmospheric radon (222Rn)

Radon: distribution &
measurement
Variability on many time scales
Seasonal (1-6 months)
Synoptic (2-12 days)
Diurnal (24 hours)
Sub-Diurnal
Fetch, mixing and non-local processes0 30 60 90 120 150 180 210 240 270 300 330 3600
10
20
30
40
50
Ra
do
n (
Bq
m-3)
Day of year
Richmond, NSW, Australia
• Land Ocean, huge source fn.
(2 - 3 orders of magnitude)
• Regional scales (10s 1000s km)
factor 2 - 4 source fn.
• Local scales (≤10s km; nocturnal fetch
for stable conditions) fairly uniform
• Parent (226Ra – half life 1600 y)(little temporal change except for soil moisture)
Griffiths, AD, et al., 2010: A map of radon flux at the Australian
land surface. Atmos. Chem. Phys., 10, 8969-8982.

Diurnal variability - the ABL mixing indicator
2007.34 2007.36 2007.38 2007.40 2007.42 2007.44
0
20
40
Ra
do
n (
Bq
m-3)
Decimal Year
2007.34 2007.36 2007.38 2007.40 2007.42 2007.44
0
20
40
Ra
do
n (
Bq
m-3)
Decimal Year
Fetch changes
Cyclic synoptic variability
Diurnal changes
in mixing depth
• Before Rn can be used as a stability
indicator, need to isolate diurnal signal
• To do this, identify the fetch signal and
subtract it from the orig. time-series
• Fetch signal related to 2-week air mass history
(Rn half-life 3.82 days)
• Remaining variability is driven by mixing
(constant source, changing volume)0 3 6 9 12 15 18 21 24
0
4
8
12
16
Mid-afternoon
Well-mixed convective
boundary-layer
Ra
do
n (
Bq
m-3)
Hour of day
Sunrise
Shallow nocturnal
boundary-layer
Offshore flowOnshore flow

16 18 20 22 0 2 4 6 8 10 12 140
3
6
9
12
Radon (
Bq m
-3)
Sunset
Sunrise
Hour of composite day
Shifted composite of diurnal variability
Accumulation
window
Radon: ~uniform surface source
and ~conservative over 1 night
Therefore, nocturnal accumulation
is directly related to the average
nocturnal stability (mixing depth)
Convective
mixing offConvective
mixing on
Step 1:
Calculate the nocturnal mean
accumulation for each 24-hour
period
Step 2:
Group the resulting values to
devise a stability classification
scheme.
For more information see: Chambers, S.D., et al., 2015: On the use of radon for quantifying the effects of atmospheric stability on
urban emissions. Atmos. Chem. Phys., 15, 1175-1190.

Stability classification example
Cumulative frequency histogram
of average nocturnal radon
accumulation over 5-years
0 5 10 15 20 25 30 350
500
1000
1500
2000
Cu
mu
lative
fre
qu
en
cy
Radon bin (Bq m-3)
0 5 10 15 20 25 30 350
500
1000
1500
2000
Q4
Q3
Q2
Q1
75th percentile
50th percentile
25th percentile
Cu
mu
lative
fre
qu
en
cy
Radon bin (Bq m-3)
Diurnal composite Rn in each stability category
16 18 20 22 0 2 4 6 8 10 12
0
5
10
15
20
25
Radon g
radie
nt (B
q m
-3)
Hour of composite day
Near Neutral
Weakly stable
Moderately Stable
Stable

About the Stability Categories
• The number of definable nocturnal stability categories dictated by
length of dataset and desired robustness of statistics
• 1 yr, 4 seasons, 4 stab. categories: diurnal composites based on 22 days
5 yr, 4 seasons, 6 stab. categories: diurnal composites based on 76 days
• Categories defined nocturnally over 10-12 hours but can generally be
assigned to whole 24-hour periods (due to atmospheric persistence)
• The most stable nights are usually characterised by:
- Clear skies, calm to light winds (e.g. anticyclonic conditions)
- Usually flanked by the most unstable (convective) days
• The most well-mixed nights are usually characterised by:
- High percentage of cloud cover and moderate to strong winds
- Usually flanked by near-neutral days
• For regulatory dispersion modelling, radon stability categories can be used
like Pasquill-Gifford categories to assign day/night wind speeds and WD to
the 16-point compass on a monthly or quarterly basis
• Categorisation is COMPLETELY INDEPENDENT of site meteorology

Evaluating radon-derived stability categories:
(a) Meteorology
Stable: low nocturnal wind speed, high wind direction variability, large temperature amplitude
Near-neutral: higher, more consistent, wind speed & direction, lower amplitude temp fluctuation
Group met data by Rn-based stability category and form diurnal composites
16 18 20 22 0 2 4 6 8 10 120
1
2
3
Win
d s
pe
ed (
m s
-1)
16 18 20 22 0 2 4 6 8 10 1220
30
40
50
60
70
w
ind
dire
ction
(o)
Hour of composite day
16 18 20 22 0 2 4 6 8 10 126
12
18
24
Te
mp
era
ture
(C
)
Near neutral
Weakly stable
Moderately stable
Stable
Richmond, NSW, Australia

Stable: large amplitude
changes
Near-neutral: small
amplitude changes
NO – primary pollutant,
local surface-based
source (proxy for near-
surface accidental
emission)
Ozone behaviour
supports atmospheric
persistence hypothesis
Evaluating radon-derived stability categories:
(b) urban pollution example
16 18 20 22 0 2 4 6 8 10 120
2
4
6
8
10
12
14
16
NO
(ppb)
16 18 20 22 0 2 4 6 8 10 120
2
4
6
8
10
12
14
NO
2 (
ppb)
16 18 20 22 0 2 4 6 8 10 120
5
10
15
20
25
30
35
Ozo
ne (
ppb)
16 18 20 22 0 2 4 6 8 10 120.0
0.1
0.2
0.3
0.4
0.5
0.6
0.7
SO
2 (
ppb)
16 18 20 22 0 2 4 6 8 10 12
2
4
6
8
10
12
PM
2.5
(
g m
-3)
Hour of composite day
Near neutral
Weakly stable
Moderately stable
Stable
Richmond, NSW, Australia

Assign hourly PG cats then
group by Rn-based cats
Stable nocturnal Rn-category
PG: 6 (night), 1-2 (day)
Well-mixed Rn-category
PG: 4-5 (night), 2-4 (day)
Stable nocturnal Rn-categories
Above the critical Richardson
number (RiC=0.25)
Composite nocturnal
Richardson numbers separate
fairly consistently with radon-
derived stability categories.
(for more info.: Williams A.G., S. Chambers
and A. Griffiths. Bulk Mixing and Decoupling
of the Nocturnal Stable Boundary Layer
Characterized Using a Ubiquitous Natural
Tracer. Boundary-Layer Meteorol., 149, 381-
402, 2013)
Comparing radon-derived stability categories
with P-G and RiBulk categorisation
15 17 19 21 23 1 3 5 7 9 11 13
0
1
2
3
4
5
6
7
WinterSummer
Pa
sq
uill
-Giffo
rd (
rad
iatio
n)
iPG near neutral
iPG weakly stable
iPG moderately stable
iPG stable
(a)
15 17 19 21 23 1 3 5 7 9 11 13
0
1
2
3
4
5
6
7
(b)
iPG near neutral
iPG weakly stable
iPG moderately stable
iPG stable
15 17 19 21 23 1 3 5 7 9 11 13-1.5
-1.0
-0.5
0.0
0.5
1.0
1.5
(c)
Bu
lk R
ich
ard
so
n N
um
be
r
Hour of composite day
RiB near neutral
RiB weakly stable
RiB moderately stable
RiB stable
15 17 19 21 23 1 3 5 7 9 11 13-1.5
-1.0
-0.5
0.0
0.5
1.0
1.5
RiC
(d)
near neutral
weakly stable
moderately stable
stable
Chambers, S.D., et al., 2016: Atmospheric stability effects on potential radiological releases at a nuclear
research facility in Romania: Characterising the atmospheric mixing state. J. of Environ. Radioact., 154, 68-82.

Characterising diurnal pollutant cycles
Pasquil-Gifford vs Radon-based stability typingPG-turbulence scheme based on WD and mean wind speed
Nocturnal categories: D - neutral, E - moderately stable, F - stable
16 18 20 22 0 2 4 6 8 10 12 140
10
20
30
40
Ozone (
ppb)
16 18 20 22 0 2 4 6 8 10 12 140.0
0.1
0.2
0.3
0.4
SO
2 (
ppb)
16 18 20 22 0 2 4 6 8 10 12 140
2
4
6
8
10
"D" (neutral)
"E" (mod. stable)
"F" (very stable)
PM
2.5 (
g m
-3)
PG
-T
16 18 20 22 0 2 4 6 8 10 120
2
4
6
8
10
12
14
16
NO
(ppb)
16 18 20 22 0 2 4 6 8 10 120
2
4
6
8
10
12
14
NO
2 (
ppb)
16 18 20 22 0 2 4 6 8 10 120
5
10
15
20
25
30
35
Ozo
ne (
ppb)
16 18 20 22 0 2 4 6 8 10 120.0
0.1
0.2
0.3
0.4
0.5
0.6
0.7
SO
2 (
ppb)
16 18 20 22 0 2 4 6 8 10 12
2
4
6
8
10
12
PM
2.5
(
g m
-3)
Hour of composite day
Near neutral
Weakly stable
Moderately stable
Stable
16 18 20 22 0 2 4 6 8 10 120
2
4
6
8
10
12
14
16
NO
(p
pb
)
16 18 20 22 0 2 4 6 8 10 120
2
4
6
8
10
12
14
NO
2 (
pp
b)
16 18 20 22 0 2 4 6 8 10 120
5
10
15
20
25
30
35
Ozo
ne (
pp
b)
16 18 20 22 0 2 4 6 8 10 120.0
0.1
0.2
0.3
0.4
0.5
0.6
0.7
SO
2 (
pp
b)
16 18 20 22 0 2 4 6 8 10 12
2
4
6
8
10
12
PM
2.5
(
g m
-3)
Hour of composite day
Near neutral
Weakly stable
Moderately stable
Stable
Rad
on
PG-T
Distinction between
categories less clear.
Peak concentrations
under stable
conditions
underestimated
Richmond, NSW, Australia

Influence of stability on nocturnal mixing depth
The change in radon (C) in the NBL is a balance between
flux (F), decay () and dilution (D).
dC F C Dhdt
Iterative solution for h: equivalent mixing depth (he)
Analytical solution for h: accumulated mixing height (hacc)16 18 20 22 0 2 4 6 8 10 12
0
5
10
15
20
25
Radon g
radie
nt (B
q m
-3)
Hour of composite day
Near Neutral
Weakly stable
Moderately Stable
Stable
450m
30m
10
100
1000
Stable StableModerately
Stable
Wealky
Stable
Near
Neutral
Near
Neutral
He
ight (m
) agl
Stability / Mixing category
hacc
Wealky
Stable
Moderately
Stable
10
100
1000
he
10th perc.
median
90th per.
Richmond, NSW, Australia
F ~ 20 mBq/m2/s

National Institute for Research and Development in
Physics and Nuclear Engineering (IFIN-HH)
IFIN-HH: 10km SW Bucharest, urban-rural landscape, observations from 60m tower, 1 km exclusion
zone, roughness elements 10-15m, challenging fetch for conventional stability typing.
IFIN-HH
Roughness map around IFIN-HH site

Seasonality of potential extreme events
Considering ONLY the most stable
nocturnal atmospheric conditions:
(a) PG scheme reports 20-25%
lower median concs of pollutants
with near-surface sources
(b) BUT - nocturnal mixing depth
under stable conditions 10-20m, and
the stack release height is >40m
0 3 6 9 12 15 180
50
100
150
200
Near
neutral
Weakly
stable
Moderately stable
Cum
ula
tive
fre
qu
en
cy
Mean nocturnal radon (Bq m-3)
Stable
(a)
16 18 20 22 0 2 4 6 8 10 12 140
4
8
12
16
20
24(b)
Rad
on
(B
q m
-3)
Hour of composite day
Near-neutral
Weakly stable
Moderately stable
StableDespite the non-ideal fetch
conditions, radon-derived stability
categories were easily assigned
16 18 20 22 0 2 4 6 8 10 120
10
20
30
40
50
Win
ter
Ra
do
n (
Bq m
-3)
Su
mm
er
(a) Radon "stable" category
16 18 20 22 0 2 4 6 8 10 120
10
20
30
40
50
(b) PG-R "stable" category
10th percentile
50th percentile
90th percentile
16 18 20 22 0 2 4 6 8 10 120
10
20
30
40
50
(c) Radon "stable" category
Hour of composite day
16 18 20 22 0 2 4 6 8 10 120
10
20
30
40
50
(d) PG-R "stable" category
Radon-based Pasquil-Gifford
Chambers, S.D., et al., 2016: Atmospheric stability
effects on potential radiological releases at a nuclear
research facility in Romania: Characterising the
atmospheric mixing state. Journal of Environmental
Radioactivity, 154, 68-82.

Conclusions
• Radon is a powerful and comparatively economical tool for
atmospheric stability analysis of pollution / release concs.
• Can be used independently of site meteorology
• Rn-based stability analysis of urban pollution superior to conventional
techniques particularly in conditions of non-ideal fetch
• Day/night (12-hr) Rn-based stability categories can be provided (like
PG classes) for routine dispersion modelling purposes
• Long-term characterisation of pollution by Rn-derived stability
category is also ideal for:
(1) evaluating the efficacy of emission mitigation strategies, and
(2) providing benchmarks for evaluating CTMs

Thank youRecent publications related to this presentation
Chambers, S.D., et al., 2011: Separating remote fetch and local mixing influences on vertical radon measurements in the lower
atmosphere. Tellus 63B, 843-859.
Williams, A.G., et al., 2013. Bulk Mixing and Decoupling of the Nocturnal Stable Boundary Layer Characterized Using a Ubiquitous
Natural Tracer. Bound.-Lay. Meteorol., 149, 381–402.
Chambers, S.D., et al., 2015: On the use of radon for quantifying the effects of atmospheric stability on urban emissions. Atmos.
Chem. Phys., 15, 1175-1190.
Chambers, S.D., et al., 2015: Quantifying the influences of atmospheric stability on air pollution in Lanzhou, China, using a radon-
based stability monitor. Atmos. Environ., 107, 233-243.
Crawford, J., et al., 2016. Assessing the impact of atmospheric stability on primary and secondary aerosols at Richmond, Australia,
using Radon-222. Atmos. Environ., 127, 107-117.
Chambers, S.D., et al., 2016: Atmospheric stability effects on potential radiological releases at a nuclear research facility in Romania:
Characterising the atmospheric mixing state. Journal of Environmental Radioactivity, 154, 68-82.
Williams, A.G., et al., 2016. Radon as a tracer of atmospheric influences on traffic-related air pollution in a small inland city. Tellus B,
submitted January 2016.
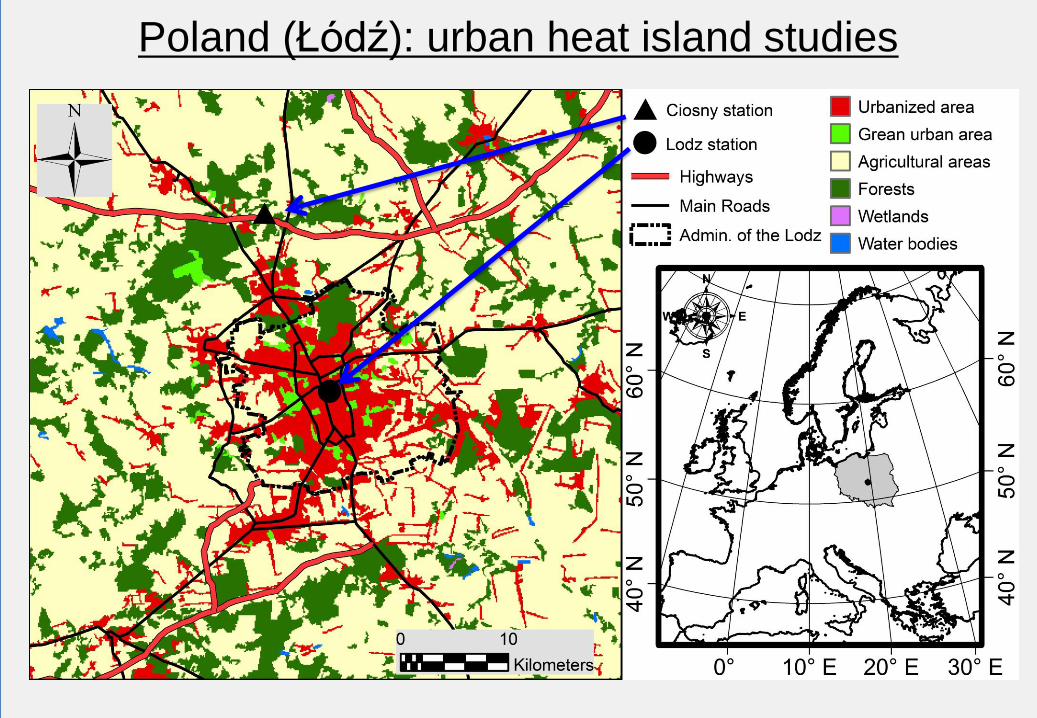
Poland (Łódź): urban heat island studies

16 18 20 22 0 2 4 6 8 10 12 14-2
-1
0
1
2
3
4
5
UH
I (U
rban
2m -
Ru
ral 2
m;
oC
)
(a) Summer
16 18 20 22 0 2 4 6 8 10 12 14-2
-1
0
1
2
3
4
5
(b) Autumn Near neutral
Moderately mixed
Weakly mixed
Stable
16 18 20 22 0 2 4 6 8 10 12 14-1.0
-0.5
0.0
0.5
1.0
1.5
2.0
(c) Winter
Hour of composite day
16 18 20 22 0 2 4 6 8 10 12 14-2
-1
0
1
2
3
4
5
(d) Spring
Stability affect on Urban Heat Island intensity
Urban Heat Island
Intensity depends
strongly on the
regional stability
(derived by radon)

Stability affects on site meteorology
0.0
0.5
1.0
1.5
2.0
Ciosny (Rural)
(a) Summer
0.0
0.5
1.0
1.5
2.0
Lodz (Urban)
(b) Summer
0.0
0.5
1.0
1.5
2.0
2.5
(c) Autumn
2m
win
d s
peed (
m s
-1)
0.0
0.5
1.0
1.5
2.0
2.5
(d) Autumn
1.0
1.2
1.4
1.6
1.8
2.0
2.2
(e) Winter
Near neutral
Moderately mixed
Weakly mixed
Stable
1.0
1.2
1.4
1.6
1.8
2.0
2.2
(f) Winter
16 18 20 22 0 2 4 6 8 10 12 140.0
0.5
1.0
1.5
2.0
2.5
(g) Spring
Hour of composite day
16 18 20 22 0 2 4 6 8 10 12 140.0
0.5
1.0
1.5
2.0
2.5
(h) Spring
-3
-2
-1
0
1
2
3
4
Lodz (Urban)Ciosny (Rural)
(h) Spring(g) Spring
(f) Winter(e) Winter
(d) Autumn(c) Autumn
(b) Summer(a) Summer
-3
-2
-1
0
1
2
3
4
-2
-1
0
1
2
3
Te
mp
era
ture
gra
die
nt (2
m -
0.2
m;
oC
)
-2
-1
0
1
2
3
-1.0
-0.5
0.0
0.5
1.0
-1.0
-0.5
0.0
0.5
1.0
Near neutral
Moderately mixed
Weakly mixed
Stable
16 18 20 22 0 2 4 6 8 10 12 14-3
-2
-1
0
1
2
3
4
Hour of composite day
16 18 20 22 0 2 4 6 8 10 12 14-3
-2
-1
0
1
2
3
4

Stability affects on urban meteorology
0.6 0.8 1.0 1.2 1.40
1
2
3
4
5
(b) Summer
UHI = 0.363 U-4.235
UH
I (o
C)
Lodz wind speed (m s-1)
(a) Spring
UHI = 0.9911 U-2.924
0.6 0.8 1.00
1
2
3
4
5
19 20 21 22 23 0 1 2 3 4 5 6 7 8 90
20
40
60
80
100
120
140
Eq
uiv
ale
nt m
ixin
g h
eig
ht (m
)
Hour of day
Moderately Mixed
Weakly Mixed
Stable
(a) Ciosny
19 20 21 22 23 0 1 2 3 4 5 6 7 8 90
20
40
60
80
100
120
140
(b) Lodz
Lodz nocturnal wind direction, SpringLodz
Gentle
slope