Embed Size (px)
Citation preview

The RAFI™ Multi-Factor
Index
Chris Brightman, CFAChief Investment Officer
Research Affiliates, LLC

2
RAFI Multi-Factor Index Series
RAFI Multi-Factor is a smart beta equity strategy that offers diversified factor
exposures through allocations to value, low volatility, quality, momentum, and size.
» Theoretically and empirically robust single-factor strategies
» Diversified factor exposures designed for a smoother ride, offered through a rules-based, transparent index construct
» Potential for added returns through a thoughtful dynamic weighting process

3
Index Global DevelopedDeveloped
Ex US
United
States
Emerging
Markets
RAFI Dynamic Multi-Factor Index
RAFI Multi-Factor Index
RAFI Value Factor Index
RAFI Low Volatility Factor Index
RAFI Quality Factor Index
RAFI Size Factor Index
RA Momentum Factor Index
» No Size Factor Index in Emerging Markets because it is not investable.
» Global Multi-Factor Indices utilize the RAFI Size Factor Developed Index as the size component.
» Momentum is not offered as a stand-alone index product because
» Transparent index construct is not optimal for momentum strategies, and
» Implementation costs as a stand-alone strategy are high. Works well, however, as part of an investment process.
Available Indices

4
A Natural Extension of Our Research
The RAFI™
Fundamental
Index™ Approach
“FundamentalIndexation”
Arnott, Hsu, Moore
Financial Analysts Journal
March 2005
“An Overwrought Orthodoxy”
Arnott
Institutional Investor
December 2006
“Institutionalizing Courage”
Arnott
May 2012
Smart Beta
Strategies and
Factor Exposures
“A Survey of Alternative Equity Index Strategies”
Chow, Hsu, Kalesnik, Little
Financial Analysts Journal
September 2011
“The Surprising Alphafrom Malkiel’s Monkey…”
Arnott, Hsu, Kalesnik, Tindall
Journal of Portfolio Mgmt.
August 2013
Robustness of
Factors
“Finding Smart Beta in the Factor Zoo”
Hsu, Kalesnik
July 2014
“Will Your Factor Deliver?...”
Beck, Hsu, Kalesnik, Kostka
Financial Analysts Journal
September 2016
The Effects of
Valuations on
Smart Beta
“How Can ‘Smart Beta’ Go Horribly Wrong?”
Arnott, Beck, Kalesnik, West
February 2016
“To Win with ‘Smart Beta’ Ask If the Price Is Right”
Arnott, Beck, Kalesnik
June 2016
“Timing ‘Smart Beta’ Strategies? Of Course! Buy Low, Sell High!”
Arnott, Beck, Kalesnik
September 2016

5
Based on the RAFI Fundamental Index Approach
Book Value
Dividends+
Buybacks
Cash Flow
DeleveredSales
» Results in a systematic rebalancing approach with:
› A history of outperformance, based on sound investing principles
› Broad economic representation
› Low turnover, fees, and implementation costs, and high capacity
» Selects and weights securities by fundamental measures of firm size.

6
Starting Universe
• Start with six regions: US, Japan, UK, Europe ex UK, Other Developed, Emerging Markets
• Top 86% by cumulative fundamental weight constitutes large-company portfolios
• 86–98% by cumulative fundamental weight constitutes small-company portfolios
• Bottom 2% excluded due to illiquidity
Assign Factor Scores
• Assign factor scores for the magnitude of each stock’s exposure to value, low volatility, quality, and momentum
Form Individual Factor Indices
• RAFI Value Factor Index
• RAFI Low Volatility Factor Index
• RAFI Quality Factor Index
• RA Momentum Factor Index
• RAFI Size Factor Index (combines the four factor strategies within small company)
Weight Factor Indices by RAFI weight (exception: Momentum)
Implement Trading Controls to Minimize Turnover
• Turnover Control
• Momentum Filtering
RAFI Multi-Factor Index RAFI Dynamic Multi-Factor Index
• Equally weights combination of five factors (except for EM which excludes size)
• Rebalances factor strategies back to equal weight on a quarterly basis
• Uses reversal and momentum measures to allocate to each factor
• Adjusts dynamic allocations quarterly
Investment Process
7
RAFI Factor Index Strategies
8
0.0
0.1
0.2
0.3
0.4
0.5
0.6
Bo
ok-t
o-P
rice
Earn
ing
s-to
-Pri
ce
Cash
flo
w-t
o-P
rice
Div
iden
ds-
to-P
rice
Lo
w B
eta
Lo
w V
ola
tility
-2 t
o -
12 M
on
ths
-2 t
o -
6 M
on
ths
-1 t
o -
12 M
on
ths
Gro
ss P
rofi
tab
ilit
y
Retu
rn o
n E
qu
ity
Gro
ss M
arg
ins
Bo
ok L
evera
ge
50%
Sm
all, 50%
Big
75%
Sm
all, 25%
Big
25%
Sm
all, 75%
Big
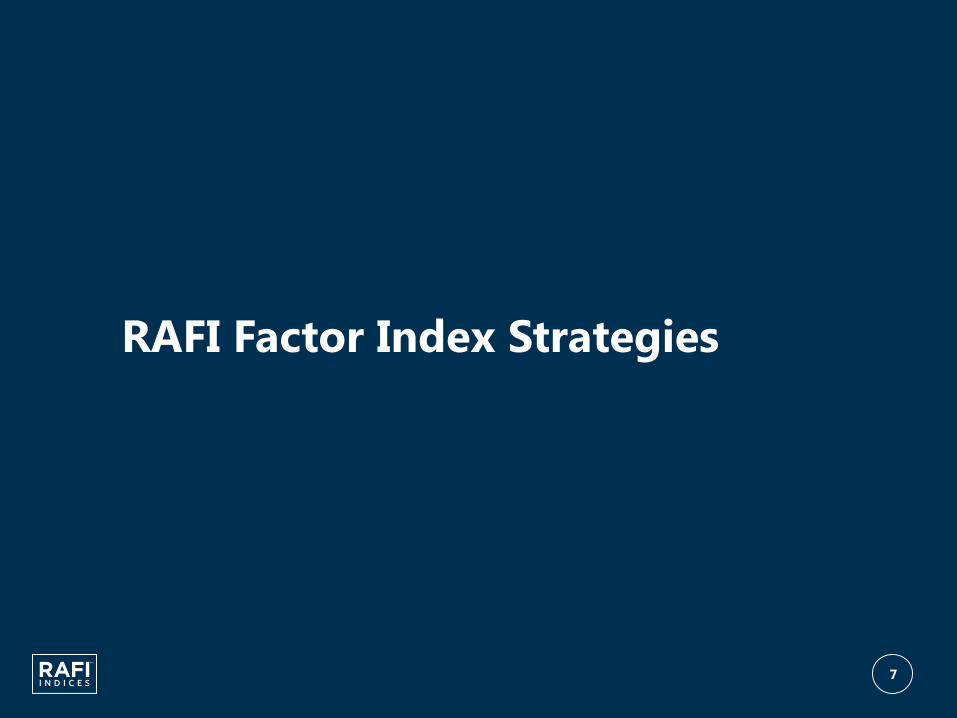
Not All Popular Factor Strategies Are Robust
Sharpe Ratio Difference* of Long/Short Factors, US, 1967–2014
Value vs.
Growth
Low Beta vs.
High Beta
High Momentum
vs. Low MomentumQuality vs.
Junk
Small vs.
Big
Robust Non-Robust
Sh
arp
e R
ati
o D
iffe
ren
ce
*Sharpe ratio of long portfolio minus short portfolio for each factor.Source: “Will Your Factor Deliver? An Examination of Factor Robustness and Implementation Costs.” Beck, Hsu, Kalesnik, and Kostka. Financial Analysts Journal, vol. 72, no. 5 (September/October 2016).

9
RAFI Value Factor Index
» A concentrated value strategy that selects securities by their ratio of fundamentals to capitalization weight
» Selects companies with a large economic footprint relative to their market capitalization
Book Value
Dividends+
Buybacks
Cash Flow
DeleveredSales
Cap-Weight
vs.

10
RAFI Low Volatility Factor Index
» A concentrated low-volatility strategy that selects securities using a systematic risk measure
» Volatility includes both diversifiable and non-diversifiable risk.
» Beta only captures risk associated with the global equity market.
Diversifiable RiskGlobal Beta
Industry Beta
CountryBeta
Systematic Risk
Total Variance
Diversifiable risk is the unexplained variance from a three-factor regression model against a global index, industry index, and country index specific to that stock.

11
RAFI Quality Factor Index
» A concentrated quality strategy that uses the combination of high profitability and low investment to select quality stocks
Profitability Low Investment*
Operating Profitability Asset Growth
Return on Equity Book Growth
Return on Assets
*No Empire Building

12
Improving the Quality Factor
» If quality is not robust, why incorporate as a factor?
US results are for the period 1967–2015; International results are for the period 1987–2015. Results are for large-cap stocks for each region or definition.Source: Research Affiliates, LLC, based on data from CRSP/Compustat and Worldscope/Datastream.
» Quality factors based on profitability are negatively correlated with value.
» Combining profitability and investment is more robust.
Note: Sharpe ratio differences for all strategies except Japan are statistically significant at the 95% confidence level.
0.530.49
0.53
0.06
0.51
0.22 0.210.17
0.09
0.23
-0.20
0.00
0.20
0.40
0.60
0.80
United
States
United
Kingdom
Europe
ex UK
Japan Global
Sharpe Ratios of Quality Vs. Junk
Quality Junk

13
RAFI Size Factor Index
» Equally weighted allocation to four factors—value, low volatility, quality, and momentum—within the small universe
US results are for the period 1967–2014; International results are for the period 1987–2014. Source: “Will Your Factor Deliver? An Examination of Factor Robustness and Implementation Costs.” Beck, Hsu, Kalesnik, and Kostka. Financial Analysts Journal, vol. 72, no. 5 (September/October 2016).
0.50
0.69
0.43
0.61
0.240.19
0.39
-0.05
-0.20
0.00
0.20
0.40
0.60
0.80
Value vs.
Growth
Low Beta vs.
High Beta
Quality vs.
Junk
Winners vs.
Losers
Sharpe Ratios of Factor Portfolios Within Small-Cap Stocks, US
0.58
0.70
0.51
0.66
0.14
0.260.23
-0.15-0.20
0.00
0.20
0.40
0.60
0.80
Value vs.
Growth
Low Beta vs.
High Beta
Quality vs.
Junk
Winners vs.
Losers
Sharpe Ratios of Factor Portfolios within Small-Cap Stocks, Global
Note: Sharpe ratio differences for all factors except Quality in the US are statistically significant at the 95% confidence level.
0.58
0.70
0.51
0.66
0.14
0.260.23
-0.15-0.20
0.00
0.20
0.40
0.60
0.80
Value vs.
Growth
Low Beta vs.
High Beta
Quality vs.
Junk
Winners vs.
Losers
Sharpe Ratios of Factor Portfolios - Global
Long Portfolio Short Portfolio

14
Momentum Factor Index
» Uses multiple measures of momentum as a diversifying component in the RAFI Multi-Factor strategy
Measure Definition Benefit
Standard
Momentum
Past 12-month return excluding
most recent month
Widely known, well-vetted
measure of momentum1
Idiosyncratic
Momentum
Beta-adjusted standard
momentumLess prone to momentum crashes2
Fresh
Momentum
Standard momentum relative to
previous year
Less likely to pick momentum
stocks trading at high valuations3
1. “Returns to Buying Winners and Selling Losers: Implication for Stock Market Efficiency.” Jegadeesh and Titman, Journal of Finance, vol. 48, no. 1, (March 1993).
2. “Idiosyncratic Momentum: US and International Evidence.” Chaves, Journal of Investing, vol. 25, no. 2 (Summer 2016).3. “Fresh Momentum.” Chen, Kadan, and Kose (October 2009).

15
Value Low Volatility Quality Momentum
Characteristics 𝑅𝐴𝐹𝐼
𝐶𝐴𝑃Systematic Risk Profitability
» Oper. Profitability
» ROE
» ROA
Investment
» Asset Growth
» Book Growth
» Momentum
» Idiosyncratic-
Momentum
» Fresh
Momentum
SelectionSelect top ¼ cumulative fundamental weights by
characteristics.Select top ½.
WeightingRAFI Fundamental Index Approach: Delevered Sales,
Cash Flow, Dividends + Buybacks, and Book ValueMarket Cap
Rebalancing Quarterly Staggered Rebalance (25% each quarter) Quarterly
» Size Factor: Average of four factors (value, low volatility, quality, and
momentum) built within small universe and rebalanced quarterly
RAFI Factor Index Construction
1616
Reduced Turnover through
Thoughtful Design Characteristics

17
» Turnover Control: At each quarterly rebalance, replace 10% of current holdings in existing portfolio (20% for momentum).
» Remove securities with the least attractive characteristics.
» Rebalance entire portfolio to current target weights.
» Momentum Filtering
» Rank securities in rebalanced portfolio by standard momentum.
» Top 25% of portfolio ranked by momentum: Do not sell.
» Bottom 25% of portfolio ranked by momentum: Do not buy.
Turnover Control & Momentum Filtering

18
Example – RAFI Value Factor US Index
CharacteristicsWithout Turnover Control &
Momentum Trade FilteringWith Turnover Control
With Turnover Control &
Momentum Trade Filtering
Annual One-Way Turnover 36.9% 26.0% 20.0%
Estimated Transaction Costs 19bps 11bps 9bps
Po
rtfo
lio
Weig
ht
High
Low
Turnover Control
Valu
e S
ign
al
1. Rank existing
portfolio by value
signal (RAFI/Cap).
2. Replace bottom 10%
of portfolio with new
constituents.
Momentum Filtering
Po
rtfo
lio
Weig
ht
High
Low
Mo
men
tum
Sig
nal
Bottom
25%
Don’t
Buy
Top 25%
Don’t
Sell
1. With new names added,
rank Value Factor Index
by momentum.
2. Do not sell high-
momentum stocks while
they’re soaring.
3. Do not buy low-
momentum stocks while
they’re in free fall.
4. Rebalance the middle
50% back to
fundamental weights.
Top 90%
Don’t
Remove
Source: Research Affiliates, LLC, using data from Worldscope, and Datastream. Turnover and transaction costs are estimated for the period 5/1987– 9/2016. Estimated transaction costs assume $5B in AUM.The index data published herein are simulated. Please see important disclosure information at end.

1919
Dynamic Allocation

20
Valuation Cycle for Value Factor
Source: Research Affiliates, LLC, using data from CRSP and Compustat, 1968–2016. Value vs. growth portfolios are constructed using a long/short portfolio of four valuation metrics: book/price, earnings/price, dividend/price, and cash flow/price.
0.13
0.25
0.50
1.00
2.00
0.25
0.50
1.00
2.00
4.00
1968 1972 1976 1980 1984 1988 1992 1996 2000 2004 2008 2012 2016
Relative
Valuation
Value
vs.
Growth
Relative
Performance
Value
vs.
Growth
Value Performance Relative Valuation
A
A
B
B
C
C
D
D
E
E
Nifty Fifty
Biotech Bubble
Tech
Bubble
Global
Financial
Crisis
Value vs. Growth, US, 1968–2016

21
Return Due to Change in Valuation
Source: Research Affiliates, LLC, using data from CRSP and Compustat, 1968–2016. Value vs. growth portfolios are constructed using a long/short portfolio of four valuation metrics: book/price, earnings/price, dividend/price, and cash flow/price.
0.25
0.5
1
2
4
8
16
0.5
1
2
4
8
1968 1972 1976 1980 1984 1988 1992 1996 2000 2004 2008 2012 2016
Rela
tive
Valu
ati
on
, M
om
en
tum
Rela
tive
Perf
orm
an
ce, M
om
en
tum
Up vs. Down, Momentum, US, 1968-2016
Momentum Performance Relative Valuation
0.25
0.5
1
2
4
8
16
0.5
1
2
4
1968 1972 1976 1980 1984 1988 1992 1996 2000 2004 2008 2012 2016
Rela
tive
Valu
ati
on
, Sm
all C
ap
Rela
tive
Perf
orm
an
ce, Sm
all C
ap
Small Cap vs. Large Cap, US, 1968-2016
Small Cap Performance Relative Valuation
0.125
0.25
0.5
1
2
4
8
16
0.5
1
2
4
8
1968 1972 1976 1980 1984 1988 1992 1996 2000 2004 2008 2012 2016
Rela
tive
Valu
ati
on
, Lo
w B
eta
Rela
tive
Perf
orm
an
ce, Lo
w B
eta
Low Beta vs. High Beta, US, 1968-2016
Low Beta Performance Relative Valuation
1
2
4
0.5
1
2
1968 1972 1976 1980 1984 1988 1992 1996 2000 2004 2008 2012 2016
Rela
tive
Valu
ati
on
, P
rofi
tab
ilit
y
Rela
tive
Perf
orm
an
ce, P
rofi
tab
ilit
y
Profitable vs. Unprofitable, US, 1968-2016
Profitability Performance Relative Valuation

22
» Dynamic Indicators
» Long-term reversal: five-year return excluding past one-year return.
» Short-term momentum: one-year return minus past one-month return.
» Rebalance Dynamic Allocation Quarterly
» Start with equal-weight anchor.
» Allocate toward factors that have underperformed over the past five years, but have outperformed over the past one year.
» Dynamic allocation limited to ±15% of equal-weight anchor.
Dynamic Factor Allocation

23
Factor Valuations Today – United States
Source: Research Affiliates, LLC, using data from CRSP and Compustat, 1967–2016. The index data published herein are simulated. Please see important disclosure information at end.
Valuations Relative to History (3/31/2017)
0.25
0.50
1.00
2.00
RAFI Dynamic
Multi-Factor
US Index
RAFI Value
Factor US
Index
RAFI Low
Volatility Factor
US Index
RAFI Quality
Factor US
Index
RA Momentum
Factor US
Index
RAFI Size
Factor US
Index
Ag
gre
gate
Valu
ati
on
Rati
o v
s. C
ap
-Weig
ht
10th to 90th Percentile Median Valuation Current Valuation
24
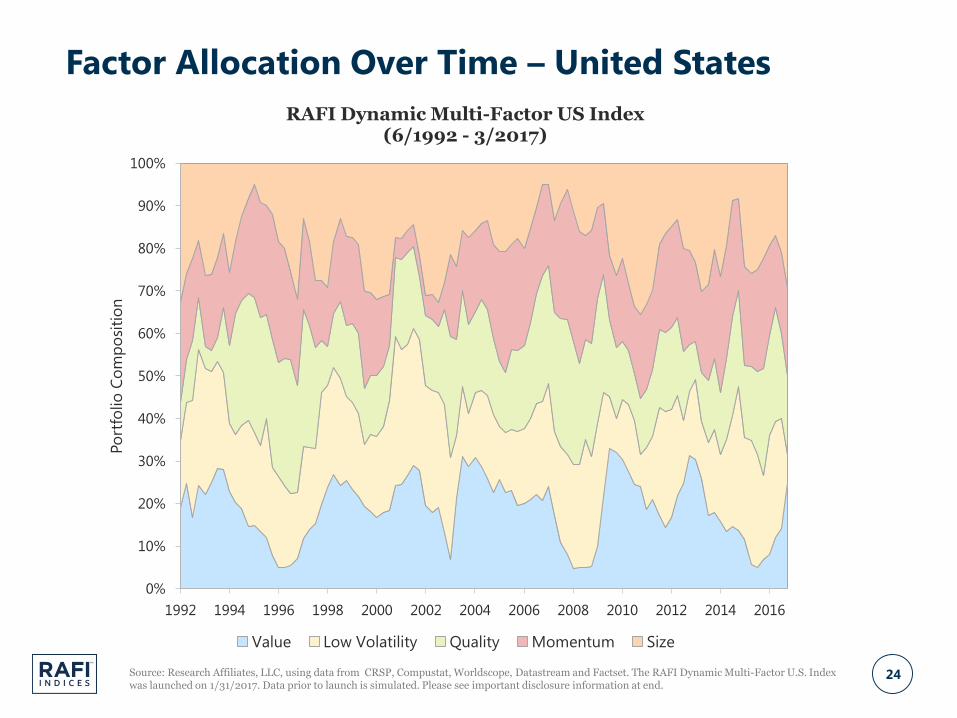
Factor Allocation Over Time – United States
Source: Research Affiliates, LLC, using data from CRSP, Compustat, Worldscope, Datastream and Factset. The RAFI Dynamic Multi-Factor U.S. Index was launched on 1/31/2017. Data prior to launch is simulated. Please see important disclosure information at end.
0%
10%
20%
30%
40%
50%
60%
70%
80%
90%
100%
1992 1994 1996 1998 2000 2002 2004 2006 2008 2010 2012 2014 2016
Po
rtfo
lio
Co
mp
osi
tio
nRAFI Dynamic Multi-Factor US Index
(6/1992 - 3/2017)
Value Low Volatility Quality Momentum Size

25
Performance and Characteristics
Source: Research Affiliates, LLC, using data from Solactive, CRSP, Compustat, Worldscope, and Datastream. The RAFI Multi-Factor U.S. indices were launched on 1/31/2017. Data prior to launch is simulated. One-way turnover data is for the period 1993 – 2016. Capacity and transaction cost estimates are as of 12/31/2016.
Results – United States
Factor Regression
United States
6/1992–3/2017
Annualized
Return
Annualized
Volatility
Sharpe
Ratio
Tracking
Error
Information
Ratio
One-Way
Turnover
Capacity
$B
Cost at
$5B
RAFI Dynamic Multi-Factor US Index 12.4% 12.7% 0.77 4.4% 0.64 50.9% 18.8 0.13%
RAFI Multi-Factor US Index 12.0% 12.7% 0.74 4.2% 0.59 38.0% 29.8 0.08%
Russell 3000 Index 9.5% 14.5% 0.48
RAFI Value Factor US Index 13.0% 15.1% 0.69 7.8% 0.44 18.3% 30.5 0.08%
RAFI Low Volatility Factor US Index 11.1% 11.2% 0.76 9.0% 0.17 15.0% 46.3 0.05%
RAFI Quality Factor US Index 11.9% 12.3% 0.76 5.9% 0.39 19.2% 36.2 0.07%
RA Momentum Factor US Index 12.0% 14.0% 0.67 4.6% 0.52 90.2% 4.0 0.62%
RAFI US Index 11.5% 14.9% 0.60 5.1% 0.39 11.8% 192.3 0.01%
Russell 1000 Index 9.6% 14.4% 0.49
RAFI Size Factor US Index 12.6% 16.4% 0.61 5.4% 0.55 53.3% 3.7 0.67%
Russell 2000 Index 9.6% 18.7% 0.38
United States
6/1992–3/2017
Alpha
(Annual)
Beta
(Mkt-Rf)
Size
(SMB)
Value
(HML)
Profitability
(RMW)
Investment
(CMA)
Momentum
(WML)
Low Beta
(BAB)
RAFI Dynamic Multi-Factor US Index 0.6% 0.93 0.13 0.03 0.06 0.19 0.05 0.13
RAFI Multi-Factor US Index 0.3% 0.93 0.13 0.04 0.08 0.17 0.02 0.14
RAFI Value Factor US Index 0.2% 0.99 0.18 0.20 0.10 0.39 -0.09 0.17
RAFI Low Volatility Factor US Index 0.2% 0.74 0.03 0.04 0.03 0.18 -0.08 0.40
RAFI Quality Factor US Index 0.6% 0.90 -0.03 -0.07 0.20 0.33 -0.06 0.14
RA Momentum Factor US Index 0.8% 1.00 -0.06 0.04 0.06 -0.03 0.21 -0.03
RAFI Size Factor US Index 0.5% 0.99 0.58 -0.02 0.06 0.00 0.09 0.08
RAFI US Index 0.1% 0.97 0.00 0.17 0.08 0.24 -0.09 0.10

26
Performance and Characteristics
Source: Research Affiliates, LLC, using data from Solactive, CRSP, Compustat, Worldscope, and Datastream. The RAFI Multi-Factor Developed Indices were launched on 3/31/2017. Data prior to launch is simulated. One-way turnover data is for the period 1993 –2016. Capacity and transaction cost estimates are as of 12/31/2016.
Results – Developed
Factor Regression
Developed
6/1992-3/2017
Annualized
Return
Annualized
Volatility
Sharpe
Ratio
Tracking
Error
Information
Ratio
One-Way
Turnover
Capacity
$B
Cost at
$5B
RAFI Dynamic Multi-Factor Dev Index 10.6% 13.1% 0.61 3.8% 0.75 52.8% 26.6 0.09%
RAFI Multi-Factor Dev Index 10.5% 13.1% 0.60 3.7% 0.76 41.1% 35.7 0.07%
RAFI Value Factor Dev Index 12.2% 14.9% 0.64 5.8% 0.77 24.3% 26.0 0.10%
RAFI Low Volatility Factor Dev Index 10.7% 11.2% 0.73 6.9% 0.43 20.0% 43.9 0.06%
RAFI Quality Factor Dev Index 10.6% 12.6% 0.63 4.3% 0.67 22.1% 44.6 0.06%
RA Momentum Factor Dev Index 9.2% 14.0% 0.48 3.9% 0.39 94.8% 6.3 0.40%
RAFI Size Factor Dev Index 10.7% 15.3% 0.53 6.6% 0.45 56.3% 3.6 0.69%
RAFI Developed Index 9.9% 14.2% 0.52 3.6% 0.62 12.3% 227.3 0.01%
MSCI World Index 7.7% 14.5% 0.35
Developed
6/1992–3/2017
Alpha
(Annual)
Beta
(Mkt-Rf)
Size
(SMB)
Value
(HML)
Profitability
(RMW)
Investment
(CMA)
Momentum
(WML)
Low Beta
(BAB)
RAFI Dynamic Multi-Factor Dev Index 0.2% 0.95 0.16 0.08 0.13 0.07 0.08 0.08
RAFI Multi-Factor Dev Index 0.2% 0.95 0.16 0.08 0.15 0.06 0.04 0.09
RAFI Value Factor Dev Index 1.0% 1.03 0.29 0.29 0.25 0.15 -0.06 -0.01
RAFI Low Volatility Factor Dev Index 1.4% 0.76 0.03 0.00 -0.06 0.11 -0.07 0.38
RAFI Quality Factor Dev Index 0.5% 0.92 0.03 0.02 0.31 0.14 -0.03 0.10
RA Momentum Factor Dev Index -0.8% 0.99 -0.10 0.06 0.10 -0.03 0.22 0.00
RAFI Size Factor Dev Index 0.3% 1.01 0.66 0.03 0.15 -0.03 0.09 0.01
RAFI Developed Index 0.5% 0.98 0.01 0.25 0.06 0.08 -0.07 0.01

27
Performance and Characteristics
Source: Research Affiliates, LLC, using data from Solactive, CRSP, Compustat, Worldscope, and Datastream. The RAFI Multi-Factor Developed ex-U.S. indices were launched on 1/31/2017. Data prior to launch is simulated. One-way turnover data is for the period 1993 – 2016. Capacity and transaction cost estimates are as of 12/31/2016.
Results – Developed ex-US
Factor Regression
Developed ex US
6/1992–3/2017
Annualized
Return
Annualized
Volatility
Sharpe
Ratio
Tracking
Error
Information
Ratio
One-Way
Turnover
Capacity
$B
Cost at
$5B
RAFI Dynamic Multi-Factor DxUS Index 9.5% 14.6% 0.47 3.9% 0.86 53.1% 11.6 0.22%
RAFI Multi-Factor DxUS Index 9.4% 14.7% 0.47 3.8% 0.87 41.9% 15.2 0.16%
RAFI Value Factor DxUS Index 11.0% 16.5% 0.51 5.6% 0.87 26.0% 9.5 0.26%
RAFI Low Volatility Factor DxUS Index 9.8% 12.7% 0.57 6.7% 0.55 22.0% 20.2 0.12%
RAFI Quality Factor DxUS Index 9.5% 14.5% 0.48 4.1% 0.83 22.6% 20.5 0.12%
RA Momentum Factor DxUS Index 8.4% 15.2% 0.38 4.2% 0.56 97.1% 2.8 0.91%
RAFI Size Factor DxUS Index 9.1% 16.3% 0.40 6.5% 0.46 55.7% 1.7 1.44%
RAFI Developed ex US Index 8.5% 16.0% 0.37 3.3% 0.72 12.8% 178.6 0.01%
MSCI World ex US Index 6.1% 16.2% 0.22
Developed ex US
6/1992–3/2017
Alpha
(Annual)
Beta
(Mkt-Rf)
Size
(SMB)
Value
(HML)
Profitability
(RMW)
Investment
(CMA)
Momentum
(WML)
Low Beta
(BAB)
RAFI Dynamic Multi-Factor DxUS Index 0.6% 0.97 0.12 0.12 0.08 0.02 0.10 0.06
RAFI Multi-Factor DxUS Index 0.7% 0.97 0.12 0.15 0.10 0.00 0.06 0.06
RAFI Value Factor DxUS Index 1.3% 0.97 0.16 0.41 0.23 0.11 0.00 -0.08
RAFI Low Volatility Factor DxUS Index 1.3% 0.96 0.04 0.08 -0.04 0.04 -0.06 0.36
RAFI Quality Factor DxUS Index 1.0% 0.96 0.02 0.11 0.21 0.02 0.01 0.09
RA Momentum Factor DxUS Index -0.1% 0.94 -0.10 0.10 -0.04 -0.06 0.26 -0.03
RAFI Size Factor DxUS Index 0.9% 1.00 0.62 0.03 0.13 -0.05 0.07 0.01
RAFI Developed ex US Index 0.9% 0.96 0.00 0.26 0.05 0.01 -0.05 -0.03

28
Performance and Characteristics
Source: Research Affiliates, LLC, using data from Solactive, CRSP, Compustat, Worldscope, and Datastream. The RAFI Multi-Factor Global indices were launched on 3/31/2017. Data prior to launch is simulated. One-way turnover data is for the period 1993 – 2016. Capacity and transaction cost estimates are as of 12/31/2016.
Results – Global
Factor Regression
Global
6/2007-3/2017
Annualized
Return
Annualized
Volatility
Sharpe
Ratio
Tracking
Error
Information
Ratio
One-Way
Turnover
Capacity
$B
Cost at
$5B
RAFI Dynamic Multi-Factor Global Index 5.5% 16.2% 0.30 2.5% 0.64 56.4% 27.8 0.09%
RAFI Multi-Factor Global Index 5.4% 16.3% 0.30 2.1% 0.74 43.0% 36.8 0.07%
RAFI Value Factor Global Index 5.6% 18.6% 0.27 4.2% 0.43 26.8% 22.3 0.11%
RAFI Low Volatility Factor Global Index 6.1% 13.1% 0.42 6.3% 0.35 20.8% 36.2 0.07%
RAFI Quality Factor Global Index 6.3% 15.9% 0.36 2.7% 0.92 24.0% 41.0 0.06%
RA Momentum Factor Global Index 4.1% 16.4% 0.22 3.6% 0.06 93.9% 6.5 0.38%
RAFI Size Factor Developed Index 5.3% 18.4% 0.26 4.6% 0.32 58.6% 3.6 0.69%
RAFI Global Index 4.5% 17.6% 0.22 2.6% 0.23 11.7% 108.7 0.02%
MSCI All Country World Index 3.9% 17.1% 0.19
Global
6/2007–3/2017
Alpha
(Annual)
Beta
(Mkt-Rf)
Size
(SMB)
Value
(HML)
Profitability
(RMW)
Investment
(CMA)
Momentum
(WML)
Low Beta
(BAB)
RAFI Dynamic Multi-Factor Global Index -0.1% 0.98 0.05 -0.01 0.12 0.22 0.09 0.02
RAFI Multi-Factor Global Index -0.1% 0.98 0.06 -0.02 0.15 0.20 0.05 0.02
RAFI Value Factor Global Index 0.8% 1.06 0.23 0.10 0.15 0.38 0.01 -0.22
RAFI Low Volatility Global Index -0.8% 0.78 -0.10 -0.07 0.02 0.29 -0.13 0.50
RAFI Quality Factor Global Index 0.2% 0.98 -0.06 -0.07 0.33 0.23 0.01 0.00
RA Momentum Factor Global Index -1.0% 1.01 -0.10 0.02 0.14 0.01 0.23 -0.01
RAFi Size Factor Developed Index 1.2% 1.03 0.43 -0.13 -0.08 0.15 0.13 -0.12
RAFI Global Index 0.1% 1.00 -0.07 0.20 0.03 0.20 -0.06 -0.05

29
Performance and Characteristics
Source: Research Affiliates, LLC, using data from Solactive, CRSP, Compustat, Worldscope, and Datastream. The RAFI Multi-Factor Emerging Market indices were launched on 1/31/2017. Data prior to launch is simulated. One-way turnover data is for the period 1993 – 2016. Capacity and transaction cost estimates are as of 12/31/2016.
Results – Emerging Markets
Emerging Markets
6/2007–3/2017
Annualized
Return
Annualized
Volatility
Sharpe
Ratio
Tracking
Error
Information
Ratio
One-Way
Turnover
Capacity
$B
Cost at
$5B
RAFI Dynamic Multi-Factor EM Index 4.7% 23.0% 0.18 3.9% 0.68 53.0% 3.0 0.83%
RAFI Multi-Factor EM Index 4.8% 23.1% 0.18 3.8% 0.70 45.3% 3.8 0.65%
RAFI Value Factor EM Index 6.2% 26.4% 0.22 8.6% 0.48 21.4% 4.8 0.52%
RAFI Low Volatility EM Index 6.1% 19.1% 0.29 8.4% 0.47 22.2% 5.8 0.43%
RAFI Quality Factor EM Index 4.1% 23.6% 0.15 5.2% 0.38 22.4% 5.7 0.44%
RA Momentum Factor EM Index 3.4% 23.3% 0.12 5.3% 0.23 95.2% 0.8 3.17%
RAFI Emerging Markets Index 4.1% 24.6% 0.15 4.8% 0.42 16.2% 34.2 0.07%
MSCI Emerging Markets Index 2.1% 23.6% 0.07
Factor Regression
Emerging Markets
6/2007–3/2017
Alpha
(Annual)
Beta
(Mkt-Rf)
Size
(SMB)
Value
(HML)
Profitability
(RMW)
Investment
(CMA)
Momentum
(WML)
Low Beta
(BAB)
RAFI Dynamic Multi-Factor EM Index -0.3% 0.99 -0.07 0.10 0.06 0.24 0.10 -0.04
RAFI Multi-Factor EM Index -0.3% 0.99 -0.06 0.12 0.07 0.21 0.09 -0.04
RAFI Value Factor EM Index -0.2% 0.98 0.16 0.46 0.25 0.32 0.00 -0.23
RAFI Low Volatility EM Index 2.5% 0.80 -0.08 -0.07 -0.19 0.32 0.02 -0.02
RAFI Quality Factor EM Index -0.6% 1.01 -0.32 -0.02 0.17 0.33 -0.04 -0.04
RA Momentum Factor EM Index -1.8% 1.05 -0.08 0.02 0.01 0.14 0.33 0.03
RAFI Emerging Markets Index -1.1% 1.00 -0.13 0.34 0.10 0.27 -0.13 -0.06

30
» Uses robust single-factor strategies.
» Diversifies allocations to individual factors:
» Balanced factor exposures
» Low tracking error/high information ratio
» Ability to weather sharp or prolonged downturns of any single
factor
» Systematic approach spares investors from performance chasing.
Summary

31
Appendix

32
3/31/2017# of
SecuritiesP/E P/B P/S P/CF
Dividend
Yield
Weighted Avg.
Mkt. Cap ($B)
RAFI Dynamic Multi-Factor Global Index 3522 17.5 1.9 0.9 8.2 2.6% 54.7
RAFI Multi-Factor Global Index 3626 17.5 1.9 1.0 8.3 2.6% 56.1
RAFI Value Factor Global Index 827 13.9 1.2 0.5 5.6 2.5% 32.5
RAFI Low Volatility Factor Global Index 985 18.0 2.2 1.2 9.3 2.8% 68.7
RAFI Quality Factor Global Index 805 18.0 2.7 1.2 9.1 2.9% 70.8
RA Momentum Factor Global Index 1105 18.4 2.0 1.4 8.8 2.5% 86.5
RAFI Global Index 2594 16.4 1.5 1.0 7.1 2.8% 83.8
RAFI Dynamic Multi-Factor Developed Index 3052 18.7 2.0 1.0 9.0 2.6% 57.7
RAFI Multi-Factor Developed Index 3134 18.7 2.0 1.0 9.1 2.6% 59.0
RAFI Value Factor Developed Index 653 15.6 1.3 0.5 6.2 2.5% 35.5
RAFI Low Volatility Factor Developed Index 648 19.2 2.5 1.2 10.4 2.9% 78.0
RAFI Quality Factor Developed Index 579 19.3 3.0 1.2 9.7 2.8% 77.9
RA Momentum Factor Developed Index 847 19.9 2.1 1.5 10.4 2.5% 90.0
RAFI Size Factor Developed Index 1981 19.2 2.1 1.1 10.2 2.1% 4.5
RAFI Developed Index 1766 17.7 1.6 1.0 7.9 2.8% 89.8
RAFI Dynamic Multi-Factor Dev. ex US Index 2147 17.6 1.6 0.9 8.0 2.9% 32.8
RAFI Multi-Factor Developed ex US Index 2152 17.3 1.5 0.8 7.8 2.9% 32.1
RAFI Value Factor Developed ex US Index 312 14.0 0.8 0.4 4.9 2.7% 26.4
RAFI Low Volatility Factor Dev. ex US Index 461 17.7 1.8 1.0 8.8 3.2% 34.3
RAFI Quality Factor Developed ex US Index 361 18.1 2.2 1.1 8.8 3.1% 41.9
RA Momentum Factor Developed ex US Index 582 19.1 1.7 1.2 9.1 3.0% 48.8
RAFI Size Factor Developed ex US Index 1225 16.8 1.6 0.9 9.6 2.6% 3.7
RAFI Developed ex US Index 1238 16.5 1.3 0.8 6.6 3.3% 48.6
Global
Developed
Developed ex US
Source: Research Affiliates, LLC, using data from Solactive and Factset.
Characteristics

33
3/31/2017# of
SecuritiesP/E P/B P/S P/CF
Dividend
Yield
Weighted Avg.
Mkt. Cap ($B)
RAFI Dynamic Multi-Factor US Index 947 20.1 2.8 1.3 10.8 2.4% 92.8
RAFI Multi-Factor US Index 947 20.0 2.7 1.2 10.4 2.4% 90.2
RAFI Value Factor US Index 112 16.7 1.6 0.7 7.0 2.6% 63.2
RAFI Low Volatility Factor US Index 113 18.8 3.6 1.2 11.2 2.7% 113.6
RAFI Quality Factor US Index 123 19.7 5.8 2.1 13.0 2.5% 142.4
RA Momentum Factor US Index 228 22.9 3.2 2.2 13.0 2.2% 131.6
RAFI Size Factor US Index 549 22.0 2.3 1.1 10.4 2.0% 5.4
RAFI US Index 528 19.1 2.3 1.4 10.0 2.3% 134.6
RAFI Dynamic Multi-Factor EM Index 574 11.5 1.1 0.7 4.7 2.8% 29.3
RAFI Multi-Factor EM Index 574 11.6 1.1 0.7 4.9 2.8% 32.3
RAFI Value Factor EM Index 145 8.7 0.7 0.4 3.3 3.2% 13.7
RAFI Low Volatility EM Index 266 9.8 1.0 0.7 5.4 3.8% 12.4
RAFI Quality Factor EM Index 207 10.7 1.3 1.2 5.7 3.9% 26.9
RA Momentum Factor EM Index 252 14.6 1.8 1.2 5.8 2.2% 68.4
RAFI Emerging Markets Index 828 10.9 1.1 0.8 4.2 2.9% 41.8
United States
Emerging Markets
Source: Research Affiliates, LLC, using data from Solactive and Factset.
Characteristics (cont.)

34Source: Research Affiliates, LLC, using data from CRSP, Compustat, Worldscope, Datastream and Factset. The RAFI Dynamic Multi-Factor Global Index was launched on 3/31/2017. Data prior to launch is simulated. Please see important disclosure information at end.
Factor Allocation Over Time – Global
0%
10%
20%
30%
40%
50%
60%
70%
80%
90%
100%
2007 2008 2009 2010 2011 2012 2013 2014 2015 2016
Po
rtfo
lio
Co
mp
osi
tio
nRAFI Dynamic Multi-Factor Global Index
(4/2007 - 3/2017)
Value Low Volatility Quality Momentum Size
35
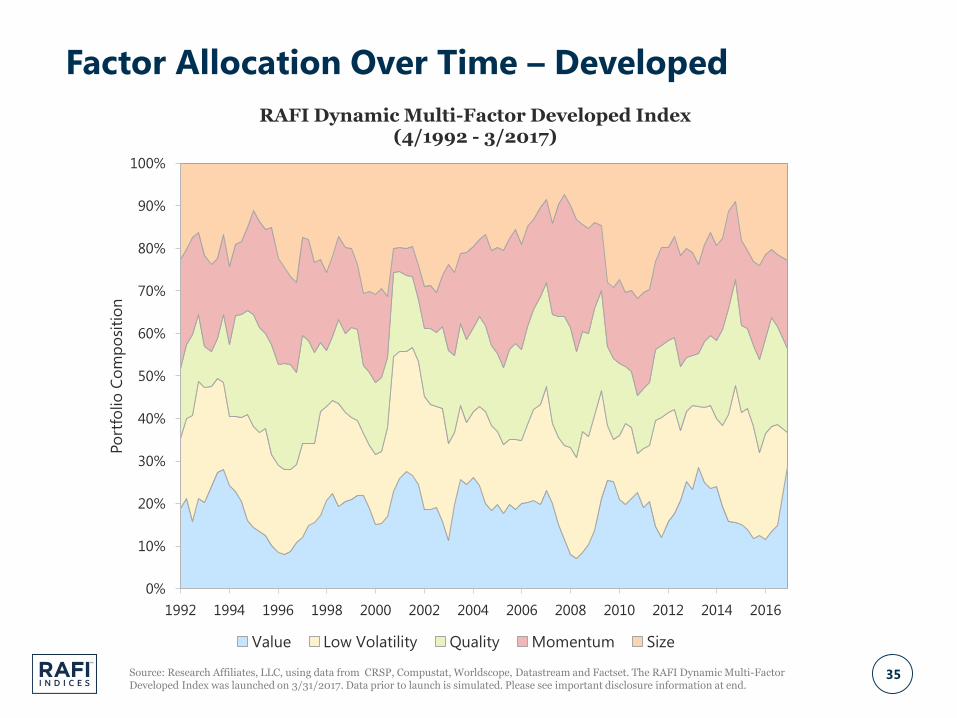
Factor Allocation Over Time – Developed
Source: Research Affiliates, LLC, using data from CRSP, Compustat, Worldscope, Datastream and Factset. The RAFI Dynamic Multi-Factor Developed Index was launched on 3/31/2017. Data prior to launch is simulated. Please see important disclosure information at end.
0%
10%
20%
30%
40%
50%
60%
70%
80%
90%
100%
1992 1994 1996 1998 2000 2002 2004 2006 2008 2010 2012 2014 2016
Po
rtfo
lio
Co
mp
osi
tio
nRAFI Dynamic Multi-Factor Developed Index
(4/1992 - 3/2017)
Value Low Volatility Quality Momentum Size

36
Factor Allocation Over Time – Developed ex US
Source: Research Affiliates, LLC, using data from CRSP, Compustat, Worldscope, Datastream and Factset. The RAFI Dynamic Multi-Factor Developed ex US Index was launched on 1/31/2017. Data prior to launch is simulated. Please see important disclosure information at end.
0%
10%
20%
30%
40%
50%
60%
70%
80%
90%
100%
1992 1994 1996 1998 2000 2002 2004 2006 2008 2010 2012 2014 2016
Po
rtfo
lio
Co
mp
osi
tio
nRAFI Dynamic Multi-Factor Developed ex US Index
(6/1992 - 3/2017)
Value Low Volatility Quality Momentum Size

37Source: Research Affiliates, LLC, using data from CRSP, Compustat, Worldscope, Datastream and Factset. The RAFI Dynamic Multi-Factor Emerging Markets Index was launched on 1/31/2017. Data prior to launch is simulated. Please see important disclosure information at end.
Factor Allocation Over Time – Emerging Markets
0%
10%
20%
30%
40%
50%
60%
70%
80%
90%
100%
2007 2008 2009 2010 2011 2012 2013 2014 2015 2016
Po
rtfo
lio
Co
mp
osi
tio
nRAFI Dynamic Multi-Factor Emerging Markets Index
(6/2007 - 3/2017)
Value Low Volatility Quality Momentum
38
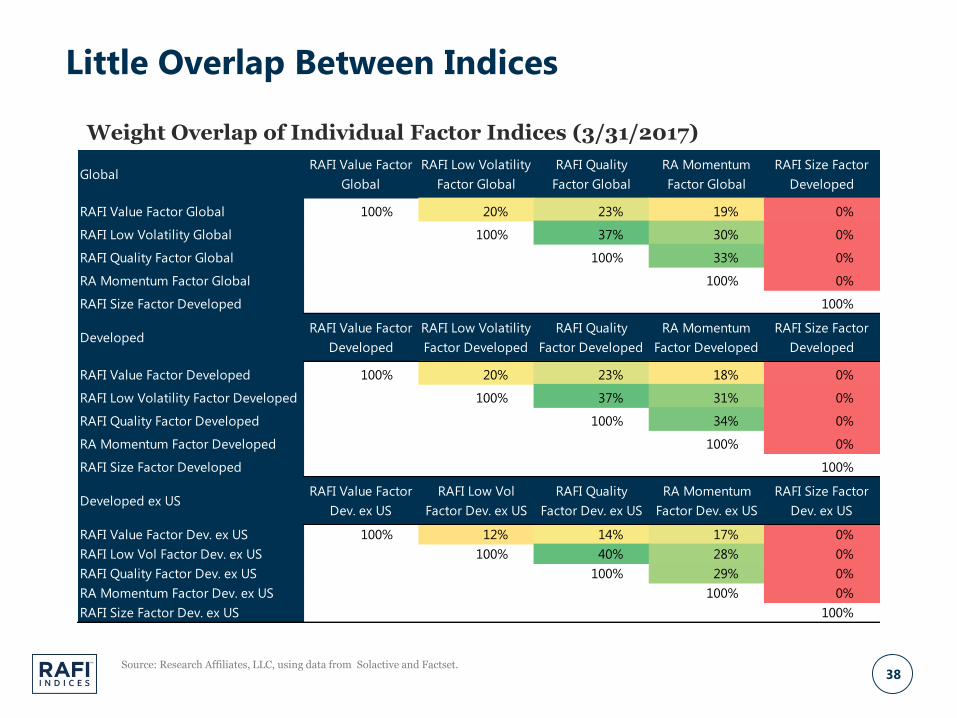
GlobalRAFI Value Factor
Global
RAFI Low Volatility
Factor Global
RAFI Quality
Factor Global
RA Momentum
Factor Global
RAFI Size Factor
Developed
RAFI Value Factor Global 100% 20% 23% 19% 0%
RAFI Low Volatility Global 100% 37% 30% 0%
RAFI Quality Factor Global 100% 33% 0%
RA Momentum Factor Global 100% 0%
RAFI Size Factor Developed 100%
DevelopedRAFI Value Factor
Developed
RAFI Low Volatility
Factor Developed
RAFI Quality
Factor Developed
RA Momentum
Factor Developed
RAFI Size Factor
Developed
RAFI Value Factor Developed 100% 20% 23% 18% 0%
RAFI Low Volatility Factor Developed 100% 37% 31% 0%
RAFI Quality Factor Developed 100% 34% 0%
RA Momentum Factor Developed 100% 0%
RAFI Size Factor Developed 100%
Developed ex USRAFI Value Factor
Dev. ex US
RAFI Low Vol
Factor Dev. ex US
RAFI Quality
Factor Dev. ex US
RA Momentum
Factor Dev. ex US
RAFI Size Factor
Dev. ex US
RAFI Value Factor Dev. ex US 100% 12% 14% 17% 0%
RAFI Low Vol Factor Dev. ex US 100% 40% 28% 0%
RAFI Quality Factor Dev. ex US 100% 29% 0%
RA Momentum Factor Dev. ex US 100% 0%
RAFI Size Factor Dev. ex US 100%
Source: Research Affiliates, LLC, using data from Solactive and Factset.
Weight Overlap of Individual Factor Indices (3/31/2017)
Little Overlap Between Indices

39
United StatesRAFI Value Factor
US
RAFI Low Volatility
Factor US
RAFI Quality
Factor US
RA Momentum
Factor US
RAFI Size Factor
US
RAFI Value Factor US 100% 17% 13% 13% 0%
RAFI Low Volatility Factor US 100% 43% 33% 0%
RAFI Quality Factor US 100% 31% 0%
RA Momentum Factor US 100% 0%
RAFI Size Factor US 100%
Emerging MarketsRAFI Value Factor
EM
RAFI Low Volatility
Factor EM
RAFI Quality
Factor EM
RA Momentum
Factor EM
RAFI Value Factor EM 100% 18% 21% 13%
RAFI Low Volatility Factor EM 100% 29% 15%
RAFI Quality Factor EM 100% 28%
RA Momentum Factor EM 100%
Source: Research Affiliates, LLC, using data from Solactive and Factset.
Weight Overlap of Individual Factor Indices (3/31/2017)
Little Overlap Between Indices (cont.)

40
Global (6/2007–3/2017)RAFI Value Factor
Global
RAFI Low Volatility
Factor Global
RAFI Quality Factor
Global
RA Momentum
Factor Global
RAFI Size Factor
Developed
RAFI Value Factor Global 1.00 -0.28 -0.06 -0.27 0.46
RAFI Low Volatility Factor Global 1.00 0.54 0.31 -0.23
RAFI Quality Factor Global 1.00 0.56 -0.10
RA Momentum Factor Global 1.00 0.08
RAFI Size Factor Developed 1.00
Developed (6/1992–3/2017)RAFI Value Factor
Developed
RAFI Low Volatility
Factor Developed
RAFI Quality Factor
Developed
RA Momentum
Factor Developed
RAFI Size Factor
Developed
RAFI Value Factor Developed 1.00 0.49 0.53 0.00 0.47
RAFI Low Volatility Factor Developed 1.00 0.76 0.25 0.22
RAFI Quality Factor Developed 1.00 0.28 0.21
RA Momentum Factor Developed 1.00 0.33
RAFI Size Factor Developed 1.00
Developed ex US (6/1992–3/2017)RAFI Value Factor
Dev ex US
RAFI Low Vol
Factor Dev ex US
RAFI Quality Factor
Dev ex US
RA Momentum
Factor Dev ex US
RAFI Size Factor
Dev ex US
RAFI Value Factor Dev ex-US 1.00 0.38 0.49 0.15 0.51
RAFI Low Volatility Factor Dev ex-US 1.00 0.74 0.41 0.37
RAFI Quality Factor Dev ex-US 1.00 0.54 0.39
RA Momentum Factor Dev ex-US 1.00 0.28
RAFI Size Factor Dev ex-US 1.00
Source: Research Affiliates, LLC, using data from Factset, Solactive, Worldscope and Datastream. Correlation of excess returns is relative to the following benchmarks: MSCI All Country World for Global, MSCI World for Developed, MSCI World ex-US for Developed ex-US. The launch date for all Developed ex-US indices is 1/31/2017. The launch date for all Global and Developed Indices is 3/31/2017. Performance prior to launch is simulated. Please see important disclosure information at end.
Correlation of Excess Returns
Low Correlation of Excess Returns
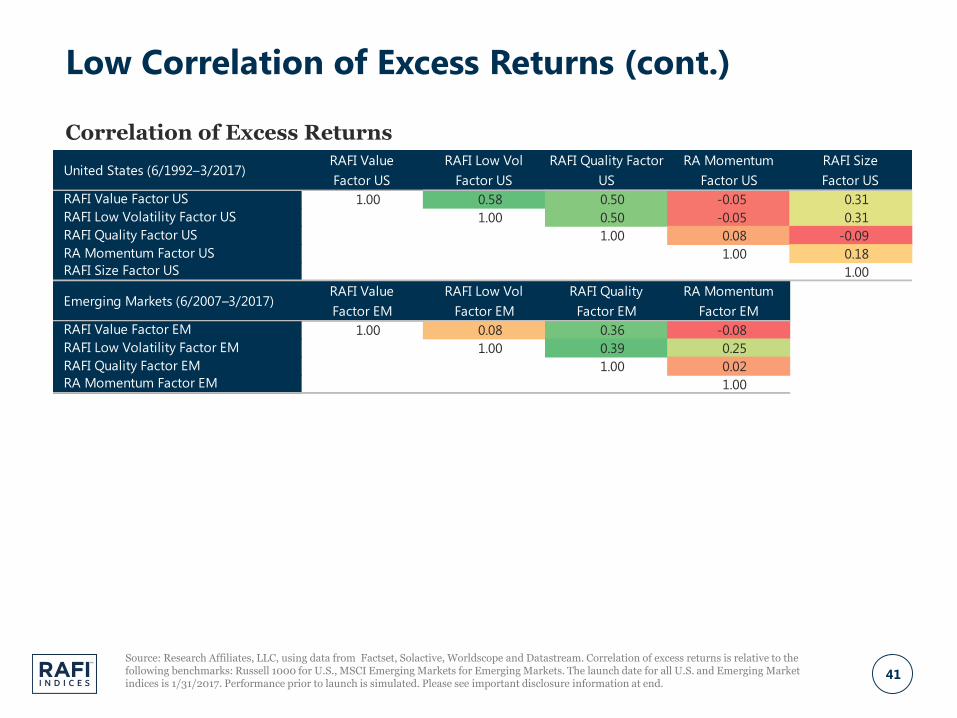
41
United States (6/1992–3/2017)RAFI Value
Factor US
RAFI Low Vol
Factor US
RAFI Quality Factor
US
RA Momentum
Factor US
RAFI Size
Factor US
RAFI Value Factor US 1.00 0.58 0.50 -0.05 0.31
RAFI Low Volatility Factor US 1.00 0.50 -0.05 0.31
RAFI Quality Factor US 1.00 0.08 -0.09
RA Momentum Factor US 1.00 0.18
RAFI Size Factor US 1.00
Emerging Markets (6/2007–3/2017)RAFI Value
Factor EM
RAFI Low Vol
Factor EM
RAFI Quality
Factor EM
RA Momentum
Factor EM
RAFI Value Factor EM 1.00 0.08 0.36 -0.08
RAFI Low Volatility Factor EM 1.00 0.39 0.25
RAFI Quality Factor EM 1.00 0.02
RA Momentum Factor EM 1.00
Source: Research Affiliates, LLC, using data from Factset, Solactive, Worldscope and Datastream. Correlation of excess returns is relative to the following benchmarks: Russell 1000 for U.S., MSCI Emerging Markets for Emerging Markets. The launch date for all U.S. and Emerging Market indices is 1/31/2017. Performance prior to launch is simulated. Please see important disclosure information at end.
Correlation of Excess Returns
Low Correlation of Excess Returns (cont.)
42
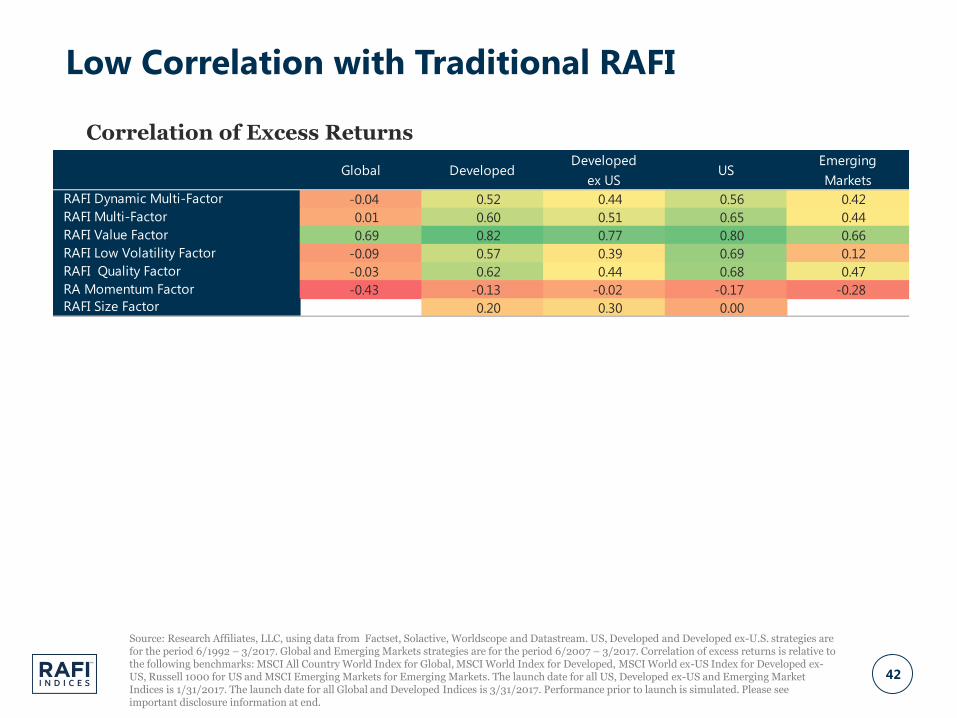
Global DevelopedDeveloped
ex USUS
Emerging
Markets
RAFI Dynamic Multi-Factor -0.04 0.52 0.44 0.56 0.42
RAFI Multi-Factor 0.01 0.60 0.51 0.65 0.44
RAFI Value Factor 0.69 0.82 0.77 0.80 0.66
RAFI Low Volatility Factor -0.09 0.57 0.39 0.69 0.12
RAFI Quality Factor -0.03 0.62 0.44 0.68 0.47
RA Momentum Factor -0.43 -0.13 -0.02 -0.17 -0.28
RAFI Size Factor 0.20 0.30 0.00
Source: Research Affiliates, LLC, using data from Factset, Solactive, Worldscope and Datastream. US, Developed and Developed ex-U.S. strategies are for the period 6/1992 – 3/2017. Global and Emerging Markets strategies are for the period 6/2007 – 3/2017. Correlation of excess returns is relative to the following benchmarks: MSCI All Country World Index for Global, MSCI World Index for Developed, MSCI World ex-US Index for Developed ex-US, Russell 1000 for US and MSCI Emerging Markets for Emerging Markets. The launch date for all US, Developed ex-US and Emerging Market Indices is 1/31/2017. The launch date for all Global and Developed Indices is 3/31/2017. Performance prior to launch is simulated. Please see important disclosure information at end.
Correlation of Excess Returns
Low Correlation with Traditional RAFI

43
www.rafi.com
Thank You

44
By accepting this document you agree to keep its contents confidential. You also agree not to
disclose the contents of this document to third parties (including potential co-investors) without
the prior written permission of RAFI Indices, LLC (including its related entities).
The material contained in this document is for information purposes only. This material is not
intended as an offer or solicitation for the purchase or sale of any security or financial instrument,
nor is it advice or a recommendation to enter into any transaction. Any offer to sell or a
solicitation of an offer to buy or sell shall be made solely by the legally permitted entity
registered or licensed with the applicable regulator(s) and only to qualified investors through a
regulatory registration statement or subject to an applicable exemption and disclosure document
such as a private placement memorandum for pooled investment vehicles, or investment
management agreement for separately managed accounts. The information contained herein
should not be construed as financial or investment advice on any subject matter. RAFI Indices,
LLC and its related entities do not warrant the accuracy of the information provided herein, either
expressed or implied, for any particular purpose.
The index data published herein may be simulated and in such instances, no allowance has been
made for trading costs, management fees, or other costs, are not indicative of any specific
investment, are unmanaged and cannot be invested in directly. Past performance, including
simulated performance, is no guarantee of future performance and actual index results may
differ. Any information and data pertaining to an index contained in this document relate only to
the index itself and not to any asset management product based on the index.
Investors should be aware of the risks associated with data sources and quantitative processes
used in the creation of the index related data. Errors may exist in data acquired from third party
vendors, the construction of indices, and in coding related to the index construction process.
While RAFI Indices, LLC and its related entities take steps to identify data and process errors so as
to minimize the potential impact of such errors on index performance, they cannot guarantee
that such errors will not occur.
Frank Russell Company is the source and owner of the Russell index data contained or reflected
in this material and copyrights related thereto. Frank Russell Company and Research Affiliates,
LLC have entered into a strategic alliance with respect to the Russell RAFI Indexes. The Russell
RAFI Indexes are calculated by Russell in conjunction with Research Affiliates LLC. All intellectual
property rights in the Russell RAFI Indexes (the “Index”) vest in Russell and RA. Neither Russell
nor RA or their licensors accept any liability for any errors or omissions in the Index and / or
Index ratings or underlying data. No further distribution of Russell Data is permitted without
Russell’s express written consent. Russell® is a trademark of Frank Russell Company. Research
Affiliates, LLC is the owner of the trademarks, service marks, patents and copyrights related to the
Fundamental Index and the Fundamental Index methodology. The presentation may contain
confidential information and unauthorized use, disclosure, copying, dissemination, or
redistribution is strictly prohibited. This is a presentation of Research Affiliates, LLC. Frank Russell
Company is not responsible for the formatting or configuration of this material or for any
inaccuracy in Research Affiliates’ presentation thereof.
Copyright MSCI. All Rights Reserved. Without prior written permission of MSCI, this information
and any other MSCI intellectual property may only be used for your internal use, may not be
reproduced or redisseminated in any form and may not be used to create any financial
instruments or products or any indices. This information is provided on an “as is” basis, and the
user of this information assumes the entire risk of any use made of this information. Neither
MSCI nor any third party involved in or related to the computing or compiling of the data makes
any express or implied warranties, representations or guarantees concerning the MSCI index-
related data, and in no event will MSCI or any third party have any liability for any direct, indirect,
special, punitive, consequential or any other damages (including lost profits) relating to any use
of this information.
The trademarks Fundamental Index™, RAFI™, Research Affiliates Equity™, RAE™, and the Research
Affiliates™ trademark and corporate name and all related logos are the exclusive intellectual
property of Research Affiliates, LLC and in some cases are registered trademarks in the U.S. and
other countries. The RAFI trademark is used under license by RAFI Indices, LLC. The RAFI Indices,
LLC corporate name and all related logos are the exclusive intellectual property of RAFI Indices,
LLC.
Various features of the Fundamental Index™ methodology, including an accounting data-based
non-capitalization data processing system and method for creating and weighting an index of
securities, are protected by various patents, and patent-pending intellectual property of Research
Affiliates, LLC. (See all applicable US Patents, Patent Publications, Patent Pending intellectual
property and protected trademarks located at https://www.researchaffiliates.com/en_us/about-
us/legal.html#d, which are fully incorporated herein.) Any use of these trademarks, logos,
patented or patent pending methodologies without the prior written permission of Research
Affiliates, LLC, is expressly prohibited. Research Affiliates, LLC, reserves the right to take any and
all necessary action to preserve all of its rights, title, and interest in and to these marks, patents or
pending patents.
RAFI Indices, LLC is a wholly owned subsidiary of Research Affiliates Global Holdings, LLC and
does not offer or provide investment advice or offer or sell any securities, commodities or
derivative instruments or products. Any such business may only be conducted through registered
or licensed entities and individuals permitted to do so within the respective jurisdiction and only
in conjunction with the legally required disclosure documents and subject to the all legally
required regulatory filings.
RAFI Indices, LLC, its affiliates, agents, and each of their respective officers, directors, employees,
agents, representatives and licensors (collectively “RI”) shall not be liable to any third party for
any loss or damage, direct, indirect or consequential, arising from or related to (i) any inaccuracy
or incompleteness in, errors or omissions in the enclosed information (the “Presentation
Material”) or (ii) any decision made or action taken by any third party in reliance upon the
Presentation Material. RI does not make any warranties, express or implied, to anyone regarding
the Presentation Material, including, without limitation, any warranties with respect to the
timeliness, sequence, accuracy, completeness, currentness, merchantability, quality or fitness for a
particular purpose or any warranties as to the results to be obtained by any third-party in
connection with the use of the Presentation Material. RI shall not be liable to anyone for loss of
business revenues, lost profits or any indirect, consequential, special or similar damages
whatsoever, whether in contract, tort or otherwise, even if advised of the possibility of such
damages.
© 2017 RAFI Indices, LLC. All rights reserved. Duplication or dissemination prohibited without
prior written permission.
Important Information

![Duo Multi-Factor Authentication (MFA) · Multi-Factor Authentication (MFA) Documentation: FAQs [1] Duo Multi-Factor Authentication (MFA): Frequently Asked Questions (FAQs) What is](https://img.pdfslide.net/doc/110x75/5b65cd517f8b9a6e1f8c5f4e/duo-multi-factor-authentication-mfa-multi-factor-authentication-mfa-documentation.jpg)