Embed Size (px)
Citation preview
Statistical Release 27 July 2017
Rail passenger numbers and crowding on weekdays in major cities in England and Wales: 2016
About this releaseThis publication provides informationon the number of passengerstravelling by rail intoand out of major city centres in England and Wales.
The statistics are based on passenger counts carriedout by franchised train operators in autumn 2016. Theyrepresent passenger numbers on National Rail services on a ‘typical’ weekday.
More informationis available in the accompanying notes
document.
How is crowding measured?The main measure of crowding in these statistics is ‘Passengers in excess of capacity’ or PiXC. It shows the percentage of standard class passengers above a service’s capacity at its busiest point.
Whilst the number of rail passengers grew between 2015 and 2016,there was slightly less crowding overall on trains into major cities in the morning peak, but more crowding overall in the afternoon peak.
London Kings C
ross
Passenger Numbers• With the exceptions of Birmingham and Liverpool, rail demand has
grown at all the major cities included in this release.• In 2016, 583 thousand passengers arrived into central London during
a typical weekday morning peak. This compares with 42 thousand at Birmingham, the second busiest city.
• Morning peak passengers arriving into central London have increasedeach year since 2010.
Crowding• Morning peak crowding was highest in London (5.7%), followed by
Manchester (3.5%) and Leeds (2.7%).• Crowding on train services was generally worse during the morning peak
than the afternoon peak.• Blackfriars had the highest crowding level of all central London stations,
while Fenchurch Street had a higher percentage of standing passengers.• Almost 150 thousand passengers were standing at trains’ busiest points
on arrival into central London in the 3-hour morning peak. Nearly two-thirds of all services in the morning peak had standing passengers.
Main results
RESPONSIBLE STATISTICIAN: Nicholas Peluffo ([email protected])
FURTHER INFORMATION: Media: 020 7944 4459; Public: 020 7944 2419
Contents
Section 1: Rail passenger usage
1. Introduction 2. Autumn 2016 Overview Overview of morning peak passenger arrivals and crowding
3. Context: Growth in Rail Usage Summary of trends in passenger rail usage
4. Context: Passenger Satisfaction Summary of trends in rail passenger satisfaction
5. Feature: How do people travel into cities? A closer look at the way people use rail to travel into city centres
page 3page 4
page 5
page 6
page 7
Section 2: Passenger numbers and crowding
6. Passenger Numbers: 2016 Summary Summary of passenger numbers arriving and departing major city centres
7. Passenger Crowding: 2016 Summary Summary of train crowding on services into and out of major city centres
8. Passenger Numbers and Crowding in London A focus on passenger numbers and crowding in central London
9. London stations summary Summary of passenger numbers and crowding for central London stations
page 8
page 9
page 11
page 13
Section 3: Summaries for cities & London stations
10. Results by City Summary statistics for rail passenger numbers and crowding in major cities in England and Wales
11. Results by London station Summary statistics for rail passenger numbers and crowding for central London stations
12. Background notes
page 14
page 25
page 31
Rail passenger numbers and crowding on weekdays in major cities in England and Wales: 2016 - Page 2
1. Introduction
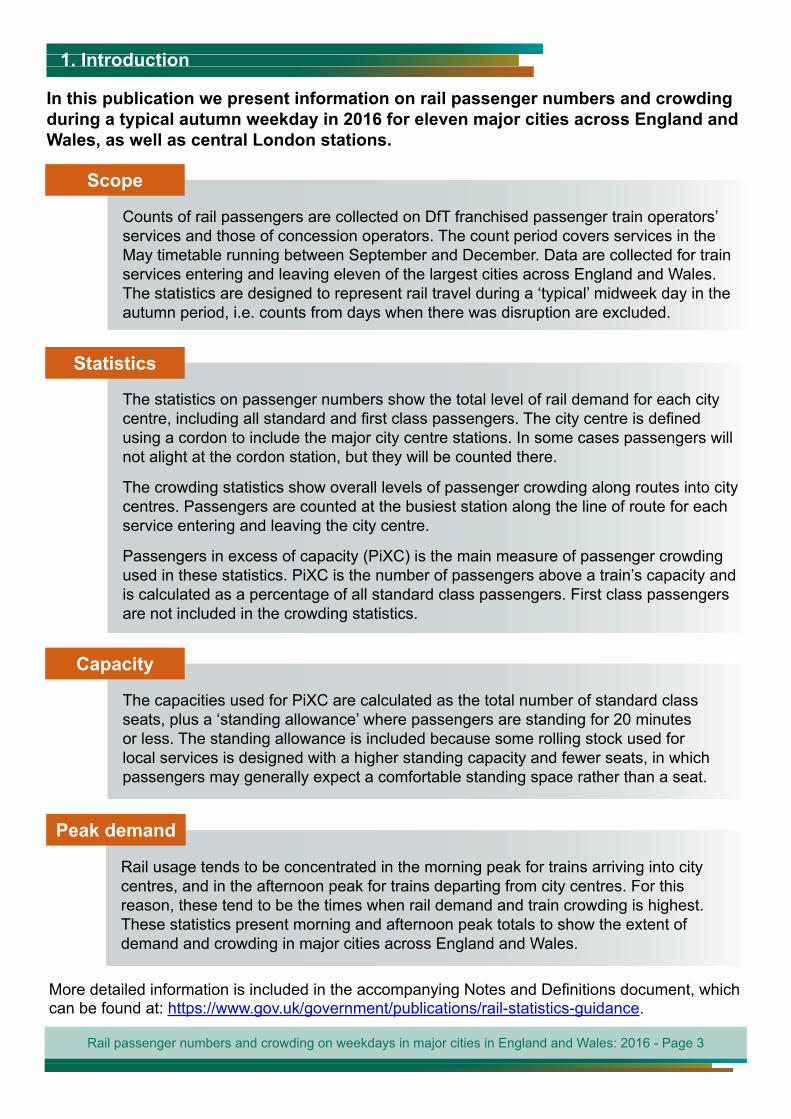
In this publication we present information on rail passenger numbers and crowding during a typical autumn weekday in 2016 for eleven major cities across England and Wales, as well as central London stations.
Scope
Counts of rail passengers are collected on DfT franchised passenger train operators’ services and those of concession operators. The count period covers services in the May timetable running between September and December. Data are collected for train services entering and leaving eleven of the largest cities across England and Wales. The statistics are designed to represent rail travel during a ‘typical’ midweek day in the autumn period, i.e. counts from days when there was disruption are excluded.
Statistics
The statistics on passenger numbers show the total level of rail demand for each city centre, including all standard and first class passengers. The city centre is defined using a cordon to include the major city centre stations. In some cases passengers will not alight at the cordon station, but they will be counted there.
The crowding statistics show overall levels of passenger crowding along routes into city centres. Passengers are counted at the busiest station along the line of route for each service entering and leaving the city centre.
Passengers in excess of capacity (PiXC) is the main measure of passenger crowding used in these statistics. PiXC is the number of passengers above a train’s capacity and is calculated as a percentage of all standard class passengers. First class passengers are not included in the crowding statistics.
Capacity
The capacities used for PiXC are calculated as the total number of standard class seats, plus a ‘standing allowance’ where passengers are standing for 20 minutes or less. The standing allowance is included because some rolling stock used for local services is designed with a higher standing capacity and fewer seats, in which passengers may generally expect a comfortable standing space rather than a seat.
Peak demand
Rail passenger numbers and crowding on weekdays in major cities in England and Wales: 2016 - Page 3
Rail usage tends to be concentrated in the morning peak for trains arriving into city centres, and in the afternoon peak for trains departing from city centres. For this reason, these tend to be the times when rail demand and train crowding is highest. These statistics present morning and afternoon peak totals to show the extent of demand and crowding in major cities across England and Wales.
More detailed information is included in the accompanying Notes and Definitions document, which can be found at: https://www.gov.uk/government/publications/rail-statistics-guidance.
2. Autumn 2016 overview
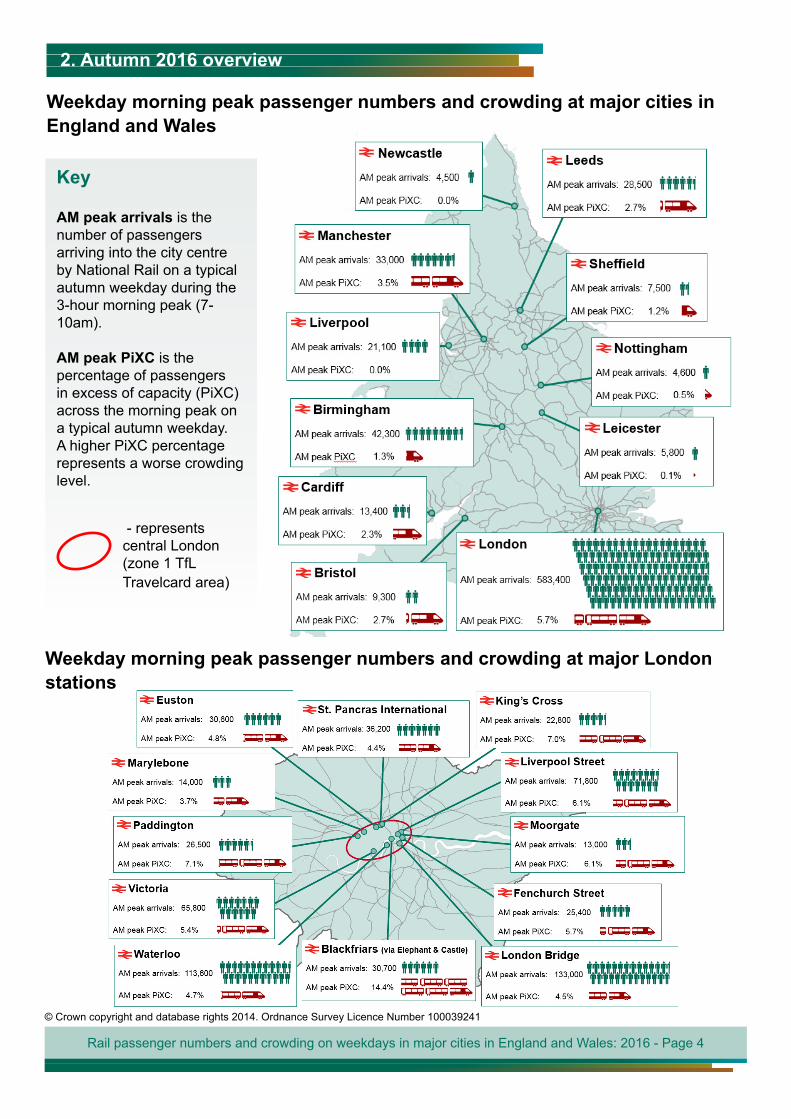
Weekday morning peak passenger numbers and crowding at major cities in England and Wales
Key
AM peak arrivals is the number of passengers arriving into the city centre by National Rail on a typical autumn weekday during the 3-hour morning peak (7-10am).
AM peak PiXC is the percentage of passengers in excess of capacity (PiXC) across the morning peak on a typical autumn weekday. A higher PiXC percentage represents a worse crowding level.
- represents central London (zone 1 TfL Travelcard area)
Rail passenger numbers and crowding on weekdays in major cities in England and Wales: 2016 - Page 4
Weekday morning peak passenger numbers and crowding at major London stations
© Crown copyright and database rights 2014. Ordnance Survey Licence Number 100039241
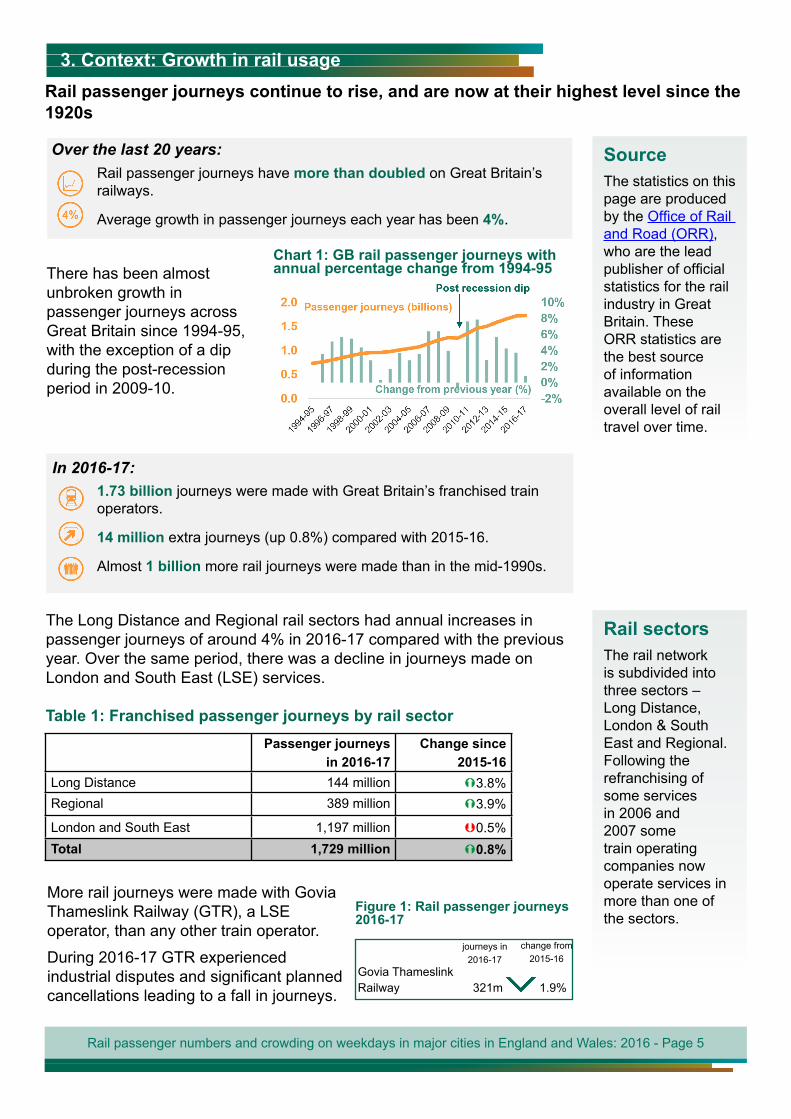
3. Context: Growth in rail usageRail passenger journeys continue to rise, and are now at their highest level since the 1920s
Over the last 20 years:Rail passenger journeys have more than doubled on Great Britain’s railways.
Average growth in passenger journeys each year has been 4%.
Chart 1: GB rail passenger journeys with annual percentage change from 1994-95There has been almost
unbroken growth in passenger journeys across Great Britain since 1994-95, with the exception of a dip during the post-recession period in 2009-10.
Rail passenger numbers and crowding on weekdays in major cities in England and Wales: 2016 - Page 5
SourceThe statistics on this page are produced by the Office of Rail and Road (ORR), who are the lead publisher of official statistics for the rail industry in Great Britain. These ORR statistics are the best source of information available on the overall level of rail travel over time.
In 2016-17:1.73 billion journeys were made with Great Britain’s franchised train operators.
14 million extra journeys (up 0.8%) compared with 2015-16.
Almost 1 billion more rail journeys were made than in the mid-1990s.
The Long Distance and Regional rail sectors had annual increases in passenger journeys of around 4% in 2016-17 compared with the previous year. Over the same period, there was a decline in journeys made on London and South East (LSE) services.
Passenger journeys in 2016-17
Change since 2015-16
Long Distance 144 million 3.8%Regional 389 million 3.9%
London and South East 1,197 million 0.5%Total 1,729 million 0.8%
Table 1: Franchised passenger journeys by rail sector
More rail journeys were made with Govia Thameslink Railway (GTR), a LSE operator, than any other train operator.
During 2016-17 GTR experienced industrial disputes and significant planned cancellations leading to a fall in journeys.
Govia Thameslink Railway 321m 1.9%
Figure 1: Rail passenger journeys 2016-17
journeys in 2016-17
change from 2015-16
Rail sectorsThe rail network is subdivided into three sectors – Long Distance, London & South East and Regional. Following the refranchising of some services in 2006 and 2007 some train operating companies now operate services in more than one of the sectors.
4. Context: Passenger satisfaction
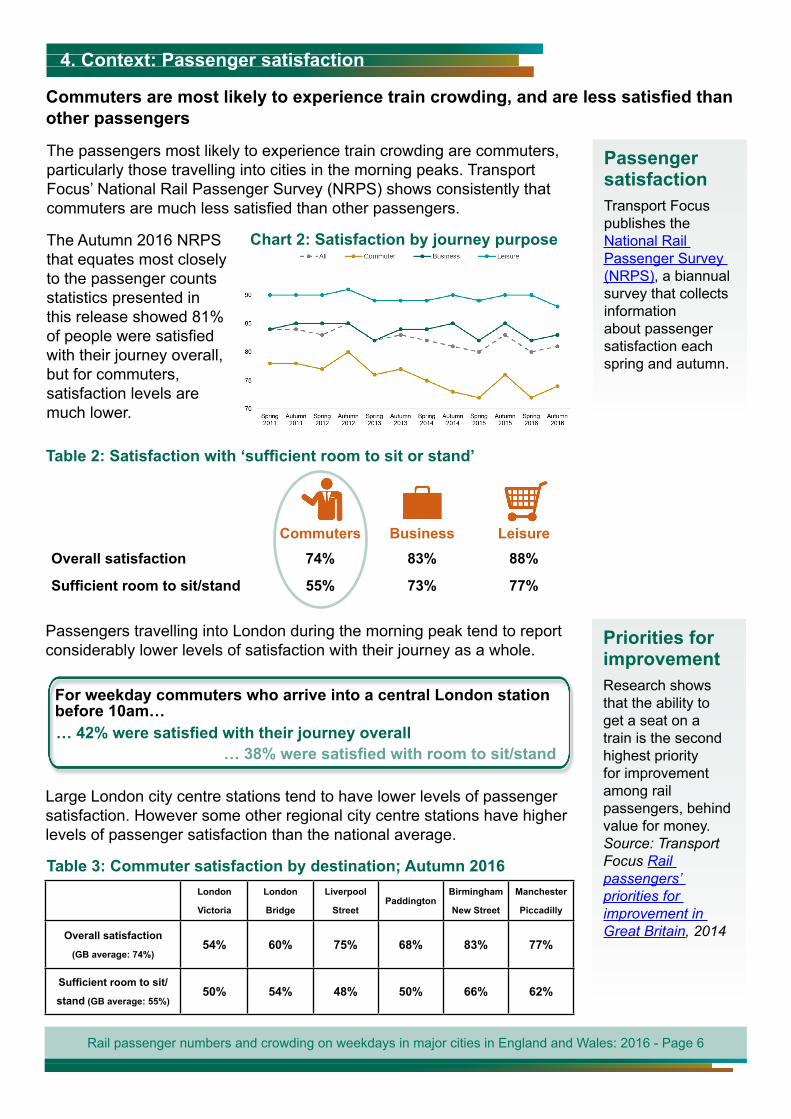
Commuters are most likely to experience train crowding, and are less satisfied than other passengers
Passenger satisfactionTransport Focus publishes the National Rail Passenger Survey (NRPS), a biannual survey that collects information about passenger satisfaction each spring and autumn.
Chart 2: Satisfaction by journey purposeThe Autumn 2016 NRPS that equates most closely to the passenger counts statistics presented in this release showed 81% of people were satisfied with their journey overall, but for commuters, satisfaction levels are much lower.
The passengers most likely to experience train crowding are commuters, particularly those travelling into cities in the morning peaks. Transport Focus’ National Rail Passenger Survey (NRPS) shows consistently that commuters are much less satisfied than other passengers.
Table 2: Satisfaction with ‘sufficient room to sit or stand’
Commuters Business LeisureOverall satisfaction 74% 83% 88%
Sufficient room to sit/stand 55% 73% 77%
Passengers travelling into London during the morning peak tend to report considerably lower levels of satisfaction with their journey as a whole.
For weekday commuters who arrive into a central London station before 10am…… 42% were satisfied with their journey overall
… 38% were satisfied with room to sit/stand
Large London city centre stations tend to have lower levels of passenger satisfaction. However some other regional city centre stations have higher levels of passenger satisfaction than the national average.
Priorities for improvementResearch shows that the ability to get a seat on a train is the second highest priority for improvement among rail passengers, behind value for money. Source: Transport Focus Rail passengers’ priorities for improvement in Great Britain, 2014
Table 3: Commuter satisfaction by destination; Autumn 2016London
Victoria
London
Bridge
Liverpool
StreetPaddington
Birmingham
New Street
Manchester
Piccadilly
Overall satisfaction
(GB average: 74%)54% 60% 75% 68% 83% 77%
Sufficient room to sit/
stand (GB average: 55%)50% 54% 48% 50% 66% 62%
Rail passenger numbers and crowding on weekdays in major cities in England and Wales: 2016 - Page 6
5. Feature: How do people travel into cities?
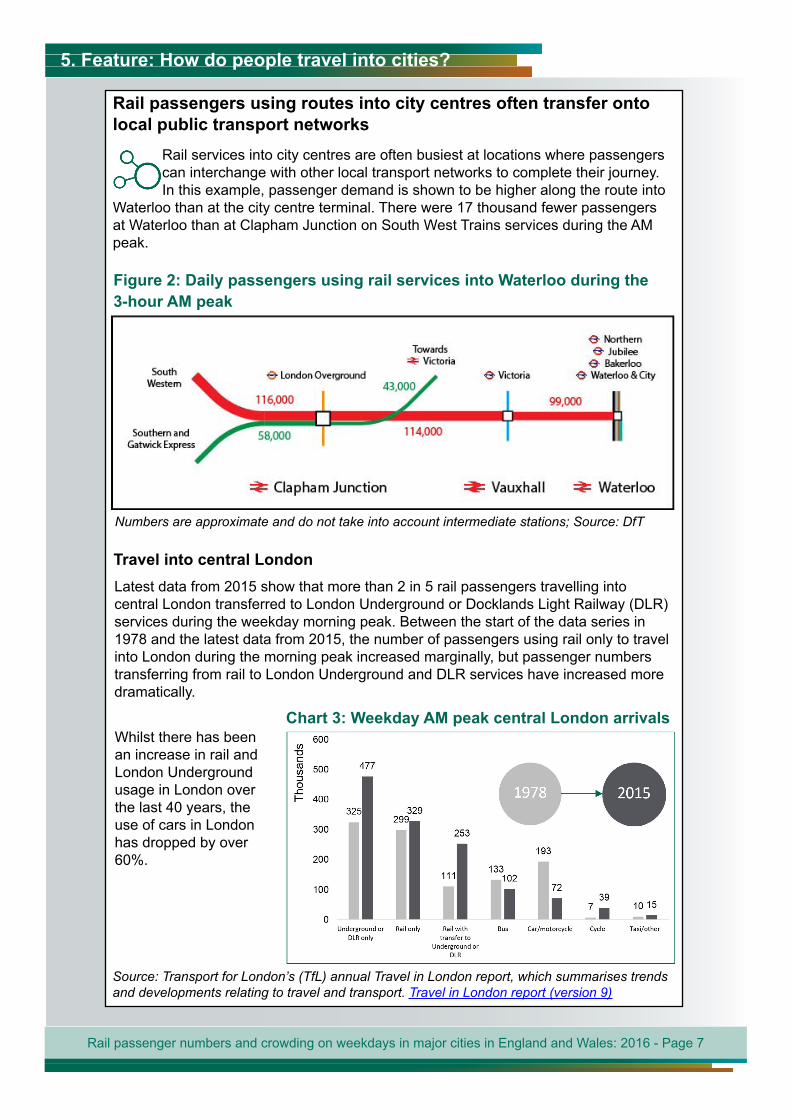
Rail passengers using routes into city centres often transfer onto local public transport networks
Rail services into city centres are often busiest at locations where passengers can interchange with other local transport networks to complete their journey. In this example, passenger demand is shown to be higher along the route into
Waterloo than at the city centre terminal. There were 17 thousand fewer passengers at Waterloo than at Clapham Junction on South West Trains services during the AM peak.
Figure 2: Daily passengers using rail services into Waterloo during the 3-hour AM peak
Rail passenger numbers and crowding on weekdays in major cities in England and Wales: 2016 - Page 7
Numbers are approximate and do not take into account intermediate stations; Source: DfT
Travel into central LondonLatest data from 2015 show that more than 2 in 5 rail passengers travelling into central London transferred to London Underground or Docklands Light Railway (DLR) services during the weekday morning peak. Between the start of the data series in 1978 and the latest data from 2015, the number of passengers using rail only to travel into London during the morning peak increased marginally, but passenger numbers transferring from rail to London Underground and DLR services have increased more dramatically.
Chart 3: Weekday AM peak central London arrivalsWhilst there has been an increase in rail and London Underground usage in London over the last 40 years, the use of cars in London has dropped by over 60%.
Source: Transport for London’s (TfL) annual Travel in London report, which summarises trends and developments relating to travel and transport. Travel in London report (version 9)
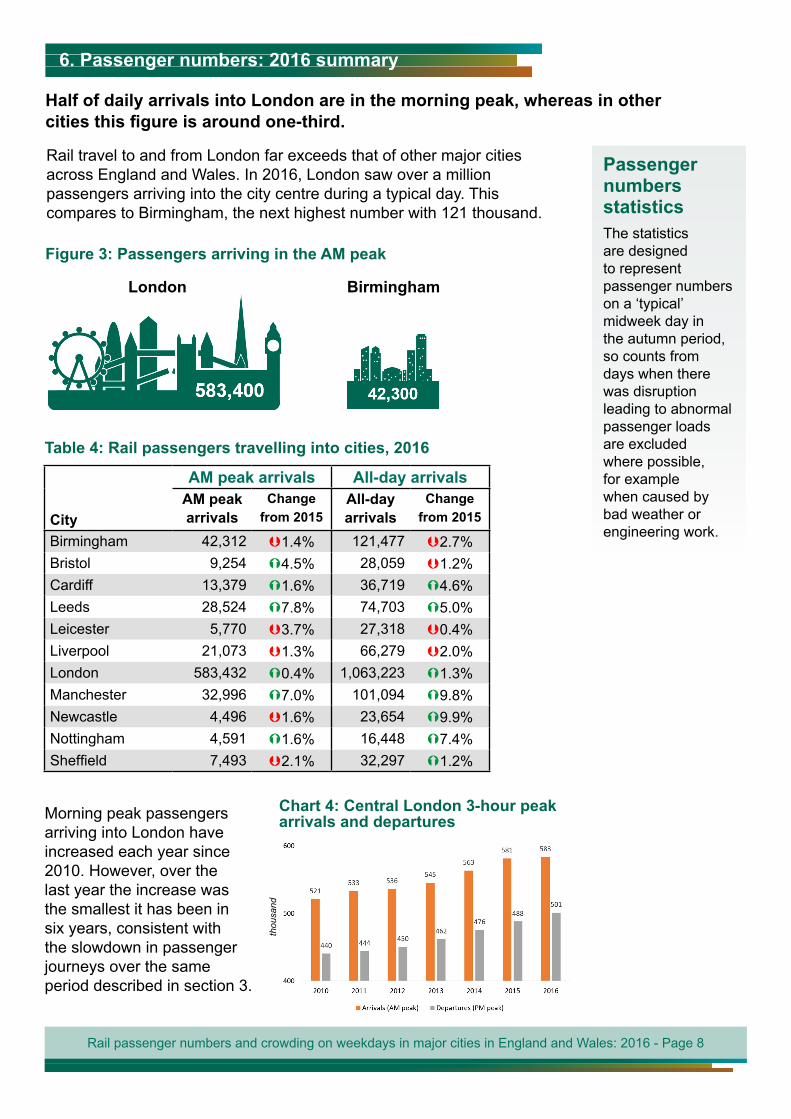
Half of daily arrivals into London are in the morning peak, whereas in other cities this figure is around one-third.
6. Passenger numbers: 2016 summary
Rail travel to and from London far exceeds that of other major cities across England and Wales. In 2016, London saw over a million passengers arriving into the city centre during a typical day. This compares to Birmingham, the next highest number with 121 thousand.
Passenger numbers statisticsThe statistics are designed to represent passenger numbers on a ‘typical’ midweek day in the autumn period, so counts from days when there was disruption leading to abnormal passenger loads are excluded where possible, for example when caused by bad weather or engineering work.
London
Figure 3: Passengers arriving in the AM peak
Birmingham
AM peak arrivals All-day arrivals
CityAM peak arrivals
Change from 2015
All-day arrivals
Change from 2015
Birmingham 42,312 1.4% 121,477 2.7%Bristol 9,254 4.5% 28,059 1.2%Cardiff 13,379 1.6% 36,719 4.6%Leeds 28,524 7.8% 74,703 5.0%Leicester 5,770 3.7% 27,318 0.4%Liverpool 21,073 1.3% 66,279 2.0%London 583,432 0.4% 1,063,223 1.3%Manchester 32,996 7.0% 101,094 9.8%Newcastle 4,496 1.6% 23,654 9.9%Nottingham 4,591 1.6% 16,448 7.4%Sheffield 7,493 2.1% 32,297 1.2%
Table 4: Rail passengers travelling into cities, 2016
Morning peak passengers arriving into London have increased each year since 2010. However, over the last year the increase was the smallest it has been in six years, consistent with the slowdown in passenger journeys over the same period described in section 3.
Chart 4: Central London 3-hour peak arrivals and departures
thou
sand
Rail passenger numbers and crowding on weekdays in major cities in England and Wales: 2016 - Page 8
7. Passenger crowding: 2016 summary
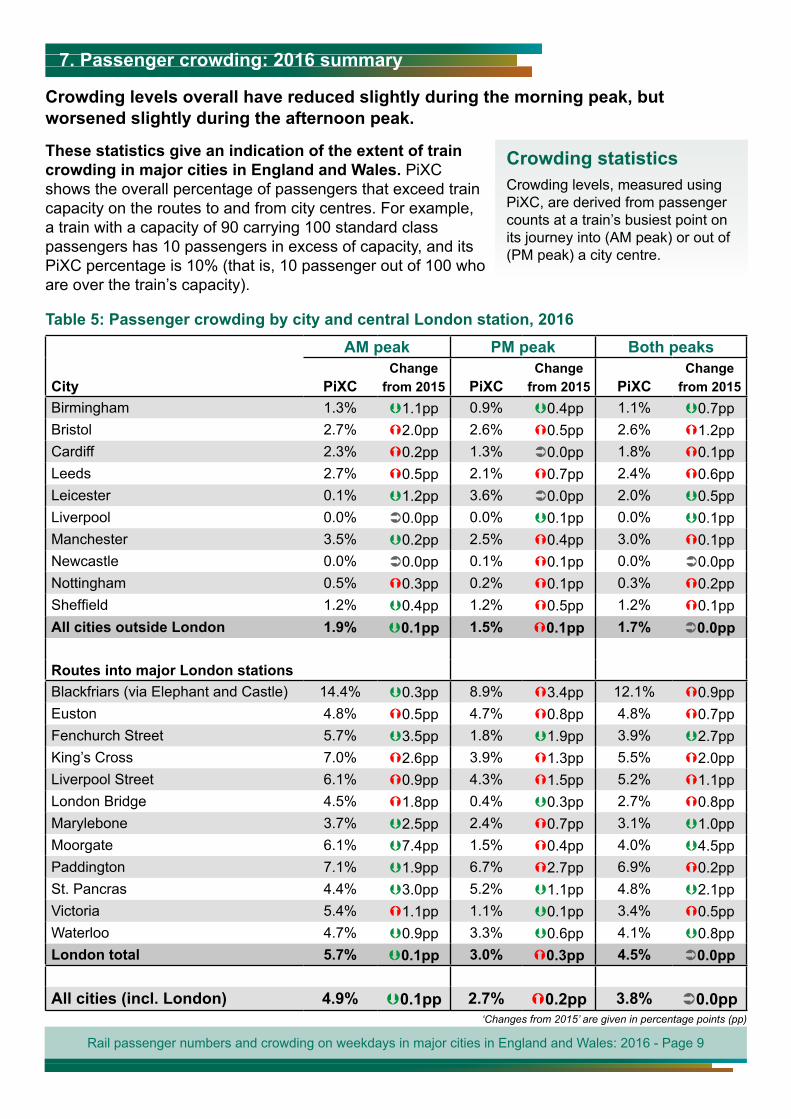
Crowding levels overall have reduced slightly during the morning peak, but worsened slightly during the afternoon peak.
These statistics give an indication of the extent of train crowding in major cities in England and Wales. PiXC shows the overall percentage of passengers that exceed train capacity on the routes to and from city centres. For example, a train with a capacity of 90 carrying 100 standard class passengers has 10 passengers in excess of capacity, and its PiXC percentage is 10% (that is, 10 passenger out of 100 who are over the train’s capacity).
Crowding statisticsCrowding levels, measured using PiXC, are derived from passenger counts at a train’s busiest point on its journey into (AM peak) or out of (PM peak) a city centre.
AM peak PM peak Both peaks
City PiXCChange
from 2015 PiXCChange
from 2015 PiXCChange
from 2015Birmingham 1.3% 1.1pp 0.9% 0.4pp 1.1% 0.7ppBristol 2.7% 2.0pp 2.6% 0.5pp 2.6% 1.2ppCardiff 2.3% 0.2pp 1.3% 0.0pp 1.8% 0.1ppLeeds 2.7% 0.5pp 2.1% 0.7pp 2.4% 0.6ppLeicester 0.1% 1.2pp 3.6% 0.0pp 2.0% 0.5ppLiverpool 0.0% 0.0pp 0.0% 0.1pp 0.0% 0.1ppManchester 3.5% 0.2pp 2.5% 0.4pp 3.0% 0.1ppNewcastle 0.0% 0.0pp 0.1% 0.1pp 0.0% 0.0ppNottingham 0.5% 0.3pp 0.2% 0.1pp 0.3% 0.2ppSheffield 1.2% 0.4pp 1.2% 0.5pp 1.2% 0.1ppAll cities outside London 1.9% 0.1pp 1.5% 0.1pp 1.7% 0.0pp
Routes into major London stationsBlackfriars (via Elephant and Castle) 14.4% 0.3pp 8.9% 3.4pp 12.1% 0.9ppEuston 4.8% 0.5pp 4.7% 0.8pp 4.8% 0.7ppFenchurch Street 5.7% 3.5pp 1.8% 1.9pp 3.9% 2.7ppKing’s Cross 7.0% 2.6pp 3.9% 1.3pp 5.5% 2.0ppLiverpool Street 6.1% 0.9pp 4.3% 1.5pp 5.2% 1.1ppLondon Bridge 4.5% 1.8pp 0.4% 0.3pp 2.7% 0.8ppMarylebone 3.7% 2.5pp 2.4% 0.7pp 3.1% 1.0ppMoorgate 6.1% 7.4pp 1.5% 0.4pp 4.0% 4.5ppPaddington 7.1% 1.9pp 6.7% 2.7pp 6.9% 0.2ppSt. Pancras 4.4% 3.0pp 5.2% 1.1pp 4.8% 2.1ppVictoria 5.4% 1.1pp 1.1% 0.1pp 3.4% 0.5ppWaterloo 4.7% 0.9pp 3.3% 0.6pp 4.1% 0.8ppLondon total 5.7% 0.1pp 3.0% 0.3pp 4.5% 0.0pp
All cities (incl. London) 4.9% 0.1pp 2.7% 0.2pp 3.8% 0.0pp‘Changes from 2015’ are given in percentage points (pp)
Table 5: Passenger crowding by city and central London station, 2016
Rail passenger numbers and crowding on weekdays in major cities in England and Wales: 2016 - Page 9
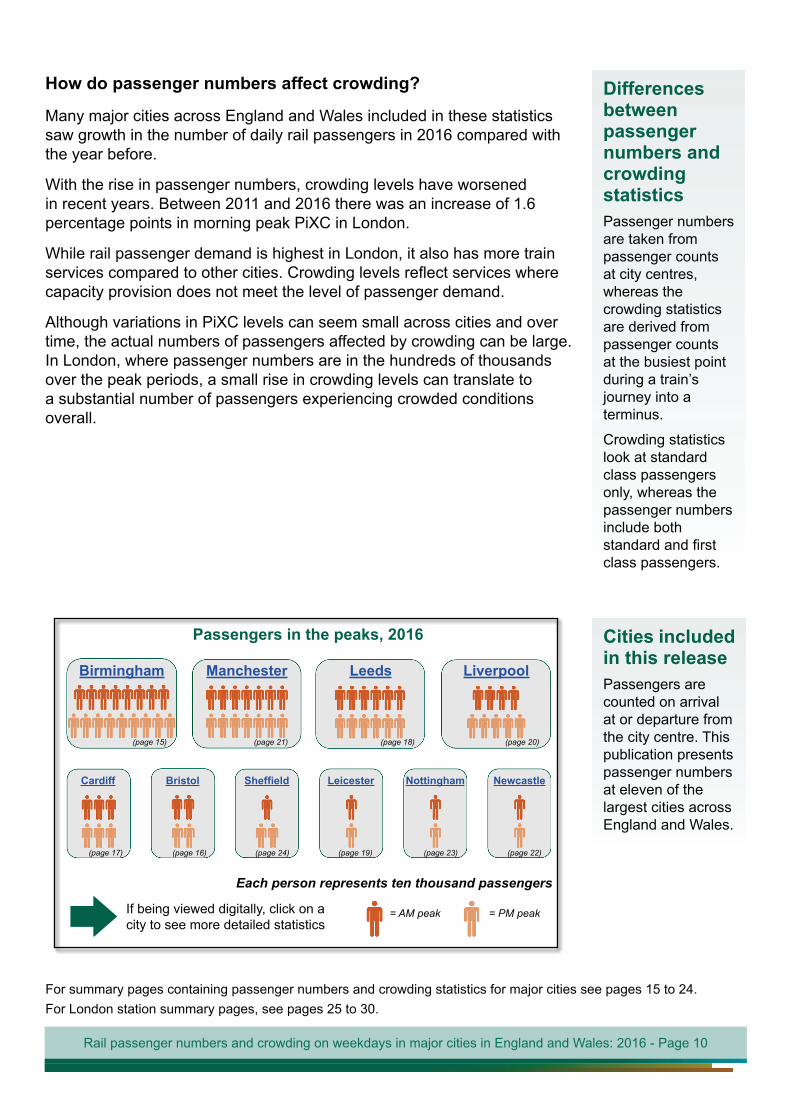
Many major cities across England and Wales included in these statistics saw growth in the number of daily rail passengers in 2016 compared with the year before.
With the rise in passenger numbers, crowding levels have worsened in recent years. Between 2011 and 2016 there was an increase of 1.6 percentage points in morning peak PiXC in London.
While rail passenger demand is highest in London, it also has more train
capacity provision does not meet the level of passenger demand.
Although variations in PiXC levels can seem small across cities and over time, the actual numbers of passengers affected by crowding can be large. In London, where passenger numbers are in the hundreds of thousands over the peak periods, a small rise in crowding levels can translate to a substantial number of passengers experiencing crowded conditions overall.
Differences between passenger numbers and crowding statisticsPassenger numbers are taken from passenger counts at city centres, whereas the crowding statistics are derived from passenger counts at the busiest point during a train’s journey into a terminus.
Crowding statistics look at standard class passengers only, whereas the passenger numbers include both
class passengers.
How do passenger numbers affect crowding?
If being viewed digitally, click on a city to see more detailed statistics
Passengers in the peaks, 2016
Birmingham Leeds Liverpool
Cardiff Bristol Leicester Nottingham Newcastle
Each person represents ten thousand passengers
= AM peak = PM peak
(page 15) (page 21) (page 18) (page 20)
(page 17) (page 16) (page 24) (page 19) (page 23) (page 22)
Manchester
Cities included in this releasePassengers are counted on arrival at or departure from the city centre. This publication presents passenger numbers at eleven of the largest cities across England and Wales.
For summary pages containing passenger numbers and crowding statistics for major cities see pages 15 to 24.For London station summary pages, see pages 25 to 30.
Rail passenger numbers and crowding on weekdays in major cities in England and Wales: 2016 - Page 10
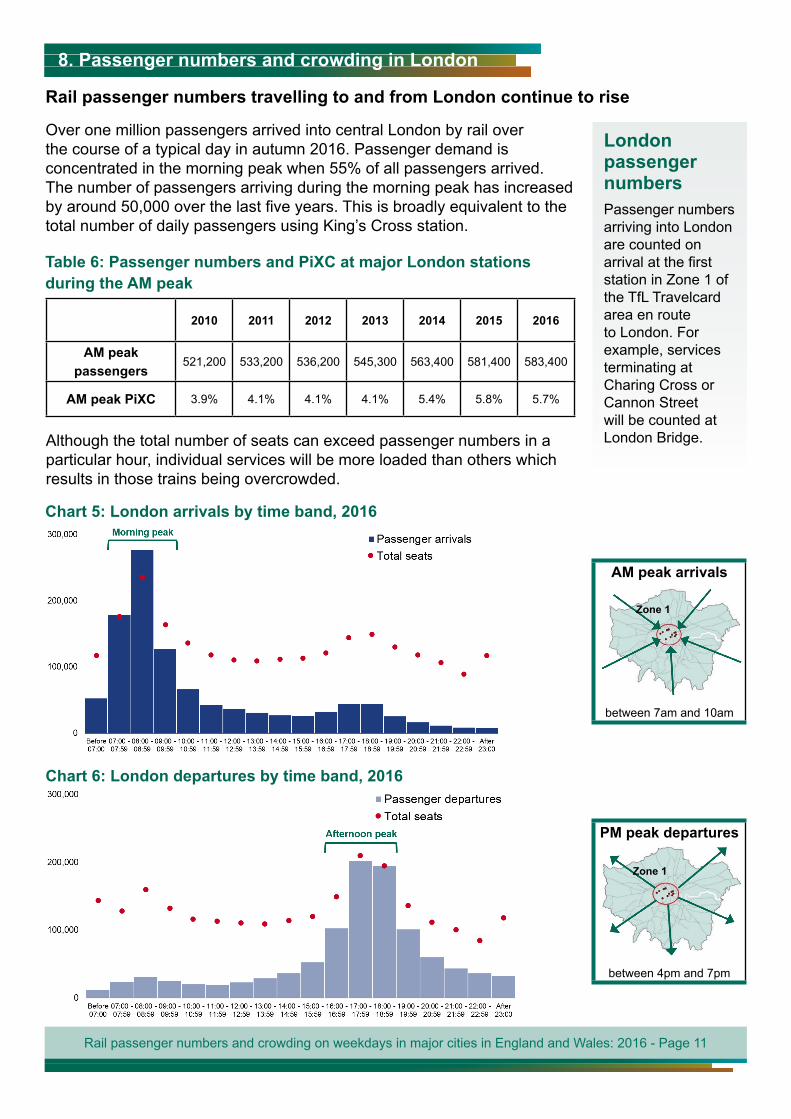
Table 6: Passenger numbers and PiXC at major London stations during the AM peak
8. Passenger numbers and crowding in London
Chart 5: London arrivals by time band, 2016
London passenger numbersPassenger numbers arriving into London are counted on arrival at the first station in Zone 1 of the TfL Travelcard area en route to London. For example, services terminating at Charing Cross or Cannon Street will be counted at London Bridge.
Over one million passengers arrived into central London by rail over the course of a typical day in autumn 2016. Passenger demand is concentrated in the morning peak when 55% of all passengers arrived. The number of passengers arriving during the morning peak has increased by around 50,000 over the last five years. This is broadly equivalent to the total number of daily passengers using King’s Cross station.
2010 2011 2012 2013 2014 2015 2016
AM peak passengers
521,200 533,200 536,200 545,300 563,400 581,400 583,400
AM peak PiXC 3.9% 4.1% 4.1% 4.1% 5.4% 5.8% 5.7%
Rail passenger numbers travelling to and from London continue to rise
Chart 6: London departures by time band, 2016
AM peak arrivals
between 7am and 10am
Zone 1
PM peak departures
between 4pm and 7pm
Zone 1
Although the total number of seats can exceed passenger numbers in a particular hour, individual services will be more loaded than others which results in those trains being overcrowded.
Rail passenger numbers and crowding on weekdays in major cities in England and Wales: 2016 - Page 11
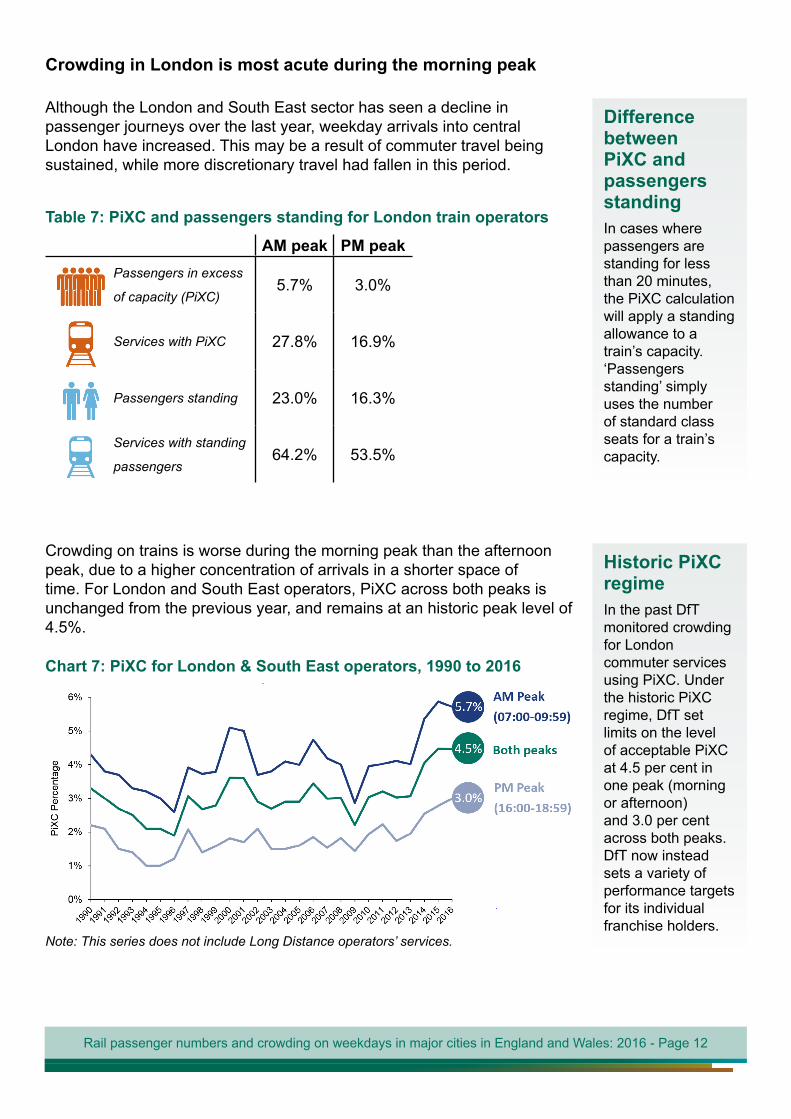
Although the London and South East sector has seen a decline in passenger journeys over the last year, weekday arrivals into central London have increased. This may be a result of commuter travel being sustained, while more discretionary travel had fallen in this period.
Crowding in London is most acute during the morning peak
Rail passenger numbers and crowding on weekdays in major cities in England and Wales: 2016 - Page 12
Difference between PiXC and passengers standingIn cases where passengers are standing for less than 20 minutes, the PiXC calculation will apply a standing allowance to a train’s capacity. ‘Passengers standing’ simply uses the number of standard class seats for a train’s capacity.
AM peak PM peakPassengers in excess
of capacity (PiXC)5.7% 3.0%
Services with PiXC 27.8% 16.9%
Passengers standing 23.0% 16.3%
Services with standing
passengers64.2% 53.5%
Table 7: PiXC and passengers standing for London train operators
Crowding on trains is worse during the morning peak than the afternoon peak, due to a higher concentration of arrivals in a shorter space of time. For London and South East operators, PiXC across both peaks is unchanged from the previous year, and remains at an historic peak level of 4.5%.
Chart 7: PiXC for London & South East operators, 1990 to 2016
Note: This series does not include Long Distance operators’ services.
Historic PiXC regimeIn the past DfT monitored crowding for London commuter services using PiXC. Under the historic PiXC regime, DfT set limits on the level of acceptable PiXC at 4.5 per cent in one peak (morning or afternoon) and 3.0 per cent across both peaks. DfT now instead sets a variety of performance targets for its individual franchise holders.
Waterloo Liverpool Street
Victoria St. Pancras Euston Blackfriars
Paddington Fenchurch St. Marylebone Moorgate
Waterloo Liverpool Streetp
Victoria St. Pancras Euston Blackfriars
Paddingtong Fenchurch St. Maryleboney Moorgateg
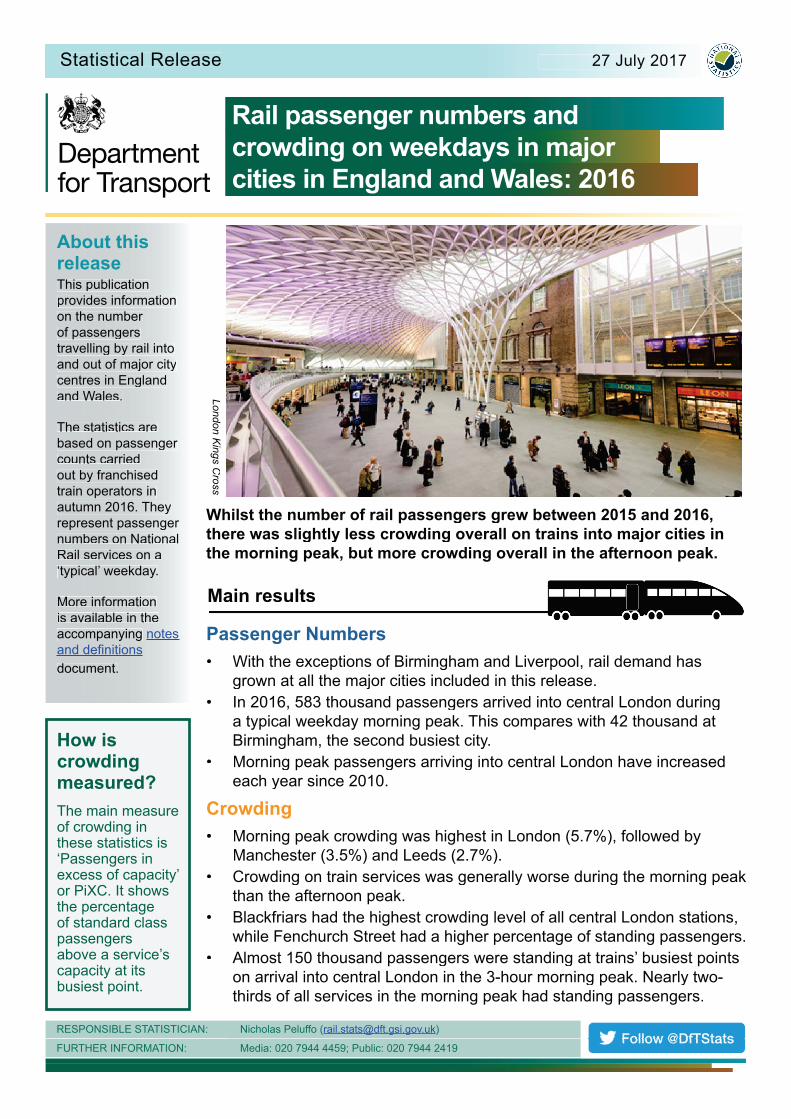
If being viewed digitally, click on a station to see more detailed statistics
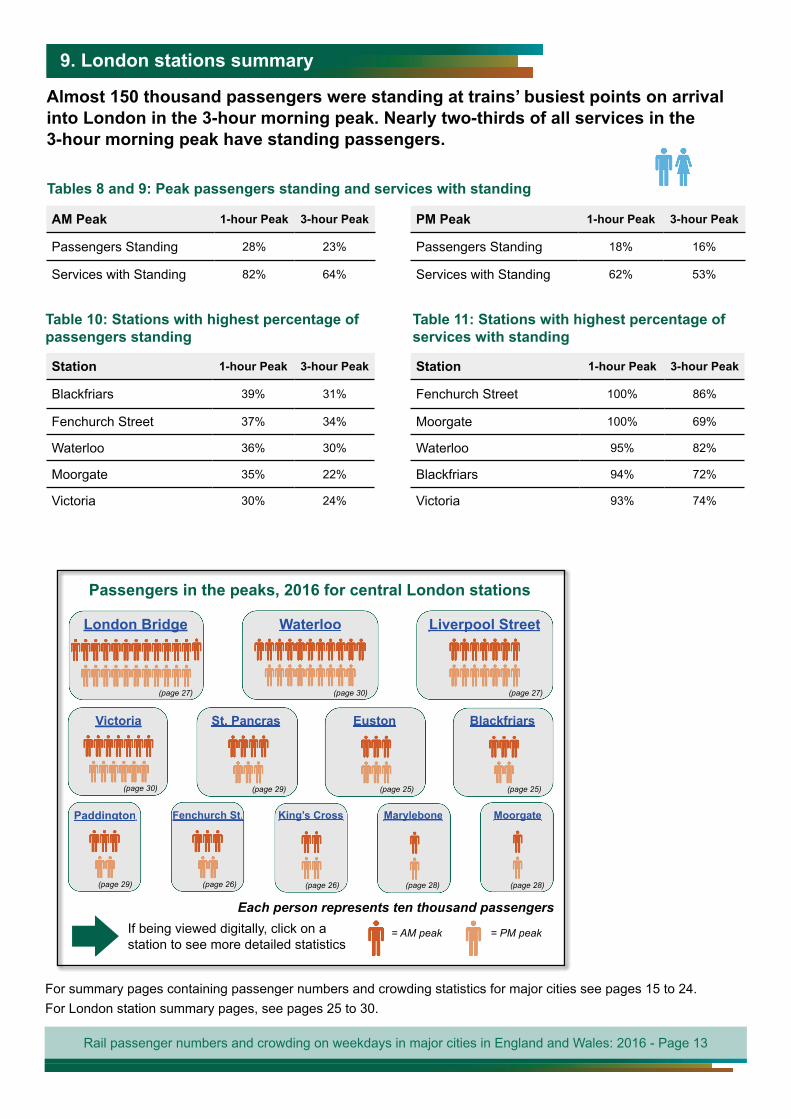
Passengers in the peaks, 2016 for central London stations
Each person represents ten thousand passengers
= AM peak = PM peak
(page 27)
London Bridge
(page 30) (page 27)
(page 30) (page 29)
(page 29)
(page 25) (page 25)
(page 26) (page 26) (page 28) (page 28)
into London in the 3-hour morning peak. Nearly two-thirds of all services in the 3-hour morning peak have standing passengers.
9. London stations summary
For summary pages containing passenger numbers and crowding statistics for major cities see pages 15 to 24.For London station summary pages, see pages 25 to 30.
AM Peak 1-hour Peak 3-hour Peak
Passengers Standing 28% 23%
Services with Standing 82% 64%
PM Peak 1-hour Peak 3-hour Peak
Passengers Standing 18% 16%
Services with Standing 62% 53%
Station 1-hour Peak 3-hour Peak
Blackfriars 39% 31%
Fenchurch Street 37% 34%
Waterloo 36% 30%
Moorgate 35% 22%
Victoria 30% 24%
Station 1-hour Peak 3-hour Peak
Fenchurch Street 100% 86%
Moorgate 100% 69%
Waterloo 95% 82%
Blackfriars 94% 72%
Victoria 93% 74%
Tables 8 and 9: Peak passengers standing and services with standing
Table 10: Stations with highest percentage of passengers standing
Table 11: Stations with highest percentage of services with standing
Rail passenger numbers and crowding on weekdays in major cities in England and Wales: 2016 - Page 13
10. Results by city
Sections 10 and 11 contains summary statistics for each major city and central London station.
One-page Summaries
For summary pages containing passenger numbers and crowding statistics for major cities see pages 15 to 24.
For London station summary pages, see pages 25 to 30.
Rail passenger numbers and crowding on weekdays in major cities in England and Wales: 2016 - Page 14
Birmingham In the AM peak
In the PM peak
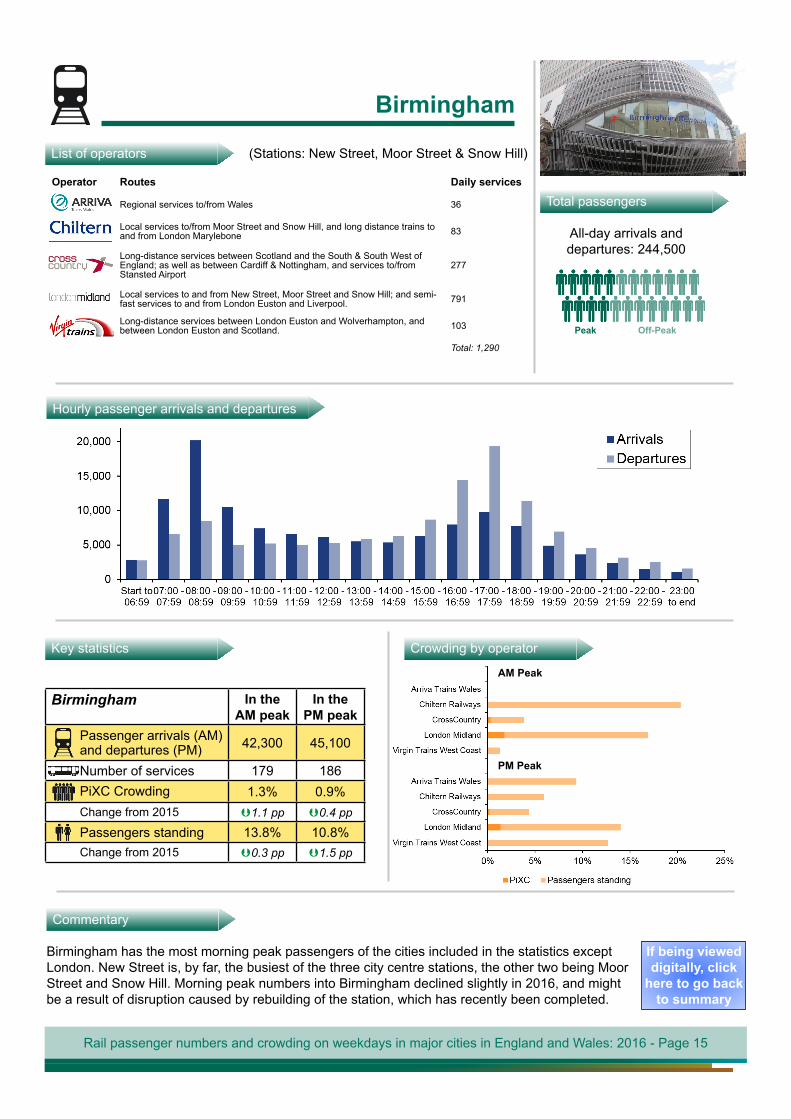
Passenger arrivals (AM) and departures (PM) 42,300 45,100
Number of services 179 186PiXC Crowding 1.3% 0.9%Change from 2015 1.1 pp 0.4 pp
Passengers standing 13.8% 10.8%Change from 2015 0.3 pp 1.5 pp
Birmingham
List of operators (Stations: New Street, Moor Street & Snow Hill)
Total passengers
All-day arrivals and departures: 244,500
Peak Off-Peak
Operator Routes Daily services Regional services to/from Wales 36
Local services to/from Moor Street and Snow Hill, and long distance trains to and from London Marylebone 83
Long-distance services between Scotland and the South & South West of England; as well as between Cardiff & Nottingham, and services to/from Stansted Airport
277
Local services to and from New Street, Moor Street and Snow Hill; and semi-fast services to and from London Euston and Liverpool. 791
Long-distance services between London Euston and Wolverhampton, and between London Euston and Scotland. 103
Total: 1,290
Hourly passenger arrivals and departures
Key statistics Crowding by operator
AM Peak
PM Peak
Commentary
Birmingham has the most morning peak passengers of the cities included in the statistics except London. New Street is, by far, the busiest of the three city centre stations, the other two being Moor Street and Snow Hill. Morning peak numbers into Birmingham declined slightly in 2016, and might be a result of disruption caused by rebuilding of the station, which has recently been completed.
If being viewed digitally, click
here to go back to summary
Rail passenger numbers and crowding on weekdays in major cities in England and Wales: 2016 - Page 15
Bristol In the AM peak
In the PM peak
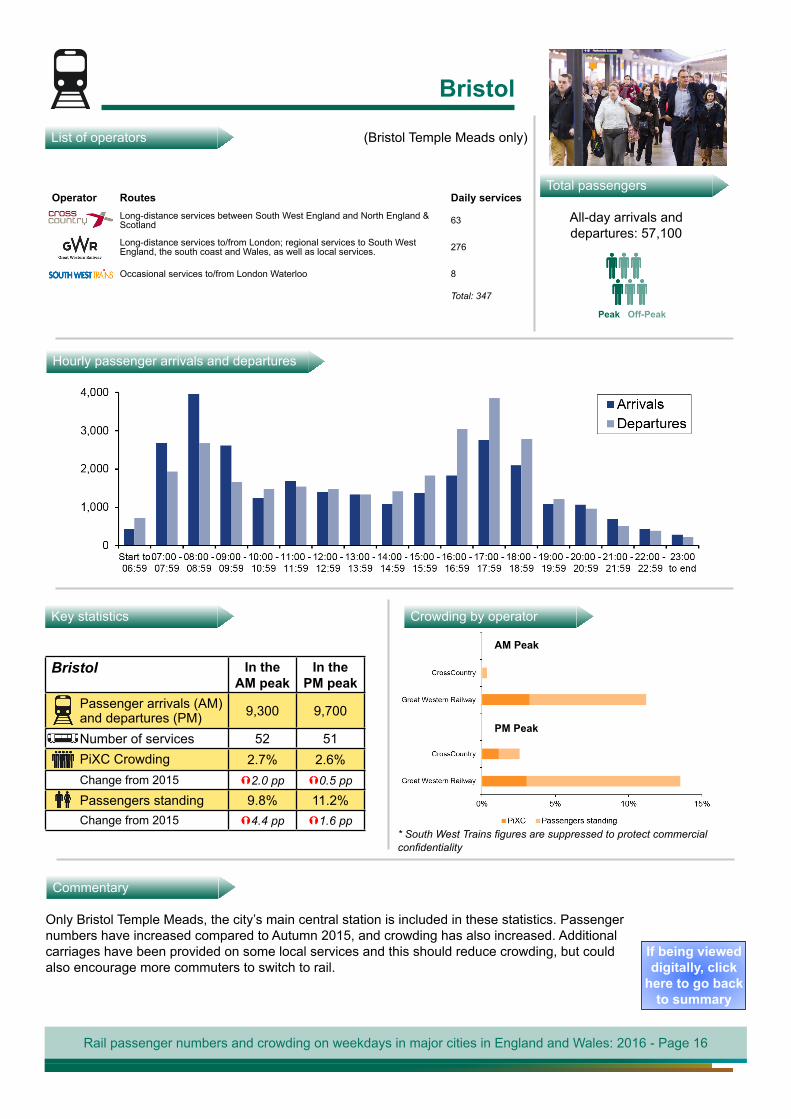
Passenger arrivals (AM) and departures (PM) 9,300 9,700
Number of services 52 51PiXC Crowding 2.7% 2.6%Change from 2015 2.0 pp 0.5 pp
Passengers standing 9.8% 11.2%Change from 2015 4.4 pp 1.6 pp
Bristol
List of operators (Bristol Temple Meads only)
Total passengers
All-day arrivals and departures: 57,100
Peak Off-Peak
Operator Routes Daily services Long-distance services between South West England and North England &
Scotland 63
Long-distance services to/from London; regional services to South West England, the south coast and Wales, as well as local services. 276
Occasional services to/from London Waterloo 8
Total: 347
Hourly passenger arrivals and departures
Key statistics Crowding by operator
AM Peak
PM Peak
Commentary
Only Bristol Temple Meads, the city’s main central station is included in these statistics. Passenger numbers have increased compared to Autumn 2015, and crowding has also increased. Additional carriages have been provided on some local services and this should reduce crowding, but could also encourage more commuters to switch to rail.
* South West Trains figures are suppressed to protect commercial confidentiality
If being viewed digitally, click
here to go back to summary
Rail passenger numbers and crowding on weekdays in major cities in England and Wales: 2016 - Page 16
Cardiff In the AM peak
In the PM peak
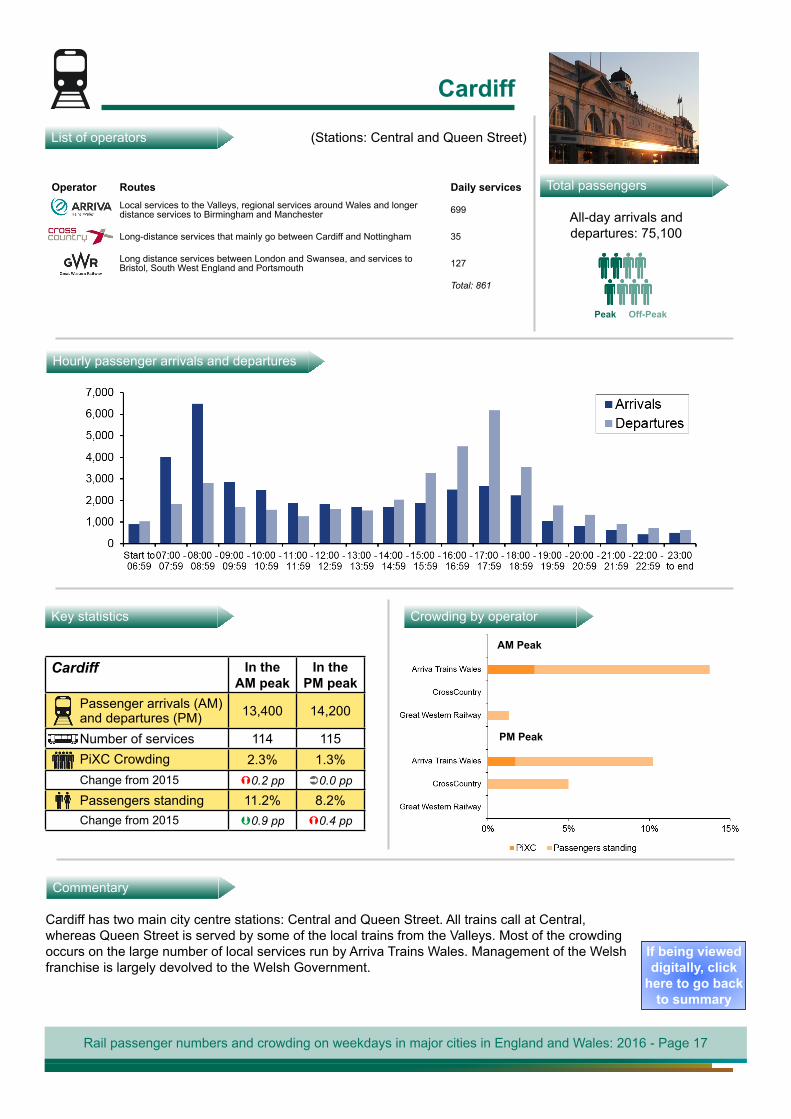
Passenger arrivals (AM) and departures (PM) 13,400 14,200
Number of services 114 115PiXC Crowding 2.3% 1.3%Change from 2015 0.2 pp 0.0 pp
Passengers standing 11.2% 8.2%Change from 2015 0.9 pp 0.4 pp
Cardiff
List of operators (Stations: Central and Queen Street)
Total passengers
All-day arrivals and departures: 75,100
Peak Off-Peak
Hourly passenger arrivals and departures
Key statistics Crowding by operator
AM Peak
PM Peak
Commentary
Cardiff has two main city centre stations: Central and Queen Street. All trains call at Central, whereas Queen Street is served by some of the local trains from the Valleys. Most of the crowding occurs on the large number of local services run by Arriva Trains Wales. Management of the Welsh franchise is largely devolved to the Welsh Government.
Operator Routes Daily services Local services to the Valleys, regional services around Wales and longer
distance services to Birmingham and Manchester 699
Long-distance services that mainly go between Cardiff and Nottingham 35
Long distance services between London and Swansea, and services to Bristol, South West England and Portsmouth 127
Total: 861
If being viewed digitally, click
here to go back to summary
Rail passenger numbers and crowding on weekdays in major cities in England and Wales: 2016 - Page 17
Leeds In the AM peak
In the PM peak
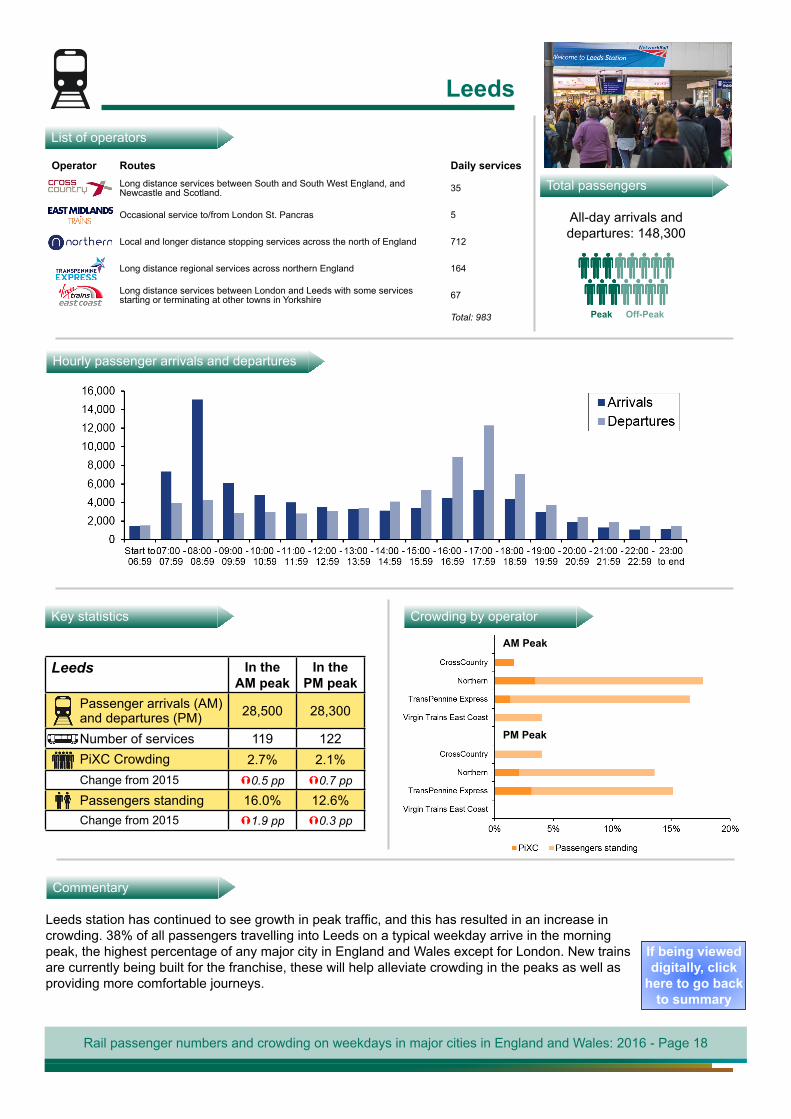
Passenger arrivals (AM) and departures (PM) 28,500 28,300
Number of services 119 122PiXC Crowding 2.7% 2.1%Change from 2015 0.5 pp 0.7 pp
Passengers standing 16.0% 12.6%Change from 2015 1.9 pp 0.3 pp
Leeds
List of operators
Total passengers
All-day arrivals and departures: 148,300
Peak Off-Peak
Hourly passenger arrivals and departures
Key statistics Crowding by operator
AM Peak
PM Peak
Commentary
Leeds station has continued to see growth in peak traffic, and this has resulted in an increase in crowding. 38% of all passengers travelling into Leeds on a typical weekday arrive in the morning peak, the highest percentage of any major city in England and Wales except for London. New trains are currently being built for the franchise, these will help alleviate crowding in the peaks as well as providing more comfortable journeys.
Operator Routes Daily services Long distance services between South and South West England, and
Newcastle and Scotland. 35
Occasional service to/from London St. Pancras 5
Local and longer distance stopping services across the north of England 712
Long distance regional services across northern England 164
Long distance services between London and Leeds with some services starting or terminating at other towns in Yorkshire 67
Total: 983
If being viewed digitally, click
here to go back to summary
Rail passenger numbers and crowding on weekdays in major cities in England and Wales: 2016 - Page 18
Leicester In the AM peak
In the PM peak
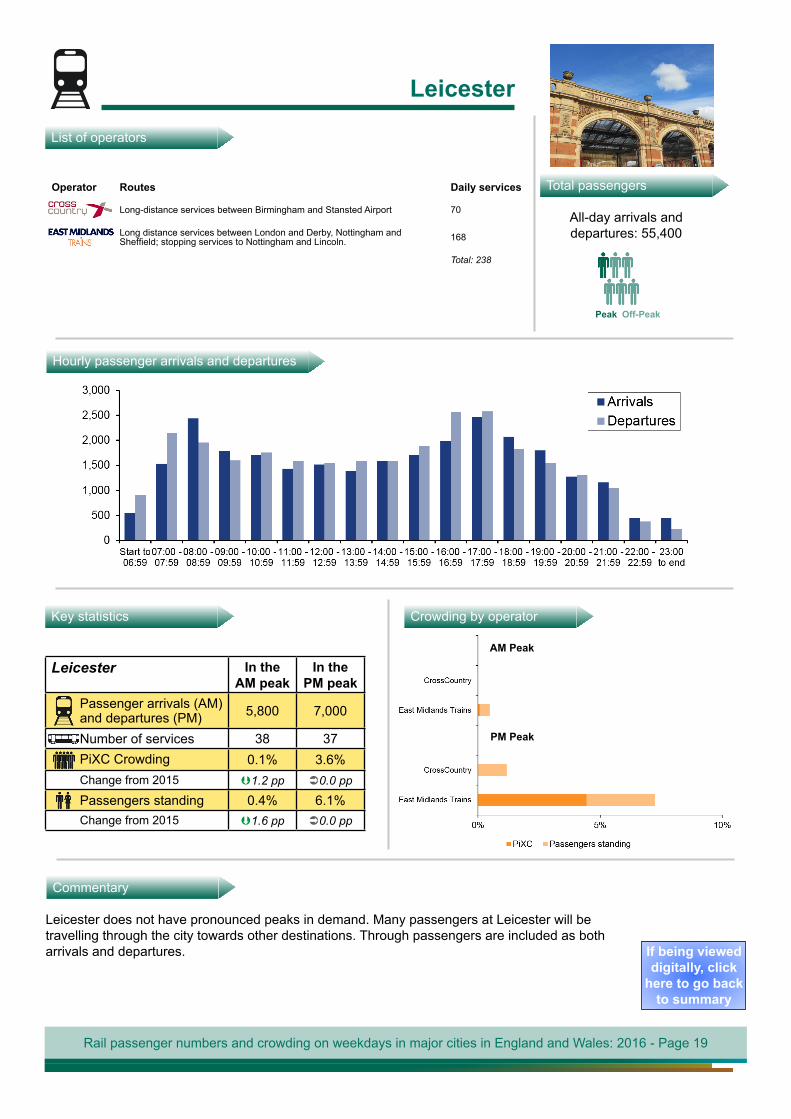
Passenger arrivals (AM) and departures (PM) 5,800 7,000
Number of services 38 37PiXC Crowding 0.1% 3.6%Change from 2015 1.2 pp 0.0 pp
Passengers standing 0.4% 6.1%Change from 2015 1.6 pp 0.0 pp
Leicester
List of operators
Total passengers
All-day arrivals and departures: 55,400
Peak Off-Peak
Hourly passenger arrivals and departures
Key statistics Crowding by operator
AM Peak
PM Peak
Commentary
Leicester does not have pronounced peaks in demand. Many passengers at Leicester will be travelling through the city towards other destinations. Through passengers are included as both arrivals and departures.
Operator Routes Daily services Long-distance services between Birmingham and Stansted Airport 70
Long distance services between London and Derby, Nottingham and Sheffield; stopping services to Nottingham and Lincoln. 168
Total: 238
If being viewed digitally, click
here to go back to summary
Rail passenger numbers and crowding on weekdays in major cities in England and Wales: 2016 - Page 19
Liverpool In the AM peak
In the PM peak
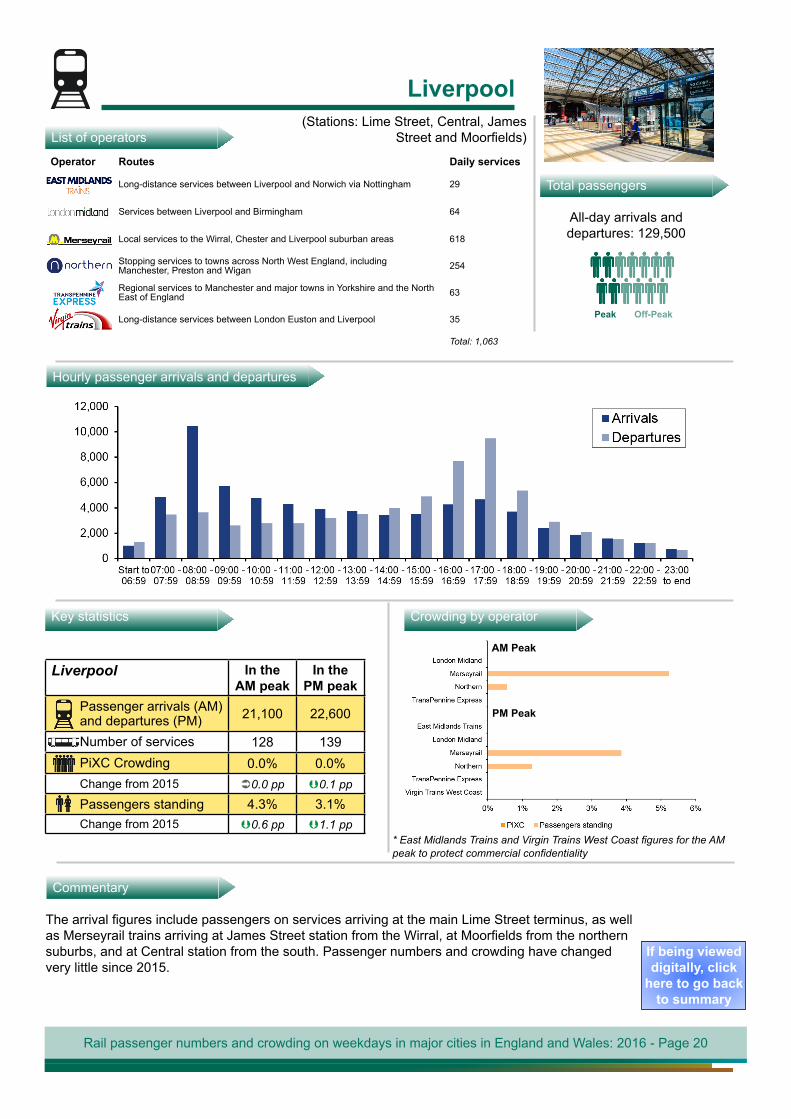
Passenger arrivals (AM) and departures (PM) 21,100 22,600
Number of services 128 139PiXC Crowding 0.0% 0.0%Change from 2015 0.0 pp 0.1 pp
Passengers standing 4.3% 3.1%Change from 2015 0.6 pp 1.1 pp
Liverpool
List of operators(Stations: Lime Street, Central, James
Street and Moorfields)
Total passengers
All-day arrivals and departures: 129,500
Peak Off-Peak
Hourly passenger arrivals and departures
Key statistics Crowding by operator
AM Peak
PM Peak
Commentary
The arrival figures include passengers on services arriving at the main Lime Street terminus, as well as Merseyrail trains arriving at James Street station from the Wirral, at Moorfields from the northern suburbs, and at Central station from the south. Passenger numbers and crowding have changed very little since 2015.
Operator Routes Daily services Long-distance services between Liverpool and Norwich via Nottingham 29
Services between Liverpool and Birmingham 64
Local services to the Wirral, Chester and Liverpool suburban areas 618
Stopping services to towns across North West England, including Manchester, Preston and Wigan 254
Regional services to Manchester and major towns in Yorkshire and the North East of England 63
Long-distance services between London Euston and Liverpool 35
Total: 1,063
* East Midlands Trains and Virgin Trains West Coast figures for the AM peak to protect commercial confidentiality
If being viewed digitally, click
here to go back to summary
Rail passenger numbers and crowding on weekdays in major cities in England and Wales: 2016 - Page 20
Manchester In the AM peak
In the PM peak
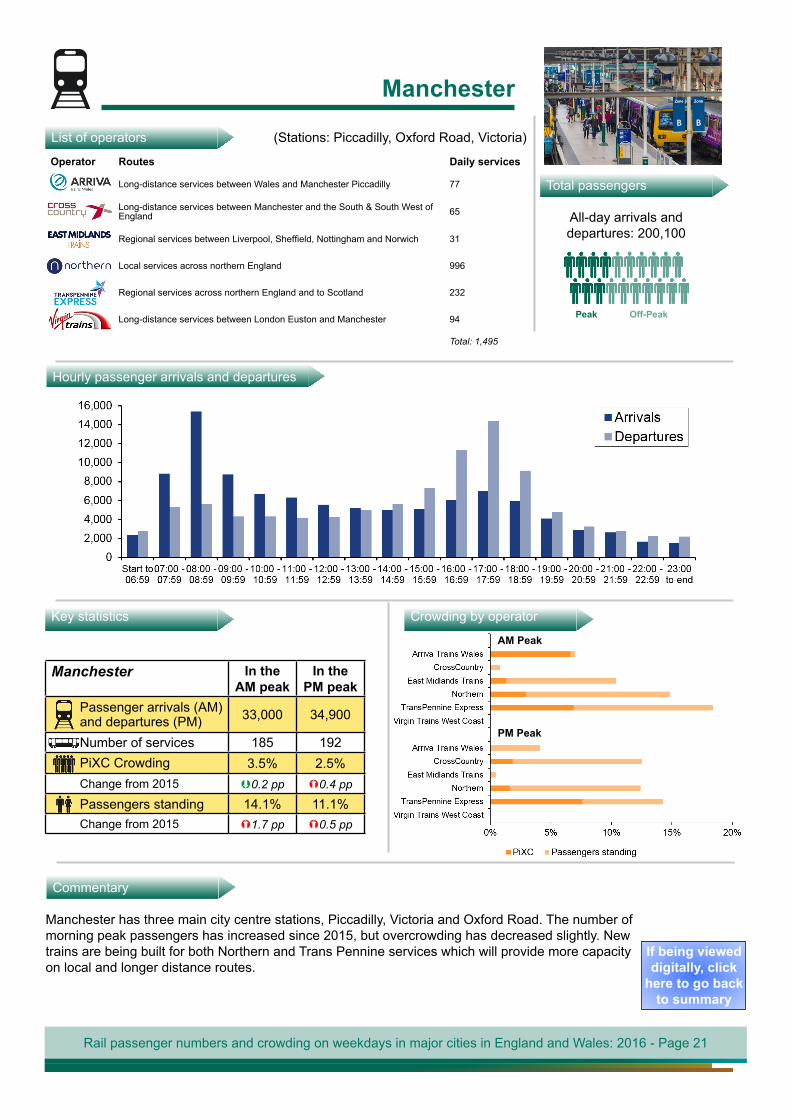
Passenger arrivals (AM) and departures (PM) 33,000 34,900
Number of services 185 192PiXC Crowding 3.5% 2.5%Change from 2015 0.2 pp 0.4 pp
Passengers standing 14.1% 11.1%Change from 2015 1.7 pp 0.5 pp
Manchester
List of operators (Stations: Piccadilly, Oxford Road, Victoria)
Total passengers
All-day arrivals and departures: 200,100
Peak Off-Peak
Hourly passenger arrivals and departures
Key statistics Crowding by operator
AM Peak
PM Peak
Commentary
Manchester has three main city centre stations, Piccadilly, Victoria and Oxford Road. The number of morning peak passengers has increased since 2015, but overcrowding has decreased slightly. New trains are being built for both Northern and Trans Pennine services which will provide more capacity on local and longer distance routes.
Operator Routes Daily services Long-distance services between Wales and Manchester Piccadilly 77
Long-distance services between Manchester and the South & South West of England 65
Regional services between Liverpool, Sheffield, Nottingham and Norwich 31
Local services across northern England 996
Regional services across northern England and to Scotland 232
Long-distance services between London Euston and Manchester 94
Total: 1,495
If being viewed digitally, click
here to go back to summary
Rail passenger numbers and crowding on weekdays in major cities in England and Wales: 2016 - Page 21
Newcastle In the AM peak
In the PM peak
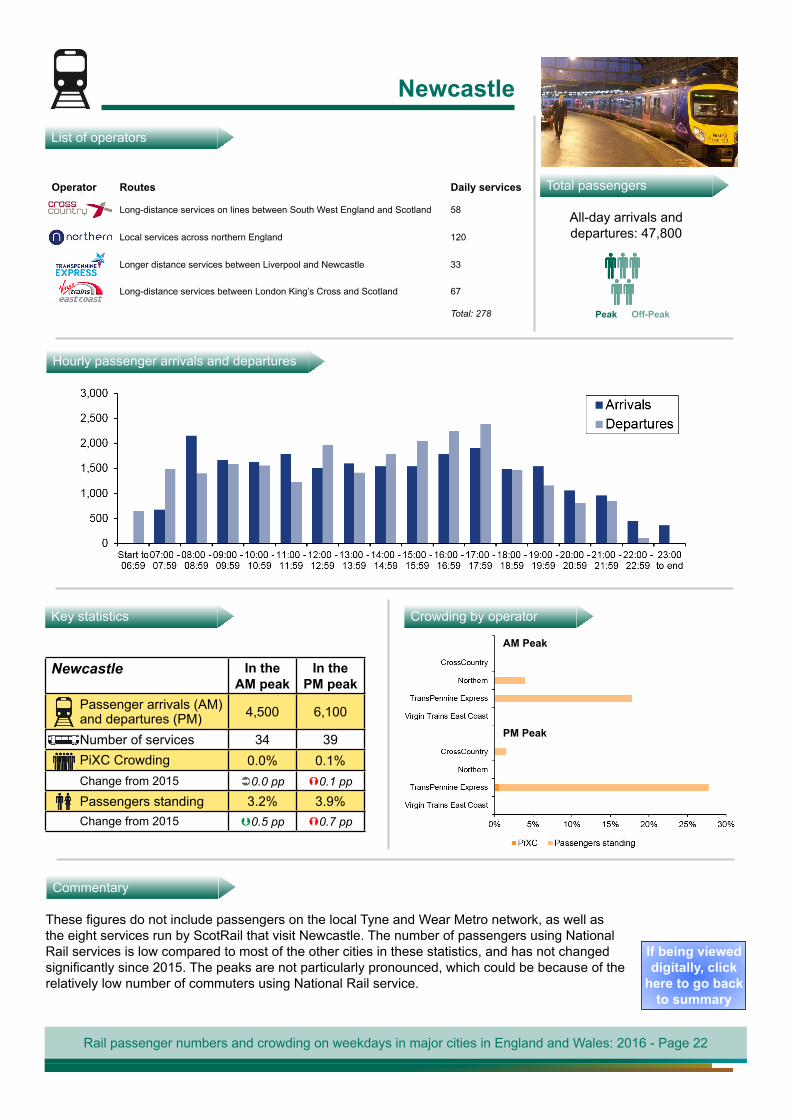
Passenger arrivals (AM) and departures (PM) 4,500 6,100
Number of services 34 39PiXC Crowding 0.0% 0.1%Change from 2015 0.0 pp 0.1 pp
Passengers standing 3.2% 3.9%Change from 2015 0.5 pp 0.7 pp
Newcastle
List of operators
Total passengers
All-day arrivals and departures: 47,800
Peak Off-Peak
Hourly passenger arrivals and departures
Key statistics Crowding by operator
AM Peak
PM Peak
Commentary
These figures do not include passengers on the local Tyne and Wear Metro network, as well as the eight services run by ScotRail that visit Newcastle. The number of passengers using National Rail services is low compared to most of the other cities in these statistics, and has not changed significantly since 2015. The peaks are not particularly pronounced, which could be because of the relatively low number of commuters using National Rail service.
Operator Routes Daily services Long-distance services on lines between South West England and Scotland 58
Local services across northern England 120
Longer distance services between Liverpool and Newcastle 33
Long-distance services between London King’s Cross and Scotland 67
Total: 278
If being viewed digitally, click
here to go back to summary
Rail passenger numbers and crowding on weekdays in major cities in England and Wales: 2016 - Page 22
Nottingham In the AM peak
In the PM peak
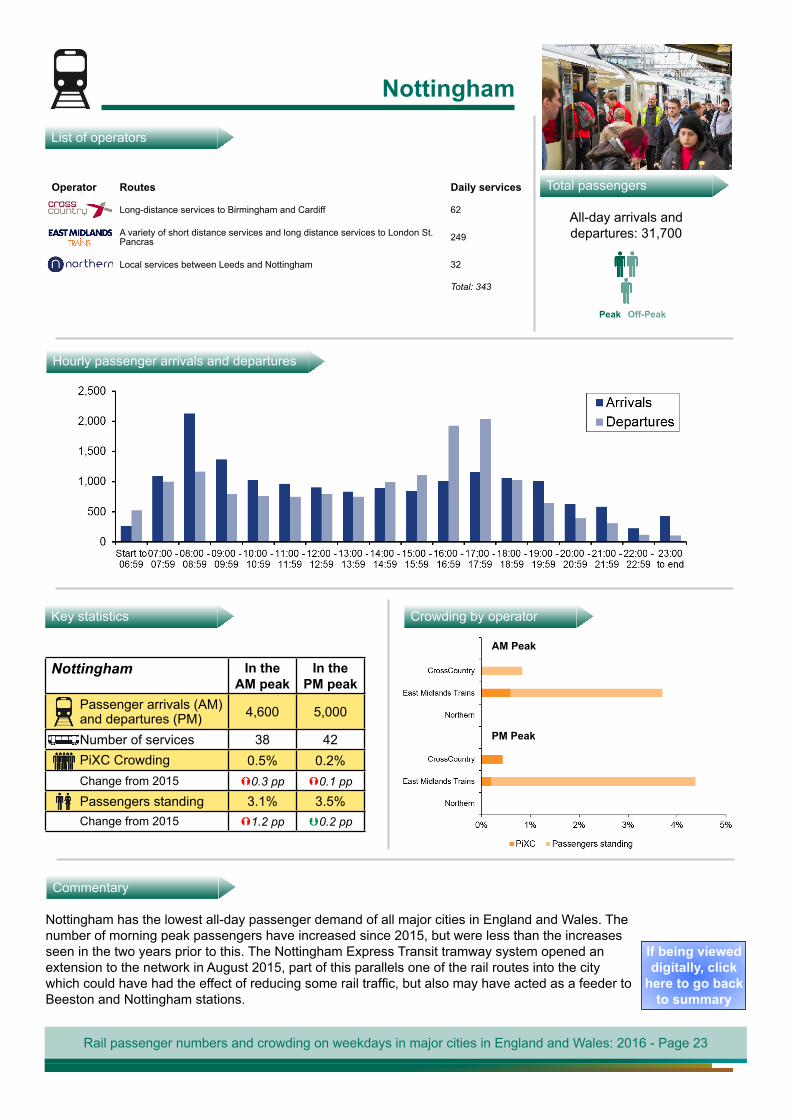
Passenger arrivals (AM) and departures (PM) 4,600 5,000
Number of services 38 42PiXC Crowding 0.5% 0.2%Change from 2015 0.3 pp 0.1 pp
Passengers standing 3.1% 3.5%Change from 2015 1.2 pp 0.2 pp
Nottingham
List of operators
Total passengers
All-day arrivals and departures: 31,700
Peak Off-Peak
Hourly passenger arrivals and departures
Key statistics Crowding by operator
AM Peak
PM Peak
Commentary
Nottingham has the lowest all-day passenger demand of all major cities in England and Wales. The number of morning peak passengers have increased since 2015, but were less than the increases seen in the two years prior to this. The Nottingham Express Transit tramway system opened an extension to the network in August 2015, part of this parallels one of the rail routes into the city which could have had the effect of reducing some rail traffic, but also may have acted as a feeder to Beeston and Nottingham stations.
Operator Routes Daily services Long-distance services to Birmingham and Cardiff 62
A variety of short distance services and long distance services to London St. Pancras 249
Local services between Leeds and Nottingham 32
Total: 343
If being viewed digitally, click
here to go back to summary
Rail passenger numbers and crowding on weekdays in major cities in England and Wales: 2016 - Page 23
Sheffield In the AM peak
In the PM peak
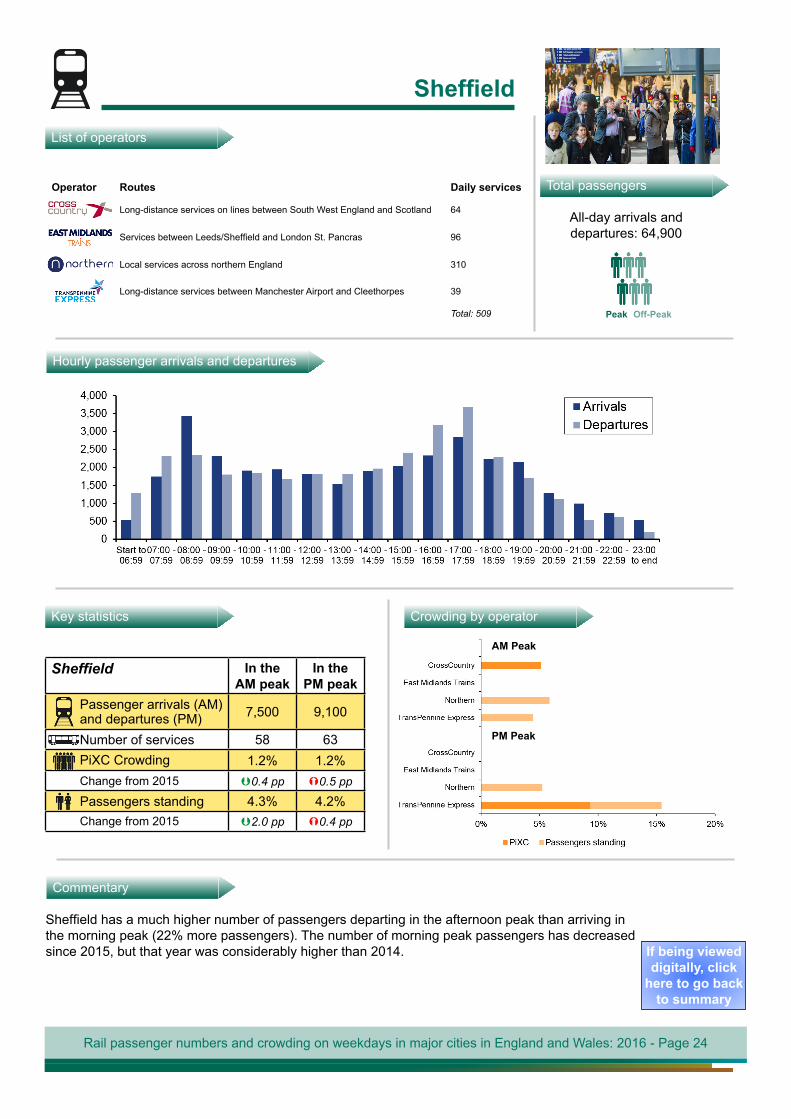
Passenger arrivals (AM) and departures (PM) 7,500 9,100
Number of services 58 63PiXC Crowding 1.2% 1.2%Change from 2015 0.4 pp 0.5 pp
Passengers standing 4.3% 4.2%Change from 2015 2.0 pp 0.4 pp
Sheffield
List of operators
Total passengers
All-day arrivals and departures: 64,900
Peak Off-Peak
Hourly passenger arrivals and departures
Key statistics Crowding by operator
AM Peak
PM Peak
Commentary
Sheffield has a much higher number of passengers departing in the afternoon peak than arriving in the morning peak (22% more passengers). The number of morning peak passengers has decreased since 2015, but that year was considerably higher than 2014.
Operator Routes Daily services Long-distance services on lines between South West England and Scotland 64
Services between Leeds/Sheffield and London St. Pancras 96
Local services across northern England 310
Long-distance services between Manchester Airport and Cleethorpes 39
Total: 509
If being viewed digitally, click
here to go back to summary
Rail passenger numbers and crowding on weekdays in major cities in England and Wales: 2016 - Page 24
Blackfriars In the AM peak
In the PM peak
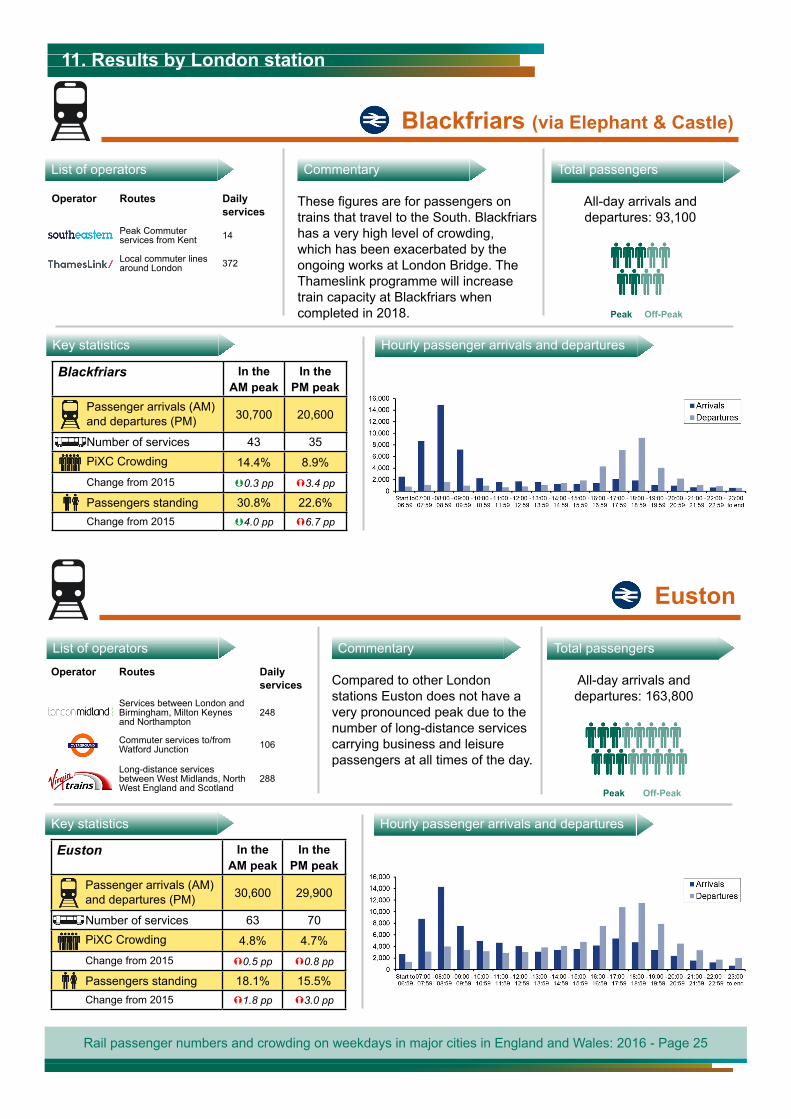
Passenger arrivals (AM) and departures (PM) 30,700 20,600
Number of services 43 35PiXC Crowding 14.4% 8.9%Change from 2015 0.3 pp 3.4 pp
Passengers standing 30.8% 22.6%Change from 2015 4.0 pp 6.7 pp
Blackfriars (via Elephant & Castle)
List of operators Total passengers
All-day arrivals and departures: 93,100
Peak Off-Peak
Hourly passenger arrivals and departuresKey statistics
Commentary
Operator Routes Daily services
Peak Commuter services from Kent 14
Local commuter lines around London 372
Euston
These figures are for passengers on trains that travel to the South. Blackfriars has a very high level of crowding, which has been exacerbated by the ongoing works at London Bridge. The Thameslink programme will increase train capacity at Blackfriars when completed in 2018.
Euston In the AM peak
In the PM peak
Passenger arrivals (AM) and departures (PM) 30,600 29,900
Number of services 63 70PiXC Crowding 4.8% 4.7%Change from 2015 0.5 pp 0.8 pp
Passengers standing 18.1% 15.5%Change from 2015 1.8 pp 3.0 pp
Hourly passenger arrivals and departuresKey statistics
Total passengers
All-day arrivals and departures: 163,800
Peak Off-Peak
11. Results by London station
List of operators Commentary
Operator Routes Daily services
Services between London and Birmingham, Milton Keynes and Northampton
248
Commuter services to/from Watford Junction 106
Long-distance services between West Midlands, North West England and Scotland
288
Compared to other London stations Euston does not have a very pronounced peak due to the number of long-distance services carrying business and leisure passengers at all times of the day.
Rail passenger numbers and crowding on weekdays in major cities in England and Wales: 2016 - Page 25
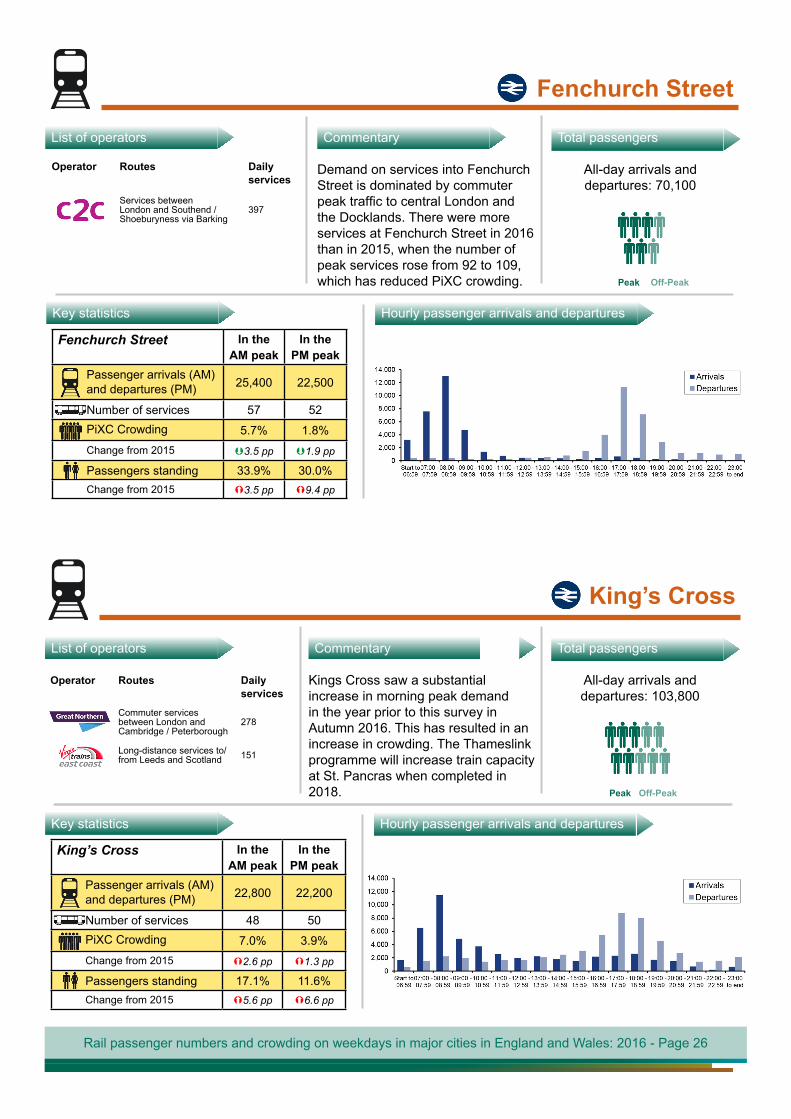
Fenchurch Street In the AM peak
In the PM peak
Passenger arrivals (AM) and departures (PM) 25,400 22,500
Number of services 57 52PiXC Crowding 5.7% 1.8%Change from 2015 3.5 pp 1.9 pp
Passengers standing 33.9% 30.0%Change from 2015 3.5 pp 9.4 pp
Fenchurch Street
List of operators Total passengers
All-day arrivals and departures: 70,100
Peak Off-Peak
Hourly passenger arrivals and departuresKey statistics
Commentary
Operator Routes Daily services
Services between London and Southend / Shoeburyness via Barking
397
King’s Cross
King’s Cross In the AM peak
In the PM peak
Passenger arrivals (AM) and departures (PM) 22,800 22,200
Number of services 48 50PiXC Crowding 7.0% 3.9%Change from 2015 2.6 pp 1.3 pp
Passengers standing 17.1% 11.6%Change from 2015 5.6 pp 6.6 pp
Hourly passenger arrivals and departuresKey statistics
Demand on services into Fenchurch Street is dominated by commuter peak traffic to central London and the Docklands. There were more services at Fenchurch Street in 2016 than in 2015, when the number of peak services rose from 92 to 109, which has reduced PiXC crowding.
List of operators Total passengers
All-day arrivals and departures: 103,800
Peak Off-Peak
Commentary
Kings Cross saw a substantial increase in morning peak demand in the year prior to this survey in Autumn 2016. This has resulted in an increase in crowding. The Thameslink programme will increase train capacity at St. Pancras when completed in 2018.
Operator Routes Daily services
Commuter services between London and Cambridge / Peterborough
278
Long-distance services to/from Leeds and Scotland 151
Rail passenger numbers and crowding on weekdays in major cities in England and Wales: 2016 - Page 26
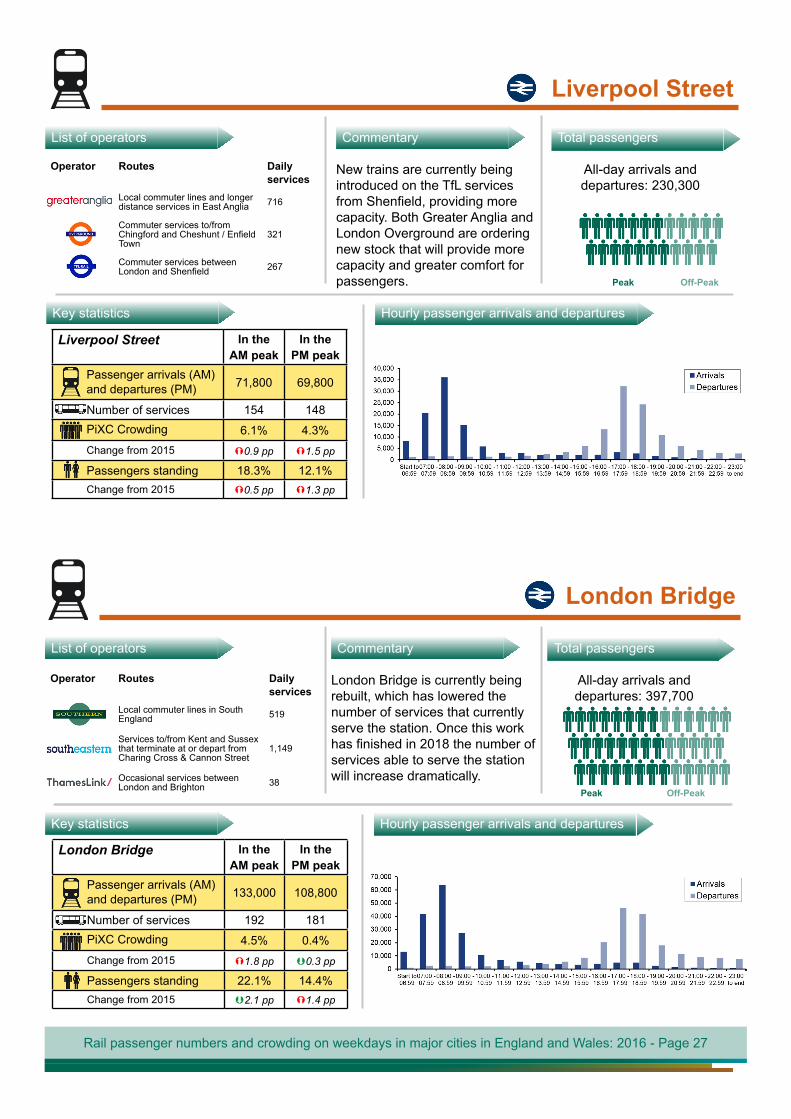
London Bridge In the AM peak
In the PM peak
Passenger arrivals (AM) and departures (PM) 133,000 108,800
Number of services 192 181PiXC Crowding 4.5% 0.4%Change from 2015 1.8 pp 0.3 pp
Passengers standing 22.1% 14.4%Change from 2015 2.1 pp 1.4 pp
Liverpool Street In the AM peak
In the PM peak
Passenger arrivals (AM) and departures (PM) 71,800 69,800
Number of services 154 148PiXC Crowding 6.1% 4.3%Change from 2015 0.9 pp 1.5 pp
Passengers standing 18.3% 12.1%Change from 2015 0.5 pp 1.3 pp
Liverpool Street
List of operators Total passengers
All-day arrivals and departures: 230,300
Peak Off-Peak
Hourly passenger arrivals and departuresKey statistics
Commentary
London Bridge
Hourly passenger arrivals and departuresKey statistics
New trains are currently being introduced on the TfL services from Shenfield, providing more capacity. Both Greater Anglia and London Overground are ordering new stock that will provide more capacity and greater comfort for passengers.
List of operators Commentary
London Bridge is currently being rebuilt, which has lowered the number of services that currently serve the station. Once this work has finished in 2018 the number of services able to serve the station will increase dramatically.
Operator Routes Daily services
Local commuter lines in South England 519
Services to/from Kent and Sussex that terminate at or depart from Charing Cross & Cannon Street
1,149
Occasional services between London and Brighton 38
Operator Routes Daily services
Local commuter lines and longer distance services in East Anglia 716
Commuter services to/from Chingford and Cheshunt / Enfield Town
321
Commuter services between London and Shenfield 267
Total passengers
All-day arrivals and departures: 397,700
Peak Off-Peak
Rail passenger numbers and crowding on weekdays in major cities in England and Wales: 2016 - Page 27
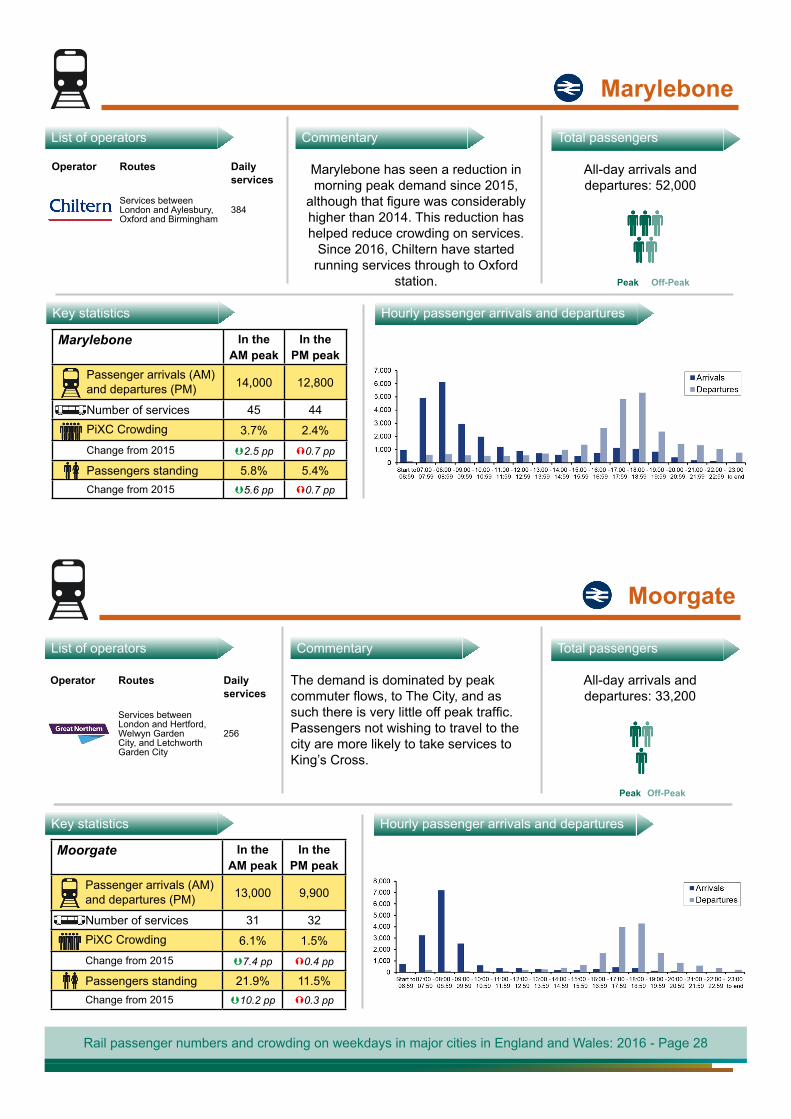
Marylebone In the AM peak
In the PM peak
Passenger arrivals (AM) and departures (PM) 14,000 12,800
Number of services 45 44PiXC Crowding 3.7% 2.4%Change from 2015 2.5 pp 0.7 pp
Passengers standing 5.8% 5.4%Change from 2015 5.6 pp 0.7 pp
Marylebone
List of operators Total passengers
All-day arrivals and departures: 52,000
Peak Off-Peak
Hourly passenger arrivals and departuresKey statistics
Commentary
Operator Routes Daily services
Services between London and Aylesbury, Oxford and Birmingham
384
Moorgate
Moorgate In the AM peak
In the PM peak
Passenger arrivals (AM) and departures (PM) 13,000 9,900
Number of services 31 32PiXC Crowding 6.1% 1.5%Change from 2015 7.4 pp 0.4 pp
Passengers standing 21.9% 11.5%Change from 2015 10.2 pp 0.3 pp
Hourly passenger arrivals and departuresKey statistics
List of operators Total passengers
All-day arrivals and departures: 33,200
Peak Off-Peak
Commentary
The demand is dominated by peak commuter flows, to The City, and as such there is very little off peak traffic. Passengers not wishing to travel to the city are more likely to take services to King’s Cross.
Operator Routes Daily services
Services between London and Hertford, Welwyn Garden City, and Letchworth Garden City
256
Marylebone has seen a reduction in morning peak demand since 2015,
although that figure was considerably higher than 2014. This reduction has helped reduce crowding on services.
Since 2016, Chiltern have started running services through to Oxford
station.
Rail passenger numbers and crowding on weekdays in major cities in England and Wales: 2016 - Page 28
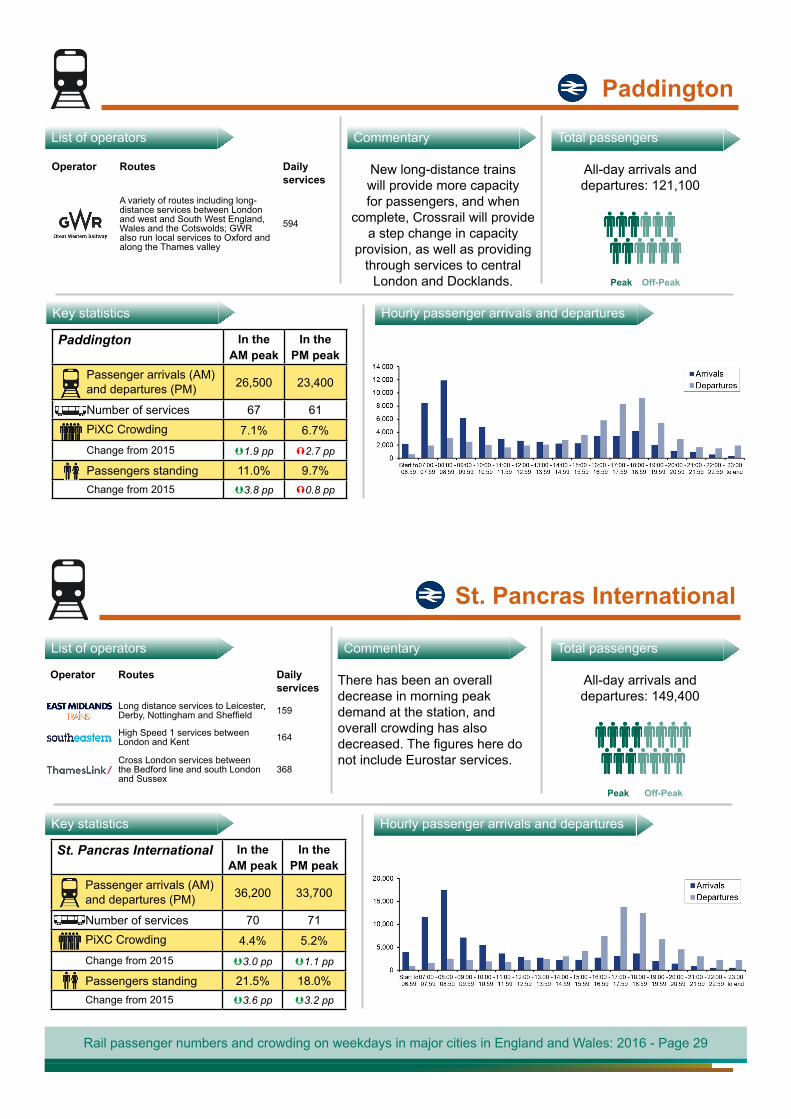
Paddington In the AM peak
In the PM peak
Passenger arrivals (AM) and departures (PM) 26,500 23,400
Number of services 67 61PiXC Crowding 7.1% 6.7%Change from 2015 1.9 pp 2.7 pp
Passengers standing 11.0% 9.7%Change from 2015 3.8 pp 0.8 pp
Paddington
List of operators Total passengers
All-day arrivals and departures: 121,100
Peak Off-Peak
Hourly passenger arrivals and departuresKey statistics
Commentary
Operator Routes Daily services
A variety of routes including long-distance services between London and west and South West England, Wales and the Cotswolds; GWR also run local services to Oxford and along the Thames valley
594
St. Pancras International
St. Pancras International In the AM peak
In the PM peak
Passenger arrivals (AM) and departures (PM) 36,200 33,700
Number of services 70 71PiXC Crowding 4.4% 5.2%Change from 2015 3.0 pp 1.1 pp
Passengers standing 21.5% 18.0%Change from 2015 3.6 pp 3.2 pp
Hourly passenger arrivals and departuresKey statistics
New long-distance trains will provide more capacity for passengers, and when
complete, Crossrail will provide a step change in capacity
provision, as well as providing through services to central
London and Docklands.
List of operators Total passengers
All-day arrivals and departures: 149,400
Peak Off-Peak
Commentary
There has been an overall decrease in morning peak demand at the station, and overall crowding has also decreased. The figures here do not include Eurostar services.
Operator Routes Daily services
Long distance services to Leicester, Derby, Nottingham and Sheffield 159
High Speed 1 services between London and Kent 164
Cross London services between the Bedford line and south London and Sussex
368
Rail passenger numbers and crowding on weekdays in major cities in England and Wales: 2016 - Page 29
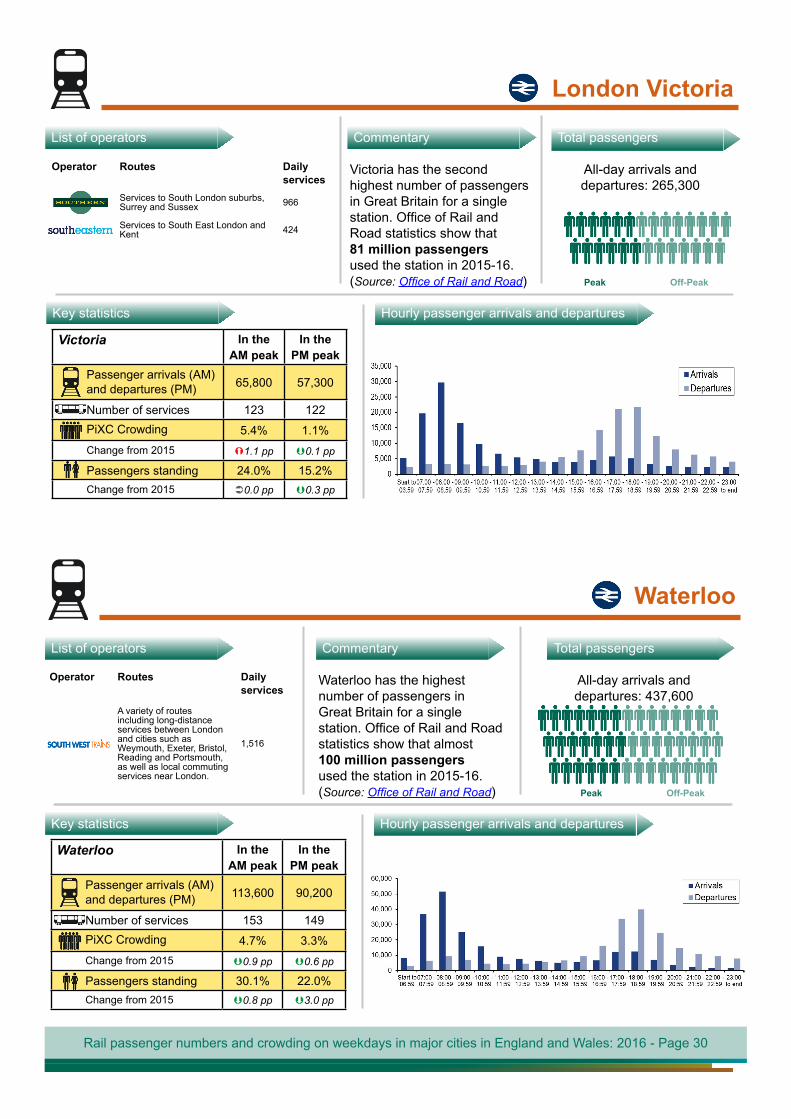
Victoria In the AM peak
In the PM peak
Passenger arrivals (AM) and departures (PM) 65,800 57,300
Number of services 123 122PiXC Crowding 5.4% 1.1%Change from 2015 1.1 pp 0.1 pp
Passengers standing 24.0% 15.2%Change from 2015 0.0 pp 0.3 pp
London Victoria
List of operators Total passengers
All-day arrivals and departures: 265,300
Peak Off-Peak
Hourly passenger arrivals and departuresKey statistics
Commentary
Operator Routes Daily services
Services to South London suburbs, Surrey and Sussex 966
Services to South East London and Kent 424
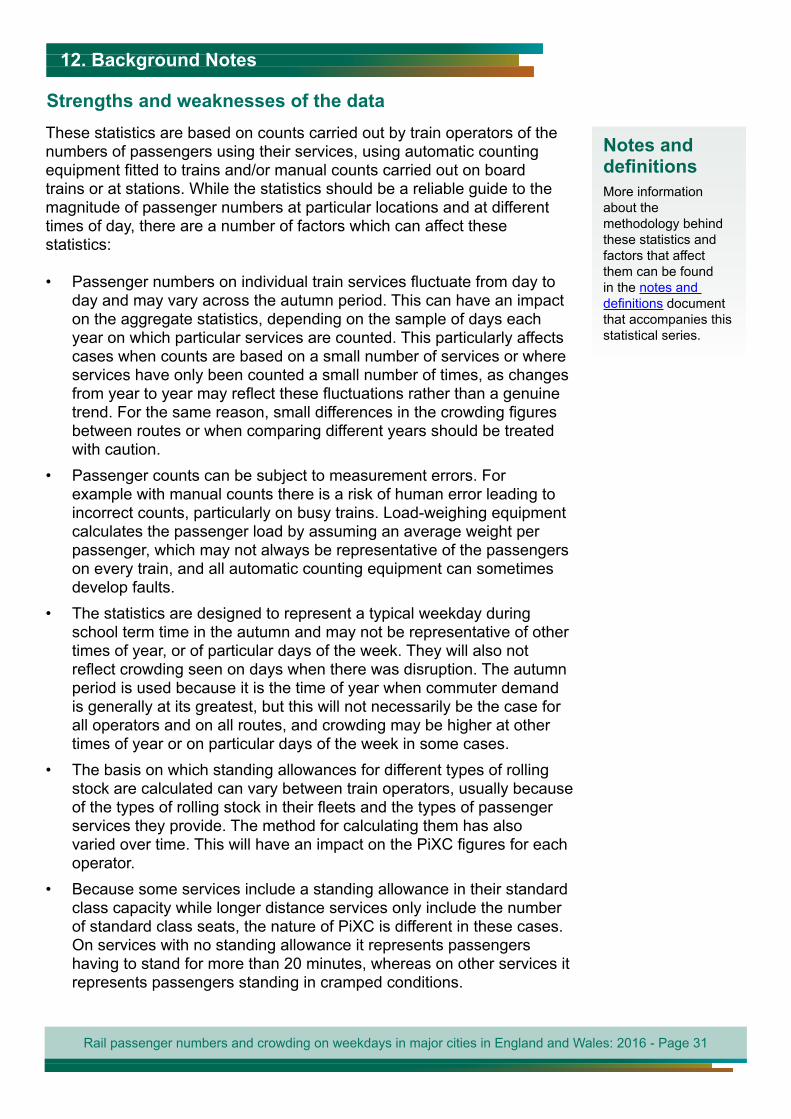
Waterloo
List of operators Commentary
Operator Routes Daily services
A variety of routes including long-distance services between London and cities such as Weymouth, Exeter, Bristol, Reading and Portsmouth, as well as local commuting services near London.
1,516
Waterloo In the AM peak
In the PM peak
Passenger arrivals (AM) and departures (PM) 113,600 90,200
Number of services 153 149PiXC Crowding 4.7% 3.3%Change from 2015 0.9 pp 0.6 pp
Passengers standing 30.1% 22.0%Change from 2015 0.8 pp 3.0 pp
Hourly passenger arrivals and departuresKey statistics
Total passengers
All-day arrivals and departures: 437,600
Peak Off-Peak
Waterloo has the highest number of passengers in Great Britain for a single station. Office of Rail and Road statistics show that almost 100 million passengers used the station in 2015-16. (Source: Office of Rail and Road)
Victoria has the second highest number of passengers in Great Britain for a single station. Office of Rail and Road statistics show that 81 million passengers used the station in 2015-16. (Source: Office of Rail and Road)
Rail passenger numbers and crowding on weekdays in major cities in England and Wales: 2016 - Page 30
Background Notes12. Background Notes
These statistics are based on counts carried out by train operators of the numbers of passengers using their services, using automatic counting equipment fitted to trains and/or manual counts carried out on board trains or at stations. While the statistics should be a reliable guide to the magnitude of passenger numbers at particular locations and at different times of day, there are a number of factors which can affect these statistics:
• Passenger numbers on individual train services fluctuate from day to day and may vary across the autumn period. This can have an impact on the aggregate statistics, depending on the sample of days each year on which particular services are counted. This particularly affects cases when counts are based on a small number of services or where services have only been counted a small number of times, as changes from year to year may reflect these fluctuations rather than a genuine trend. For the same reason, small differences in the crowding figures between routes or when comparing different years should be treated with caution.
• Passenger counts can be subject to measurement errors. For example with manual counts there is a risk of human error leading to incorrect counts, particularly on busy trains. Load-weighing equipment calculates the passenger load by assuming an average weight per passenger, which may not always be representative of the passengers on every train, and all automatic counting equipment can sometimes develop faults.
• The statistics are designed to represent a typical weekday during school term time in the autumn and may not be representative of other times of year, or of particular days of the week. They will also not reflect crowding seen on days when there was disruption. The autumn period is used because it is the time of year when commuter demand is generally at its greatest, but this will not necessarily be the case for all operators and on all routes, and crowding may be higher at other times of year or on particular days of the week in some cases.
• The basis on which standing allowances for different types of rolling stock are calculated can vary between train operators, usually because of the types of rolling stock in their fleets and the types of passenger services they provide. The method for calculating them has also varied over time. This will have an impact on the PiXC figures for each operator.
• Because some services include a standing allowance in their standard class capacity while longer distance services only include the number of standard class seats, the nature of PiXC is different in these cases. On services with no standing allowance it represents passengers having to stand for more than 20 minutes, whereas on other services it represents passengers standing in cramped conditions.
Strengths and weaknesses of the data
Notes and definitionsMore information about the methodology behind these statistics and factors that affect them can be found in the notes and definitions document that accompanies this statistical series.
Rail passenger numbers and crowding on weekdays in major cities in England and Wales: 2016 - Page 31
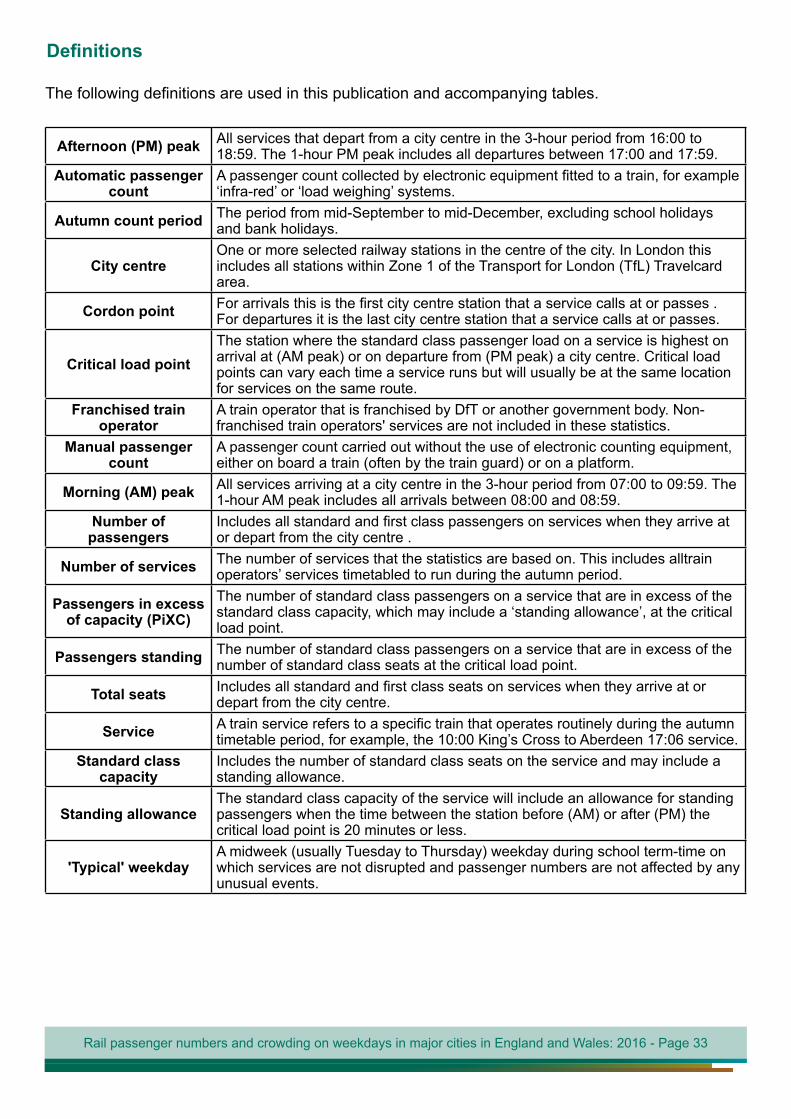
Tables accompanying this release
Passenger number statistics tables
Table no. Table title
RAI0201 City centre arrivals and departures by rail on a typical autumn weekday, by city and time band: annual from 2010
RAI0202 City centre arrivals and departures by rail on a typical autumn weekday, by city and time band: annual from 2010
RAI0203 Central London arrivals and departures by rail on a typical autumn weekday, by station and time band: annual from 2010
Crowding statistics tables
Table no. Table title
RAI0209 Passengers in excess of capacity (PiXC) on a typical autumn weekday by city: annual from 2011
RAI0210Passengers in excess of capacity (PiXC) on a typical autumn weekday on London and South East train operators' services: annual from 1990
RAI0211Passengers in excess of capacity (PiXC) on a typical autumn weekday by operator: London and South East train operators: annual from 2000 (revised since last publication to include historic data from 2000 to 2007)
RAI0212Peak rail capacity, standard class critical loads and crowding on a typical autumn weekday by city: annual from 2010
RAI0213Peak rail capacity, standard class critical loads and crowding on a typical autumn weekday in London by terminal: annual from 2010
RAI0214Peak crowding on a typical autumn weekday by city and train operator: annual from 2011
RAI0215Peak crowding on a typical autumn weekday in London by terminal and train operator: annual from 2011
RevisionsRevisions in February 2017 were made to the back-series of PiXC statistics from 2011 to 2014. This was following a change of methodology used for calculating PiXC which involved the estimation of the number of first class passengers. These changes were small in magnitude and the commentary presented in the previous release still applies. More information on these revisions can be found in the correction note given here: https://www.gov.uk/government/uploads/system/uploads/attachment_data/file/590534/rail-passengers-crowding-2015-revision-note.pdf.
Rail passenger numbers and crowding on weekdays in major cities in England and Wales: 2016 - Page 32
Ten tables have been published alongside this release, three showing passenger number statistics and seven showing crowding statistics. The tables are listed below and can be found at the following link: https://www.gov.uk/government/statistical-data-sets/rai02-capacity-and-overcrowding.
Definitions
The following definitions are used in this publication and accompanying tables.
Afternoon (PM) peak All services that depart from a city centre in the 3-hour period from 16:00 to 18:59. The 1-hour PM peak includes all departures between 17:00 and 17:59.
Automatic passenger count
A passenger count collected by electronic equipment fitted to a train, for example ‘infra-red’ or ‘load weighing’ systems.
Autumn count period The period from mid-September to mid-December, excluding school holidays and bank holidays.
City centreOne or more selected railway stations in the centre of the city. In London this includes all stations within Zone 1 of the Transport for London (TfL) Travelcard area.
Cordon point For arrivals this is the first city centre station that a service calls at or passes . For departures it is the last city centre station that a service calls at or passes.
Critical load pointThe station where the standard class passenger load on a service is highest on arrival at (AM peak) or on departure from (PM peak) a city centre. Critical load points can vary each time a service runs but will usually be at the same location for services on the same route.
Franchised train operator
A train operator that is franchised by DfT or another government body. Non-franchised train operators' services are not included in these statistics.
Manual passenger count
A passenger count carried out without the use of electronic counting equipment, either on board a train (often by the train guard) or on a platform.
Morning (AM) peak All services arriving at a city centre in the 3-hour period from 07:00 to 09:59. The 1-hour AM peak includes all arrivals between 08:00 and 08:59.
Number of passengers
Includes all standard and first class passengers on services when they arrive at or depart from the city centre .
Number of services The number of services that the statistics are based on. This includes alltrain operators’ services timetabled to run during the autumn period.
Passengers in excess of capacity (PiXC)
The number of standard class passengers on a service that are in excess of the standard class capacity, which may include a ‘standing allowance’, at the critical load point.
Passengers standing The number of standard class passengers on a service that are in excess of the number of standard class seats at the critical load point.
Total seats Includes all standard and first class seats on services when they arrive at or depart from the city centre.
Service A train service refers to a specific train that operates routinely during the autumn timetable period, for example, the 10:00 King’s Cross to Aberdeen 17:06 service.
Standard class capacity
Includes the number of standard class seats on the service and may include a standing allowance.
Standing allowanceThe standard class capacity of the service will include an allowance for standing passengers when the time between the station before (AM) or after (PM) the critical load point is 20 minutes or less.
'Typical' weekdayA midweek (usually Tuesday to Thursday) weekday during school term-time on which services are not disrupted and passenger numbers are not affected by any unusual events.
Rail passenger numbers and crowding on weekdays in major cities in England and Wales: 2016 - Page 33
To hear more about DfT statistics publications as they are released please follow us on Twitter via our @DfTstats account: http://www.twitter.com/DfTstats
These statistics and the underlying passenger counts are used within Government and across therail industry for a wide variety of purposes. Some of the main uses include:
• Informing Government policy on rail, including decisions on infrastructure, station and rollingstock investment.
•models used in the assessment of franchise bids.
• In the day to day running of train operating companies, including how they plan timetables andassess rolling stock deployment.
• Understanding and monitoring passenger demand and crowding.
• Validating models of passenger demand.
A summary of feedback received from users in a 2013 consultation is published on the DfT railstatistics notes and guidance webpage: https://www.gov.uk/transport-statistics-notes-and-guidance-rail-statistics.
We are always keen to hear how these statistics are used and would welcome your views on thisrelease. Comments and queries can be addressed to [email protected].
Background notes
1. Further information about the statistics in this report can be found in the .
2.excluded from the 2016 passenger number statistics. See the for details of
3. The United Kingdom Statistics Authority has designated these statistics as National Statistics, inaccordance with the Statistics and Registration Service Act 2007 and signifying compliance withthe .
4. Designation can be broadly interpreted to mean that the statistics:
•
• are well explained and readily accessible;
• are produced according to sound methods, and
• are managed impartially and objectively in the public interest.
• Once statistics have been designated as National Statistics it is a statutory requirement that theCode of Practice shall continue to be observed.
5.hours before release can be found in the Pre-release access list.
6. This is an annual publication. The next annual release of rail passenger numbers and crowdingstatistics will be the 2017 statistics published in summer 2018.
Users and uses of these statistics
Rail passenger numbers and crowding on weekdays in major cities in England and Wales: 2016 - Page 34