Embed Size (px)
Citation preview

RAIN WATER HARVESTING FOR URBAN FLOOD PEAK REDUCTION
Dr. A.K.Sarma, IIT Guwahati, India
M. D. Baishya, Engineering Student, NERIST, India
G. Giraud, Engineering Student, ENGEES, France
2005

INTRODUCTION Guwahati, the gateway to the North Eastern Region of
India is situated in the zone of heavy rainfall.
It has witnessed large population growth, huge construction activities and unplanned urbanisation in the last few decades.
Outcomes: denudation of surrounding hills
soil erosion and sedimentation in the drains
filling-up of low-lying areas water logging
throwing of garbage to the rivers and drains congestion of the drains, and flood during rainy season
Rapid and huge withdrawal of ground water water shortage in many parts, particularly during winter

Why Rain Water Harvesting
(RWH)?
RWH can lead to
Reduction of Peak flow & Flood
Increased ground water recharge & Reduction
of Water Shortage Problem
Partial Reduction of Soil erosion
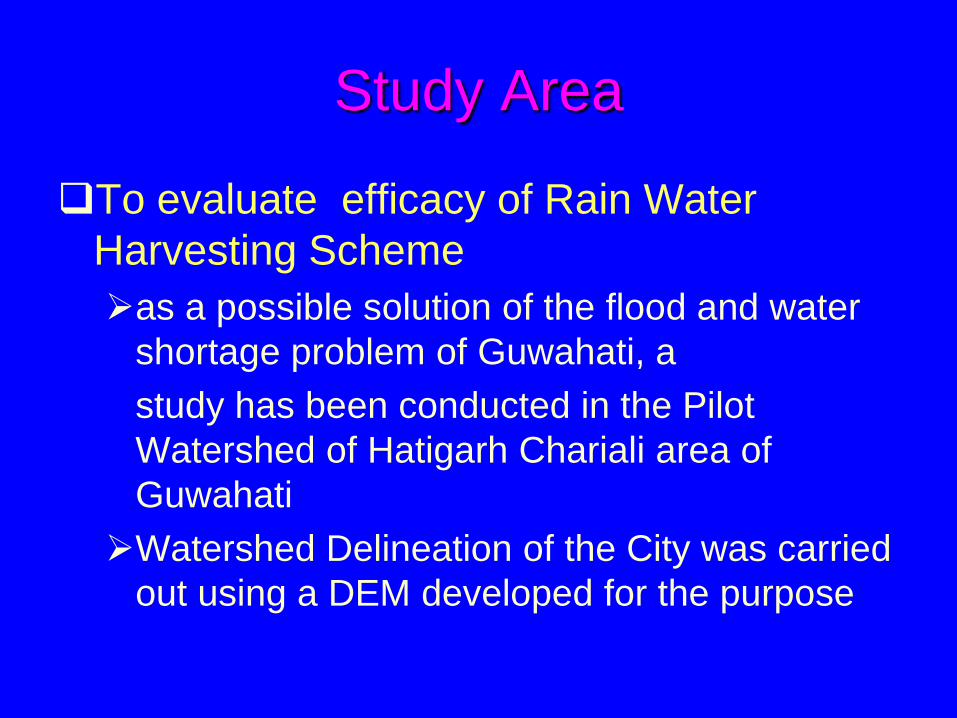
Study Area
To evaluate efficacy of Rain Water
Harvesting Scheme
as a possible solution of the flood and water
shortage problem of Guwahati, a
study has been conducted in the Pilot
Watershed of Hatigarh Chariali area of
Guwahati
Watershed Delineation of the City was carried
out using a DEM developed for the purpose

Development of DEM

Watershed delineation


GPS points on Georeferenced
Image

Hatigarh Chariali Watershed
Delineation of Total Watershed with Location of Outlet Drain

Hilly and Plain Areas of Hatigarh
Watershed

Buildings and Drains in Hatigarh
Watershed


Summary of GIS Analysis
Particulars Length (km) Area (ha)
Total Watershed - 280
Plain part - 175
Hill part - 105
Total Drains 17.6 -
Total Roof Area - 21.3
Roof area as % of plain
area 12.2
Relevant Data of GIS Analysis of Watershed

Computation of peak discharge by
Rational method
• Peak Discharge from a watershed is given by
Where, Q = Peak Discharge or rate of Runoff (Cumec),
C = Runoff Coefficient,
i = Maximum intensity of runoff for the
time of concentration of the selected
design storm (mm/hr), and
A = Area of watershed in m2
000,00,36/CiAQ

Intensity-Duration Relationship
0
10
20
30
40
50
60
0 2 4 6 8 10
Duration (h)
Inte
nsit
y (
mm
/h)
Dei
2179.0307.51
After Sarma and Goswami (2004)

Special Considerations for Urban
Watershed The land use pattern in urban watershed is
different from usual watersheds.
This results in modification of the values of empirical factors to be used in the hydrological models.
Presence of manmade structures modifies the drainage pattern of the watershed, compared to an ordinary watershed
These points are duly considered while applying hydrological models in urban areas like Guwahati.


Standard Values of C for Urban
Watershed (Sarma et. al., 2005)
Sl.
No
Land Use Type C-Values
1 High Residential 0.21
2 Medium Residential 0.22
3 Low Residential 0.22
4 Open Mix Forest (slope> 30%) 0.25
5 Open Mix Forest (slope< 30%) 0.20
6 Dense Mix Forest (slope> 30%) 0.15
7 Dense Mix Forest (slope< 30%) 0.10
8 Agricultural land (Scrubland) 0.40
9 Beel (swampy) 0.36
10 Light Industrial 0.20
11 Heavy Industrial 0.25
12 Mixed Built-up 0.30
13 Transportation (Railways/yards) 0.35
14 Public, Semipublic & Educational Institute 0.29

Design storm producing peak discharge at the outlet
Parameters Values
Duration of rainfall producing
Peak Runoff Volume (min) 54
Intensity corresponding to Peak
Runoff Volume (mm/h) 42.17
Runoff Coefficient of the
Watershed (C) 0.212
Discharge Q (m3/s) 6.93 m3/s
Flow Notation
Time of
Concentration
(min)
Overland To 7.22
Shallow Concentrated Tsc 7.23
Channel Td 39.52
Total Tc 53.97 54.00
Time of Concentration

Computation of Normal Depth
• Computation of Normal Depth needs iterative
solution of Manning’s Equation.
• To avoid iterative solution Barr and Das
Equations are used
• For rectangular channels,
3/82/1Bs
nQQ
b
N
5/3855.01
NNNQQY
NnBYy
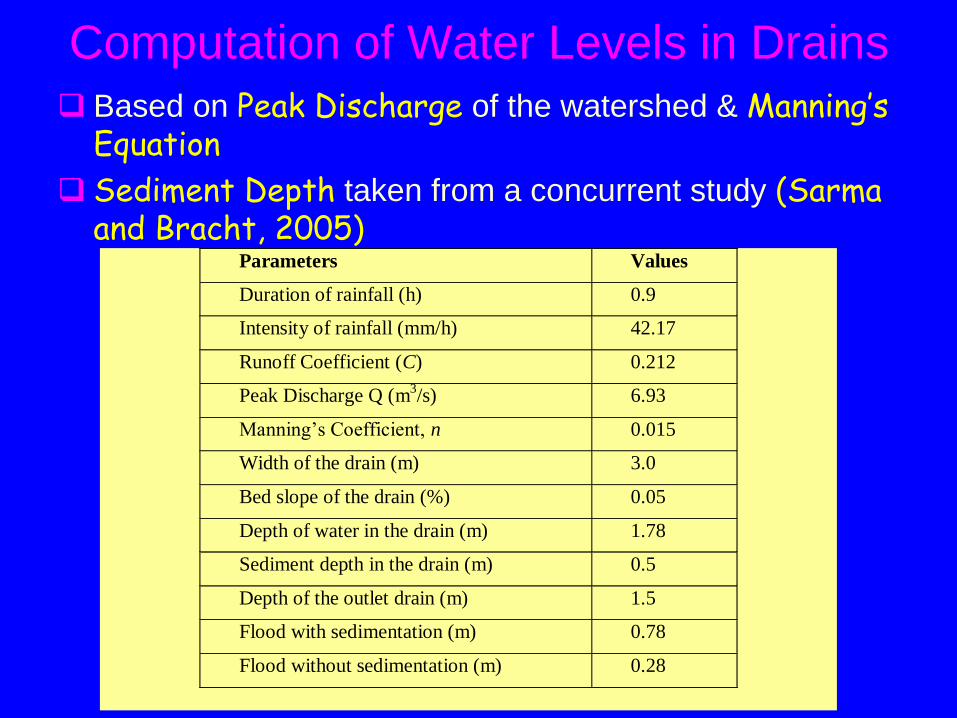
Computation of Water Levels in Drains
Based on Peak Discharge of the watershed & Manning’s Equation
Sediment Depth taken from a concurrent study (Sarma and Bracht, 2005)
Parameters Values
Duration of rainfall (h) 0.9
Intensity of rainfall (mm/h) 42.17
Runoff Coefficient (C) 0.212
Peak Discharge Q (m3/s) 6.93
Manning’s Coefficient, n 0.015
Width of the drain (m) 3.0
Bed slope of the drain (%) 0.05
Depth of water in the drain (m) 1.78
Sediment depth in the drain (m) 0.5
Depth of the outlet drain (m) 1.5
Flood with sedimentation (m) 0.78
Flood without sedimentation (m) 0.28

HYDROLOGICAL ANALYSIS
• From the above analysis it may be concluded that – the peak discharge from the watershed
cannot be carried by the drains of the watershed without creation of flood, even when there is no sedimentation.
– Thus, the solution of the flood problem calls for the reduction of peak discharge by some means
– Rain Water Harvesting (RWH) scheme is one option

Socio-Economic Survey
• Preceding the analysis, a Socio-economic questionnaire survey is carried out to
• understand the current situation in a better way
and
• to study the acceptability of the proposed RWH
scheme among the people.

Socio-economic Study
PRESENT SOURCE OF WATER
WELL WATER SUPPLY & WELL
IN GENERAL 57% 43%
HIGH LAND 100% 0%
LOW LAND 35% 65%
OCCURRENCE OF FLOODS DURING RAINY PERIOD
Occurs Does not Occur
IN GENERAL 44% 56%
HIGH LAND 10% 90%
LOW LAND 60% 40%

Socioeconomic Data (Contd.)
WATER SCARCITY DURING WINTER
Present Absent
IN GENERAL 40% 60%
HIGH LAND 40% 60%
LOW LAND 40% 60%
WILLINGNESS TO INVEST IN RAINWATER HARVESTING
Willing Unwilling
IN GENERAL 52% 48%
HIGH LAND 50% 50%
LOW LAND 55% 45%

Socioeconomic Data (Contd.)
PREFERRED TYPE OF INVESTMENT
INDIVIDUAL COMMUNITY BASED
COMMUNITY& PRIVATE PARTNERSHIP
IN GENERAL 48% 46% 6%
HIGH LAND 60% 40% 0%
LOW LAND 36% 55% 9%
PREFERRED USE OF HARVESTED WATER
IMMEDIATE
USE USE DURING DRY PERIOD
USE FOR GROUND WATER RECHARGE
IN GENERAL 27% 32% 41%
HIGH LAND 43% 14% 43%
LOW LAND 20% 40% 40%

DESIGN OF RAIN WATER
HARVESTING (RWH) SYSTEMS
Two options for RWH are proposed and their
Layout and Designs are discussed
Roof Top RWH(RTRWH)
• Rain water harvesting from roof top
Flood Well RWH (FWRWH)
• Rain water infiltration through flood wells.
They are independent options
may be used individually or in combination depending
on the hydrological needs for Flood Peak Reduction

Design storm for maximum total volume
Volume = f (Duration)
0
20,000
40,000
60,000
80,000
100,000
120,000
140,000
160,000
0 2 4 6 8 10 12
Duration of rainfall (h)
Vo
lum
e o
f ru
no
ff (
m3)
1000
iDAV
Volume of runoff
(m3)of a rain of
duration D hr is
given by
Parameters Values
Duration of rainfall producing
Maximum Total Volume (h) 5
Intensity corresponding
maximum Runoff Volume
(mm/h)
17.26
Runoff Coefficient of the
Watershed (C) 0.212
Discharge Q (m3/s) 1.775
Peak Runoff Volume V (m3) 1,50,670

Design Summary of Roof Top Rain Water
Harvesting Systems
Sl.
No.
PARAMETERS FORMULAE
Or
NOTATION
Values
1 Intensity (mm/h) i 17.26
2 Duration (h) D 5
3 Runoff Vol Collected from Roof Top Area A (m3) V = iAD/1000 18,385
4 Runoff Volume Collected per unit area of Roof
(m3/m
2)
1000/iDV 0.086≈
0.10
5 Area of tank required for a 1m depth tank 10% of
the roof
area

Layout of RTRWH Systems
RTRWH Scheme 1
Advantages Disadvantages
Reduction of peak flow
Free use of water
Reduction in pumping costs
Recharge of ground water table
Initial cost is more
Table 5.1a Advantages and Disadvantages of RWH Scheme 1

Layout of RTRWH Systems RTRWH Scheme 2
Advantages Disadvantages
Reduction of peak flow
Recharge of the ground water table
Partial reduction in pumping costs
Pumping provision must be
present.
Table 5.1 b Advantages and Disadvantages of RWH Scheme 2

Layout of RTRWH Systems RTRWH Scheme 3
Advantages Disadvantages
Reduction of peak flow
Recharge of the ground water table
Free use of water without pumping
No inside supply
Table 5.1 c Advantages and Disadvantages of RWH Scheme 3

Scheme 4
Advantages Disadvantages
Reduction of peak flow
No possibility to use rain water Recharge of ground water table

Layout of Flood Well RWH System
10 Flood Wells per ha Scheme

Layout of Flood Well RWH System (Contd.)
20 Flood Wells per ha Scheme with X-Sectional Details

Estimation of Field Infiltration Rate
• Field Infiltration rate is estimated by
conducting a infiltration test in a dug bore
hole in a foot hill and noting the lowering
depth of water with time
• Average Surface velocity of water over
the infiltration area may be expressed as
• This velocity is plotted as a function of
Head at the bottom of the hole and
logarithmic best fit equation is devised to
obtain infiltration rate in Flood Wells
h1
h2
d
H
h
24
24
1
21h
hHt
hd
hhHt
hdv

Estimation of Field Infiltration Rate (Contd.)
• The equation of the trend line is obtained as
• The trend line shape appears to be logical from the physical point of view
– Therefore used to calculate infiltration rate under an average head of 5 m at the bottom of Flood Well
– The value obtained is 0.12 m/s
• Keeping in view the size difference between flood well and the test well Infiltration rate of 0.15 m/s is taken as a realistic value for Flood Wells
0.00000001
0.0000001
0.000001
0.00001
0.0001
0.001
0.01
0.1
1
0 0.2 0.4 0.6 0.8 1 1.2
Head at bottom of hole(m)
Av
era
ge
Su
rfa
ce
Ve
loc
ity
(m
/s)
ExperimentalData
LogarithmicTrend Line
2)ln(105
hv

Summarised Details of Flood Wells
Serial No.
Depth of
Flood
Wells (m)
Volume
(m3)
Total
Infiltration
area (m2)
Surface
Velocity of
Infiltration
(m/h)
1 10 1.71 13.42
2 6 1.42 9.65
0.15(a)
(a)
The infiltration rate is estimated on the basis of field test
No of Well
per hectare
Total No of
Wells in
Watershed
Total
volume of
wells
(m3)
Total
infiltration
area
(m2)
Volume of
water
infiltrated
(5 h rain)
(m3)
%
Reduction
of the peak
flood
volume
10 1400 2198 16150 11871 9.3
20 2880 4396 32312 23749 18.7
Summary of Flood Well Schemes
Design Parameters of Flood Wells

ANALYSIS OF MODIFIED PEAK DISCHARGE
AND FLOOD LEVEL IN DRAINS
• Following methodology is used
– Determination of Retained Rainfall Volume in 10 Flood Wells/ha System • Total retention volume of contour trench and flood well = 8494 m3
• Calculation of Modified Time of Concentration
– Time needed to store 8494m3 volume of rain at an intensity of 42.17mm/h • = 8494/ 59038.50 = 0.144 h = 8.63 min.
– Increased time of concentration = (54 + 8.63) = 62.63 min
• Calculation of Modified Discharge
– Modified discharge corresponding to this time of concentration = CiA/(36x105) = 0.212 x 40.9 x 279.144/ (360x105) = 6.723 m3/s
• Calculation of Infiltration Loss
– Total Infiltration from 1400 wells = 2421.3 m3/h = 0.67 m3/s

ANALYSIS OF MODIFIED PEAK DISCHARGE
AND FLOOD LEVEL IN DRAINS (Contd.)
• Net modified discharge considering infiltration • = (6.723 – 0.67)m3/s = 6.053 m3/s
• Percentage reduction of discharge due to implementation of FWRWH system
• = (1-6.053/6.932) 100% = 12.68%
• Calculation of Modified Discharge due Roof top RWH System – Reduction in peak discharge due to RTRWH system is 12.2%.
– Combined Reduction in peak discharge due to RTRWH & FWRWH = 12.68 %+12.20 % = 24.88 %
• Analysis of Modified Flood Level in Drains – Based on Modified Peak Discharge, Geometry of Drains and
Manning’s Equation
– Barr and Das Formulae (1986) are used

Table 5.4 Summary of RWH Analysis
After solution
Parameters
Before
Solution Only
RTRWH
RTRWH +10
FW/ha
RTRWH +20
FW/ha
Rainfall Duration (h) 0.9 0.9 1.04 1.07
Intensity (mm/h) 42.17 42.17 40.9 40.64
Runoff Coefficient C 0.212 0.212 0.212 0.212
Manning’s Coeff. (n) 0.015 0.015 0.015 0.015
Discharge Q (m3/s)
6.93 6.08 5.21 4.49
Width of drain (m) 3 3 3 3
Drain-Bed slope (%) 0.05 0.05 0.05 0.05
(Continued in the next Slide)

Summary of RWH Analysis (Contd.)
After solution
Parameters
Before
Solution Only
RTRWH
RTRWH +10
FW/ha
RTRWH +20
FW/ha
Water level in drains
(m)
1.78 1.62 1.44 1.29
Sediment in
drain (m)
0.5 0.5 0.18 0.18
Depth of outlet drain (m) 1.5 1.5 1.5 1.5
Flood with sediment
control(m)
0.78 0.62 0.11 0.00
% Reduction in
Maximum Runoff
Volume
- 12.2 21.54 30.87
% Peak Discharge
Reduction
- 12.20 12.70 22.9
% Flood Reduction in
Drains (without
Sediment Control)
- 20.5 43.6 62.8
% Flood Reduction in
drains (With Sediment
Control, Studyed by
Bracht and Sarma)
- 20.5 85 100

SUMMARY & CONCLUSIONS
• Hydrological study has shown that the proposed schemes will reduce the flood problem significantly in the Pilot watershed.
• Socio-economic study has shown positive sign towards acceptability of such scheme by the community.
• While house owner will have to implement the Roof RWH scheme, Government will have to implement the Flood well harvesting scheme.
• Sediment control scheme must be implemented in parallel
• Possible adverse affects such as landslide etc. need to be analyzed.

THANK
YOU