Embed Size (px)
Citation preview
49
CHAPTER 2
RAINFALL RUN-OFF AND BASEFLOW ESTIMATION
2.1 Introduction
The west coast of India receives abundant rainfall from the southwest
monsoon. The Western Ghats escarpment (Sahyadri mountain range)
that runs parallel to the west coast plays an important role in its
distribution. The monsoon causes heavy rainfall on the windward side of
the escarpment, distinguishing it from the much drier leeward side
(Suprit and Shankar, 2008). This results in high discharge from the
small rivers originating on the Ghats and draining into the Arabian Sea
in the west. The Mhadei River is a tributary of the Mandovi River that
originates in the Western Ghats and drains into the Arabian Sea. It has
been grouped under Bhatsol Basin (Sub-basin: Vasishti and Others) by
CGWB on the Watershed Atlas of India.
2.2 Rainfall Analysis
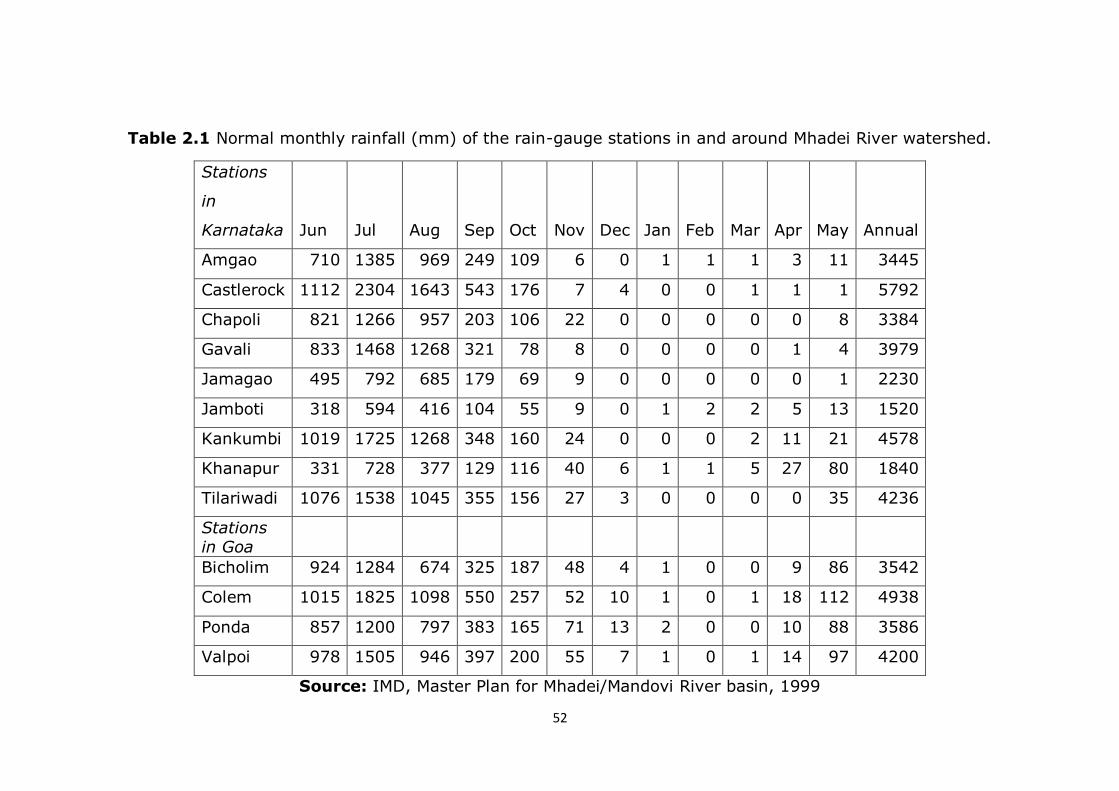
The Mhadei River watershed receives abundant rainfall due to the
southwest monsoon during the months of June to September. Thirteen
rain-gauge stations in and around the watershed have been identified
and normal monthly rainfall data has been collected (Table 2.1). Over
90% rainfall occurs during the monsoon months from June to
September while the remaining 10% rainfall is received during the non-
50
monsoon months. Highest rainfall is received during the month of July
followed by a gradual decrease in subsequent monsoon months. There
is also a considerable variation in rainfall increasing from the coast
towards the Western Ghats. Rainfall during the monsoon consists of
several bursts with weak spells and sometimes monsoon breaks in
between (Rao, 1976). In the present study both Isohyetal and Thiessen
polygon methods have been used to compute the average normal
rainfall for the Mhadei River watershed.
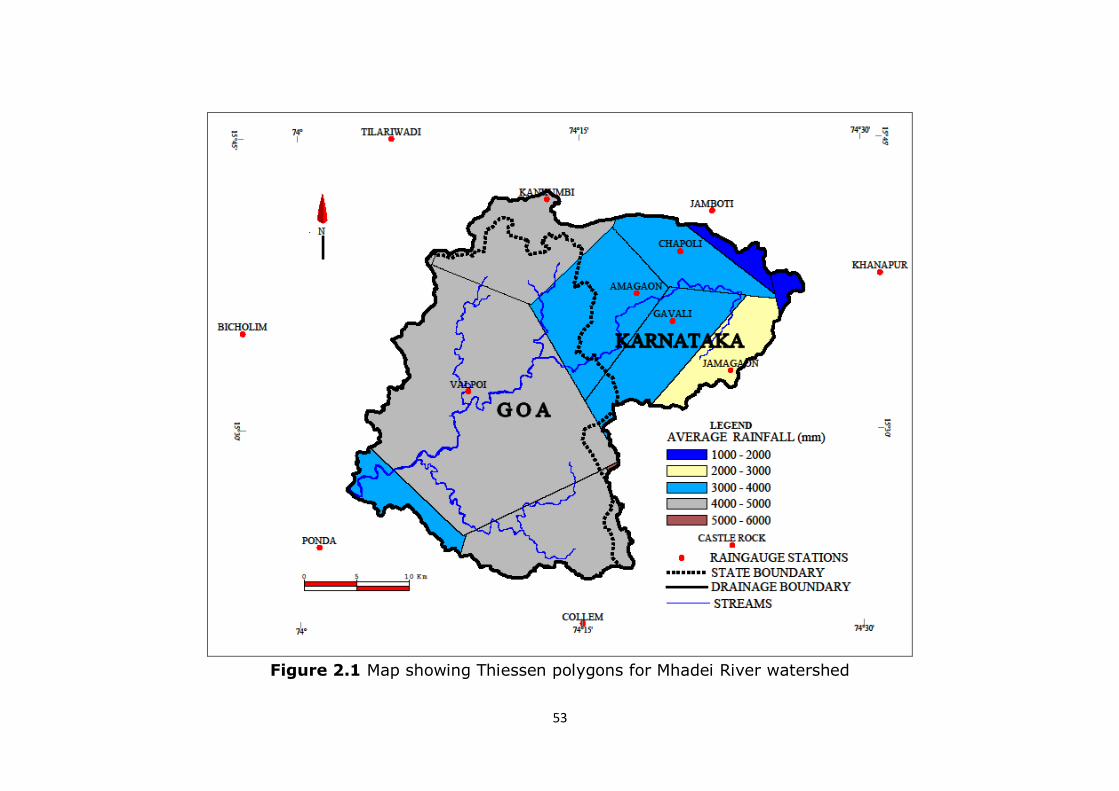
2.2.1 Thiessen Polygon Method
In this method, the watershed is divided into polygons with the rain
gauge station in the middle of each polygon assumed to be
representative for the rainfall on the area of land included in its
polygon. Thiessen polygons are obtained by drawing perpendicular
bisectors to the lines joining adjacent rain gauge stations on a base
map. Each polygon area is assumed to be influenced by the rain-gauge
station inside it (Fig 2.1). An area factor is computed for each station as
a ratio of the land area influenced by that station to the area of the
entire watershed. Large area factor implies that the rainfall of that
station is manipulated over a larger area and therefore less accurate.
The average annual rainfall computed using Thiessen polygon method
for the Mhadei River watershed is 3955mm (Table 2.2). The Valpoi rain-
51
gauge station has the maximum influence (39%) on the Mhadei River
watershed followed by Amgao, Collem and Kankumbi station.
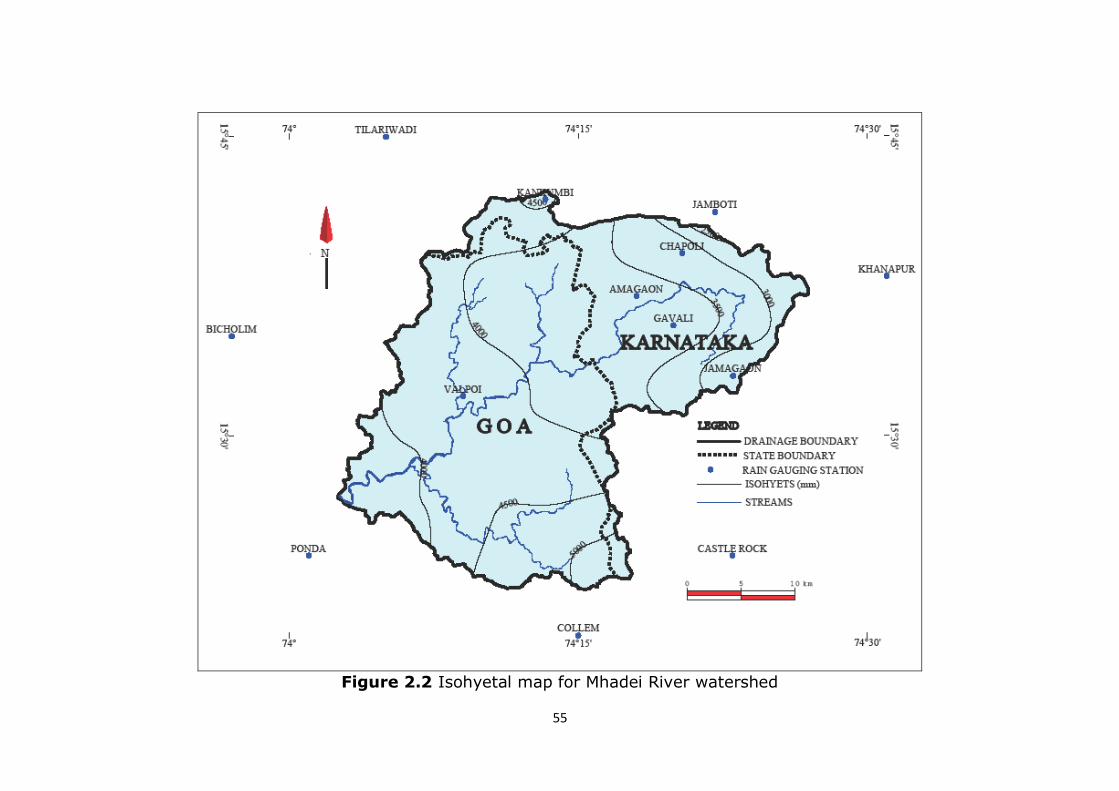
2.2.2 Isohyetal Method
In Isohyetal method, the point rainfalls are plotted on a suitable base
map and the lines of equal rainfall (isohyets) are then drawn as
contours giving consideration to orographic effects and storm
morphology (Fig. 2.2).
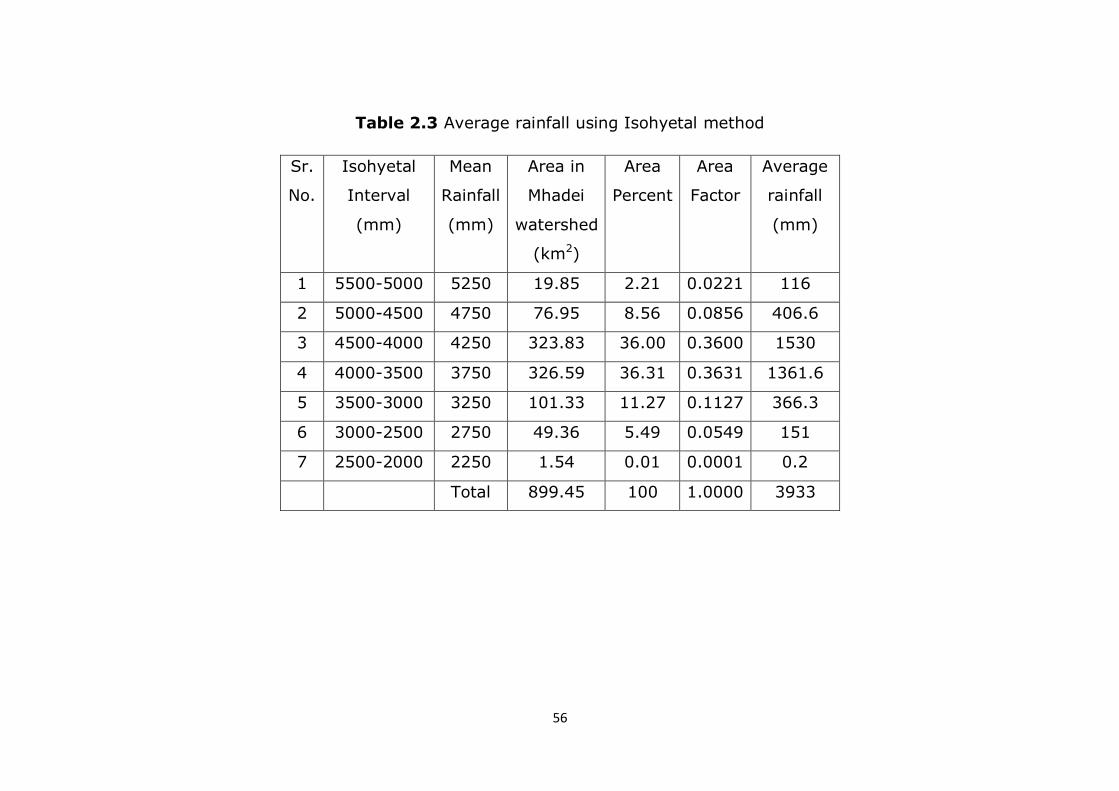
The average annual rainfall using Isohyetal Method for the Mhadei River
watershed is 3933mm (Table 2.3). There is not much difference
between the Thiessen polygon and the Isohyetal averages. However,
Isohyetal method gives consideration to orographic effects and storm
morphology (Raghunath, 1992), and the Mhadei River watershed is a
mountainous watershed, therefore Isohyetal method has been adopted
for further computations. As a result of the orographic influence the
rainfall increases progressively from the western boundary of the
watershed towards the Western Ghats located in east from about
3500mm to over 5000mm (Fig. 2.2). However, further east on the
Karnataka plateau it decreases rapidly to about 2500mm.
52
Table 2.1 Normal monthly rainfall (mm) of the rain-gauge stations in and around Mhadei River watershed.
Stations
in
Karnataka Jun Jul Aug Sep Oct Nov Dec Jan Feb Mar Apr May Annual
Amgao 710 1385 969 249 109 6 0 1 1 1 3 11 3445
Castlerock 1112 2304 1643 543 176 7 4 0 0 1 1 1 5792
Chapoli 821 1266 957 203 106 22 0 0 0 0 0 8 3384
Gavali 833 1468 1268 321 78 8 0 0 0 0 1 4 3979
Jamagao 495 792 685 179 69 9 0 0 0 0 0 1 2230
Jamboti 318 594 416 104 55 9 0 1 2 2 5 13 1520
Kankumbi 1019 1725 1268 348 160 24 0 0 0 2 11 21 4578
Khanapur 331 728 377 129 116 40 6 1 1 5 27 80 1840
Tilariwadi 1076 1538 1045 355 156 27 3 0 0 0 0 35 4236
Stations in Goa
Bicholim 924 1284 674 325 187 48 4 1 0 0 9 86 3542
Colem 1015 1825 1098 550 257 52 10 1 0 1 18 112 4938
Ponda 857 1200 797 383 165 71 13 2 0 0 10 88 3586
Valpoi 978 1505 946 397 200 55 7 1 0 1 14 97 4200
Source: IMD, Master Plan for Mhadei/Mandovi River basin, 1999
53
Figure 2.1 Map showing Thiessen polygons for Mhadei River watershed
54
Table 2.2 Average rainfall using Theissen polygon method
Rain-gauge
station
Area of polygon
(km2)
Area Factor
Normal annual rainfall
(mm)
Rainfall in Mhadei
(mm)
Jamagaon 51.04 0.057 2230 127
Colem 100.05 0.110 4938 543
Ponda 33.40 0.037 3586 133
Valpoi 351.90 0.390 4200 1638
Amgao 107.23 0.119 3445 411
Castlerock 0.94 0.001 5792 6
Chapoli 58.60 0.065 3384 220
Gavali 81.63 0.091 3979 361
Jamboti 13.68 0.015 1520 23
Kankumbi 92.93 0.103 4578 473
Khanapur 6.98 0.008 1840 14
Tilariwadi 1.08 0.001 4236 4
Bicholim 0.00 0.000 3530 0
Total 899.46 0.998 3955
55
Figure 2.2 Isohyetal map for Mhadei River watershed
56
Table 2.3 Average rainfall using Isohyetal method
Sr.
No.
Isohyetal
Interval
(mm)
Mean
Rainfall
(mm)
Area in
Mhadei
watershed
(km2)
Area
Percent
Area
Factor
Average
rainfall
(mm)
1 5500-5000 5250 19.85 2.21 0.0221 116
2 5000-4500 4750 76.95 8.56 0.0856 406.6
3 4500-4000 4250 323.83 36.00 0.3600 1530
4 4000-3500 3750 326.59 36.31 0.3631 1361.6
5 3500-3000 3250 101.33 11.27 0.1127 366.3
6 3000-2500 2750 49.36 5.49 0.0549 151
7 2500-2000 2250 1.54 0.01 0.0001 0.2
Total 899.45 100 1.0000 3933
57
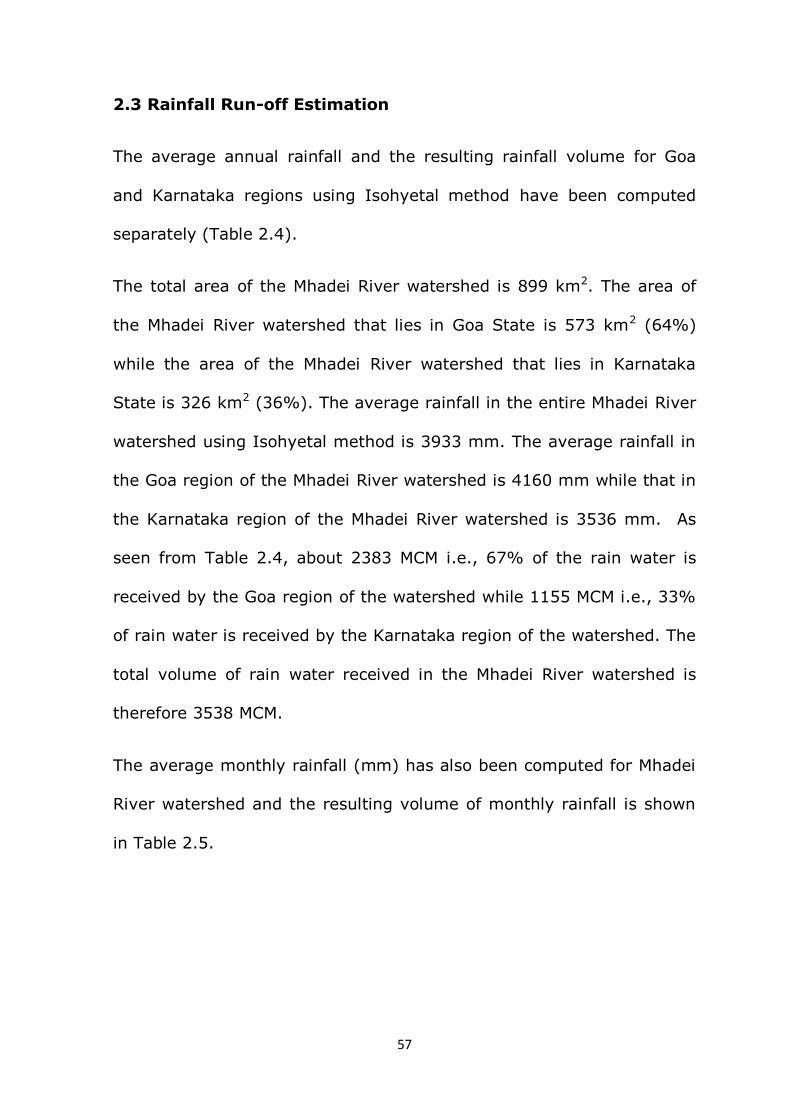
2.3 Rainfall Run-off Estimation
The average annual rainfall and the resulting rainfall volume for Goa
and Karnataka regions using Isohyetal method have been computed
separately (Table 2.4).
The total area of the Mhadei River watershed is 899 km2. The area of
the Mhadei River watershed that lies in Goa State is 573 km2 (64%)
while the area of the Mhadei River watershed that lies in Karnataka
State is 326 km2 (36%). The average rainfall in the entire Mhadei River
watershed using Isohyetal method is 3933 mm. The average rainfall in
the Goa region of the Mhadei River watershed is 4160 mm while that in
the Karnataka region of the Mhadei River watershed is 3536 mm. As
seen from Table 2.4, about 2383 MCM i.e., 67% of the rain water is
received by the Goa region of the watershed while 1155 MCM i.e., 33%
of rain water is received by the Karnataka region of the watershed. The
total volume of rain water received in the Mhadei River watershed is
therefore 3538 MCM.
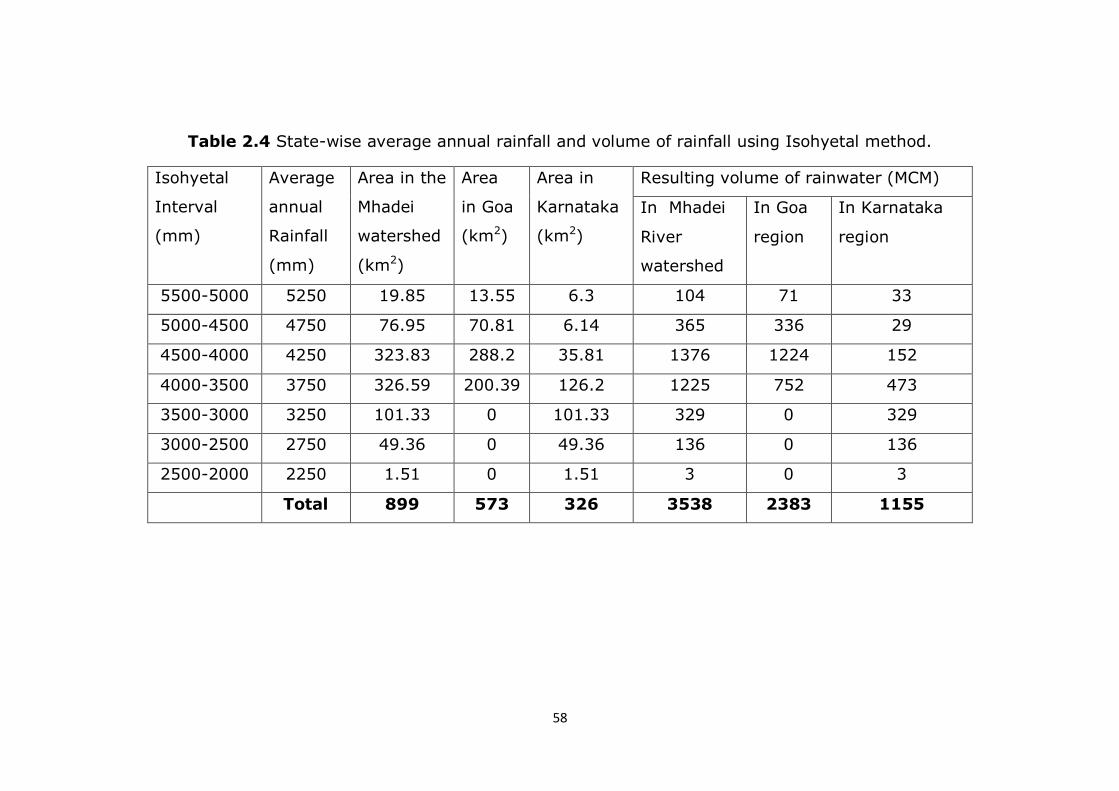
The average monthly rainfall (mm) has also been computed for Mhadei
River watershed and the resulting volume of monthly rainfall is shown
in Table 2.5.
58
Table 2.4 State-wise average annual rainfall and volume of rainfall using Isohyetal method.
Isohyetal
Interval
(mm)
Average
annual
Rainfall
(mm)
Area in the
Mhadei
watershed
(km2)
Area
in Goa
(km2)
Area in
Karnataka
(km2)
Resulting volume of rainwater (MCM)
In Mhadei
River
watershed
In Goa
region
In Karnataka
region
5500-5000 5250 19.85 13.55 6.3 104 71 33
5000-4500 4750 76.95 70.81 6.14 365 336 29
4500-4000 4250 323.83 288.2 35.81 1376 1224 152
4000-3500 3750 326.59 200.39 126.2 1225 752 473
3500-3000 3250 101.33 0 101.33 329 0 329
3000-2500 2750 49.36 0 49.36 136 0 136
2500-2000 2250 1.51 0 1.51 3 0 3
Total 899 573 326 3538 2383 1155
59
Table 2.5 Average monthly rainfall and resulting volume of rainfall in
Mhadei River watershed
Period Month Average rainfall
(mm)
Volume of rainfall
(MCM)
Monsoon June 871 783
July 1450 1304
August 991 891
September 351 316
Non-
monsoon
October 161 145
November 35 32
December 4 4
January 1 1
February 0 0
March 1 1
April 10 9
May 58 52
Total
annual
3933 3538
Thus, the total volume of monsoon rainfall received in the Mhadei River
watershed is 3294 MCM while the total volume of non-monsoon rainfall
is 244 MCM.
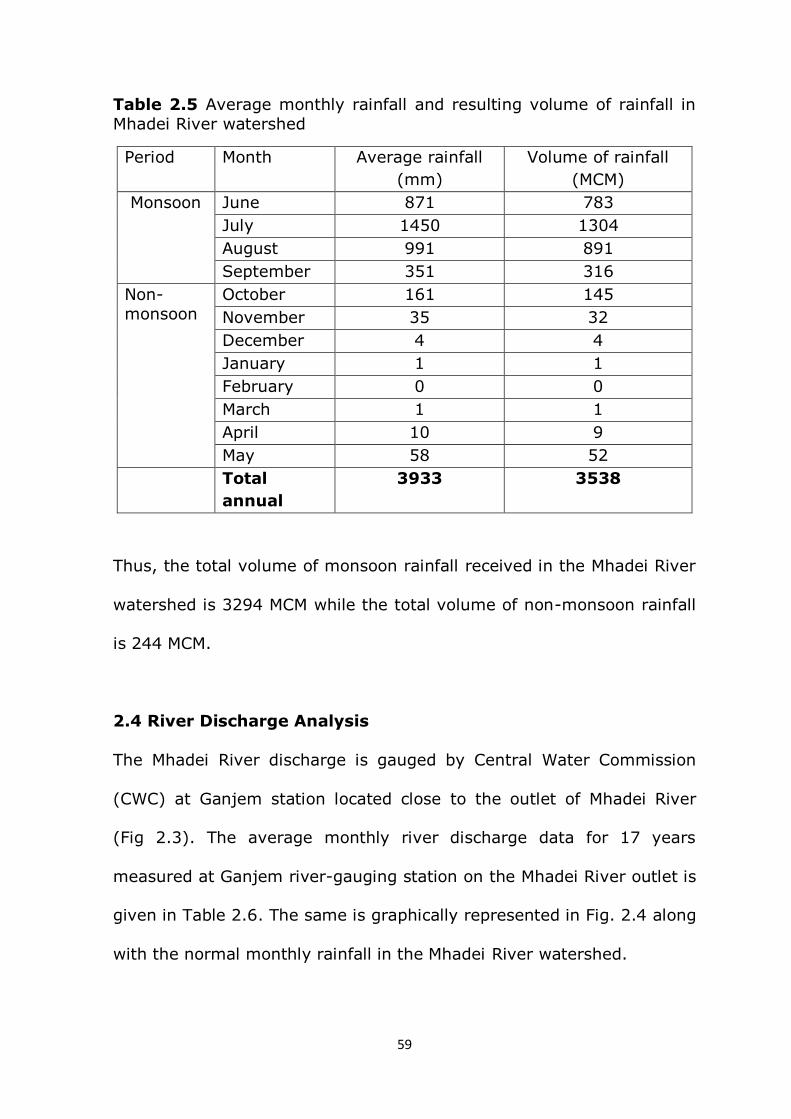
2.4 River Discharge Analysis
The Mhadei River discharge is gauged by Central Water Commission
(CWC) at Ganjem station located close to the outlet of Mhadei River
(Fig 2.3). The average monthly river discharge data for 17 years
measured at Ganjem river-gauging station on the Mhadei River outlet is
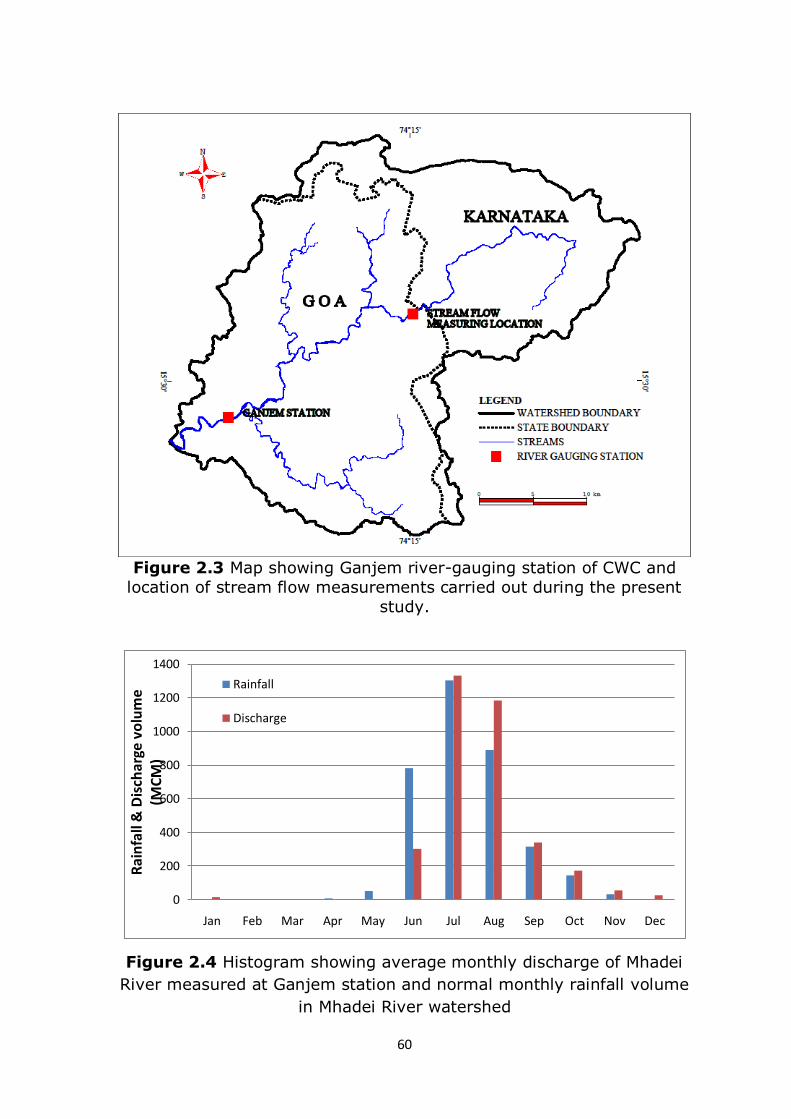
given in Table 2.6. The same is graphically represented in Fig. 2.4 along
with the normal monthly rainfall in the Mhadei River watershed.
60
Figure 2.3 Map showing Ganjem river-gauging station of CWC and
location of stream flow measurements carried out during the present
study.
Figure 2.4 Histogram showing average monthly discharge of Mhadei
River measured at Ganjem station and normal monthly rainfall volume
in Mhadei River watershed
0
200
400
600
800
1000
1200
1400
Jan Feb Mar Apr May Jun Jul Aug Sep Oct Nov Dec
Rai
nfa
ll &
Dis
char
ge v
olu
me
(MC
M)
Rainfall
Discharge
61
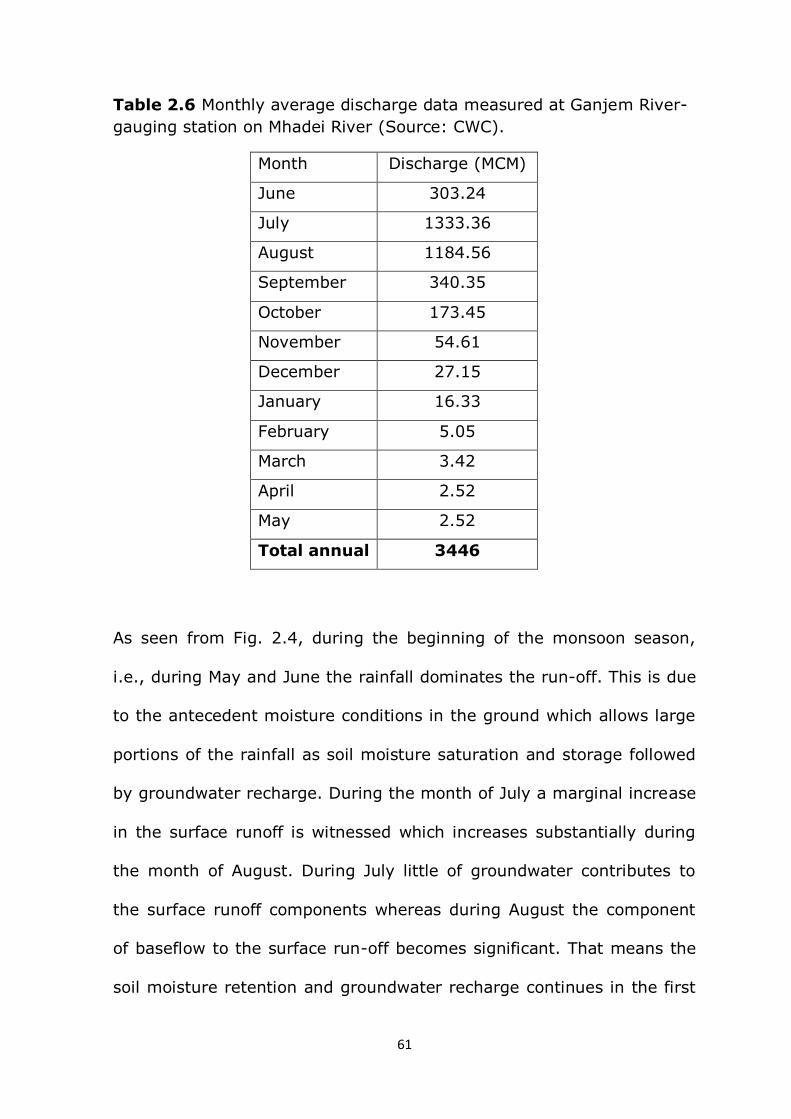
Table 2.6 Monthly average discharge data measured at Ganjem River-
gauging station on Mhadei River (Source: CWC).
Month Discharge (MCM)
June 303.24
July 1333.36
August 1184.56
September 340.35
October 173.45
November 54.61
December 27.15
January 16.33
February 5.05
March 3.42
April 2.52
May 2.52
Total annual 3446
As seen from Fig. 2.4, during the beginning of the monsoon season,
i.e., during May and June the rainfall dominates the run-off. This is due
to the antecedent moisture conditions in the ground which allows large
portions of the rainfall as soil moisture saturation and storage followed
by groundwater recharge. During the month of July a marginal increase
in the surface runoff is witnessed which increases substantially during
the month of August. During July little of groundwater contributes to
the surface runoff components whereas during August the component
of baseflow to the surface run-off becomes significant. That means the
soil moisture retention and groundwater recharge continues in the first
62
three months of the rainy season. The baseflow contribution sustains till
January as seen from the figure indicating higher groundwater levels
during these months. The average annual discharge of Mhadei River
watershed at Ganjem river-gauging station is 3446 MCM which is 97%
of the total volume of annual rainwater (3538 MCM) received by the
watershed. Thus, only 3% of the total annual rainfall is attributed to
groundwater recharge.
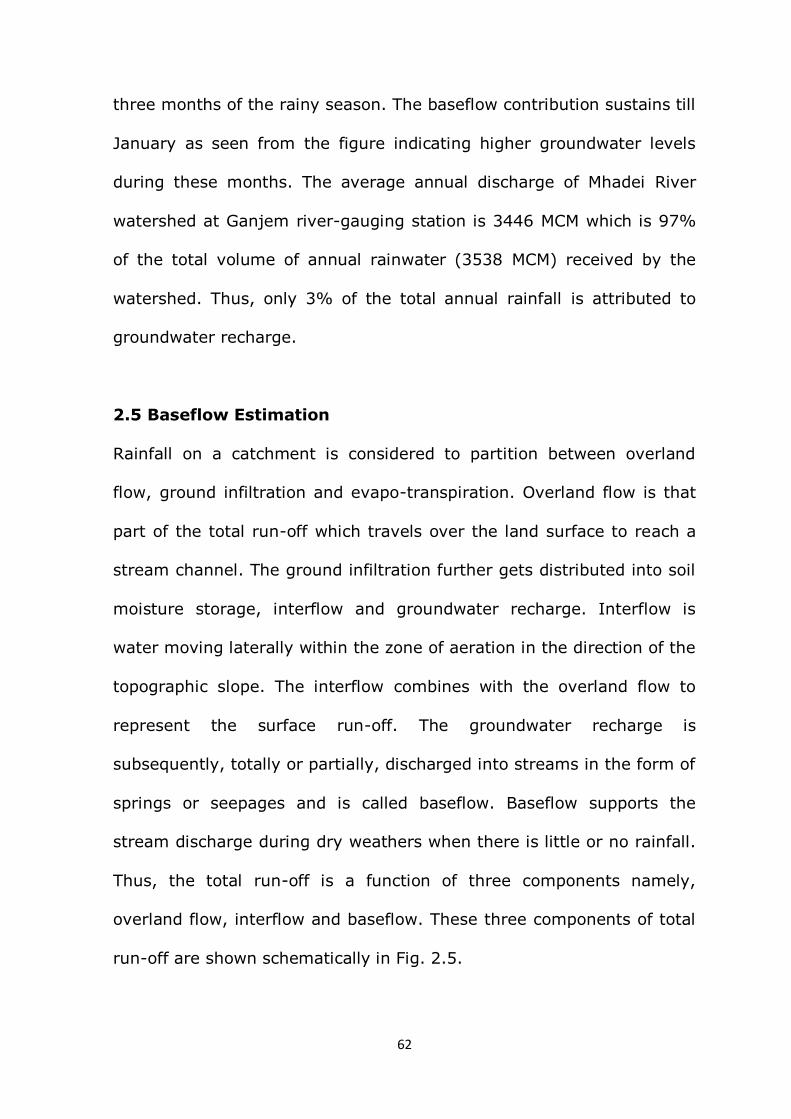
2.5 Baseflow Estimation
Rainfall on a catchment is considered to partition between overland
flow, ground infiltration and evapo-transpiration. Overland flow is that
part of the total run-off which travels over the land surface to reach a
stream channel. The ground infiltration further gets distributed into soil
moisture storage, interflow and groundwater recharge. Interflow is
water moving laterally within the zone of aeration in the direction of the
topographic slope. The interflow combines with the overland flow to
represent the surface run-off. The groundwater recharge is
subsequently, totally or partially, discharged into streams in the form of
springs or seepages and is called baseflow. Baseflow supports the
stream discharge during dry weathers when there is little or no rainfall.
Thus, the total run-off is a function of three components namely,
overland flow, interflow and baseflow. These three components of total
run-off are shown schematically in Fig. 2.5.
63
Figure 2.5 A schematic section showing the various components those
contribute to the total discharge of a stream.
In order to quantify the baseflow volumes in Mhadei River watershed,
stream-flow measurements were carried out on a single stream at Goa-
Karnataka State border (Fig. 2.3) for the months of December and
April. As it is not feasible to physically measure the baseflow volume
from all the streams coming from Karnataka due to inaccessibility, it is
proposed to derive unit area baseflow using the field measured
values. Using this unit area baseflow, the total non-monsoon baseflow
coming from all the streams from Karnataka is computed on monthly
basis. Further, the stream hydrograph analysis has been used to
quantify the annual baseflow contribution in Mhadei River watershed.
2.5.1 Stream Gauging Measurements
Stream-flow measurements were carried out on Mhadei River at the
Goa- Karnataka State boundary near village Uste in the months of
64
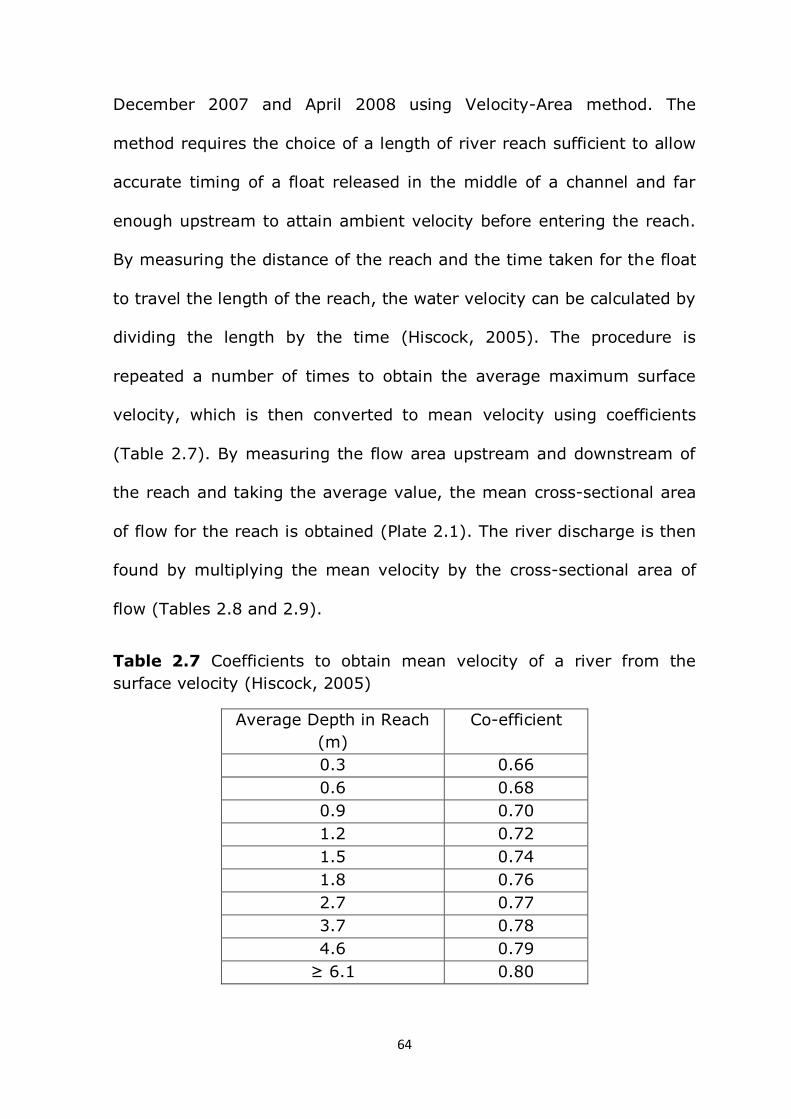
December 2007 and April 2008 using Velocity-Area method. The
method requires the choice of a length of river reach sufficient to allow
accurate timing of a float released in the middle of a channel and far
enough upstream to attain ambient velocity before entering the reach.
By measuring the distance of the reach and the time taken for the float
to travel the length of the reach, the water velocity can be calculated by
dividing the length by the time (Hiscock, 2005). The procedure is
repeated a number of times to obtain the average maximum surface
velocity, which is then converted to mean velocity using coefficients
(Table 2.7). By measuring the flow area upstream and downstream of
the reach and taking the average value, the mean cross-sectional area
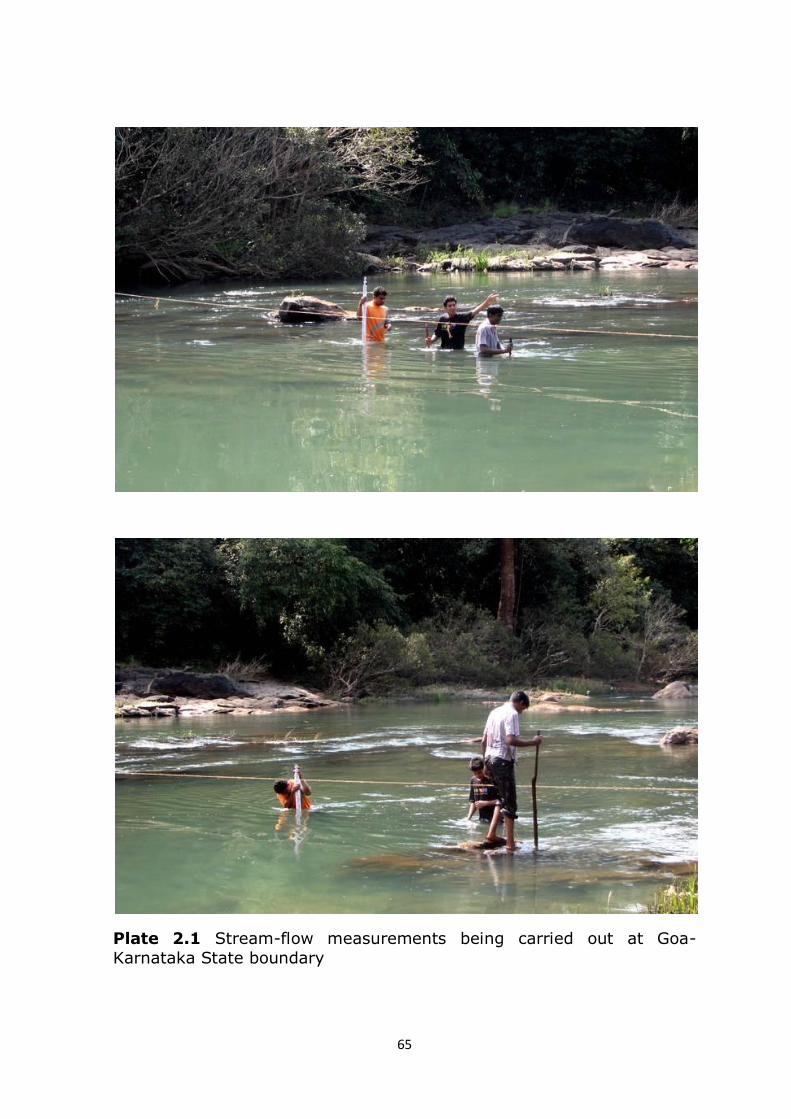
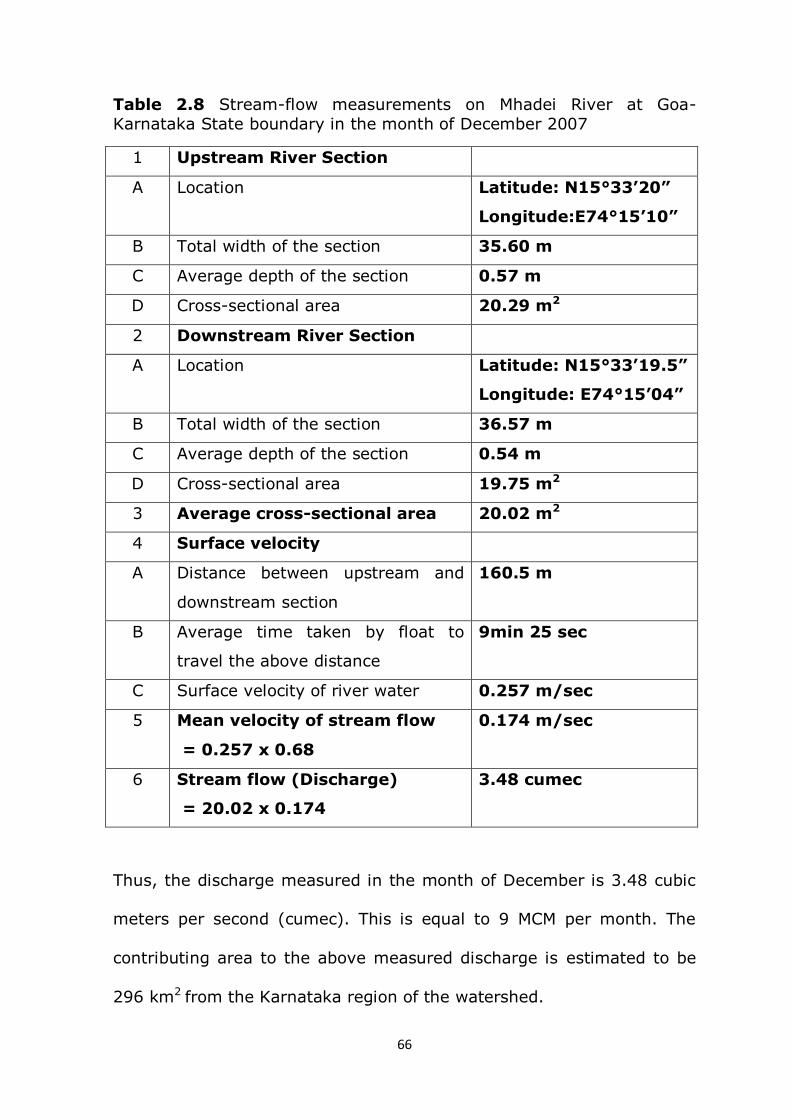
of flow for the reach is obtained (Plate 2.1). The river discharge is then
found by multiplying the mean velocity by the cross-sectional area of
flow (Tables 2.8 and 2.9).
Table 2.7 Coefficients to obtain mean velocity of a river from the
surface velocity (Hiscock, 2005)
Average Depth in Reach
(m)
Co-efficient
0.3 0.66
0.6 0.68
0.9 0.70
1.2 0.72
1.5 0.74
1.8 0.76
2.7 0.77
3.7 0.78
4.6 0.79
≥ 6.1 0.80
65
Plate 2.1 Stream-flow measurements being carried out at Goa-
Karnataka State boundary
66
Table 2.8 Stream-flow measurements on Mhadei River at Goa-
Karnataka State boundary in the month of December 2007
1 Upstream River Section
A Location Latitude: N15°33’20”
Longitude:E74°15’10”
B Total width of the section 35.60 m
C Average depth of the section 0.57 m
D Cross-sectional area 20.29 m2
2 Downstream River Section
A Location Latitude: N15°33’19.5”
Longitude: E74°15’04”
B Total width of the section 36.57 m
C Average depth of the section 0.54 m
D Cross-sectional area 19.75 m2
3 Average cross-sectional area 20.02 m2
4 Surface velocity
A Distance between upstream and
downstream section
160.5 m
B Average time taken by float to
travel the above distance
9min 25 sec
C Surface velocity of river water 0.257 m/sec
5 Mean velocity of stream flow
= 0.257 x 0.68
0.174 m/sec
6 Stream flow (Discharge)
= 20.02 x 0.174
3.48 cumec
Thus, the discharge measured in the month of December is 3.48 cubic
meters per second (cumec). This is equal to 9 MCM per month. The
contributing area to the above measured discharge is estimated to be
296 km2 from the Karnataka region of the watershed.
67
It is noted that the average discharge measured at Ganjem river-
gauging station for the month of December is 27.15 MCM/month. The
area contributing to the above measured discharge at Ganjem station is
880 km2 which is 98% of the entire Mhadei River watershed.
Table 2.9 Stream flow measurements on Mhadei River at Goa-
Karnataka State boundary in the month of April 2008
1 Upstream River Section
A Location Latitude: N15°33’20”
Longitude:E74°15’9.4”
B Total width of the section 13.7 m
C Average depth of the section 0.342 m
D Cross-sectional area 4.6854 m2
2 Downstream River Section
A Location Latitude: N15°33’19.7”
Longitude: E74°15’8.8”
B Total width of the section 22.19 m
C Average depth of the section 0.4412 m
D Cross-sectional area 9.791 m2
3 Average cross-sectional area 7.2382 m2
4 Surface velocity
A Distance between upstream and
downstream section
126 m
B Average time taken by float to
travel the above distance
36 min
C Surface velocity of river water 0.0583 m/sec
5 Mean velocity of stream flow
= 0.0583 x 0.68
0.04 m/sec
6 Stream flow (Discharge)
= 7.2382 x 0.04
0.289 cumec
68
Thus, the discharge measured in the month of April 2008 is 0.289
cumec. This is equal to 0.75 MCM per month. The contributing area to
the above measured discharge is 296 km2 from the Karnataka region of
the watershed.
It is noted that the corresponding average discharge measured at
Ganjem river-gauging station for the month of April is 2.52
MCM/month. The area contributing to the above measured discharge at
Ganjem station is 880 km2 which is 98% of the entire Mhadei River
watershed.
2.5.2 Quantification of Baseflow
Baseflow for December: The discharge measured for the month of
December from the Karnataka region of the watershed is 9 MCM per
month and the area contributing to this discharge is 296 km2. Thus, the
unit area baseflow from the Karnataka region of the watershed for the
month of December can be calculated as:
Discharge/Area= 9 MCM /296 km2 = 0.0304 MCM/km2
Since the total area of the Mhadei River watershed that lies in the
Karnataka state is 326 km2 therefore, the total baseflow from the
Karnataka region for the month of December 2007 can be calculated
as:
Unit area base flow X total area = 0.0304 X 326 = 9.9 MCM
69
Similarly, the average discharge measured at Ganjem river-gauging
station for the month of December is 27.15 MCM. The area contributing
to the above measured discharge at Ganjem station is 880 km2. Thus,
the unit area baseflow for the entire Mhadei River watershed for the
month of December can be calculated as:
Discharge/Area= 27.15 MCM / 880 km2 = 0.0308 MCM/km2
Thus, the value of the unit area baseflow computed for the entire
Mhadei River watershed for the month of December is in close
agreement with the value of the unit area baseflow computed for the
Karnataka region by stream flow measurements during the present
study.
Thus, the baseflow measured for the month of December from the
Karnataka region of the watershed (9.9 MCM) is 37% of the base flow
measured for the entire Mhadei River watershed (27.15 MCM) in the
month of December.
Baseflow for April: The discharge measured for the month of April
from the Karnataka region of the watershed is 0.75 MCM and the area
contributing to this discharge is 296 km2. Thus, the unit area baseflow
from the Karnataka region of the watershed for the month of April can
be calculated as:
Discharge/Area= 0.75 MCM / 296 km2 = 0.0025 MCM/km2
70
Since the total area of the Mhadei River watershed that lies in the
Karnataka State is 326 km2 therefore, the total baseflow from the
Karnataka region for the month of December can be calculated as:
Unit area base flow X total area = 0.0025 X 326 = 0.826 MCM
Similarly, the average discharge measured at Ganjem river-gauging
station for the corresponding month of April is 2.52 MCM. The area
contributing to the above measured discharge at Ganjem station is 880
km2. Thus, the unit area baseflow for the entire Mhadei River watershed
for the month of April can be calculated as:
Discharge/Area= 2.52 MCM / 880 km2 = 0.0028 MCM/km2
Thus, the value of the unit area baseflow computed for the entire
watershed for the month of April is in close agreement with the value of
the unit area baseflow computed for the Karnataka region by stream
flow measurements during the present study.
The baseflow measured for the month of April from the Karnataka
region of the watershed (0.826 MCM) is found to be 33% of the
baseflow measured for the entire Mhadei River watershed (2.52 MCM).
Baseflow computation for non-monsoon period: The baseflow
contribution for the other non-monsoon months from Karnataka region
has been computed by linearly extrapolating the values of December
and April months to the remaining months of non-monsoon period from
October to May (Table 2.10). Further, using the monthly baseflow
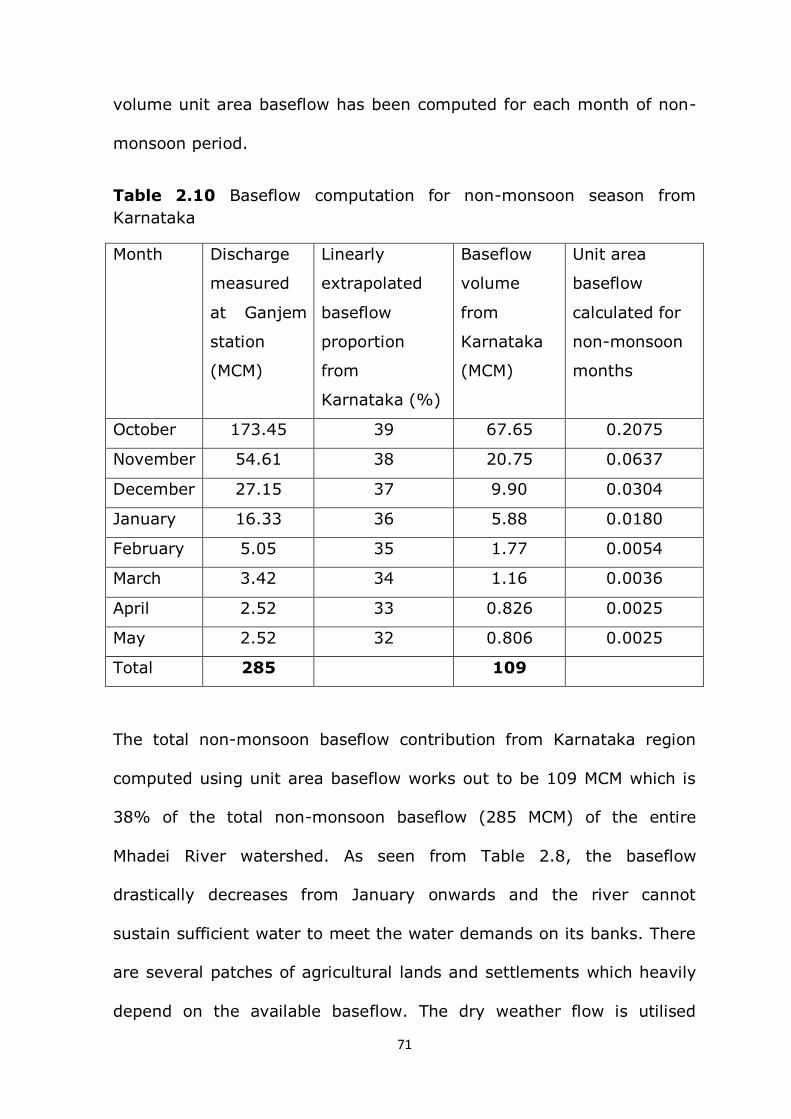
71
volume unit area baseflow has been computed for each month of non-
monsoon period.
Table 2.10 Baseflow computation for non-monsoon season from
Karnataka
Month Discharge
measured
at Ganjem
station
(MCM)
Linearly
extrapolated
baseflow
proportion
from
Karnataka (%)
Baseflow
volume
from
Karnataka
(MCM)
Unit area
baseflow
calculated for
non-monsoon
months
October 173.45 39 67.65 0.2075
November 54.61 38 20.75 0.0637
December 27.15 37 9.90 0.0304
January 16.33 36 5.88 0.0180
February 5.05 35 1.77 0.0054
March 3.42 34 1.16 0.0036
April 2.52 33 0.826 0.0025
May 2.52 32 0.806 0.0025
Total 285 109
The total non-monsoon baseflow contribution from Karnataka region
computed using unit area baseflow works out to be 109 MCM which is
38% of the total non-monsoon baseflow (285 MCM) of the entire
Mhadei River watershed. As seen from Table 2.8, the baseflow
drastically decreases from January onwards and the river cannot
sustain sufficient water to meet the water demands on its banks. There
are several patches of agricultural lands and settlements which heavily
depend on the available baseflow. The dry weather flow is utilised
72
extensively in the downstream region of the watershed by storing the
water within river banks by constructing bandharas across the streams.
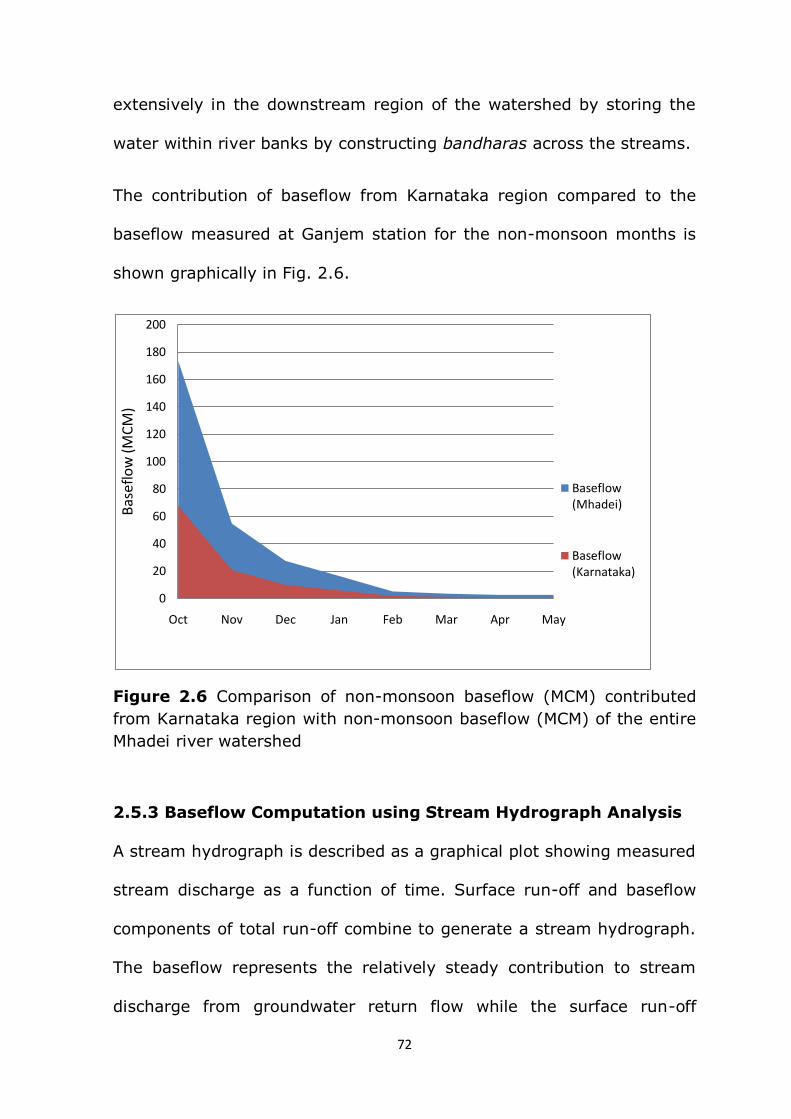
The contribution of baseflow from Karnataka region compared to the
baseflow measured at Ganjem station for the non-monsoon months is
shown graphically in Fig. 2.6.
Figure 2.6 Comparison of non-monsoon baseflow (MCM) contributed
from Karnataka region with non-monsoon baseflow (MCM) of the entire
Mhadei river watershed
2.5.3 Baseflow Computation using Stream Hydrograph Analysis
A stream hydrograph is described as a graphical plot showing measured
stream discharge as a function of time. Surface run-off and baseflow
components of total run-off combine to generate a stream hydrograph.
The baseflow represents the relatively steady contribution to stream
discharge from groundwater return flow while the surface run-off
0
20
40
60
80
100
120
140
160
180
200
Oct Nov Dec Jan Feb Mar Apr May
Bas
efl
ow
(MC
M)
Baseflow (Mhadei)
Baseflow (Karnataka)
73
represents the additional discharge contributed by rainfall event. A
stream hydrograph may be plotted as storm hydrograph, seasonal
hydrograph or long-term hydrograph. Storm hydrograph is plotted
when a relatively short interval of time spanning the approach and
passing of a storm is involved. Seasonal hydrograph is plotted when
longer time interval representing the full range of seasonal flow is
involved. A time span extending over a period of many years enables
plot of long-term hydrograph.
In the present study, stream hydrograph analysis of the seasonal
(monthly) discharge data of Ganjem river-gauging station has been
carried out. The baseflow can be separated either using Constant
discharge method, Concave method or Constant slope method. The
Constant discharge method assumes that baseflow is constant
throughout the rainfall period while the Concave method assumes that
the declining hydrograph trend prior to the onset of rainfall continues
till the occurrence of peak flow (Linsley et al, 1975). Since it is unlikely
that the baseflow will remain constant after the onset of rainfall in
Mhadei River watershed given the high infiltration occurring in the
months of May and June (as indicated in Fig. 2.4) and the highly
drainable nature of the aquifers in the watershed (as brought out later
in Chapter 4), the Constant slope method has been adopted for
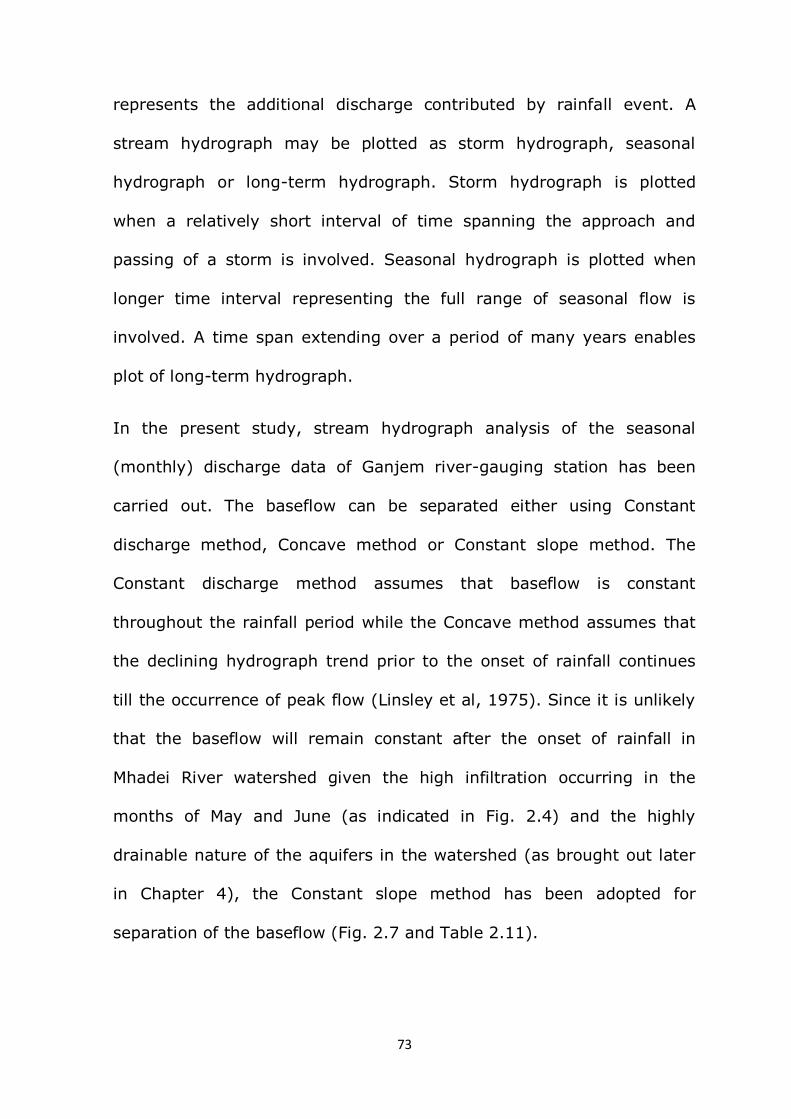
separation of the baseflow (Fig. 2.7 and Table 2.11).
74
Figure 2.7 Mhadei River hydrograph separation using Constant slope
method
As seen in Fig. 2.7, the hydrograph indicates a slow decline in the flow
prior to the onset of rainfall. This is typical of a stream relying on
baseflow (groundwater) for its discharge (Watson and Bernett, 1993).
Then, as the surface run-off begins to reach the stream in ever
increasing amounts the hydrograph rises sharply (June to July).
Further, as the intensity of rainfall diminishes, the hydrograph moves
over a peak and declines steeply till the surface run-off ceases to reach
the stream (July to October). Here onwards the trend of the hydrograph
is again governed by the baseflow.
75
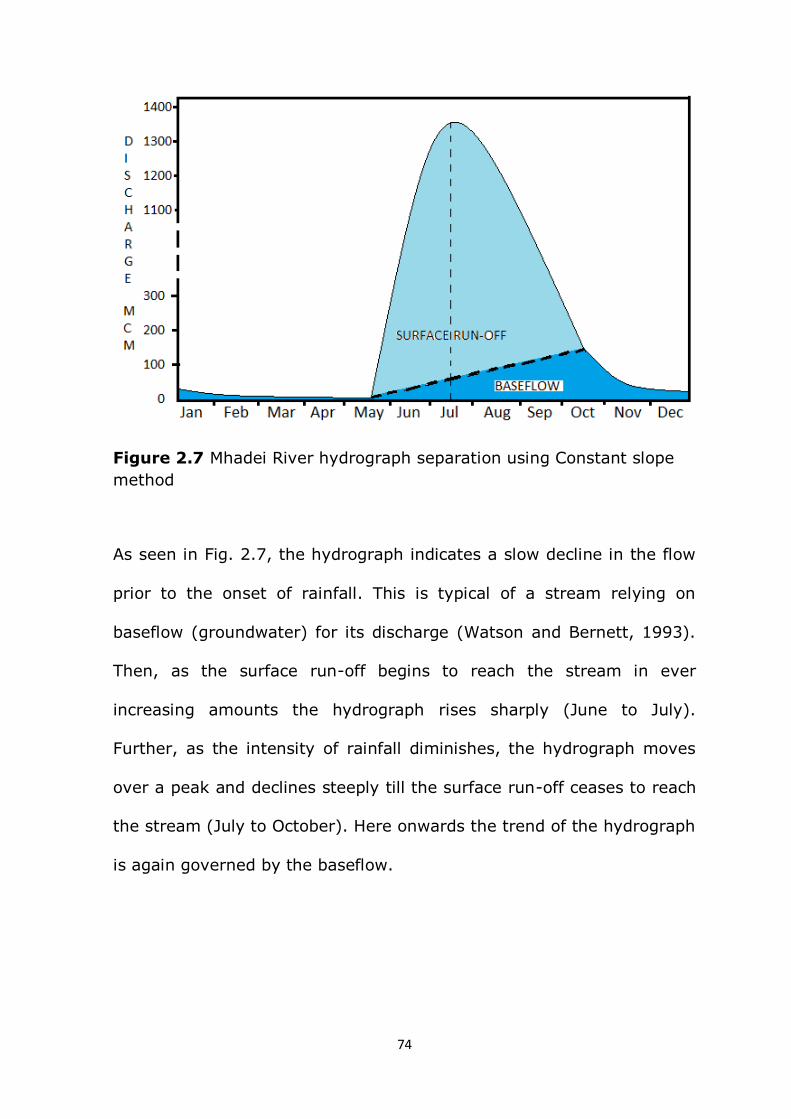
Table 2.11 Baseflow computation of Mhadei River watershed using
Stream hydrograph separation (Constant slope method)
Months Volume
of rainfall
(MCM)
River
discharge
(MCM)
Monsoon
baseflow
(MCM)
Non-monsoon
baseflow*
(MCM)
January 1 16 - 16
February 0 5 - 5
March 1 3 - 3
April 9 3 - 3
May 53 3 - 3
June 783 303 37 -
July 1303 1333 71 -
August 891 1185 105 -
September 315 340 140 -
October 146 173 - 173
November 32 55 - 55
December 4 27 - 27
Total 3538 3446 353 285
638
* All the flow volume measured during non-monsoon months is considered as
baseflow
As seen in Table 2.11, it is estimated that 638 MCM (19%) of the total
discharge measured at Ganjem station is baseflow component. The
total discharge of a stream is a function of the surface run-off
component and baseflow component. Therefore, the surface run-off
component can be calculated by subtracting the total baseflow from the
total discharge. This works out to be 2808 MCM per annum for the
Mhadei River watershed. As the total rainfall received by a catchment
76
gets partitioned into surface run-off, groundwater recharge and evapo-
transpiration, the volume available for the two later components is 730
MCM (volume of rainfall - surface run-off). Assuming 1% (35 MCM) of
the total rainfall received in the catchment is lost as evapo-
transpiration, the groundwater recharge works out to be 695 MCM. Of
this 638 MCM is discharged as baseflow, therefore the effective
groundwater recharge works out to be 57 MCM. The groundwater
recharge computed using water table fluctuation method works out to
be 41.86 MCM (Chapter 4). Therefore, the effective evapo-transpiration
loss amounts to 50 MCM i.e., 1.5%. of the total rainfall.
2.6 Discussion
The Mhadei River watershed receives abundant rainfall to the tune of
more than 3900 mm from the southwest monsoon from June to
September. This value is more than the average rainfall (3200 mm) for
the entire Goa State. However, the presence of Western Ghats in the
watershed causes uneven distribution of the rainfall resulting in higher
rainfall on the Goa side of the escarpment and relatively less rainfall on
the Karnataka plateau. The rainfall also exhibits a systematic spatial
pattern from west to east. It increases moving from western boundary
of the watershed towards the Western Ghats and further shows a
uniform decline moving from the Western Ghats towards the eastern
boundary of the watershed. The total volume of rain water received in
the Mhadei River watershed is 3538 MCM. Of this, 67% is contributed
77
from the Goa region and 33% is contributed from the Karnataka region
of the watershed. The total volume of monsoon rainfall received in the
entire Mhadei River watershed works out to be 3294 MCM while total
volume of non-monsoon rainfall is 244 MCM.
The average annual discharge of Mhadei River watershed at Ganjem
river-gauging station is 3446 MCM which is 97% of the total volume of
annual rainwater (3538 MCM) received by the watershed. Thus, only
3% of the total annual rainfall is attributed to groundwater recharge.
Histogram of the monthly rainfall and discharge data indicate that the
groundwater recharge dominantly takes place during the first three
months of the monsoon season.
It is estimated that 638 MCM (19%) of the total discharge measured at
Ganjem station is baseflow component. The total non-monsoon
baseflow contribution from Karnataka region computed using unit area
baseflow works out to be 109 MCM which is 38% of the total non-
monsoon baseflow (285 MCM) of the entire Mhadei River watershed.