Embed Size (px)
Citation preview

27 January 2017
The full report is available from
Summary of key issues During the week ending 26 January 2017, rainfall was recorded across all states and
territories, with the highest totals across tropical northern Australia and central Australia.
Following last week’s heavy rainfall, much of northern Australia has now received at least twice its January average rainfall. These falls are likely to boost soil moisture and water storage levels, as well as improve pasture growth opportunities for cattle producers in the area.
Maximum and minimum temperatures were between 2°C and 6°C above average across much of south-eastern Australia for the week ending 24 January 2017.
The latest Bureau of Meteorology ‘National Climate Outlook’ indicates that February to April 2017 is likely to be drier than average in central and south-eastern Australia and wetter than average in parts of western and northern Australia. For the remainder of the country, the chances of a wetter or drier than average three months are roughly equal.
The forecast for the next eight days indicates that rainfall is expected across most of Australia, with the highest weekly rainfall totals forecast for western and northern Australia.
Water storage levels in the Murray–Darling Basin (MDB) decreased by 426 gigalitres (GL) during the week ending 27 January 2017 to 17,825 GL, and are at 79 per cent of total capacity.
The lamb indicator price (18-22 kg fat score 2-4) increased by 1 per cent to 617 cents a kilogram as competition between processors and restockers continued.
Outlook 2017 - Innovation in agriculture - capturing the opportunities Registrations are now open for Australia’s premier information and networking forum for agriculture sector stakeholders.7-8 March in Canberra. Visit www.agriculture.gov.au/abares/outlook for more.
For more information or to subscribe, email [email protected]
2
1.1. Rainfall this week
1. Climate
For the week ending 26 January 2017, rainfall was recorded in all states and territories, with the highest totals across tropical northern Australia, and central Australia (see map below). Parts of southern and central Western Australia, and eastern Queensland recorded little or no rainfall. The highest recorded weekly total was 406 millimetres at Channel Point, southwest of Darwin in the Northern Territory.
Northern Australia has continued the wet start to the year, with rainfall totals of between 100 and 300 millimetres recorded in the Kimberley region of Western Australia, the Top End of the Northern Territory and Far North Queensland during the past week. Following last week’s heavy falls, much of northern Australia has now received at least twice its January average rainfall. This high rainfall is likely to boost soil moisture and water storage levels, as well as improve pasture growth opportunities for cattle producers in the area.The rainfall analyses and associated maps utilise data contained in the Bureau of Meteorology climate database, the Australian Data Archive for Meteorology (ADAM). The analyses are initially produced automatically from real-time data with limited quality control. They are intended to provide a general overview of rainfall across Australia as quickly as possible after the observations are received.
For further information go to http://www.bom.gov.au/climate/rainfall/
Rainfall for the week ending 26 January 2017
©Commonwealth of Australia 2017, Australian Bureau of Meteorology Issued: 27/01/2017

3
1.2. Temperature anomalies this weekFor the week ending 24 January 2017, maximum temperatures were between 2°C and 6°C above average across much of New South Wales and southern Queensland. Maximum temperatures were between 2°C and 8°C below average in the Northern Territory and most of Western Australia.Minimum temperatures were between 2°C and 8°C above average for parts of south-eastern Australia, and close to average for the rest of the country (see maps below).
Maximum temperature anomalies for the week ending 24 January 2017
©Commonwealth of Australia 2017, Australian Bureau of Meteorology Issued: 27/01/2017
Minimum temperature anomalies for the week ending 24 January 2017
©Commonwealth of Australia 2017, Australian Bureau of Meteorology Issued: 27/01/2017
Note: Spatial temperature analyses are based on historical weekly temperature data provided by the Bureau of Meteorology. These temperature anomaly maps show the departure of the maximum and minimum temperatures from their long-term averages. Temperature anomalies are calculated using high-resolution gridded datasets from 1911 onwards. For further information go to http://www.bom.gov.au/jsp/awap/temp/index.jsp.

4
1.3. National Climate OutlookThe rainfall and temperature outlooks presented below show the likelihood, represented as a percentage, of experiencing wetter or drier (and warmer or cooler) than median climatic conditions for the given outlook periods. Climate outlooks are generated by the Predictive Climate Ocean Atmosphere Model for Australia (POAMA), a dynamical (physics-based) climate model developed by the Bureau of Meteorology and CSIRO Marine and Atmospheric research division.
For further information, go to http://www.bom.gov.au/climate/ahead/about/
The short term outlook is influenced by an active phase of the Madden – Julian Oscillation (MJO). An active MJO at this time of year increases the likelihood of above average rainfall and tropical cyclones for northern Australia. Warm waters in the western Pacific Ocean are also increasing the moisture flowing into northern Australia during monsoonal bursts. The El Niño–Southern Oscillation remains neutral, as does the Indian Ocean Dipole.
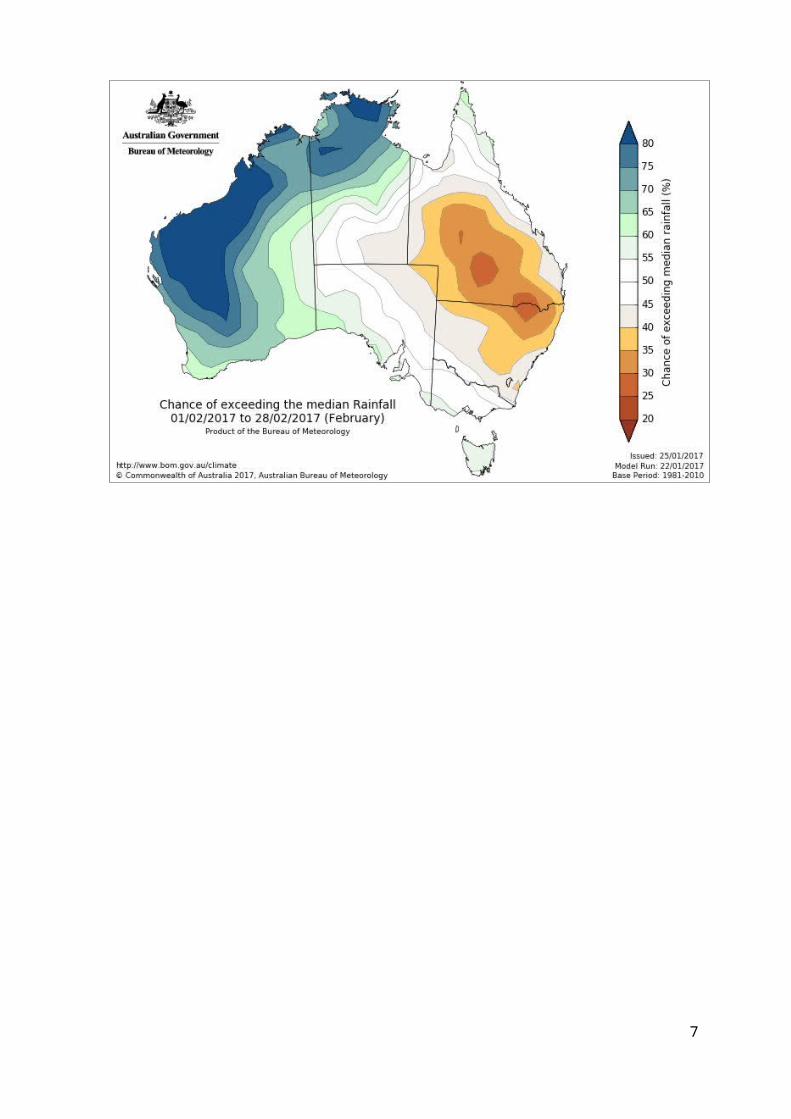
February 2017 is likely to be wetter than average for Western Australia and the Northern Territory with an increased chance of tropical cyclone development. Much of New South Wales and central and southern Queensland is likely to be drier than average for this period. For the remainder of the country, the chances of recording a wetter or drier than average February 2017 are roughly equal (Bureau of Meteorology ‘National Climate Outlook’, 25 January 2017).
Chance of exceeding the median rainfall February 2017

5
The rainfall outlook for February to April 2017 indicates that drier than average conditions are more likely for much of central and south-eastern Australia. In contrast, above average rainfall is more likely in northern Western Australia and across the Top End in the Northern Territory. For the remainder of the country, the chances of a wetter or drier than average three months are roughly equal (Bureau of Meteorology ‘National Climate Outlook’, 25 January 2017).
Chance of exceeding the median rainfall February to April 2017

6
The temperature outlook for February to April 2017 indicates maximum and minimum temperatures are likely to be above the median for most of eastern Australia. Maximum and minimum temperatures are more likely to be below the median in northern parts of Western Australia and the Northern Territory (Bureau of Meteorology ‘National Climate Outlook’, 25 January 2017).
Chance of exceeding the median maximum temperature February to April 2017
Chance of exceeding the median minimum temperature February to April 2017

7
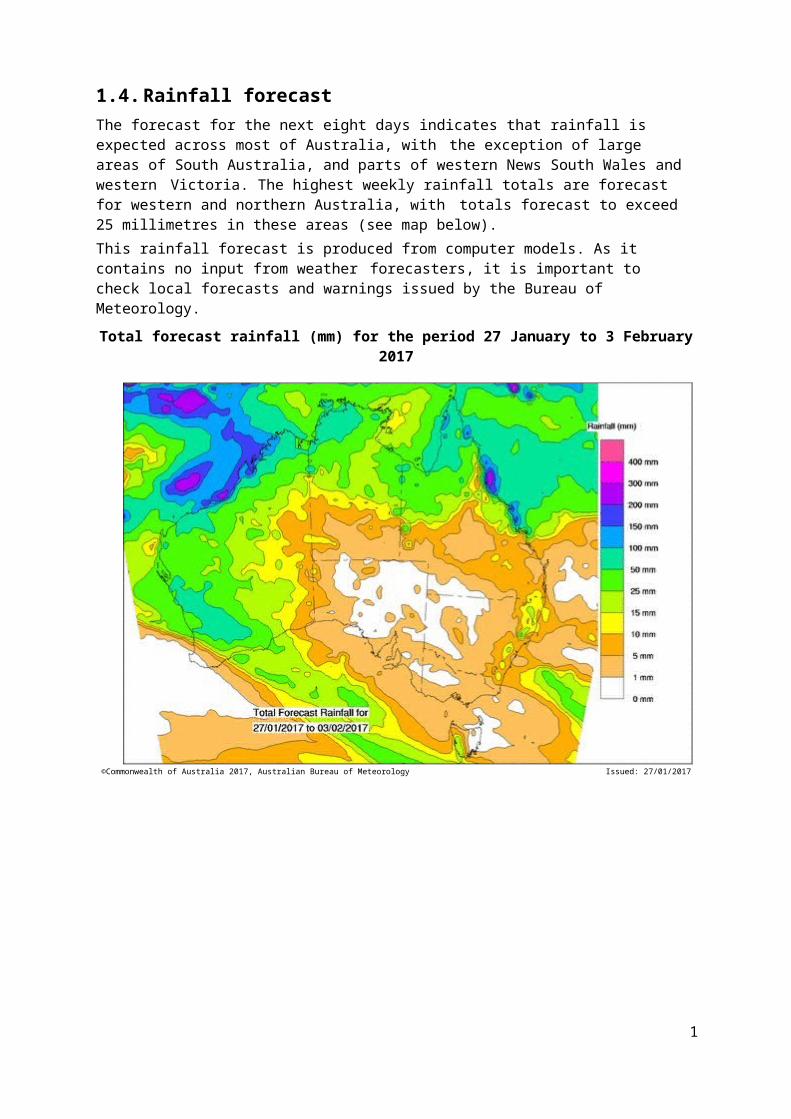
1.4. Rainfall forecastThe forecast for the next eight days indicates that rainfall is expected across most of Australia, with the exception of large areas of South Australia, and parts of western News South Wales and western Victoria. The highest weekly rainfall totals are forecast for western and northern Australia, with totals forecast to exceed 25 millimetres in these areas (see map below).This rainfall forecast is produced from computer models. As it contains no input from weather forecasters, it is important to check local forecasts and warnings issued by the Bureau of Meteorology.
Total forecast rainfall (mm) for the period 27 January to 3 February 2017
©Commonwealth of Australia 2017, Australian Bureau of Meteorology Issued: 27/01/2017
8
2.1. Water availability
2. Water
Water storage levels in the Murray–Darling Basin (MDB) decreased by 426 gigalitres (GL) during the week ending 27 January 2017 to 17,825 GL, and are at 79 per cent of total capacity. This water storage level is 42 percentage points or 9,559 GL more than at the same time last year.
Water storages in the Murray–Darling Basin (NSW, Victoria and Queensland)
Information on irrigation water available in the Murray–Darling Basin from 1 January 2001 to 27 January 2017 is shown above. The top horizontal (short dash) line indicates the storage level during a similar time last year. The bottom horizontal (long dash) line indicates the amount of ‘dead’ or unusable storage.

9
3.1. Market focusLamb
3. Commodities
The lamb indicator price (18-22 kg fat score 2-4) was higher across the eastern states in the week ended 20 January 2017, up 1 per cent to 617 cents a kilogram. Higher prices reflect increased competition for lambs between processors and graziers seeking to restock as a result of improved seasonal conditions.

10
r eIndicator Week
ended Unit Latest price
Price weekprior
WeeklyPrice 12
Year on yea change
monthschang
prior
Selected World Indicator PricesAustralian Dollar - AUD/USD Exchange Rate 25-Jan US$/A$ 0.76 0.75 1% ⇧ 0.7 9% ⇧Wheat - US no. 2 hard red winter wheat, fob Gulf 24-Jan US$/t 207 202 2% ⇧ 213 -3% ⇩Coarse Grains - US no. 2 yellow corn, fob Gulf 25-Jan US$/t 164 161 2% ⇧ 165 <1% ⇩Canola - Rapeseed, Europe, fob Hamburg 24-Jan US$/t 459 453 1% ⇧ 392 17% ⇧Cotton - Cotlook 'A' Index 25-Jan USc/lb 82.6 81.8 <1% ⇧ 68.9 20% ⇧Sugar - Intercontinental Exchange, nearby futures, no.11 contract 25-Jan USc/lb 20.4 20.7 -1% ⇩ 14.1 45% ⇧Wool - Eastern Market Indicator 26-Jan Ac/kg clean 1412 1434 -2% ⇩ 1280 10% ⇧Global Dairy Trade (GDT) weighted average prices a
Dairy - Whole milk powder 17-Jan US$/t 3 283 3 294 <1% ⇩ 2 188 50% ⇧Dairy - Skim milk powder 17-Jan US$/t 2 612 2 660 -2% ⇩ 1 835 42% ⇧Dairy - Cheddar cheese 17-Jan US$/t 3 940 3 894 1% ⇧ 2 867 37% ⇧Dairy - Anhydrous milk fat 17-Jan US$/t 5 528 5 352 3% ⇧ 3 724 48% ⇧Selected domestic crop indicator prices
Grain Sorghum - Sydney, NSW 25-Jan A$/t 248 248 0% ● 270 -8% ⇩Feed Wheat - General purpose, Sydney, NSW 25-Jan A$/t 209 214 -2% ⇩ 279 -25% ⇩Feed Barley - Sydney, NSW 25-Jan A$/t 170 175 -3% ⇩ 245 -31% ⇩Canola - Portland, Vic. 23-Jan A$/t 515 515 0% ● 537 -4% ⇩Selected domestic livestock indicator prices
Beef - Young cattle (300-400 kg live weight C3), Qld 21-Jan Ac/kg cwt 600 582 3% ⇧ 617 -3% ⇩Mutton - Mutton indicator (18-24 kg fat score 2-3), Vic 20-Jan Ac/kg cwt 428 422 1% ⇧ 313 37% ⇧Lamb - Lamb indicator (18-22 kg fat score 2-4), Vic 20-Jan Ac/kg cwt 617 608 1% ⇧ 508 21% ⇧Pig - Pig indicator (Buyers 60.1-75 kg), NSW 14-Jan Ac/kg cwt 368 375 -2% ⇩ 387 -5% ⇩a Global Dairy Trade prices are updated twice monthly on the first and third Tuesday of each month.
11
3.2. Selected world indicator prices

12

13
3.3. Global Dairy Trade (GDT) weighted average prices

14
3.4. Selected domestic crop indicator prices

15
3.5. Selected domestic livestock indicator prices

16
3.6. Movements in selected fruit and vegetable prices – week ended 21 January 2017

ClimateBureau of Meteorology
4. Data attribution
Weekly rainfall totals: www.bom.gov.au/jsp/awap/rain/index.jsp Monthly and last 3-months rainfall percentiles: www.bom.gov.au/jsp/awap/rain/index.jsp Temperature anomalies: www.bom.gov.au/jsp/awap/temp/index.jsp Rainfall forecast: www.bom.gov.au/jsp/watl/rainfall/pme.jsp Seasonal outlook: www.bom.gov.au/climate/ahead Drought statement: www.bom.gov.au/climate/drought/drought.shtml Soil moisture: Bureau of Meteorology (Australian Water Resources Assessment Landscape model)
www.bom.gov.au/water/landscape/
WaterNew South Wales New South Wales Water Information: http://waterinfo.nsw.gov.au/ New South Wales Office of Water, Department of Primary Industries: www.water.nsw.gov.au/Home/default.aspx
Available water determinations register: http://www.water.nsw.gov.au/water-licensing/registers
Queensland Sunwater: www.sunwater.com.au Seqwater: http://seqwater.com.au South Australia SA Water: https://www.sawater.com.au/community-and-environment/the-river-murray/river-reports/daily-flow-
report South Australian Department of Environment, Water and Natural Resources: http://www.environment.sa.gov.au
Victoria Goulburn–Murray Water: www.g-mwater.com.au
CommoditiesFruit and vegetables Datafresh: http://www.freshstate.com.au Mutton, lambs, wheat, barley and grain sorghum The Land: hardcopy or online at http://theland.farmonline.com.au/markets Cattle, mutton and lambs Meat and Livestock Australia: http://www.mla.com.au/Prices-and-markets
Pigs Australian Pork Limited: www.australianpork.com.au
Canola Weekly Times: hardcopy
Dairy Global Dairy Trade: http://www.globaldairytrade.info/en/product-results/
17