Embed Size (px)
Citation preview
136 Center for American Progress Action Fund | Cities at Work: Progressive Local Policies to Rebuild the Middle Class
Raise needed revenue efficiently and fairly
Introduction
Local government provides the majority of basic services for daily life: streets and sidewalks; garbage and recycling removal; water, sewer, and storm water systems; public transit; public housing; police, fire, and ambulance service; parks; libraries; public health; planning and zoning; education; and much more.
But local government budgets, never particularly flush, have been hit hard in the past several years. Cities that rely on the property tax are devastated by the decreases in property value that followed the collapse of the housing market. City investments also were hit by the corresponding market crash, and revenues from city income taxes, building permit fees, and the like have all dropped. State and federal aid have been cut, and some states have added insult to injury by imposing caps on the ability of cities to raise revenue via taxes. Moreover, these decreases come as demand for government services rises, driven by stubborn unemploy-ment rates and knock-on effects from federal and state belt-tightening.
Hemmed in by state-imposed caps on revenue-raising and well-funded antitax movements, local governments have responded with deep and wide-ranging cuts to services. They have increased class sizes and shortened school days, cut city services from public safety to trash collection, and privatized or consolidated functions such as maintaining parks and handling 911 calls. They also have mas-sively eliminated public-sector jobs, shedding nearly half a million employees—or more than 3 percent of the local government workforce—since September 2008 through layoffs and attrition.1
Such measures have resulted in a vicious cycle in many cities: Declining revenues result in massive cuts to public services and amenities, which pulls money out of the local economy and decreases quality of life for city residents and businesses. This causes them to flee the city, further shrinking the tax base.
137 Center for American Progress Action Fund | Cities at Work: Progressive Local Policies to Rebuild the Middle Class
Rather than cut services to the bone and send cities into a death spiral, municipalities need to figure out ways to maintain revenues, allow-ing them to support services and quality of life and give them resources to revitalize the local economy. While there are many things that could improve this picture at the state and federal level, they are largely beyond the scope of this docu-ment. We discuss here tools that cities can use to improve their revenue picture in a progres-sive way and touch on state and federal law only where relevant for understanding the limits of possible city action.
Progressive municipal tax policy Background
As noted above, the economic crisis has increased the need for housing, social services, education, and the like. As if this were not enough, cities face a looming infrastructure crisis as well. Many water, sewer, and transportation systems are 50 or more years old and need substantial investment to continue functioning. Last but certainly not least, the looming specter of global climate disruption means that cities are dealing more frequently with extreme weather events and the frequently expensive consequences that follow.
Local governments need revenue to deal with all these issues and to provide basic ser-vices to their constituents.2 There is no question that taxes must be part of this solu-tion. While cities are already often taxed at higher rates than surrounding areas, it is simply unrealistic to think that state or federal governments are going to significantly increase aid to cities or make aid-distribution formulas more equitable. Increased city taxes, therefore, will have to be part of the equation for municipal budgets.
But in addition to considering a range of local tax increases, municipalities should consider reforms that make the local tax system more progressive. Below are some suggested ways to accomplish both these ends without unduly burdening working families or creating an unsupportable drag on economic growth, along with some general suggestions for making municipal tax systems fairer and more efficient.
FIGURE 7
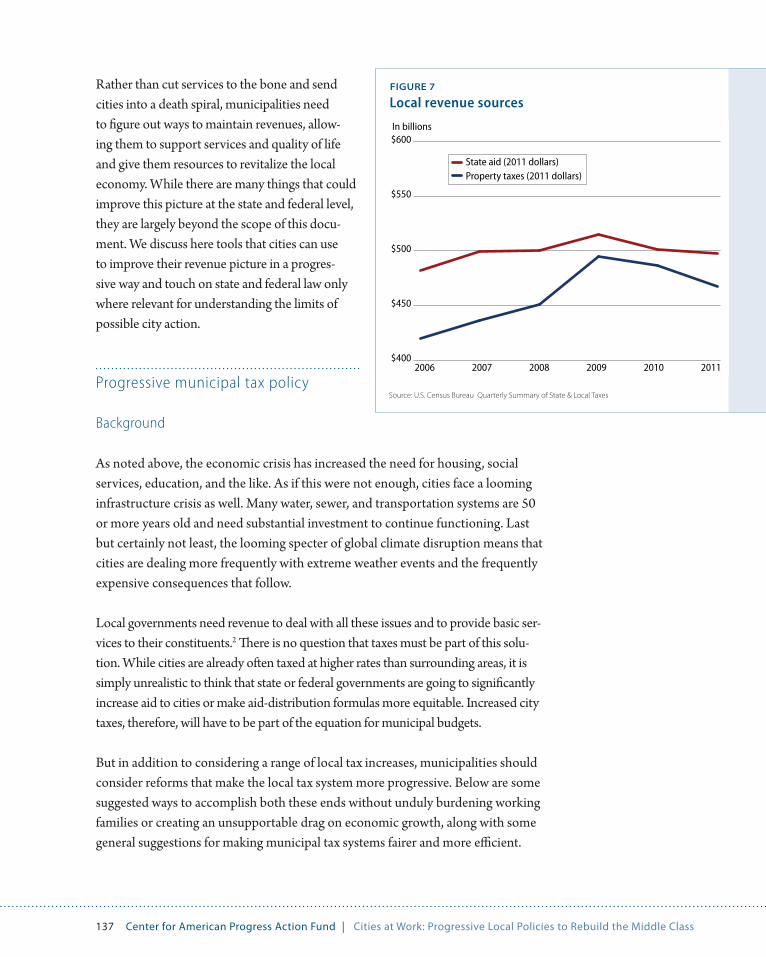
Local revenue sources
Source: U.S. Census Bureau Quarterly Summary of State & Local Taxes
137 Center for American Progress Action Fund | Cities at Work: Progressive Local Policies to Rebuild the Middle Class
EMBARGOED—NOT FOR DISTRIBUTION OR CITATION
Rather than cut services to the bone and send cities into a death spiral, municipalities need to figure out ways to maintain revenues, allow-ing them to support services and quality of life and give them resources to revitalize the local economy. While there are many things that could improve this picture at the state and federal level, they are largely beyond the scope of this docu-ment. We discuss here tools that cities can use to improve their revenue picture in a progres-sive way and touch on state and federal law only where relevant for understanding the limits of possible city action.
Progressive municipal tax policy Background
As noted above, the economic crisis has increased the need for housing, social services, education, and the like. As if this were not enough, cities face a looming infrastructure crisis as well. Many water, sewer, and transportation systems are 50 or more years old and need substantial investment to continue functioning. Last but certainly not least, the looming specter of global climate disruption means that cities are dealing more frequently with extreme weather events and the frequently expensive consequences that follow.
Local governments need revenue to deal with all these issues and to provide basic ser-vices to their constituents.2 There is no question that taxes must be part of this solu-tion. While cities are already often taxed at higher rates than surrounding areas, it is simply unrealistic to think that state or federal governments are going to significantly increase aid to cities or make aid-distribution formulas more equitable. Increased city taxes, therefore, will have to be part of the equation for municipal budgets.
But in addition to considering a range of local tax increases, municipalities should consider reforms that make the local tax system more progressive. Below are some suggested ways to accomplish both these ends without unduly burdening working families or creating an unsupportable drag on economic growth, along with some general suggestions for making municipal tax systems fairer and more efficient.
FIGURE 7
Local revenue sources
Source: U.S. Census Bureau Quarterly Summary of State & Local Taxes
$400
$500
$600
$450
$550
State aid (2011 dollars)Property taxes (2011 dollars)
In billions
2006 2007 2008 2009 2010 2011
138 Center for American Progress Action Fund | Cities at Work: Progressive Local Policies to Rebuild the Middle Class
Reform the property tax
The first leg of the three-legged stool of municipal taxation—property, sales, and income—and the major source of revenue for most municipalities is the local prop-erty tax.3 While the share of municipal revenue coming from property has dimin-ished over time as states have introduced sales and income taxes, the property tax remains an important mechanism for funding education and other local services.
Many local governments have responded to the recent budgetary crisis by raising property tax rates across the board. Sarasota, Florida, for example—which lost nearly a third of its tax base, or $3.5 billion, over the past three years—closed its budget shortfall by increasing property rates for the first time since 2007; note that almost all states place some limit on the ability and extent to which munici-palities can raise property taxes.4
Property taxes are regressive, though, since home values tend to represent a much larger share of income for middle- and lower-income families than for the wealthy.5 So rather than, or in addition to, simply raising rates across the board, cities should gener-ally make the property tax less regressive and consider changes and targeted exemp-tions to the tax that will soften the blow of such an increase to working families.
First, cities should limit property tax exemptions for businesses, typically given as incentives for businesses to relocate (see the sections on subsidies and small busi-ness support) or sometimes as part of tax increment financing, or TIF, districts (see Value Capture section). These shift the revenue burden onto middle-class homeowners less able to afford it.
Second, municipalities can employ carefully targeted property “tax relief ” and can concomitantly avoid tax relief measures that make the system more regressive. The former includes:
• Homestead exemptions, which reduce property taxes for homeowners by sheltering a certain amount of a home’s value from taxation. More than 40 states currently allow some form of homestead exemption. Flat dollar exemptions, the more common approach, are preferable to percentage exemptions, which for obvious reasons benefit higher-value homes and homeowners more.
• “Circuit breakers” offset property taxes, usually by giving a credit when a prop-erty tax bill exceeds a certain percentage of a taxpayer’s income.6 Circuit break-
139 Center for American Progress Action Fund | Cities at Work: Progressive Local Policies to Rebuild the Middle Class
ers are often funded by the state but can be set by local governments. They are usually only available to low-income homeowners—the preferred approach.7 The County of Santa Fe, New Mexico, for instance, provides a refundable credit based on property-tax liability to all residents with gross income less than $24,000; the amount of the credit varies with income and is based on nine income brackets.8 Monroe, Connecticut, and a number of other Connecticut towns match the state’s circuit breaker credit and offer more generous income limits. The limit on the Monroe program is $60,000 for both single and mar-ried residents, while the state program caps benefits at $32,300 and $39,500, respectively.9 Circuit breakers are an appealing form of relief in that they can be narrowly targeted to those who genuinely need relief. The disadvantage of circuit breakers is that, in general, they must be applied for, whereas homestead exemptions usually go automatically to eligible taxpayers.
• Deferral programs allow some homeowners—typically elderly, disabled, or low-income—to delay paying their property tax bills for a period, usually until the property is sold or the homeowner passes away. Because deferred taxes must be paid back with interest—though typically at a much lower rate than those charged on delinquent taxes—the program does not significantly affect the overall regres-sivity of the property tax; still, for low-income taxpayers in genuine need, deferral programs may constitute a better option than default. Norwalk, Connecticut, for instance, allows applicants to defer up to $4,000, or 50 percent of their tax due.10
Each of the targeted options listed above is preferable to broad-based forms of property tax relief such as caps on increases, rates, or value and to state income tax deductions, which at best leave the current system equally regressive and at worst can exacerbate its regressivity. Caps on property taxes, a popular tool of the anti-tax movement, are both poorly targeted and costly. Such caps basically amount to a state-mandated restriction on the ability of local governments to raise revenue, and while state lawmakers take credit for cutting taxes, local lawmakers are forced to make difficult decisions about which services to cut. California’s infamous Proposition 13 is the classic example and has left that state with an eroding school system and a 30-year budget crisis.
Implement payments in lieu of taxes
Another valuable reform—or supplement—to local property tax is encouraging nonprofit and other tax-exempt entities to help pay for their share of local services
Caps on property
taxes, a popular
tool of the anti-
tax movement,
are both poorly
targeted and costly.
140 Center for American Progress Action Fund | Cities at Work: Progressive Local Policies to Rebuild the Middle Class
via payments in lieu of taxes, or PILOTs. PILOTs are voluntary payments made by nonprofit organizations, utilities, or other units of government11 and are not generally subject to local taxation as a substitute for property taxes.
PILOTs—or fees in lieu of taxes, or FILOTS—can be administered in variety of ways, from one-time contributions to routine annual payments; the structure is generally determined via negotiations between city staff and individual tax-exempt property owners.
While voluntary, the program aims to address the costs associated with providing city services to these properties. If a PILOT program is fair, consistent, and developed transparently in collaboration with tax-exempt property owners, it can be an effective strategy to generate compensation for city services provided to tax-exempt entities.12
Since 2000, at least 117 municipalities in at least 18 states have implemented some form of the PILOT program. They make the most sense in cities that rely heav-ily on property taxes or have a large portion of property owned by tax-exempt property owners. Large cities collecting PILOTs include Baltimore, Boston, Philadelphia, and Pittsburgh, all of which meet the above description.
Boston’s building stock, for example, is comprised of 52 percent tax-exempt build-ings, including 30 colleges and universities, 25 nonprofit hospitals, and more than 20 cultural facilities. In 2011 the city revised its long-standing PILOT program and set a standard level of payment for all tax-exempt institutions owning property valued at more than $15 million. The payment is based on 25 percent of the property’s value, from which 50 percent may be deducted for community benefits. In the first half of FY 2012, the program generated $9.9 million, 92 percent, of the requested $10.8 million.13
Reform regressive taxes and fees
Where possible, localities should minimize regressive user fees on public services such as roads, public transit, and libraries (see the section on progressive pricing structures for more on user fees) and avoid out-and-out regressive taxes such as the sales tax. Many municipalities, however, already depend on revenues gener-ated by local sales and use taxes14 and many regressive taxes and fees such as sin taxes and the vehicle miles traveled fee contribute to broad policy goals in addi-tion to raising revenues (see the section on sin taxes below and the section on the vehicle miles traveled fee in Pricing and User Fees).
141 Center for American Progress Action Fund | Cities at Work: Progressive Local Policies to Rebuild the Middle Class
Where elimination of the sales tax is not feasible and elimination of fees that encourage efficient use of resources is not advisable, cities can take steps to ratio-nalize sales taxes and soften their blow to working families.
As a general matter, sales taxes should be applied as broadly as possible. One application of this principle is taxing Internet sales to the extent permitted under federal and state law. There is no particular reason to exempt Internet sales, and there are compelling reasons not to, including increased revenues and avoiding discrimination against bricks-and-mortar stores, which are more likely to be local. While federal law since the Supreme Court’s Quill Corp. v. North Dakota15 deci-sion sharply limits collection of sales tax on Internet transactions—and pending much-discussed and long-delayed congressional action—states and localities have developed a number of methods for collection, including the National Governors Association’s Streamlined Sales Tax Project,16 which cut deals directly with major Internet sellers.17 New York also launched a recent legislative effort to create a suf-ficient nexus to allow taxation on Internet sales.18
Localities should also avoid carving out special exemptions for favored industries or classes, which have the effect of distorting markets by shifting the burden to other businesses and making the tax harder to administer, as well as reducing revenues.
Localities should, however, consider creating—or in most cases maintaining—sales-tax exemptions for necessities such as groceries and medication, which lessen the impact of the sales tax on working families.19 Despite justified objec-tions that exemptions are hard to target properly, cause sales tax revenues to fluc-tuate, and are an administrative challenge, exemptions are a key way to make sales taxes less regressive. Cities may choose to put a hard ceiling on such exemptions, though such an approach risks penalizing larger families with high grocery bills, for example, as well as those purchasing luxury food items.
Examples include local exemptions from sales taxes for clothing and footwear costing less than $110 per item in some New York cities.20 and county-by-county exemptions for food and food stamps in South Carolina.21
An alternative approach to exemptions is to provide a sales-tax credit, which returns a flat dollar amount for each member of a family and is available only to taxpayers with incomes below a certain threshold. These credits can be made refundable, meaning that the value of the credit does not depend on the amount of taxes a claimant pays. The Kansas food sales tax refund allows low-income Kansas taxpayers over 55 years old and any Kansan with children to claim up to $90 for each family member.22
142 Center for American Progress Action Fund | Cities at Work: Progressive Local Policies to Rebuild the Middle Class
Finally, in certain cases, targeted sales taxes may allow cities to levy taxes on por-tions of the tax base that reflect the area’s economic strengths such as tourism. In the case of tourism-focused economies, this shifts some of the tax burden off residents and on to visitors or other nonresidents who benefit from city infrastruc-ture and services. In Montana, for instance, communities of under 5,500 that meet specific resort qualifications, including Whitefish, Big Sky, and West Yellowstone, charge resort taxes—a type of local option sales tax—to manage wear and tear on local infrastructure without overburdening citizens.23
Target sin taxes
Sin taxes are essentially a form of sales tax, though they are typically calculated on a per-unit basis rather than as a percentage of sales price. They are an excise tax on cer-tain disfavored goods and activities, usually alcohol, tobacco, and gambling, though sugar-sweetened beverages have recently been added to the list.24 Driven by the dual pressures of budgetary shortfalls and the anti-tax movement, sin taxes—particularly those on tobacco products—have in recent years been an increasingly popular way to goose state and local revenues. Such taxes are seen as particularly politically sal-able due to both their narrow base and their effectiveness in discouraging undesir-able and socially costly behavior such as smoking, drinking, and gambling.
Sin taxes, similar to other sales taxes, are regressive by nature. Indeed, they tend to be even more regressive than other forms of sales tax because they are unrelated to the price of the item purchased—so the excise tax paid on premium wine, beer, and cigarettes is the same as that paid on less expensive brands. They are also regressive because lower-income individuals tend to consume greater quantities of disfavored goods, especially tobacco and sugar-sweetened beverages.25 So while there is good evidence that higher taxes on unhealthy products do in fact discourage use,26 the fact remains that the majority of smokers and soda drinkers will continue to use the taxed products despite higher taxes, and low-income people will bear the brunt of the tax.
For that reason, cities should be hesitant—much more hesitant than they have heretofore been—of relying too heavily on sin taxes. Cities nevertheless may consider implementing regressive taxes when they create other policy benefits, in addition to raising revenue. If a regressive tax sends signals for behavior that is bet-ter for the individual paying the tax and society—as in the case of sin taxes—then the idea should not be discarded outright.
143 Center for American Progress Action Fund | Cities at Work: Progressive Local Policies to Rebuild the Middle Class
On the other hand, as noted above, cities have been increasingly turning to regres-sive fees and taxes as a politically expedient way to make up for lost revenues. We do not support thoughtless, politically motivated rate hikes that disproportion-ately burden the nonvoting poor. Cities should thus avoid regressive taxes and fees that do not encourage a policy goal or benefit society, or worse yet, that punish good decisions—as in the case of raising transit fees.
To the extent that municipalities do employ sin taxes as a revenue measure, they should consider shifting to a percentage-based rather than unit-based calculation to ameliorate the inequity noted above. Chicago charges an excise tax to sellers of 3 percent for bottled soft drinks and 9 percent for fountain drinks, as opposed to Richmond, California, which charges buyers $0.01 per ounce.27
Institute a progressive city income tax
Another revenue source cities should consider, where permitted by state law, is instituting a progressive city income tax. Seventeen states and the District of Columbia currently allow cities, counties, and municipalities to levy their own separate individual income taxes in addition to state income taxes.28
Local income taxes can appear as wage taxes, income taxes, payroll taxes, local ser-vices taxes, and occupational privilege taxes. They are generally paid by the employee but withheld by the employer, although in some cases, such as in San Francisco and Portland, Oregon), they are paid directly by the employer. Some are imposed as a per-centage of salaries or wages, while others are stated as a percentage of federal or state tax, and still others are flat amounts charged to all workers. The burden of compliance can be made extremely low by having residents pay their local income tax when they file their state income tax, as they do in Maryland and New York City.
Rather than set local income taxes at a flat rate, as do most jurisdictions, cities should create a graduated progressive rate schedule similar to the federal system. New York City, for instance, has five tax brackets with rates ranging from 2.907 percent to 3.648 percent. These rates kick in at different income levels depending on filing status.29 Washington, D.C.—admittedly something of a sui generis case because of its status as a federal district—recently increased the marginal income tax rate on those making over $350,000 a year from 8.5 percent to 8.95 percent, which will raise an estimated $106 million in revenue over the next four years.30
Another revenue
source cities
should consider,
where permitted
by state law,
is instituting a
progressive city
income tax.
144 Center for American Progress Action Fund | Cities at Work: Progressive Local Policies to Rebuild the Middle Class
To make flat-rate municipal income taxes more progressive, cities can offer large standard deductions or exemptions. Or localities may offer working families credits that have the effect of making the rate structure more progressive. New York City, for example, offers a child and dependent care credit, a school tax credit, and a city-level earned income tax credit, discussed in more detail below. All are means-tested, meaning they are only available to lower-income families.31 Cities should avoid offering itemized deductions, which tend to favor the wealthy, or allowing deduction of federal and state income taxes from city taxable income, which do the same. And cities should tax capital gains and interest income at the same rate as regular income, avoiding the massive giveaway to the ultra-rich that the federal capital gains tax break, for instance, entails.
Cities with income taxes should consider creation of a city- or county-level earned income tax credit, or EITC, to support working families and, in some cases, further leverage available federal funds. EITCs are refundable tax credits available to low- and middle-income individuals to offset taxes paid on wages. At the federal level, the EITC is an important poverty-reduction tool—it kept 5.4 million people out of pov-erty in 2010.32 Localities that have experimented with this option include Denver, San Francisco,33 New York City,34 and Montgomery County, Maryland.35
New York City’s EITC, for instance, is calculated as 5 percent of the federal credit. In tax year 2007, 865,341 families claimed $87 million from the New York City EITC. Montgomery County, a large suburban county neighboring the District of Columbia, enacted a refundable EITC in 1999 to help offset the high cost of living for a large number of low-income working families in the jurisdiction. Eligible families that file for the EITC receive a county credit equal to the state’s refundable credit. During tax year 2003, more than 18,000 checks were mailed to eligible county residents.36
San Francisco’s working families credit, or WFC, launched in 2005 and provides a local match—10 percent in 2005—to the federal EITC for families with children. The WFC is funded through a public-private partnership that draws on corporate dollars and philanthropic contributions, as well as public funds. In 2005 the WFC provided an extra $220 on average to the city’s working families.37
Cities without a city-level income tax have in some cases used federal dollars to fund a city-level EITC. Denver, for example, has no city income tax and in 2002 became the first city in the nation to offer a city earned income-tax credit funded with federal Temporary Assistance for Needy Families, or TANF dollars. The city took $5 million from its share of the state TANF allocation to provide a credit
145 Center for American Progress Action Fund | Cities at Work: Progressive Local Policies to Rebuild the Middle Class
equal to 20 percent of a family’s federal EITC award in the prior year. Available only to workers with children, the city EITC ran as high as $778 for a family.
By piggybacking on the eligibility information already provided in the federal EITC application, Denver was able to reduce the overhead of administering these TANF funds from 20 percent to 1 percent and to reduce the time it takes a low-income working family to apply for these funds from several hours to a few min-utes, thereby increasing the participation rate by more than 600 percent.38 State legislation was unfortunately passed in 2009 requiring counties to return a portion of TANF reserves to the state;39 this effectively ensures that county reserves will never be sufficient to fund a local EITC in any county through TANF.
Another advantage of local income taxes is that, unlike property taxes, they can also be applied to nonresidents who use the community’s roads, water, sewer, and so forth but pay no taxes into the community as a result of living outside of the municipality.40 In this form of commuter tax, cities often impose a slightly lower rate on nonresidents than residents. In Maryland, for example, county and city income taxes range from 1.25 percent to 3.2 percent, but nonresidents pay a uni-form rate statewide set at the lowest county rate of 1.25 percent. Philadelphia has a 3.928 percent wage tax on residents and a 3.4985 percent tax on nonresidents for wages earned in the city as of July 2010.
Finally, municipalities should consider enacting a business income tax. While many municipalities impose a business licensing fee or the equivalent on busi-nesses operating within the jurisdiction, relatively few impose city- or county-level taxes on business income. Both are good sources of revenue, but a local corporate income tax has the advantage of drawing more from the largest businesses. The impact on small businesses can be lessened and the system made more progres-sive by offering large exemptions—for example, all revenues up to $50,000. Multnomah County, Oregon, where Portland is located, imposes a corporate income tax of 1.45 percent but exempts businesses grossing less than $50,000.41
Value-capture strategies Background
In addition to broad-based revenue measures, cities can use a variety of more tar-geted tools to generate revenue in an equitable and sustainable way. Large public
146 Center for American Progress Action Fund | Cities at Work: Progressive Local Policies to Rebuild the Middle Class
infrastructure investments, for instance, can substantially increase the value of adjacent land. Improvements to transportation, schools, and quality of life play an important role in location choices made by employers, employees, and the public. Capturing and monetizing the value of this benefit is a smart way to generate revenue for operations and maintenance of the facility or construction funding for new infrastructure.
Value capture essentially means capturing the increase in property value that flows from a public investment. There are a number of important considerations to address in applying such measures: How do cities best measure the value of the benefit of new infrastructure? What tax rate should be applied? How stable is the revenue? Is a particular value-capture tool appropriate in a particular community? Still, value-capture techniques provide excellent opportunities for cities to gener-ate revenue directly from those who benefit from public infrastructure.
When used wisely, the value-capture strategies described below can allow cities to generate revenues from assets that would otherwise benefit private entities for free.
Smart use of air rights conveyances
The sale or lease of air rights for land above or below a publicly owned facility offers the opportunity for cities to generate revenue and to ensure that land used for a pub-lic purpose is not lost from the tax rolls. Air rights can be conveyed in conjunction with various types of public facilities, including subway and metro stations or buried highways and rail lines; publicly owned parking lots; reconstructed public buildings; and redeveloped freight facilities. These public facilities either provide transit access to buildings above or below them or create developable space in an area that previ-ously was taken up by a highway, rail line, building, or facility.
Air space conveyance is well established in the United States. It dates back to 1913 when New York’s Grand Central Station and adjacent Park Avenue development were built over the Central Railroad. Cities may choose to lease or sell their air rights to a private developer,42 and if executed well, the transaction can benefit the city, the developer, and the public.
Developers appreciate air space because it offers the opportunity to secure a large site in one transaction and eliminates the tedious process of assembling several parcels, demolishing existing structures, and relocating present tenants. Second, it offers the chance to obtain a prime site often in or near a central business district
Value capture
essentially
means capturing
the increase in
property value that
flows from a public
investment.
147 Center for American Progress Action Fund | Cities at Work: Progressive Local Policies to Rebuild the Middle Class
where reasonably priced conventional sites may no longer be available. Third, air space is often sufficiently less expensive than similarly located vacant land to more than offset additional construction costs.43
The public benefits from these transactions as long as the resulting development is a good use of space, contributes to neighborhood connectivity, and increases surrounding property values. For the public and the city, in addition to generating revenues, air rights developments can contribute to dense, urban, transit-oriented development. Developments built on air rights may also eliminate eyesores such as open parking garages and rail yards. Seattle; New York City; Columbus, Ohio; and Duluth, Minnesota, are a few cities that have sold land on the right of way of sunken urban highways to knit together neighborhoods severed by the thoroughfares.
Washington, D.C., is planning a major office and retail development on a platform atop a recessed portion of a highway that slices through the city’s central business district, potentially transforming the highway into a destination.44 And transit agencies in D.C., Atlanta, Los Angeles, and Boston have sold air rights above sta-tions in their subway systems to create more dynamic transit hubs.45
Air rights deals are complex and should be carefully scrutinized to make sure the local government is getting the best deal possible.46 As a general rule, the amount paid for air rights in a particular area should reflect the value of the location—prime downtown developable space—and the benefits received from public infrastructure at the site—transit accessibility.47 The best air rights conveyance scenarios fairly compensate the local government, lead to a development that is well designed and transit oriented, and use revenues effectively to pay for con-struction, operation, and maintenance of smart infrastructure systems.
Bethesda, Maryland, is home to the most financially remunerative air-rights deal in the country—an office-retail-hotel project on top of the Bethesda Metro Station that generates $1.6 million annually in air-rights rent for the Washington Metropolitan Area Transit Authority. Not incidentally, the development has spurred nearby office, retail, and residential development, as well as a popular nighttime entertainment, restaurant, and arts district.48
Cities can also structure and benefit from air-rights deals so that they have a stake in the profits associated with particular developments. In Denver the Regional Transit District, or RTD, leased air rights over the city’s Civic Center Transit Facility to a developer for $400,000 in each of the first 15 years plus 38 percent of the developer’s
148 Center for American Progress Action Fund | Cities at Work: Progressive Local Policies to Rebuild the Middle Class
profit after it first deducts a 13.5 percent return on its cash investment. Upon expira-tion of the lease, RTD will own the 600,000-square-foot office building.49
Reform and target tax increment financing
Tax increment financing, or TIF, is a popular public finance tool used to fund pub-lic infrastructure, promote development, and expand the future tax base. It uses taxes levied on the projected incremental increase of property values resulting from development to pay the present cost of improvements made both by private developers and the municipality.
Forty-nine states—all except for Arizona—and the District of Columbia have statutes authorizing TIF. Thousands of TIF districts operate across the country, with activity particularly concentrated in California cities and Chicago. If used judiciously, after a detailed market analysis, and with meaningful public involve-ment, TIF can be a transformational tool to finance large capital projects, driving private investment and revitalization in blighted communities.
While laws vary by state, TIF is generally designed to fund projects in distressed or underdeveloped areas where development would not otherwise occur. It is intended to address blight and promote district-oriented development.
The TIF process starts with defining the TIF district’s geographic boundaries and establishing the baseline assessed value of land in the district. Over time, the incre-mental increase in tax revenue within the TIF district is used to pay debt service on TIF bonds or can be used on a pay-as-you-go basis for individual projects.
In addition to helping to finance private development, TIF can be used to pay for a wide range of municipal infrastructure improvements, including sewer expansion, storm drainage, park improvements, curbs and sidewalks, schools, libraries, bridges, and environmental remediation in the district.50 The structure of a TIF district ensures that those who benefit most from the improvements are the ones who pay for them.
While TIF is an important and useful municipal development tool, misuse of TIFs has undermined the tool’s effectiveness in many communities. TIFs are frequently misapplied for greenfield development and development in prime areas that would have been developed without TIFs.
149 Center for American Progress Action Fund | Cities at Work: Progressive Local Policies to Rebuild the Middle Class
Requiring objective measures of economic deprivation and need in defining TIF districts would go a long way toward returning the tool to its original purpose of addressing blight. Additional reforms that should be implemented include:
• Requiring reimbursement of subsidies, or clawback, if developers do not fulfill their promises under redevelopment agreements
• Requiring cost-benefit analysis to take into account the effect of a TIF on other taxing districts outside the sponsoring jurisdiction51
• Establishing a strong TIF policy that makes greenfield development ineligible and aligns TIF district establishment with city goals
• Establishing minimum job creation and wage guidelines for TIF projects52
Cities without clear TIF policies and goals may find that TIF quickly becomes simply a subsidy to developers instead of a way of promoting the overall public good.
Land-value taxation and split-rate taxation
Economists of all stripes generally agree that taxing land, rather than improve-ments on the land, generates more profitable, equitable growth. Land is finite; cities can develop or leave vacant prime land, but they cannot add more. This fact makes a tax on land ownership more efficient than a property tax based on the value of improvements.53 There is no way for a landowner to retain land while avoiding taxes, and therefore there is less incentive to sit on land without adding to its value.54 The current property tax, which applies the same rate to land and property values, rewards property owners who sit on undeveloped land, as well as those who let their buildings fall into disrepair.
Land-value taxation—land that is taxed at 100 percent of its value—was first advocated in 1879 by Henry George. This value-capture concept is promoted today as split-rate taxation, where land and buildings on the land are taxed at dif-ferent rates. It also reduces the incentives for speculative development on the out-skirts of cities—where improving now-more-expensive land results in relatively modest gains—and to develop instead closer-to-transit nodes and city centers.55
Because split-rate taxation takes development pressure off rural and exurban areas, it should also lower property values—and thus tax rates—in those areas and therefore roughly even out for farmers and other large rural landowners. As an asset-based revenue source, a split-rate tax scheme is also relatively stable and resistant to economic downturns.56
150 Center for American Progress Action Fund | Cities at Work: Progressive Local Policies to Rebuild the Middle Class
For decades, Pennsylvania has been one of the few states that allowed municipalities to introduce a split-rate property tax. Since 1913 more than 20 Pennsylvania municipali-ties have implemented a tax system that charges land at higher rates than property.
In 1989 Pittsburgh, the largest city to employ the strategy, hiked the land tax to six times the property tax rate. Eight years later, a review of the city’s prac-tice concluded that it successfully generated revenues with “no damaging side effects on the urban economy.”57
In 1980 Harrisburg decided to combat its severe economic decline by reducing the tax on buildings to one-half the tax on land. By 2010 most of the more than 5,000 businesses and homes that were previously boarded up were back in use, and the property tax base for the city increased from $212 million to more than $1.6 billion. Seeing these benefits, the city further reduced the effective tax rate on improvements to one-sixth the rate placed on land.58
Progressive use of Special Assessment Districts
Special assessment districts, or SADs, are a value-capture tool commonly used by municipalities to fund basic infrastructure improvements. A special assess-ment, or tax, is levied against parcels of real estate that receive a direct and unique benefit from a public project. The principle behind SADs is that the infrastructure improvement will increase the property value within the district, so it is fair to ask the property owners within the district to pay for a portion of the improvement.
SADs are a standard municipal financing tool, commonly used to fund projects such as curbs and gutters, storm water management systems, and traffic lights. Beyond those applications, special assessment districts have been used to fund modern streetcars in Portland, Oregon and a new infill metro transit station in Washington, D.C.59 While special assessments can cover the entire cost of new investments, they most often cover all or part of the state or local portion of a project.
Most SADs are imposed by the municipality and are compulsory for property owners within the district. But business improvement districts, or BIDs, (see the small business section) and local improvement districts, or LIDs, are voluntary. A LID is comprised of a group of properties adjacent to or near infrastructure and whose owners share all or part of the cost. LIDs assume that if property values for the owners increase due to the investment in the infrastructure, it is in the best interest of the owners to fund the improvements.
151 Center for American Progress Action Fund | Cities at Work: Progressive Local Policies to Rebuild the Middle Class
LIDs have been used to fund portions of major transit improvements such as light rail—Dallas-Ft Worth’s planned Cotton Belt Corridor light rail line, for example60—and streetcar line construction such as Seattle’s South Lake Union Streetcar.
Implementation of a SAD is legal in all 50 states,61 and the mechanism hinges on determining how different properties benefit from capital improvements. Methods to assess benefits to properties within a district include:
• Increased property value: Allocation of improvement costs to the expected increases in the value of the individual properties
• Zones: Allocation of improvement costs based on location within a zone and distance from the actual improvement
• Frontage: Allocation of costs based on the amount of frontage a property has adjacent to an improvement
• Acreage: Allocation of costs based on a property’s acreage within a district• Distance: Allocation based on a factor related to the property’s distance from
the facility62
The SAD financing mechanism was the foundation for Property Assessed Clean Energy, or PACE, financing, a value-capture tool focused on energy-efficiency retrofits and solar-energy projects. The application allowed interested property owners to “opt-in” to a citywide SAD and receive 100 percent upfront financing to cover the cost of the energy installation or building retrofit. The loans would then be repaid as a property tax assessment for up to 20 years —ideally from the energy cost savings achieved as a result of the installation or retrofit.63
Twenty-eight states and the District of Columbia have adopted legislation that enables local governments to offer PACE benefits to building owners. A ruling by the Federal Housing Finance Administration has unfortunately halted this innova-tive and effective approach to residential projects, but there is significant nation-wide advocacy to allow it again.
Pricing and user fees Background
The operation, repair, and construction of city infrastructure systems such as water, storm water, and roads is a significant driver of city budget problems. User-
152 Center for American Progress Action Fund | Cities at Work: Progressive Local Policies to Rebuild the Middle Class
generated revenue sources can help cities bridge funding gaps without raising sales or property tax rates.
User fees for city services are a valuable policy strategy to distribute the cost, or a portion of the cost, of infrastructure operation and maintenance among those who use the system. In addition to generating much-needed revenue for opera-tions and maintenance of particular infrastructure systems, putting a price on city services can help manage finite system capacity, moderating demand with pricing based on peak-use periods.
The progressive approach to pricing and user fees means pricing the right services: That is, pricing goods and services so that service costs are equitably distributed among users and so price signals result in more moderate use. These services include water, road usage, and storm water management. Attaching user fees to these services creates an incentive to conserve water, drive less, and build green. Progressive pricing also includes avoiding regressive fees whenever possible. In cases where low-income households may see an increase in cost as a result of a proposed fee, accommodations should be made.
Implement conservation pricing for water and waste water
As with storm water, pricing for city water service can both encourage conserva-tion and charge more to those who use the system the most. In a conservation water-pricing rate structure, individual customers are metered and pay for the volume of water they use, and the price charged should be sufficient to influence consumers’ decisions about water use and to encourage efficiency. Conservation pricing in water generally assumes a tiered pricing structure, where the water used within the first tier is the least expensive, and subsequent water use is charged at a higher rate or rates.
San Antonio is the poster child for smarter water use in Texas. It has reduced its per capita water usage by 42 percent in the past few decades despite having one of the fastest-growing populations in the country. This reduction is due to large-scale conservation efforts by the local water utility,64 including a tiered water rate structure that doubled the unit price of water for the highest usage tier.
Only half of all national water utilities currently use tiered rates. Many others still reward extra water use, giving large volume buyers a discount—a policy that ends
San Antonio is the
poster child for
smarter water use
in Texas.
153 Center for American Progress Action Fund | Cities at Work: Progressive Local Policies to Rebuild the Middle Class
up imposing disproportionate costs on working families while effectively subsidiz-ing large industrial users.65
Boulder, Colorado, introduced a tiered rate structure in 2007, where the highest tier is charged five times the base rate. It achieved a 16 percent reduction in water consump-tion in the first five months of implementing the structure. Irvine Ranch Water District in California implemented a rate structure comprised of five tiers in 1990, with the top tier—the largest users—paying eight times the base rate charged to consumers who use the typical amount of water for their household. Consumers engaging in extra con-servation activities—using less than a typical household of their size—are rewarded with lower rates subsidized by penalty charges on wasteful users. The utility achieved a 37 percent conservation rate after it implemented this structure.66
While typically driven by conservation goals, implementation of a tiered price structure for water, if done right, also makes water pricing more progressive since lower rates are charged to typical residential users, as well as to households that conserve water. The structuring of the tiers and rates that ensures that typical household water rates do not rise—and ideally, decrease—is particularly impor-tant since low-income households spend a larger percentage of their income on water and therefore are more sensitive to changes in price.
Link storm-water fees to usage
Storm-water user fees are a fair and equitable method for charging the people who benefit from storm-water infrastructure. Such fees generate revenue to address the costs of controlling sewer overflows and storm water runoff. Some of these needs are driven by the demands of growth and development, while many older com-munities need extra revenue simply to repair and maintain aging systems that may have been built 50 or 100 years ago.
The cost of storm-water management was historically paid from general tax funds - such as a property tax - or was included as a line item on monthly water bills. But storm-water user fees are increasingly linked to each property’s impervious surface area to direct the costs for storm-water management toward those properties that generate the most runoff.
In addition to being more equitable, storm-water fees are also easier than taxes for municipalities to set up and implement. In many communities new taxes require
154 Center for American Progress Action Fund | Cities at Work: Progressive Local Policies to Rebuild the Middle Class
a vote of approval by the public, while municipalities have the authority to charge fees for the services they provide to taxable, as well as tax-exempt, properties.
In Washington, D.C., for example, the federal government contributes to 35 percent of the District’s overall impervious surfaces. These properties are exempt from paying city taxes but would be required to pay a fee for storm-water manage-ment services, just as they pay for electricity and water.67
When charging the people that use and benefit from storm-water infrastructure, it is critical that fees be proportionate to runoff creation. Storm-water fees should be structured so that properties with the largest amounts of impervious area—such as commercial and industrial facilities—pay higher fees than residential and other small properties, which generally have less impervious cover.68
When too much of the cost burden is placed on residential customers, storm-water fees can quickly lose traction and support. In Detroit, for example, an increase in residential storm-water fees left many of the city’s low-income families unable to pay their monthly water bill. As a result, many of these residents had their water turned off. This serves as an example of what can happen when the structure of storm-water fees is not carefully considered.
To address the impact of a storm-water fee on low-income customers, cities have developed a variety of assistance programs to help low-income customers pay their storm-water bills. Portland, Oregon, for example, offers bill discounts, crisis vouch-ers that are good for up to $150, and zero-interest loans for qualified customers.69
Philadelphia is the gold standard in storm-water fees. The city implemented its current storm-water fees in 2009 following an overhaul of its water service charge for metered customers. Today, 80 percent of the city’s storm water fee is based on a property’s impervious area, with the remaining 20 percent based upon the property’s gross area. Based on this structure, storm-water fees reach nonmetered customers such as rail lines, parking lots, and utility right-of-ways that account for significant storm-water runoff within the city.
Philadelphia also offers a storm-water fee discount for customers who reduce impervious cover using green infrastructure techniques such as rain gardens, infiltra-tion trenches, porous pavements, vegetated swales, and green roofs. If a property is retrofitted with any of these features, the Water Department will recalculate that property’s storm-water fee based on the 80/20 impervious/gross area formula.70
155 Center for American Progress Action Fund | Cities at Work: Progressive Local Policies to Rebuild the Middle Class
Use impact fees to pay for city services and encourage smart growth
Development impact fees, or DIFs, are one-time charges to private developers to help recoup the costs associated with the extension of public services to new private developments. They are levied to pay for new or expanded facilities or ser-vices necessary to support a new development, including water and sewer systems, roads, libraries, parks and recreation facilities, and schools.71
DIFs typically require cash payments in advance of the completion of develop-ment, are calculated based on the cost of the improvement and the nature and size of the development, and are used to finance improvements offsite for the benefit of the development.
More than half of U.S. states have legislation enabling DIFs, but they are most prevalent in fast-growing states such as California, Texas, and Florida.72 Use of the tool has increased in states that have passed property tax caps that hinder a municipality’s ability to cover the increased demand for services.
DIFs have the advantage of being user fees in anticipation of use, as they require resi-dents and businesses generating a need for new infrastructure to pay for that infra-structure. One disadvantage of impact fees, however, is that they are highly cyclical and can be more adversely affected by economic downturns than other sources of funds. They are strongly tied to the demand for new housing and commercial space.
It is critical for fees to charge for actual impact; for instance, houses in low-density, single-use settings will have a greater impact on roadways and traffic congestion than those in higher-density, mixed-use settings. Factoring in land-use type, size, density, and location can better match the fees assessed to a developer to the costs of associated infrastructure improvements.73
A good DIF structure also creates price signals that encourage smart growth. The city of Kelowna, British Columbia, for example, uses tiered development impact fees to encourage dense development. As the number of housing units per hectare increases from the lowest density of 15 to the highest density of 85, the impact fees per unit decrease significantly.74 The town of Cary, North Carolina, charges a Transportation Development Fee on all newly constructed residential and com-mercial properties, based on location, with lower rates for properties closer to the center of town. Residential properties in the central zone, for example, are charged $439 to $715. Outside the central zone, rates are higher—$762 to $1,243.75
156 Center for American Progress Action Fund | Cities at Work: Progressive Local Policies to Rebuild the Middle Class
Atlanta offers decreased impact fees to developments that locate in close proxim-ity to existing transit infrastructure. Units within 1,000 feet of a rail transit station are given an automatic 50 percent reduction in impact charges.76
Consider transportation utility fees to equitably distribute system costs and reduce car trips
Under the current property-tax-based funding mechanism for transportation infrastructure, residential property owners tend to pay more of the costs of trans-portation than their share of trips justifies while commercial properties pay less.
A transportation utility fee, or TUF, is a financing mechanism whereby a transpor-tation system is treated as a utility and property owners are charged fees in pro-portion to their use, as opposed to being charged based on property value. TUFs are assessed on properties based on the estimated number of trips generated from a property and vary with land use. As is the case with other pricing mechanisms, TUFs connect the cost of maintaining infrastructure more directly with the ben-efits of mobility and access to the system.
TUFs can provide a relatively stable, much-needed source of funds for transporta-tion infrastructure. Fees should be set at a rate related to the estimated costs of pro-viding transportation services over a certain budget cycle, and revenues should help cover operations and maintenance expenses instead of major capital expenses.
In addition to more equitably distributing the costs of the system, TUFs will ideally also send a price signal to change user behavior and reduce trips in a car. This is less likely, however, when the fee is based on predicted rather than actual use and when billing is not immediate.77 The vehicle miles traveled fee, which is described below, is probably better suited than the TUF to directly influence behavior and curb driving. But TUFs should also be used to help fund transporta-tion across modes and help provide funding for pedestrian and bicycle infrastruc-ture for a city.
Transportation utility fees were first created by ordinance in Fort Collins, Colorado, in 1984. They are most common today in Oregon. Hillsboro, Oregon, for example, uses TUFs for street maintenance and reconstruction; in this case, the TUF is a monthly user fee based on the use of the road system by residents, businesses, government agencies, schools, and nonprofits. The money collected
Atlanta offers
decreased
impact fees to
developments
that locate in
close proximity
to existing transit
infrastructure.
157 Center for American Progress Action Fund | Cities at Work: Progressive Local Policies to Rebuild the Middle Class
through this fee allows the city to catch up on its backlog of street maintenance projects, with the goal of having the streets in good repair by 2018. The fee went into effect in March 2009 and appears on the city’s utility bill along with the water, sanitary sewer, and storm water fees.78
Vehicle miles traveled fee
A vehicle miles traveled, or VMT, fee—also known as a mileage-based user fee—is a distance-based tax designed to charge vehicle operators—both personal and commercial—a per-mile fee instead of, or in addition to, the gas tax. The VMT fee goes one step further than the TUF and actually charges drivers for miles traveled.
Changing behavior and transportation choices is key to unclogging the country’s congested highways and reducing dependence on fossil fuels. Moreover, the revenues generated by a VMT fee are critical: With falling motor-fuel tax revenues due to increasingly fuel-efficient vehicles, cities and states need to figure out a dif-ferent revenue structure.
But even beyond revenue generation, a VMT fee makes good sense on many levels, including:79
• Equity: Low-income individuals cannot afford the most fuel-efficient vehicles and generally drive older, gas-guzzling cars. The flat gas tax is thus doubly pun-ishing the poor: They spend a larger percentage of their income on gas, and they cannot afford to buy a car that would use less. Moreover, mileage driven better reflects the wear and tear caused by a car than fuel usage, so charging by the mile more accurately allocates the costs of driving among road users.
• Flexibility: The VMT fee works regardless of the fuel source used by a driver.
• Demand management: VMT charges that vary based on time of day and congestion levels can help to manage traffic during peak periods. By managing this demand, cities achieve additional goals of vehicle emissions reductions and reduced pressure for capacity expansion.
A VMT fee has yet to be implemented in the United States, but many cities and states are studying it and carrying out pilot programs. Based on a pilot conducted in 2006 and 2007, Oregon plans to launch a VMT program in 2012.80 Similar
Changing behavior
and transportation
choices is key
to unclogging
the country’s
congested
highways
and reducing
dependence on
fossil fuels.
158 Center for American Progress Action Fund | Cities at Work: Progressive Local Policies to Rebuild the Middle Class
VMT tests in Seattle, Minneapolis, Washington, D.C., and San Francisco81 show positive results in terms of revenue generation and demand management.82 Internationally, the Netherlands and Denmark plan to transition to a VMT tax to replace the gas tax by 2014 and 2016, respectively.83
While there is fear about perceived privacy issues and technological feasibility associated with VMT fees, there are many ways to implement a VMT system that require less information from drivers. Real-time GPS tracking is on the extreme end of the spectrum, while annual odometer checks to track mileage driven are on the less invasive, less technologically taxing end. There are also many options between the two, and local governments may determine which level of investment and involvement is right for them. Privacy concerns and technological sophistica-tion are certainly not insurmountable obstacles to a VMT fee.84
Establish tolling and value-pricing programs
Flat-price tolls have long been employed to cover the costs of construction and maintenance of highways. Variable tolling, the modern version of this long-standing practice, also raises revenues, but at the same time it manages demand to reduce congestion and the need for costly expansions. Prices are set to align with the value delivered from quicker and more reliable travel times. Variable tolling has the added benefit of generating revenue to cover some portion of the costs of providing the service.
While state departments of transportation manage most highway variable tolling programs, local governments and city transportation agencies have the authority to price the use of roads and parking. Dynamic pricing of these systems is a way to both manage demand and generate revenue.
The San Francisco Municipal Transportation Agency, for instance, is piloting SFpark to manage parking in the city through a dynamic pricing program. SFpark works by collecting and distributing real-time information about where park-ing is available and adjusts the price of the available spaces based on availability. Demand-responsive pricing encourages drivers to park in underused areas and garages, reducing demand in overused areas. It provides a reliable revenue stream and helps manage traffic downtown since more than 15 percent of traffic in a metro area can be people searching for parking spaces.85
159 Center for American Progress Action Fund | Cities at Work: Progressive Local Policies to Rebuild the Middle Class
While cordon charges—variable or fixed charges to drive within or into a congested area—are not yet in use in the United States, other cities such as London, Singapore, and Stockholm all rely on them to ease traffic congestion in their central business areas. London launched its congestion charge in 2003. Vehicles driven in central London between 7 a.m. and 6 p.m. pay a fee of £10. This tolling strategy, even if only carried out for single-occupancy vehicle travel, is a very clear way to both generate revenues and encourage the use of transportation alternatives.
Leveraging private capital Background
One of the few items of consensus in American politics is that almost all of our physical infrastructure—understood as shared areawide assets that provide essential services such as energy, water, transportation, and waste management to a common standard—is in a state of disrepair, requiring substantial new investment totaling as much as $2.2 trillion by some estimates86 to bring it to international standards, and that doing so would create jobs, as well as strengthen America’s competitive posi-tion. This consensus ends immediately when we consider what sorts of infrastruc-ture should be built, who should oversee it, and how it might be paid for.
Leveraging private capital means shifting the upfront cost of infrastructure investments to a long-term repayment structure not unlike bond-debt service but accompanied by higher interest rates and often an ownership stake or operational role for private firms. Investment banks are becoming more and more interested in revenue-generating infrastructure—such as toll roads, water and sewer systems, landfills, and public parking facilities—as a stable asset class that generally acts countercyclically to economic highs and lows.
Simultaneously, cities, lacking the funds or the political will to raise the funds to pay for much of this infrastructure on their own, are more interested in private financing than ever before. This does not, however, mean that using private capital to build and repair infrastructure is a good idea either in general or in any specific instance. Thus, before discussing the ins and outs of leveraging private capital for infrastructure, we offer two important caveats:
Public money for public goods. In a perfect world, infrastructure construction and upgrades would be paid for by tax revenues. Modern infrastructure is irre-
160 Center for American Progress Action Fund | Cities at Work: Progressive Local Policies to Rebuild the Middle Class
futably a public good, providing services to citizenry for decades to come, and should ideally be paid for by public funds through the economic benefits that it helps to produce. Tax-exempt bond financing is a financing tool unique to the United States that allows state and local governments to borrow at lower rates than private entities. While this section focuses on leveraging private capital, cities that have the means to do so would generally be better off financing infrastructure improvements themselves via tax-exempt bonds and other traditional financing mechanisms than relying on investment banks to directly finance the projects on their terms. Cities are also well-advised to look to other public and quasi-public alternative sources of capital such as public pension funds (see discussion in the economic development chapter). America is not a developing country—there are sufficient resources to pay for the infrastructure improvements needed.
Wise decisions about what and how to build. In a perfect world, infrastructure improvements would happen when genuinely needed and would contribute to the “high road” (equitable, sustainable, and accountable). Unnecessary infrastruc-ture—such as bridges to nowhere, eight-lane highways through wilderness areas, and various expensive, questionable projects—often result from political argu-ments for pork-barrel spending. We need to build and rebuild better infrastruc-ture, not bigger or more—where “better” means not just efficiency or economy, but also better for the community, more jobs, more equitable outcomes, more healthy or less harmful, and environmentally beneficial.
Unfortunately, we do not live in a perfect world. Cities are hamstrung by federal and state tax codes, and also are reeling from an economic recession. And pork-barrel spending will not be eliminated anytime soon. Private capital, therefore, is likely to be part of the solution for paying for needed infrastructure improvements.
So the question facing cities and towns today is not so much whether to rely on private financing, but rather how best to integrate private financing into their operations and manage relationships with private firms to protect the public inter-est and obtain the best deals possible.
Judicious use of public-private partnerships, or P3s
A public-private partnership, or P3, is an arrangement where a government and a for-profit or nonprofit private entity jointly perform or undertake a traditional public activity. A P3 involves a complex contractual relationship, often including
America is not
a developing
country—there are
sufficient resources
to pay for the
infrastructure
improvements
needed.
161 Center for American Progress Action Fund | Cities at Work: Progressive Local Policies to Rebuild the Middle Class
a consortium of private firms, to deliver capital-intensive public infrastructure such as highways, airports, public buildings, or water systems, or to undertake a civic-redevelopment project.87 A P3 can take many different forms, but it generally means that a private partner or partners are involved in the design, construction, financing, operation, and/or maintenance of a public facility.
Leveraging private investment via public-private partnerships can lighten the upfront financial burden of infrastructure investment for local governments, accelerate construction, capitalize on specialized expertise and/or state-of-the-art technology, and shift risk to a private party. P3s should not be confused with privatization, where a public facility or project is sold outright to a private entity.
The United States had 377 funded P3 projects between 1985 and 2010, with a total value in excess of $68.4 billion.88 Twenty-eight states have P3-enabling legislation on their books, but this legislation varies widely as far as specificity and extent.89
While widely accepted internationally, public-private partnerships and private financing of public projects have a—not entirely unearned—shadowy reputation in the United States, fueled primarily by a few notorious transactions, including Chicago’s leasing of its parking garages and parking meters. Those deals included upfront payments in return for the right to operate, maintain, and collect revenues from the facilities. Neither has been considered a smart deal for the city due mainly to the paltry size of the payment compared to the ongoing revenues and the onerous contractual obligations for the city.
Beyond such anecdotes, concerns about P3s can be bucketed into three categories:
1. Fear of losing control over a system that has historically been a public good2. Risk of increased costs to users and taxpayers rather than the speculated sav-
ings and efficiencies3. An erosion of democratic and “high-road” values as profit motives become the
first priority
International experience is instructive because private investment in public infra-structure is widely practiced around the world. But it is difficult to point to defini-tive “wins” in privately financed and privately managed infrastructure since the transactions and relationships are long term, and a substantial upfront payment may or may not be fair compensation for the decisions, performance, construc-tion, and, potentially, defaults that happen decades down the road.
162 Center for American Progress Action Fund | Cities at Work: Progressive Local Policies to Rebuild the Middle Class
The idea behind a long-term contractual relationship is to align incentives and produce more efficient and functional projects. But it also raises social equity, management, and structuring issues that may negate any cost-saving benefits.
Long-term maintenance costs may be lower if the same firm builds the project and has to maintain it for 30 or 40 years, creating savings that attract investors. The profit motive can also create an incentive to avoid cost overruns if inves-tors bear the risk. But without proper oversight, a singular focus on savings can also fuel a race to the bottom, where the private firm cuts costs by relying on low wages, refusal of health insurance and paid time off, and/or low-road procurement options, often without the local government’s knowledge.90
Despite the caveats and warnings, leveraging private capital through public-private partnerships may be one of very few viable options for many cities to finance upgrades of their deteriorating public infrastructure. More to the point, it is a route that an increasing number of municipalities are pursuing, and therefore the focus of any policy effort should be on ensuring that local governments considering P3s pursue the best practices in the area. Those best practices include the following.
Designating a dedicated P3 team
One challenge with P3s is that local governments typically lack the expertise needed to structure and design private financing for infrastructure, and local lead-ers hesitate to enlist public support for such projects on democratically account-able terms. If a city is to undertake a P3 transaction, then it should have access to a dedicated P3 team or at least specialized technical capacity to protect the public interest and to tackle bottlenecks in the transaction process. While only a handful of cities have sufficient capacity or volume of transactions to sustain such a team, the expertise is critical and may be accessed at the state or regional level.
The P3 team will provide technical expertise, coordinate policy and standardiza-tion, carry out quality assurance, and ensure that the social benefit, as well as the financial performance, of the project is achieved.91 Contract development is one of the most important phases of a P3, and local governments need a competent, experienced team representing the public interest. Once a contract is executed, oversight and monitoring are required, both during construction and operations, to ensure that standards are being met and milestones are reached.
163 Center for American Progress Action Fund | Cities at Work: Progressive Local Policies to Rebuild the Middle Class
Extensive project screening
Local governments should conduct extensive screening to identify projects that may have potential schedule and cost efficiencies through the use of P3 delivery and/or financing methods. One example of thoughtful screening is the Public-Private Partnership Project Screening and Assessment conducted by Parsons Brinckerhoff for the Minnesota Department of Transportation in 2010.92 This state-focused project, which is also applicable to local governments, ranked P3 candidate projects on the following criteria: project size and complexity, critical-ity, revenue potential, implementation timeframe, and environmental timeframe. Use of cost-benefit analyses to decide whether to set up a P3
Once candidates have been identified, quantitative and qualitative cost-benefit analyses must be conducted to compare the full lifecycle costs of a P3 structure against traditional public management or financing options. The United Kingdom; Victoria, Australia; and British Columbia, Canada, as well as states such as Florida and Alaska, have widely used Value for Money, or VfM, as a tool to assess P3s.93 VfM tests are useful because they not only examine the financial value of a project, but also consider hard-to-quantify factors crucial to determining risk transfer. In British Columbia, examining projects through a VfM lens has led to many projects being delivered via traditional public procurements rather than by P3s because the private approach did not yield enough value for money.94
Competitive bidding and smart deal structure
Once a local government decides to proceed with a P3, it must make important choices about procurement types. Projects should be awarded in competitive auctions, not bilateral negotiations, because the transparency and efficiency of competitive auctions increases the chances of a reasonable outcome and structure for the public partner. The bidding process should also be broadened through strategies such as Best-Value Contracting95 (see section on job quality) so that cit-ies can choose private partners based on criteria beyond just the cost. Cities must also structure their contracts to avoid mid-contract renegotiations, which undo the advantages of a competitive auction and are always costly for the public partner.96
Claims to exclusivity for privately operated infrastructure are a regular and contro-versial aspect of public-private partnerships, and should be approached with cau-tion.97 While noncompete clauses may be integral to securing a deal, they have the potential to conflict with other public policy goals. As a 2004 GAO report found, four of the five privately funded toll-road projects in the past 15 years included
164 Center for American Progress Action Fund | Cities at Work: Progressive Local Policies to Rebuild the Middle Class
noncompete clauses that prevented the government from building nearby roads.98 In the case of transportation systems, alternative transportation options such as rail, bike, and pedestrian and transit systems should not be sacrificed in order for a private firm to manage a toll road.
Employing a lifecycle approach to costing
Cities should consider adopting a lifecycle approach to P3 that gives adequate attention to all phases of a P3—from planning and policy to transaction to man-agement of the agreement. Such an approach can help avoid problems caused by poor setup, lack of clarity about outcomes, inadequate internal capacity, and too narrow a focus on the transaction.99
In sum, P3s are best suited for complex, large-scale, long-term, expensive proj-ects that have the capacity for some allocation of risk to the private sector. Transportation projects are the most common P3 candidates, but P3s have also been used for school construction, building retrofits, and hospitals. P3s are neither the sole answer to the country’s infrastructure woes, nor are they a free lunch. They can be marked by unrealistic expectations, opaque decision-making processes, and unfair deal structures. This is why governments should use P3s judiciously, aligning incentives for social value and efficiency, so that a private investor is remunerated proportionally to the riskiness of the investment, and the government partner receives improved public infrastructure, needed services, and/or sufficient income and tax revenue generated by the project.
Establishment of infrastructure-financing facilities
An infrastructure-financing facility is a nonprofit entity designed to encourage private investment in particular infrastructure projects. The investment is repaid not by taxes, but instead by cost savings and revenues associated with the invest-ments, which include fees and tolls. Banks can invest in particular projects via the facility and also—though this depends on the structure of the particular transac-tion—take on the risk associated with cost overruns, shielding a city from unan-ticipated budget increases as project construction wears on. A financing facility is an alternative or supplement to traditional bonding and federal grant funding that facilitates private investment in public infrastructure. It is a particularly appealing option for cities that may have trouble bonding for political or budgetary reasons or that cannot access sufficient funds through bonding or federal grants.
165 Center for American Progress Action Fund | Cities at Work: Progressive Local Policies to Rebuild the Middle Class
Chicago is in the process of establishing an Infrastructure Trust, which is intended to promote job creation and fuel economic growth by attracting private investment in the city’s dilapidated infrastructure. The projects financed by the trust will be publicly owned, and the debt from the trust will be repaid with savings and revenues achieved through the investment. The banks backing the trust—JPMorgan, Citibank, Citi Infrastructure Investors, Macquarie, and Union Life Insurance—would invest $1.7 billion for a variety of infrastructure projects approved by the trust’s mayor-appointed board.100 The trust’s first project involves $225 million of energy-efficiency measures to 100 public buildings, repaid by the estimated $20 million a year in utility cost sav-ings. It is expected to generate as many as 2,000 construction jobs.101
Concerns about the trust have been raised due to Chicago’s negative experiences with public-private partnerships—specifically, the parking garage and parking-meter leases described above—and suspicions about the mayor-appointed board. Critics fear that the trust’s priorities will not reflect the city’s most pressing needs and that the city will lose its shirt in the deals; both are legitimate concerns. Chicago’s Infrastructure Trust is the first of its kind in the United States and has not yet begun operation. So it remains to be seen how effectively the city can leverage private capital for the public benefit.
Despite these concerns, Chicago, with a budget deficit of $600 million, is pursu-ing the Infrastructure Trust because of a lack of funding options. Moreover, this financing challenge is clearly replicated in cities across the country and mayors from San Diego; Louisville, Kentucky; New Orleans; Philadelphia; Kansas City, Missouri; Denver; Atlanta; Portland, Oregon, and elsewhere are actively tracking the Infrastructure Trust’s progress and considering it as a model for their own cit-ies.102 Time will tell whether the model is worth replicating or not.
Social Impact Bonds
New York City is experimenting with an innovative financing mechanism known as Social Impact Bonds, or SIBs, for its Adolescent Behavioral Learning Experience, a program that uses cognitive behavioral therapy to help reduce the reincarceration rate for juveniles at Rikers Island jail. The concept is simple: Private entities invest upfront money in prevention programs and are paid back by the public entity—in this case the city—based on the success of that program, thereby transferring the risk to the private sector. In this case, Goldman Sachs is fronting $9.6 million for this pay-for-success program. If reincarceration rates drop
Despite these
concerns, Chicago,
with a budget
deficit of $600
million, is pursuing
the Infrastructure
Trust because of
a lack of funding
options.
166 Center for American Progress Action Fund | Cities at Work: Progressive Local Policies to Rebuild the Middle Class
by 10 percent, then the city will pay Goldman back all of the money it invested. If they fall by an even greater margin, the city will pay Goldman a bonus. If they do not reach the 10 percent goal, then Goldman will not be repaid.103
Previously, Massachusetts and the United Kingdom experimented with social impact bonds, but New York City will be the first municipality to try them.104
As is the case with Chicago’s Infrastructure Trust, SIBs are too new to ascertain whether they will be available or reliable for local governments. But many munici-palities are watching them closely.
167 Center for American Progress Action Fund | Cities at Work: Progressive Local Policies to Rebuild the Middle Class
Endnotes
1 Lisa Lambert, “Despite Recovery, US Public Employees Face More Layoffs,” Reuters, April 8, 2012, available at http://www.reuters.com/article/2012/04/08/usa-states-employees-idUSL2E8F39HE20120408; The Pew Charitable Trusts, “The Local Squeeze: Falling Revenues and Growing Demand for Services Challenge Cities, Counties, and Schooling Districts” (2012), available at http://www.pewstates.org/uploadedFiles/PCS_As-sets/2012/Pew_Cities_Local%20Squeeze_report.pdf.
2 It should be noted that local tax policy is an area more heavily circumscribed by federal and, especially, state law than many, so many of the approaches recom-mended below are subject to state authorization and may not be options in a given locality depending on the vagaries of state tax law in that state.
3 Some state and local governments use a gross receipts tax, or GRT, rather than sales tax. The main difference between GRT and traditional sales tax is that GRT applies to the sales made by companies at every stage of the production process, including manufacturing companies, wholesalers, and retailers, while sales taxes apply only to retail sales —in theory, anyway. In general, though, a GRT is not a one-for-one replace-ment for a sales tax, it suffers from the same problem of regressivity and should be treated by cities in the same way: minimized to the extent possible, reformed to make it broad-based, and with exemptions carved out for necessities for low-income families.
4 Currently, 47 states have some form of limit on prop-erty tax assessment, including limits on the maximum rate of growth for total revenue or spending, caps on total property tax collections, limits on the rate at which properties are taxed, and caps on the share of property considered taxable. David McSwane, “City of Sarasota will raise property tax rates,” Herald-Tribune, September 20, 2011, available at http://www.heraldtri-bune.com/article/20110920/article/110919541; Lincoln Institute of Land Policy, “Significant Features of the Property Tax” (2010), available at http://www.lincoln-inst.edu/subcenters/significant-features-property-tax/Report_Tax_Limits.aspx.
5 A study by the Institute on Taxation and Economic Policy found that in 2002 low-income families paid an average of 3 percent of their income in property taxes and middle-income families paid 2.4 percent, while the richest taxpayers paid only 0.8 percent. Institute on Taxation and Economic Policy, “ITEP Guide to Fair State and Local Taxes” (2005), available at http://www.itep.org/pdf/guide4.pdf.
6 A number of other states and localities offer property tax rebates or credits to taxpayers who have low incomes and pay property taxes. These programs are often described as circuit breakers and sometimes even have “circuit breaker” in their name but differ from true circuit breakers in that the value of the credit or rebate is based on a family’s income rather than the share of the family’s income that goes toward property tax.
7 For details on the variation among circuit breaker models, see: Karen Lyons, Sarah Farkas, and Nicholas Johnson, “The Property Tax Circuit Breaker: An Intro-duction and Survey of Current Programs” (Washington: Center on Budget and Policy Priorities, 2007), available at http://www.cbpp.org/files/3-21-07sfp.pdf;John H. Bowman and others, “Property Tax Circuit Breakers” (Cambridge, MA: Lincoln Institute of Land Policy, 2009), available at http://www.lincolninst.edu/pubs/1569_
Property-Tax-Circuit-Breakers; Many localities such as Boston limit circuit breaker eligibility to senior citizens. The policy rationale for such a limit is exceedingly tenu-ous, since younger working families are equally in need tax relief. Cities should generally aim for the broadest possible application: younger residents as well as seniors—both able and disabled—renters in addition to owners, and middle-income residents, as well as the very poor. City of Boston, “Circuit Breaker Income Tax Credit,” available at http://www.cityofboston.gov/as-sessing/mod_inc_sen.asp (last accessed October 2012).
8 New Mexico Taxation and Revenue Department, “Property Tax Rebates,” available at http://www.tax.newmexico.gov/Tax-Library/For-Governments/Munic-ipal-and-County-Governments/Pages/Property-Tax-Rebates.aspx (last accessed October 2012); New Mexico Taxation and Revenue Department, “New Mexico Rebate and Credit Schedule,” available at http://www.tax.newmexico.gov/SiteCollectionDocuments/2009pit-rc-fr.pdf (last accessed October 2012).
9 Nicole Dube, “Local Option Property Tax Relief for Seniors” (Hartford, CT: OLR Research Report, 2012), available at http://www.cga.ct.gov/2012/rpt/2012-R-0222.htm; State of Connecticut Office of Policy and Management, “Questions and Answer Booklet for the Homeowners’, Freeze, Totally Disabled, and Additional Veterans’ Tax Relief Programs” (2012), available at http://www.ct.gov/opm/lib/opm/igp/grants/taxrel/own-ers2012.pdf.
10 The City of Norwalk Connecticut, “Tax Credit Program,” available at http://www.norwalkct.org/DocumentCen-ter/Home/View/1337 (last accessed October 2012).
11 While payments by other units of government—states, counties, federal government, school districts, among others—may not be strictly PILOTs, we will use this term for all payments worked out with tax-exempt property owners as a substitute for local property taxes.
12 Daphne A. Kenyon and Adam H. Langley, “Payments in Lieu of Taxes: Balancing Municipal and Nonprofit Interests” (Cambridge, MA: Lincoln Institute of Land Policy, 2010), available at http://www.lincolninst.edu/pubs/1853_Payments-in-Lieu-of-Taxes.
13 Ibid.
14 Some 35 states provide for local sales and use tax. For the purposes of this section, sales, use, and excise taxes—which apply sales tax to different categories of goods and services—will all be grouped together and referred to generically as “sales taxes.” Many local sales taxes are in the form of “local option taxes,” which are often sharply limited by the state—for example, to a local surcharge of no more than 1 percent—and sometimes require a passing vote by the general public before implementation. Tax Foundation, “State and Local Sales Tax Rates, 2011-2013,” available at http://taxfoundation.org/article/state-and-local-sales-tax-rates-january-1-2012 (last accessed July 2013).
15 Quill Corp. v. North Dakota 504 U.S. 298 (1992).
16 “Streamlined Sales Tax Governing Board, Inc.,” available at http://www.streamlinedsalestax.org/ (last accessed October 2012).
17 Most national chains cut a deal with the states in which they were forgiven all of their back taxes in exchange
168 Center for American Progress Action Fund | Cities at Work: Progressive Local Policies to Rebuild the Middle Class
for collecting sales taxes online from that point for-ward. Although most national chains now collect sales taxes on online orders, there remain a few that do not.
18 Now imitated by a number of other states, the law has survived an initial legal challenge but is currently on appeal. Michael Mazerov, “New York’s ‘Amazon Law’: An Important Tool for Collecting Taxes Owed on Internet Purchases” (Washington: Center on Budget and Policy Priorities, 2009), available at http://www.cbpp.org/cms/index.cfm?fa=view&id=2876#_ftnref16.
19 For more information on the Texas sales and use tax, see: Susan Combs, “Grocery and Convenience Stores: Taxable and Nontaxable Sales” (Austin: Texas Comptrol-ler of Public Accounts, 2007), available at http://www.window.state.tx.us/taxinfo/taxpubs/tx96_280.pdf.
20 New York State Department of Taxation and Finance, “Sales and Use Tax Rates on Clothing and Footwear” (2013), available at http://www.tax.ny.gov/pdf/publica-tions/sales/pub718c.pdf.
21 South Carolina Department of Revenue, “Local Sales and Use Tax” (2013), available at http://www.sctax.org/NR/rdonlyres/93D29205-3B43-4711-9F35-D191AF72978E/0/Chapter12LocalSalesandUseTaxes.pdf.
22 In 2011 Kansans with incomes up to $35,400 were eligible for the credit. Kansas Department of Revenue, “Frequently Asked Questions About Food Sales,” avail-able at http://www.ksrevenue.org/faqs-taxfoodsales.html (last accessed October 2012).
23 Montana Department of Transportation, “Resort and Local Option Taxes,” available at http://www.mdt.mt.gov/research/toolkit/m1/ftools/fd/rlot.shtml (last accessed October 2012).
24 Gas tax falls outside the scope of this discussion because it is implemented exclusively at the state level and it is different enough due both to its frequent statutory dedication to transportation expenses and linkage to the highly-volatile price of oil. State Smart Transportation Initiative and Smart Growth America, “The Innovative DOT: A Handbook of Policy and Prac-tice” (2012) available at http://www.smartgrowthameri-ca.org/documents/the-innovative-dot.pdf.
25 Rob Goszkowski, “Among Americans, Smoking Decreases as Income Increases,” Gallup, March 21, 2008, available at http://www.gallup.com/poll/105550/Among-Americans-Smoking-Decreases-Income-Increases.aspx.
26 For another example, see Christopher Carpenter and Philip J. Cook, “Cigarette Taxes and Youth Smoking: New Evidence from National, State, and Local Youth Risk Behavior Surveys” Journal of Health Economics 27 (2) (2008): 287-299, available at http://www.nber.org/papers/w13046; Frank J. Chaloupka, “How Effective are Taxes in Reducing Tobacco Consumption?” (Chicago: National Bureau of Economic Research, 1998),available at http://tigger.uic.edu/~fjc/Presentations/Papers/taxes_consump_rev.pdf; Kelly D. Brownell and others, “The Public Health and Economic Benefits of Taxing Sugar-Sweetened Beverages” New England Journal of Medicine 361 (1) (2009): 1599-1605, available at http://www.nejm.org/doi/full/10.1056/NEJMhpr0905723.
27 City of Chicago Office of Planning and Policy, “Can Taxes on Sugar-Sweetened Beverages Reduce Obesity?” (2012), available at http://www.cityofchicago.org/dam/city/depts/cdph/policy_planning/PP_SodaTax.pdf.
28 Joseph Henchman and Jason Sapia, “Local Income Taxes: City- and County-Level Income and Wage Taxes
Continue to Wane,” Tax Foundation, August 31, 2011, available at http://taxfoundation.org/article/local-income-taxes-city-and-county-level-income-and-wage-taxes-continue-wane.
29 New York State Department of Taxation and Finance, “2009 personal income tax forms,” available at http://www.tax.ny.gov/forms/prvforms/income_tax_2009.htm (last accessed July 2013).
30 Tim Craig, “D.C. Council agrees to raise taxes on city’s wealthiest residents,” The Washington Post, September 11, 2011, available at http://www.washingtonpost.com/local/dc-politics/dc-council-agrees-to-raise-taxes-on-citys-wealthiest-residents/2011/09/20/gIQAHKVQjK_story.html.
31 New York State Department of Taxation and Finance, “New York City Credits,” available at http://www.tax.ny.gov/pit/credits/new_york_city_credits.htm#nyc%20household (last accessed May 2012).
32 Robert Greenstein, “Government Programs Kept Mil-lions Out of Poverty” (Washington: Center on Budget and Policy Priorities, 2011), available at http://www.offthechartsblog.org/government-programs-kept-millions-out-of-poverty-in-2010/.
33 City and County of San Francisco, “Working Families Credit,” available at http://www.workingfamiliescredit.org/ (last accessed October 2012).
34 Office of Temporary and Disability Assistance, “Earned Income Tax Credits,” available at http://otda.ny.gov/pro-grams/tax-credits/#eitc (last accessed October 2012).
35 Montgomery County Government, Maryland, “Earned Income Credit EIC Refund,” available at http://www3.montgomerycountymd.gov/311/%28X%281%29S%28cia3oh45ge5rgnaomo5ork3u%29%29/Solutions.aspx?SolutionId=1-NXOMQ (last accessed October 2012).
36 Montgomery County Government, Maryland, “Mont-gomery County Refundable Earned Income Credit,” available at http://www6.montgomerycountymd.gov/mcgtmpl.asp?url=/content/finance/CountyTaxes/Info-Taxes/reviews.ASP #refund (last accessed July 2009).
37 Alan Berube and Clare Winterton, “San Francisco Deliv-ers a Local Earned Income Tax Credit,” The Brookings Institution, June 26, 2006, available at http://www.brookings.edu/research/opinions/2006/06/26childrenfamilies-berube.
38 Amanda Fernandez, “Earn it, Keep it, Save it: A Guide to a Successful Tax Credit Campaign in Your Community” (Baltimore: The National Tax Assistance for Working Families Campaign, 2012), available at http://www.aecf.org/upload/publicationfiles/earn%20it.pdf.
39 Colorado General Assembly, “Colorado SB 08-177: Human Services – Social Services” (2008), available at http://www.state.co.us/gov_dir/leg_dir/olls/sl2008a/sl_396.htm; Colorado General Assembly, “Colorado SB 11-124: Human Services – Social Services” (2011), avail-able at http://www.state.co.us/gov_dir/leg_dir/olls/sl2011a/sl_183.htm.
40 The Tax Foundation provides a list of states that allow local income and wage taxes. Henchman and Sapia, “Local Income Taxes: City- and County-Level Income and Wage Taxes Continue to Wane.”
41 City of Portland Office of Management and Finance, “About the Taxes,” available at http://www.portland-online.com/omf/index.cfm?c=32043&a=216081 (last accessed October 2012).
169 Center for American Progress Action Fund | Cities at Work: Progressive Local Policies to Rebuild the Middle Class
42 Financial and legal considerations will determine whether a lease or a sale of air rights will be necessary to make a transaction happen. Some mortgage lenders have required an outright sale of property in order to finance new developments, as happened in Kew Gardens in Long Island, New York.
43 American Planning Association, “Air Rights” (1964), available at http://www.planning.org/pas/at60/re-port186.htm.
44 Louis Dreyfus Property Group, “Project I-395 Air Rights Development” (2009), available at http://pgp.us.com/pdf/395_air_rights_property.pdf.
45 Center for Transportation Studies, “Value Capture for Transportation Finance” (2009), available at http://www.cts.umn.edu/Publications/ResearchReports/pdfdown-load.pl?id=1160.
46 American Planning Association, “Air Rights.”
47 Center for Transportation Studies, “Value Capture for Transportation Finance.”
48 Federal Transit Administration Transit Cooperative Research Program, “Transit Oriented Development and Transit Joint Development: A Literature Review” (2002), available at http://onlinepubs.trb.org/onlinepubs/tcrp/tcrp_rrd_52.pdf.
49 Ibid.
50 Council of Development Finance Agencies, “Tax Incre-ment Finance: Best Practices Reference Guide” (2007), available at http://www.cdfa.net/cdfa/cdfaweb.nsf/ordredirect.html?open&id=TIFGuide.html.
51 A study by economists Richard F. Dye and David F. Mer-riman in 2000 found that cities in northeastern Illinois adopting TIF actually reduced their economic growth rates, as faster growth within a TIF district was offset by slower growth outside the district. http://www.riversideinfo.org/wp-content/uploads/tif-districts-hinder-growth.pdf.
52 Kenneth P. Thomas, “A Primer on TIF: What it is, Why It’s Controversial” (St. Louis: University of Missouri-St Louis, 2006), available at http://missouri.sierraclub.org/emg/committees/tsm/tifprimer.pdf.
53 In the taxation system most commonly used in the United States, improvements to a parcel are taxed at a higher rate than the land itself, providing a disincentive for owners to develop parcels because their property taxes will increase.
54 Mark Bergen, “Money Grab: How Can Cities Recapture Investment in Public Infrastructure?” The Next American City, August 12, 2012, available at http://americancity.org/forefront/view/money-grab.
55 Rick Rybeck, “Using Value Capture to Finance Infrastruc-ture and Encourage Compact Development” Public Works Management & Policy 8 (4) (2004): 249-260, avail-able at https://www.mwcog.org/uploads/committee-documents/k15fVl1f20080424150651.pdf.
56 Center for Transportation Studies, “Value Capture for Transportation Finance.”
57 Bergen, “Money Grab.”
58 Walter Rybeck, “Retooling Property Taxes,” PM Magazine 92 (2) (2010), available at http://webapps.icma.org/pm/9202/public/cover.cfm?author=walter%20rybeck&title=retooling%20property%20taxes.
59 Center for Excellence in Project Finance, “New York Avenue-Florida Avenue-Galludet University Metro Station: A Case Study” (2006), available at http://www.transportation-finance.org/pdf/funding_financing/funding/local_funding/New_York_Avenue_Case_Study.pdf.
60 North Central Texas Council of Governments, “Innova-tive Finance Initiative: Cotton Belt Corridor” (2011), available at http://www.gatewayplanning.com/PDFS/Cotton_Belt_phase_1%20final_rpt_Dec_2011_re-duced.pdf; Smart State Transportation Initiative and Smart Growth America, “The Innovative DOT.”
61 AASHTO and Department of Transpiration, “Special Assessment Districts,” available at http://www.transportation-finance.org/funding_financing/funding/local_funding/value_capture/special_assessment_dis-tricts.aspx (last accessed January 2013).
62 Center for Transportation Studies, “Value Capture for Transportation Finance.”
63 “PACE Now,” available at http://www.pacenow.org (last accessed July 2013).
64 “San Antonio Water System,” available at http://www.saws.org/ (last accessed October 2012).
65 “American Water Works Association,” available at http://www.awwa.org/ (last accessed October 2012).
66 Equinox Center, “A Primer on Water Pricing in the San Diego region” (2009), available at http://www.equinox-center.org/assets/files/pdf/Equinox%20Water_Pric-ing_Brief%20102609.pdf.
67 Environmental Protection Agency, “Managing Wet Weather with Green Infrastructure: Municipal Hand-book” (2008), available at http://www.mayorsinnova-tion.org/pdf/11gi_munichandbook_funding.pdf.
68 Ibid.
69 Ibid.
70 Ibid.
71 For more information, see the section on Parks in the Infrastructure chapter.
72 Smart State Transportation Initiative and Smart Growth America, “The Innovative DOT.”
73 American Planning Association, “Policy Guide on Impact Fees” (1997), available at http://www.planning.org/policy/guides/adopted/impactfees.htm.
74 Center for Transportation Studies, “Value Capture for Transportation Finance.”
75 Town of Cary, “Fees Estimation Guide for Residential and Commercial Construction Projects” available at http://www.townofcary.org/Assets/Inspections+$!26+Permits+Department/Inspections+and+Permits+Department+PDFs/Fee+Estimation+Guide+7-13.pdf.
76 Center for Transportation Studies, “Value Capture for Transportation Finance.”
77 Jason R. Junge and David Levinson, “Prospects for transportation utility fees” The Journal of Transportation and Land Use 5 (1) (2012): 33-47, available at https://www.jtlu.org/index.php/jtlu/article/view/141.
78 Hillsboro Oregon, “Transportation Utility Fee: Overview,” available at http://www.ci.hillsboro.or.us/TUF/Default.aspx (last accessed October 2012).
170 Center for American Progress Action Fund | Cities at Work: Progressive Local Policies to Rebuild the Middle Class
79 University of Minnesota, “Report of Minnesota’s Mile-age-Based User Fee Policy Task Force” (2011), available at http://www.dot.state.mn.us/mileagebaseduserfee/pdf/mbufpolicytaskforcereport.pdf.
80 “ODOT to launch VMT pilot program in the fall,” Port-land Transport, June 9, 2012, available at http://port-landtransport.com/archives/2012/06/odot_to_launch.html.
81 Eric Jaffe, “Is a VMT Tax a Good Idea?”, The Atlantic Cities, August 24, 2012, available at http://www.theatlanticci-ties.com/commute/2012/08/vmt-tax-good-idea/3062/.
82 Letter from John Chalker, Gail Achterman, and Dan O’Neal to Sen. Maria Cantwell, January 16, 2009, avail-able at http://www.tollroadsnews.com/sites/default/files/WestOnVMT.pdf.
83 “A road map to better US roads,” Christian Science Moni-tor, February 27, 2009, available at http://www.csmoni-tor.com/Commentary/the-monitors-view/2009/0227/p08s01-comv.html.
84 Ben Pierce, “A Discussion of Road User Fees” (Washing-ton: Battelle, 2011), available at http://www.taxadmin.org/fta/meet/11_mf/pres/Pierce.pdf.
85 San Francisco Municipal Transportation Agency, “SF-park,” available at http://sfpark.org/about-the-project/ (last accessed July 2013).
86 American Society of Civil Engineers, “Report Card for America’s Infrastructure” (2009), available at http://www.infrastructurereportcard.org/.
87 E.S. Savas, Privatization and public-private partnerships (London: Chatham House Publishers, 2000).
88 Public Works Financing, “2011 Survey of Public-Private Partnerships Worldwide” (2011), available at http://www.pwfinance.net/document/October_2011_vNov202011.pdf.
89 Missouri’s legislation, for example, was enacted with respect to a specific bridge project in St. Louis, and any other P3 needed special legislation to proceed.
90 Philip Mattera, “Your Tax Dollars at Work…Offshore: How Foreign Outsourcing Firms Are Capturing State Government Contracts” (Washington: Good Jobs First, 2004), available at http://www.goodjobsfirst.org/sites/default/files/docs/pdf/offshoringtext.pdf; SweatFree Communities, “Subsidizing Sweatshops,” available at http://www.sweatfree.org/subsidizing1 (last accessed July 2013).
91 Emilia Istrate and Robert Puentes, “Moving Forward on Public Private Partnerships: U.S. and International Experience with PPP Units” (Washington: Brookings Institution, 2011), available at http://www.brookings.edu/~/media/research/files/papers/2011/12/08%20transportation%20istrate%20puentes/1208_transpor-tation_istrate_puentes.pdf.
92 Zhirong (Jerry) Zhao, “Advancing Public interest in Public-Private Partnership of State Highway Devel-opment” (St. Paul, MN: Minnesota Department of Transportation, 2011), available at http://www.lrrb.org/media/reports/201109.pdf.
93 Ibid.
94 Ibid.
95 For more information on Best-Value Contracting, see the section on contracting and procurement standards in the jobs chapter.
96 Eduardo Engel, Ronald Fischer, and Alexander Galetovic, “Public-Private Partnerships to Revamp U.S. Infrastructure” (Washington: Brookings Institute, 2011), available at http://www.brookings.edu/~/media/re-search/files/papers/2011/2/partnerships%20engel%20fischer%20galetovic/02_partnerships_engel_fischer_galetovic_paper.pdf.
97 Brad Plumer, “More states are privatizing their infra-structure. Are they making a mistake?”, The Washington Post Wonkblog, April 1, 2012, available at http://www.washingtonpost.com/blogs/wonkblog/post/more-states-privatizing-their-infrastructure-are-they-making-a-mistake/2012/03/31/gIQARtAhnS_blog.html.
98 U.S. General Accounting Office, “Highways and Transit: Private Sector Sponsorship of and Investment in Major Projects Has Been Limited” (2004), available at http://www.gao.gov/new.items/d04419.pdf.
99 Deloitte Research, “Closing America’s Infrastructure Gap: The Role of Public-Private Partnerships” (2007), available at http://www.deloitte.com/assets/Dcom-UnitedStates/Local%20Assets/Documents/us_ps_PPPUS_final(1).pdf.
100 Kristen Mack, “Emanuel to name Chicago Infrastructure Trust board,” Chicago Tribune, June 11, 2012, available at http://articles.chicagotribune.com/2012-06-11/news/ct-met-rahm-emanuel-0611-20120611_1_mayor-rahm-emanuel-world-business-chicago-city-hall-watchdog.
101 City of Chicago Office of the Mayor, “City Council Passes Chicago Infrastructure Trust,” Press release, April 24, 2012, available at http://www.cityofchicago.org/con-tent/dam/city/depts/mayor/Press%20Room/Press%20Releases/2012/April/4.24.12InfraTrust.pdf.
102 Clinton Global Initiative, “President Clinton Meets with Mayors from Major U.S. Cities to Discuss Job-Creating Urban Infrastructure Banks,” Press release, August 9, 2012, available at http://press.clintonglobalinitiative.org/press_releases/president-clinton-meets-with-mayors-from-major-u-s-cities-to-discuss-job-creating-urban-infrastructure-banks/.
103 In a twist not attainable by most cities, New York Mayor Michael Bloomberg’s foundation is guaranteeing $7.2 million of the loan.
104 The Economist, “Being good pays,” August 18, 2012, available at http://www.economist.com/node/21560561.