Embed Size (px)
Citation preview

Supervisor: prof. Leif KirsebomBiology Education Centre and Department of Cell and Molecular Biology, Uppsala University
Degree project in biology, 2006Examensarbete i biologi 20p, 2006
Studying the importance of 2´OH groups of tRNA in theRNase P mediated cleavage of tRNA precursors
Ramesh Raju Vetukuri

2
Summary RNase P is an essential enzyme responsible for the maturation of the 5’ end of tRNA precursors. Bacterial RNase P consists of one protein subunit and one RNA subunit. The RNA subunit can cleave its substrate in vitro in the absence of the protein subunit, i.e., the catalytic activity is associated with the RNA component, which therefore is a ribozyme. The aim of this project was to study the interaction between the substrate and ribozyme. More specifically, the aim was to identify 2´-OH groups in the substrate important for catalysis. Thus 2´-deoxy substitutions were introduced in the model substrate pAT-Ser at positions that had been suggested to be important for cleavage. The substrates with different substitutions were: dC-75 (deoxycytosine at 75th position in the substrate), dU-27 (deoxyuracil at 27th position) and -2dA (deoxyadenine at position -2 in the substrate). In addition, I investigated the minimal substrate size by generating a mini substrate (further referred to as mini 3 bp), carrying a reduced number of base pairs in the helical structure of the molecule. The influences of these changes were studied with respect to ground state binding (apparent dissociation constant, Kd) and catalysis. Reaction kinetics was analyzed in respect to half of the maximum reaction rate. That is because in single turnover kinetics the dependence between the reaction rate and the substrate concentration is linear only up to a certain value. Beyond that value the reaction velocity increase depends not only on the substrate concentration but also on the enzyme accessibility (saturation effect). Effectively, to avoid this rate limiting process, the analysis was performed for substrate concentrations not higher than Km (Michaelis-Menten constant), that is the substrate concentration needed to obtain half of the maximum reaction rate. These experiments gave values for the kinetic constants Kobs, Km and Kobs/Km. The kinetic constant Kobs reflects the rate of the cleavage reaction, Km corresponds to the concentration of substrate needed to obtain half the maximum cleavage rate under multiple turnover conditions and Kobs/Km can be regarded as an overall cleavage efficiency measure. In order to say that a certain substitution showed an effect on the cleavage rate and ground state binding, the difference compared to the non-modified substrate should be greater than two fold. None of the 2´-deoxy substituted substrates showed such a big difference compared to all the ribo substrates, from the results obtained by single turnover kinetics. Magnesium titration studies on the modified substrates showed different patterns for each substrate, where the concentrations needed for optimal cleavage were much higher than for the wild-type substrate. Binding assays were also performed, since they allow approximating enzyme affinity to the substrate: the higher the binding affinity, the lower are the Kd values. For the analyzed substrates Kd values were relatively high, which indicates lower affinity compared to the wild-type substrate. This effect was more pronounced in the case of mini 3 bp followed by dC-75. All these data point out that mini 3 bp was cleaved significantly more slowly than the wild-type substrate. Changes in other

3
bases, where modifications were introduced seemed not to be important for the overall cleaving effect.
4
Introduction
RNase P Ribonuclease P (RNase P) is a ubiquitous and essential ribonucleoprotein (RNP) involved in 5’ maturation of transfer RNAs (tRNAs). RNase P is involved in the processing of all species of tRNA (Figure 1). It is present in all cells and cellular compartments that are capable of tRNA synthesis. Generally ribozymes are divided into different classes based on size and reaction products. Large ribozymes, like RNase P catalyze reactions that generate 3´ hydroxyls and 5´ phosphates as cleavage products (Doudna and Cech 2002). Small ribozymes, such as hairpin delta virus, give 2´3´-cyclic monophosphate and 5´ hydroxyls upon cleavage (Doudna and Cech 2002).
Figure 1 Site of action of RNase P on tRNA, indicated by arrow. Bacterial RNase P consists of a catalytic RNA subunit (referred to M1 RNA in Escherichia coli) and a lone protein cofactor (the C5 protein) that plays a supporting but essential role in precursor tRNA (ptRNA) processing in vivo (Guerrier-Takada et al 1983). The RNA moiety is ~ 400 nucleotides long and the secondary structure is shown in Figure 2. RNase P RNA cleaves tRNA accurately in vitro in the absence of C5 component. This enzyme cleaves tRNA between -1 and +1 position (Figure 1) in vitro (Altman and Kirsebom 1999).

5
P7
G
A
C
A
G
U
CGCC
GCUUCGUCGUC
G
UCCUCUU
CG GGG GA GA C G
G
GC GGA GGG G
A
G
G
A
A
A
GUC
C
G
G
G
CUCC
A
U
AGG
GC
AG
GGUGC
C
AG
G
UAA
C
GC
C
U
GG
GGGGGA
AA C C C
ACG
AC
CAGU
GCA
A
C
A
G
A
G
AG
CAAAC
C
G
C
CG
A
G
AU
U
GC
A
G
G
U A
AG
G GU G
AAAG
GGU
GC G
GUA
A
GA
GCG
CACC
G
C GC G
G CU G G
U
AA
CAG
U
CCG
UGG
CAC
GGUAAA
C
U
C
CACC
C GGA G C A A GG C C
GGCU
G
C
U
U
G A G C C A G U G A GC
GAUUGCUGGCCU
A
G
A
U
G
A
A
U
G
A
C
U
G
U
C C A C G A CA
G
AA
CCCGGCUUA
C
C
C
G
C
G
C AA
G
C
G
G
G
G A A G C UG A C C A
U
CGGUCAGUUUC
A
C
C
U
AAA U
AG
GGGU
A
U
GGGU U C
AU A
A
GGUAC G
GC
CC
G
AC
UGAACCC
1
20
40
60
80
100
120
140
160
180
200
220
300
320
340
360
260
280
RNase P RNA
Escherichia coli
P1
P2
P3
P4
P5
P6
P8
P9P10
P11
P12
P13
P14
P15 P16
P17
P18
377
Figure 2 The secondary structure of E. coli RNase P RNA, M1 RNA (Haas 1998). RNase P mediated cleavage requires presence of divalent metal ions, preferably Mg2+. The ions support proper folding of RNA molecules, facilitate binding and promote or participate in the cleavage of substrate molecules (Altman and Kirsebom 1999).
Enzyme kinetics In general, in order to understand the interaction between the substrate (tRNA) and enzyme (ribozyme), kinetics studies should be carried out, more specifically single turnover kinetics. In enzyme kinetics, the enzyme combines with the substrate and forms a product. Once the product is formed, the enzyme separates from the product and combines with another substrate and forms another product (multiple turnover kinetics). In single turnover kinetics however, the enzyme is allowed to combine with the substrate only once. In this process, the object of interest is the chemical transformation or rate of transformation of the enzyme-substrate complex to enzyme-product complex when the reaction velocity (v) is limited by the substrate concentration. Thus, the actual interaction between the enzyme and the substrate can be studied before cleavage and further product formation. In Figure 3 a general scheme of an enzymatic reaction is shown.

6
Figure 3 General scheme of an enzymatic interaction. E – enzyme, S – substrate, P – product, ES – enzyme-substrate complex, EP – enzyme-product complex. From single turnover kinetics (also referred to as cleavage assay conditions) experiments, kinetic constant values, such as Kobs, Km, Kobs/Km can be calculated. The Kobs constant describes the rate of a cleavage reaction, Km corresponds to the substrate concentration needed to obtain half the maximum cleavage rate under single turnover conditions and Kobs/Km can be regarded as an overall cleavage efficiency measure. All the constants are obtained from Michaelis – Menten curves. For single turn over conditions a Michaelis – Menten curve is plotted as reaction velocity versus enzyme concentration, not as reaction velocity versus substrate concentration, as done for multiple turn over kinetics. Also for single turn over kinetics the concentration of the enzyme is in excess, compared to the substrate concentration (Tallsjö et al., 1993). A Michaelis – Menten curve and an Eadie – Hofstee plot shown here as examples (Figure 4 and Figure 5) are for understanding of enzyme kinetics; they apply to multiple turn over conditions. A Michaelis-Menten curve (Figure 4) shows the relation between the velocity of an enzymatic reaction and the substrate concentration. It can be described by the equation:
[ ][ ]SK
SVv
m+
!= max ,
Where: v is the reaction velocity, Vmax is the maximum reaction rate, Km is the substrate concentration at half-maximal reaction rate, that is the Michaelis-Menten constant, and [S] is the substrate concentration.
Figure 4 Michaelis-Menten curve - example. V- reaction velocity, Vmax - maximum reaction velocity, Vmax/2 – half of the maximum reaction velocity, V0 – initial reaction rate, Km - Michaelis-Menten constant. Source: http://www.food.rdg.ac.uk/online/fs355/frame7.htm
E + S ES chemical
transformation
Kobs
EP E + P
(mol/sec)
(µmol/µl)

7
A Michaelis-Menten curve is a hyperbole. Nevertheless, for many purposes it is more convenient to use a linear graph, e.g. Eadie-Hofstee diagram (Figure 5). An Eadie-Hofstee diagram is a graphical representation of enzyme kinetics in which reaction velocity is plotted as a function of the velocity vs. substrate concentration ratio:
[ ] maxV
S
vKvm
+!= ,
Where: v represents reaction velocity, Km is the Michaelis-Menten constant, [S] is the substrate concentration, and Vmax is the maximum reaction velocity (Figure 5).
Figure 5 Eadie-Hofstee dependence - example. V- reaction velocity, Vmax - maximum reaction velocity, v0 – initial reaction rate, Km - Michaelis-Menten constant, (S) – substrate concentration. Source: http://www.food.rdg.ac.uk/online/fs355/frame7.htm The Eadie-Hofstee plot allows identification important kinetic terms like Km (calculated as the slope of the graph), Vmax (obtained as the interception of with the vertical axis) and the Vmax/Km ratio (interception with the horizontal axis). This graphical representation gives equal weight to data points in any range of substrate concentration or reaction velocity, which makes it robust to measurement errors. A disadvantage of the Eadie-Hofstee approach is that any experimental errors are present on both axis, since both coordinates depend on reaction velocity.
Enzymatic assays
In order to examine the rate of transformation of the enzyme-substrate complex to enzyme-product complex, radioactively labeled substrates with 32P at the 5´ end were used. This permits monitoring the cleaved 5´ end and the non-cleaved substrate on a polyacrylamide gel (Figure 6). With this approach one can gain information about the role of particular nucleotides in the cleavage reaction.
(mol/sec )

8
Figure 6 PAGE (Polyacrylamide gel electrophoresis) gel showing cleavage of 32P-labeled cleaved and non-cleaved RNAs. Binding assays can be performed in order to determine the ground state binding, which characterizes the affinity of the enzyme to different substrates. The constant Kd, describes binding affinity: the higher the binding affinity, the lower the Kd values and vice versa. Binding constants can be calculated from experiments that permit separate measurements of the amount of free and bound substrate under different conditions.
Aims The aim of the present project was to identify 2-OH groups in the substrate that are important for catalysis, in order to understand the interaction between the substrate and the ribozyme.
9
Results
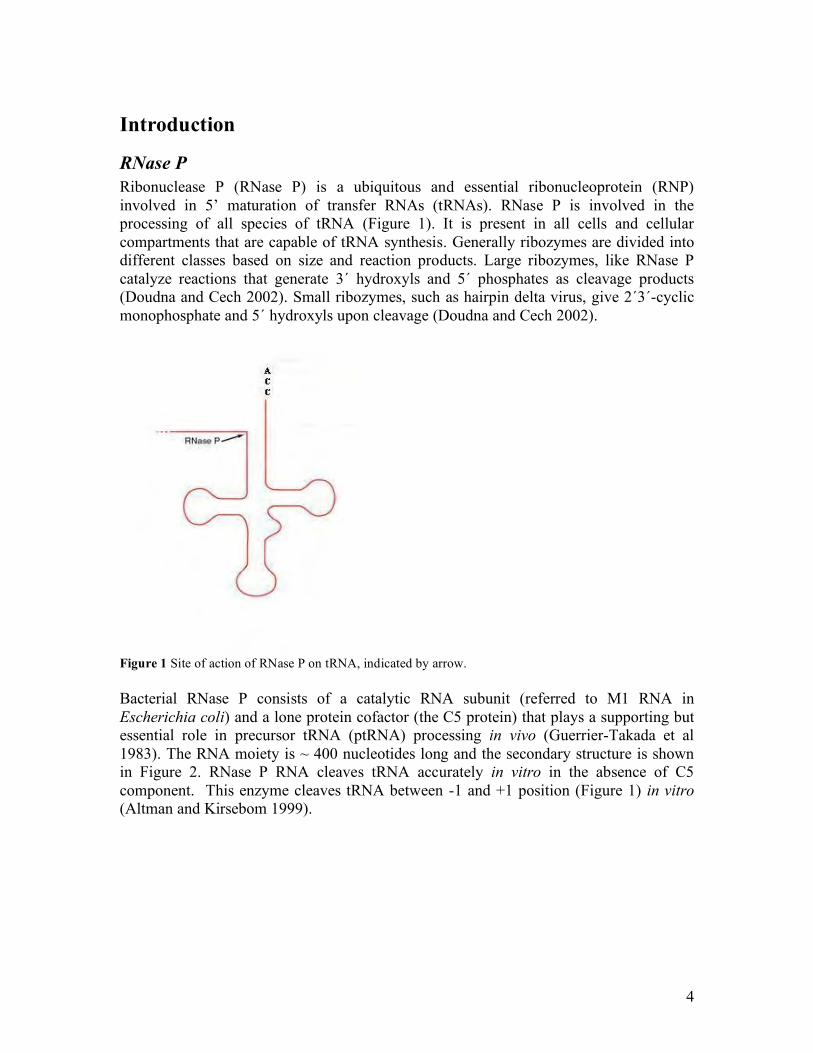
1. Substrates In order to identify 2-OH groups in the substrate that are important for catalysis, single 2-deoxy substitutions were introduced in the precursor tRNA (model substrate pATSer UGSyn) at nucleotides that had previously been suggested to be important for correct cleavage of precursor tRNA (Figure 7). The substrates with different substitutions were: dC-75 (deoxycytosine at 75th position in the original tRNA substrate), dU-27 (deoxyuracil at 27th position), and -2dA (deoxyadenine at position -2 in the substrate). The wild-type substrate is referred to as UG-GC. The numbering of the nucleotides in the structure of tRNA was according to Sprinzl (1991). RNase P cleaves between residue -1 and +1 leaving a 9 nucleotide 5´ leader sequence. A small model substrate referred to as mini 3 bp, 24 nucleotides long was also used to investigate how small a substrate can be and still undergo accurate cleavage.
Figure 7 Positions of different modifications introduced in different model substrates used in the project. The normal structure of tRNA looks as shown below (Figure 8). In my study model hairpin loop substrates were used in order to examine the mechanism of cleavage.
G C G C
G C G
U
G A A
A
CCAC +1
pMINI 3bp
GAUCUGAA G
G A G A G
U U
G C C C C U
GAUCUGAA U
A G G
C C
G G
C C
G U
C
C U
A A A U
CCAC +1
pATSerUGSyn
-2dA
22 dC
27 dU
+75 dC
Cleavage Site

10
Figure 8 Schematic representation of a tRNA molecule. Source: http://www.biochem.uwo.ca/meds/medna/tRNA.html These 20 to 45 nucleotide fragments were named pAT-Ser substrates. The abbreviation pAT-Ser stands for: Precursor Acceptor (stem) T (stem -loop) and Ser, which means the particular tRNA for the amino acid serine. Therefore I refer to these molecules as substrates throughout this project report. Only the RNA part of RNAse P was used, (named M1 RNA in E. coli).
2. Kinetics At first I compared the cleavage of substrates with single 2-deoxy substitutions to cleavage of all ribo wild-type substrate with respect to ground state binding and catalysis. To achieve that, I carried out single turnover kinetics studies and examined the rate of transformation of the enzyme-substrate complex to enzyme-product complex. Single turnover kinetics experiments were performed at pH 6 and substrate concentration 0.04 µM, with increasing enzyme concentrations (Table 1 and Figure 9) that were always significantly higher than substrate concentrations. For each enzyme concentration the substrate was added and the reaction was stopped after a certain period of time (Table 1, second column). The time points were taken from preliminary studies to make sure that the reaction rate is within the linear range (data not shown). The reaction products, separated by PAGE electrophoresis and analyzed using Phosphor Imager correspond to A1 and A2 values in Table 1 (non-cleaved and cleaved substrate, respectively). Table 1 contains data for the dC-75 substrate obtained from the gel shown in Figure 9. Values from Table 1 were used to plot a Michaelis-Menten curve (Figure 10) and Eadie-Hofstee curve (Figure 11). The same analysis was done for all the other substrates (data not shown).

11
Figure 9 Cleavage assay: PAGE gel for substrate dC-75. Upper bands correspond to non-cleaved reaction products lower bands correspond to cleaved products. The samples have increasing enzyme concentrations of RNase P, from 0.02 µm to 6.4 µm (lane 1 to lane 9, the 10th well is empty). The last band is a reference for identifying the direction of loading. For all the reaction mixtures (lanes 1 to 9) the substrate concentration was 0.04µM. This is the gel from which the data in Table 1, Figure 10 and Figure 11 were calculated. Table 1 Single turnover kinetics experimental data obtained for the substrate dC-75.
[E] (pmol/µl)
t (s) A 1 (count/mm2)
A2 (count/mm2)
% of cleavage
[P] (pmol/µl)
V (pmol/uL)/min
V/E]
0.025 30 26000 1700 4.8 0.0012 0.002 0.095 0.05 30 28600 3000 7 0.0019 0.005 0.093 0.1 20 34300 4200 9 0.0021 0.007 0.067 0.2 6 32500 2300 5.5 0.0013 0.013 0.067 0.4 6 33400 7000 14.3 0.0035 0.034 0.086 0.8 6 30800 7300 15.3 0.0038 0.038 0.048 1.6 6 23600 14200 29.7 0.0075 0.075 0.046 3.2 6 21100 28300 46 0.0114 0.113 0.035 6.4 6 20200 29700 50.3 0.0119 0.119 0.018
[E] – enzyme concentration, [P] – product concentration, V – reaction rate [P]/t ,t – time A1, A2 – the amount of non-cleaved and cleaved material (respectively), calculated from Phosphor Imager data

12
Figure 10 Single turnover kinetics for substrate dC-75 cleaved by RNase P – Michaelis-Menten curve (Table 1). Experimental conditions: pH 6, enzyme concentration 6.4µM, substrate concentration 0.04µM. [E]>>[S] – enzyme concentration significantly higher than that of the substrate. [E] – enzyme concentration, [S] – substrate concentration, V – reaction velocity.
Figure 11 Eadie – Hofstee dependence, derived from the Michaelis-Menten curve – single turnover kinetics for substrate dC-75 cleaved by RNase P (Table 1). Experimental conditions: pH 6, enzyme concentration 6.4µM, substrate concentration 0.04µM. [E]>>[S] – enzyme concentration significantly higher than that of the substrate. [E] – enzyme concentration, [S] – substrate concentration, V – reaction velocity.
0
0,02
0,04
0,06
0,08
0,1
0,12
0,14
0 1 2 3 4 5 6 7 [E] (pmol/ul)
y = -1,5037x + 0,1387
-0,02
0
0,02
0,04
0,06
0,08
0,1
0,12
0,14
0 0,02 0,04 0,0
6 0,08 0,1 0,12 V/[E] (1/min)
V (p
mol
/µl*m
in)
V (p
mol
/µl*m
in)

13
From figures 10 and 11 a Vmax of 0.14, a Kobs of 6.9, a Km of 1.5 and a Kobs/Km ratio of 4.6 were obtained. Single turnover kinetics experiments were then carried out for all the model substrates. The average values of Kobs, Km, Kobs/Km obtained from these experiments are shown in Table 2. Table 2 Summary of single turnover kinetic data for different pATSer substrates.
Substrate Average Kobs (min−1) Average Km (µM) Average Kobs/Km UG-GC 8.70±0.25 0.65±0.07 13.60±1.60 dU-27 3.50±0.19 0.30±0.07 11.50±2.30 dC-75 3.90±0.02 0.93±0.05 4.20±0.32
Mini 3bp 0.34±0.12 2.20±0.42 0.14±0.02 -2dA 4.50±0.26 1.20±0.46 4.60±0.34
Experimental conditions: pH 6, 160 mM Mg(OAc)2, [E]>>[S]. Each value is an average of three independent experiments.
The average Kobs values (Table 2) for deoxy substrates: dU-27, dC-75 and -2dA were close to each other, that is between 3.5 and 4.5, which was less than for the wild-type (average Kobs 8.7). The same trend was observed for Km values and for Kobs/Km. In case of mini 3 bp the average Kobs value was 0.34 (Table 2), this was significantly lower than the wild-type. This means that the rate of cleavage of this substrate is lower than that of the wild-type. The same trend was observed for Km and Kobs/Km values. A modest difference was seen between the values for mini 3 bp compared to those of the other deoxy substrates, in relation to wild-type.
3. Magnesium titrations As mentioned previously, magnesium plays a major role in vitro to help in proper folding of the substrate, for correct cleavage of precursor tRNA by RNase P (Gesteland et al., 1999). Magnesium titration studies were done to investigate the optimum Mg2+ concentrations needed by different substrates, in comparison with wild-type. The aim was to analyze the importance of certain residues in the close environment of the RNase P cleavage site with respect to metal ion binding. Magnesium titrations were done for all the substrates at half the maximum enzyme concentration required for the single turnover kinetics. This is because when the cleavage rate reaches above 40%, almost all the substrate is converted to product, whereby it is beyond the linear part of the Michaelis-Menten curve; hence experiments will not give more information about the optimum rates. Figures 12 to 14 contain a summary of magnesium titrations of cleavage of different model substrates and a comparison to cleavage of the wild-type substrate. Figure 12 shows the dependence of average reaction rates of cleavage on magnesium concentration, for the substrate –2dA compared with wild-type (UG-GC).
14
0
100
200
300
400
500
600
700
800
0 100 200 300 400 500 600
Mg(OAc) 2 concentration (mM)
Av
era
ge
re
ac
tio
n r
ate
(%
)
-2dA
UG-GC
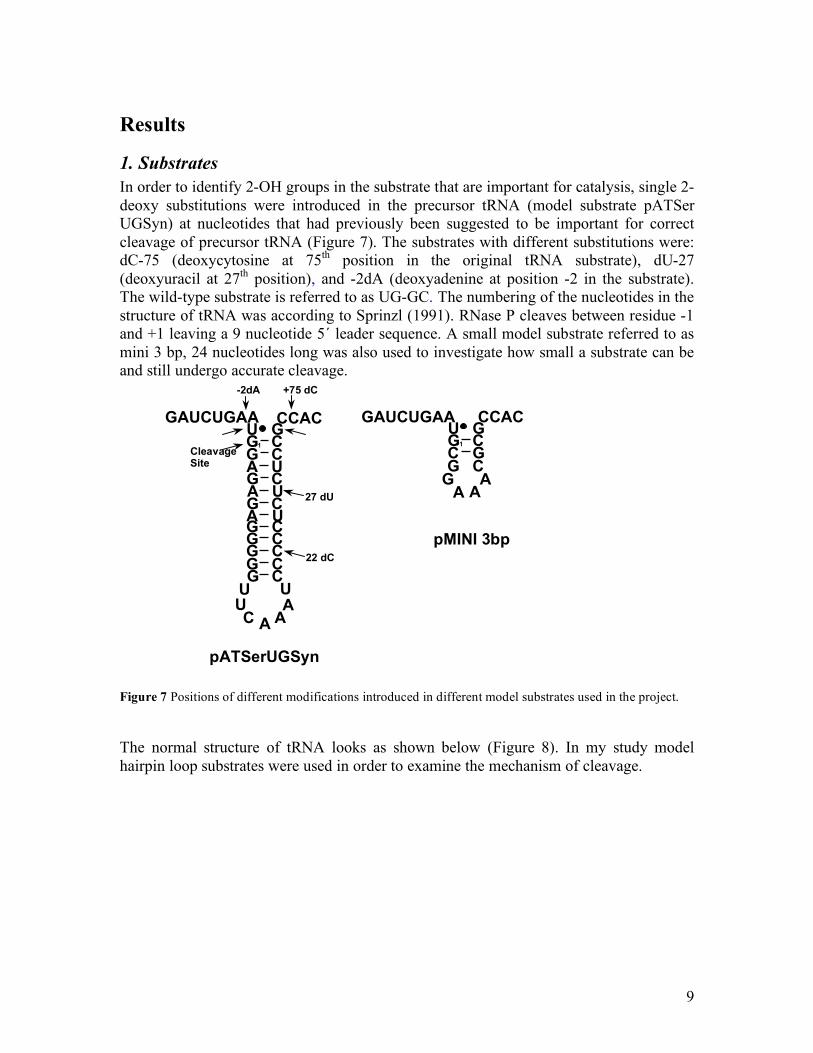
Figure 12 Comparison of Mg2+ titration profile of wild-type substrate (UG-GC) with that of -2dA substrate. Experimental conditions: pH 6, enzyme concentration 6.4µM. [E]>>[S] – the enzyme concentration is greater than that of the substrate. Each value is an average of three independent experiments. The reaction rate was calculated as average cleavage rate per minute. The error bars indicate the standard deviation. Magnesium titrations shown in Figure 12 indicate that for the wild-type substrate the plateau (saturation point) was reached at 160 mM and for the substrate -2dA the plateau was reached at 300 mM. This indicates that the Mg2+ concentration required for substrate –2dA cleavage by RNase P was 160 mM and for the substrate -2dA was about 300 mM. Figure 13 shows a comparison between mini 3 bp and the wild-type substrate (UG-GC). The mini 3 bp substrate requires around 300 nM magnesium concentrations to reach the saturation point, which infers that its average reaction rate is very low. This may be because of its small size compared to the wild-type substrate.

15
0
100
200
300
400
500
600
700
800
0 100 200 300 400 500 600
Mg(OAc) 2 concentration (mM)
Av
era
ge
re
ac
tio
n r
ate
(%
)
mini 3 bp
UG-GC
Figure 13 Comparison of Mg2+ titration profile of wild-type (UG-GC) substrate with that of the mini 3 bp substrate. Experimental conditions: pH 6, enzyme concentration 6.4µM. [E]>>[S] concentration of the enzyme is greater than that of the substrate. Values of the average reaction rate for mini 3 bp were multiplied by 10 because of the very low signal. The reaction rate was calculated as average cleavage rate per minute. The error bars indicate the standard deviation only for wild type UG-GC. For mini 3 bp, magnesium titrations were done only once. The magnesium titration studies for substrate dC-75 show that also here the saturation point was reached around 300 mM Mg2+, which is relatively high in comparison with wild-type substrate (UG-GC). This infers the average reaction rate was low compared to wild-type.
0
100
200
300
400
500
600
700
800
0 100 200 300 400 500 600
Mg(OAc) 2 concentration (mM)
Av
era
ge
re
ac
tio
n r
ate
(%
)
dC-75
UG-GC

16
Figure 14 Comparison of Mg2+ titration profile of wild-type substrate with that of dC-75 substrate. For the substrate dC-75, the plateau was reached between 200 and 300 Mm and its average rate obtained from these magnesium titration studies was also low compared to wild-type (according to the kinetics it should be 1/3 of the wild-type at 160 mM). The reaction rate was calculated as average cleavage rate per minute. The error bars indicate the standard deviation. Thus all substrates showed higher Mg requirement than the wildtype substrate, with a plateau reached at or above 300 nM.
4. Binding assay A binding assay gives information about affinity of the enzyme for the substrate, which is represented as Kd. High Kd values reflect low affinity of the enzyme for the substrate. The Kd values were determined by non-linear regression from the equation
[ ][ ]freed
freet
cRNAMK
RNAMff
1
1
+
!= (Hardt et al., 1995),
Where: Kd is the binding constant, fc is the fraction of pATSer (substrate) in complex with M1 RNA and ft is the maximum fraction of pATSer (substrate) able to bind M1 RNA, i.e. endpoint. An example of data from which Kd were calculated is shown in Table 3. Table 3 Binding result for substrate dC-75.
M1 (µM)
E+S (counts per
minute)
free S (counts per
minute) f(E+S)/total fc 0 300 34800 0.01 0
0.0625 3200 34700 0.08 0.10 0.125 5900 29900 0.16 0.15 0.25 7900 30700 0.20 0.21 0.5 11300 25500 0.30 0.26 1 10100 26300 0.27 0.30 2 12700 22000 0.36 0.32 4 12700 24000 0.34 0.33 8 10800 23600 0.31 0.34
Kd is the binding constant, fc is the fraction of pATSer (substrate dC-75) in complex with M1 RNA and ft is
the maximum fraction of pATSer (substrate) able to bind M1 RNA, i.e. endpoint. E+S – enzyme-substrate complex, free S – free substrate or unbound substrate, f(E+S)/total – fraction of enzyme-substrate complex.
The same calculations were carried out for all substrates, and the data are summarized in Table 4.

17
Table 4 Summary of binding assay data for different pATSer substrates. Substrate Average Kd
(µM) Maximum enzyme concentration
(µM) UG-GC 0.020 1.8
-2dA 0.054±0.015 8.0 Mini 3 bp 0.290±0.120 8.0
dC-75 0.170±0.040 8.0 Assay conditions: 160 mM CaCl2. Kd is the binding constant, fc is the fraction of pATSer (substrate) in complex with M1 RNA and ft is the maximum fraction of pATSer (substrate) able to bind M1 RNA, i.e. endpoint. M1 RNA binding to the mini 3 bp substrate showed 30 times higher Kd values than when binding to the wild-type substrate UG-GC (Table 3). That means it has very poor binding affinity. M1 RNA showed nearly 5 times higher Kd value binding to the substrate -2dA compared to binding to the wild-type UG-GC substrate (poor binding). For the substrate dC-75 Kd was 10 times higher than for the wild-type substrate (poor binding).
18
Discussion The model substrates that I worked with, -2dA, dC-75, dU-27 (45 nucleotides in length) and the small substrate called mini 3bp (24 bases), were much shorter than normal tRNAs (which are more than 70 nucleotides in length). These modifications were chosen as they are considered important for the cleavage of tRNA by RNase P. Small substrates were chosen for this work, in order to check how small RNA molecules can undergo this reaction, since it is the CCA 3' end of the substrate that interacts with RNase P and helps in the cleavage (Doudna and Cech 2002). Single turnover kinetics data results showed that differences in Kobs, Km and Kobs/Km values for the analyzed model substrates in comparison with the wild-type were significant only for the mini 3 bp substrate. The reason may be that this RNA fragment has 24 nucleotides, which is much less than a normal substrate, and many of the “missing” nucleotides might be crucial for efficient cleavage. There should be a 2-fold difference in these three factors: Kobs, Km, Kobs/Km in all the modified substrates, compared to wild-type substrate would be required to consider them significant, (Brännvall et al., 2004) and to consider that these modifications may play an important role in the cleavage mechanism, as seen by nucleotide modification at -1 and other nucleotide modifications. Only with the mini substrate a modest effect was seen. Studies on Bacillus subtilis RNase P by other groups have shown that the dU-27 nucleotide is very important for the cleavage process (Loria et al., 1997). However, in my studies on the dU-27 substrate, using RNase P from E. coli, this particular modification showed no significant difference compared to the wild-type substrate. Magnesium titration studies on these substrates revealed that indeed the magnesium concentration required for their optimal cleavage differed. The concentration dependency was slightly higher for all substrates, but for substrate -2dA was quite similar to that of wild type substrate UG-GC. For the mini 3 bp substrate the reaction rate was very low, which may be caused by the small size of the substrate. It reached optimum around 300 mM Mg2+. For the substrate dC-75 the optimum magnesium concentration was between 200 mM and 300 mM and the reaction rate was slow compared to wild-type. Thus all substrates showed higher Mg requirement than the wildtype substrate, with a plateau reached at or above 300 nM. Binding assays reflect the binding affinity of the enzyme to the substrate. All these model substrates needed high concentrations of the enzyme for effective binding compared to the wild-type. For the mini 3bp substrate the Kd value was 30 times higher than that for the wild-type substrate, which indicates poor affinity between the enzyme and this substrate, possibly due to the lack of other interacting nucleotides present in a normal substrate that may help in proper folding and binding. Other substrates also had poor affinity to the enzyme aptly reflected here in high Kd values. All these model substrates, apart from the mini substrate, did not show significant changes from the wild-type in single turnover kinetics or in the binding assay, in a way that may suggest that these nucleotides may not be important for cleavage but may help in folding for correct cleavage to take place. It would be interesting to continue this work

19
on these substrates, using RNase P from different prokaryotes, not only E. coli and also eukaryotic organisms.
20
Materials and methods
1. Substrates and enzyme M1 RNA The pATSer substrates were purchased from Dharmacon, USA. The M1 RNA variants were generated as run-off transcripts using T7 DNA-dependent RNA polymerase according to according to Milligan et al. (1987).
2. Polyacrylamide gel electrophoresis Acrylamide mix for running polyacrylamide gel electrophoresis (PAGE) can be purchased in the form of 40% (w/v) stock solution of acrylamide (194.8 g) and N,N’-methylene-bis-acrylamide (5.2 g), for a total monomer to cross-linker ratio of 37.5:1. From the 40% stock solution a second stock of 25% acrylamide was made. For single turnover kinetics experiments (cleavage assay conditions) 22% acrylamide mix was prepared from the secondary stock (25% acrylamide). For each plate 60 ml of 22% gel mix was needed, for this 52.8 ml 25% gel mix and 7.2 ml of 7 M urea was taken and mixed followed by addition of 600 µl of 10% ammonium persulfate (APS) and 60 µl of tetraethyl methyl ethyl diamine (TEMED). To run the gel Tris EDTA buffer (10 mM TrisHCl pH 7.4 and 1mM EDTA pH 8.0) pH 7 was used. To stop reactions in the kinectic experiments stop solution was added. To 10 µl sample was added 20 µl of stop solution containing 10 M urea, 100 µM EDTA and 0.025% of both Xylene Cyanol and Bromophenol Blue. 20 µl was then loaded into each well on the gel. For purification of the radio labeled RNA substrates 15% polyacrylamide gel was prepared. For this purpose to 36 ml 25% acrylamide mix and 24 ml 7 M urea were added to obtain a final volume of 60 ml (same as for 22% gels).
3. 5' end labeling 100 pmol of the RNA substrate and 100 µCi of γ-ATP were incubated with 30 units of enzyme T4 polynucleotide kinase (T4 PNK), from Sigma. The concentration of the enzyme was 30 U/µl. The reaction buffer contained 50 mM Tris-HCl, pH 7.5 and 10 mM MgCl2 and the total reaction volume was 30 µl. T4 polynucleotide kinase catalyses the transfer of the terminal phosphate (gamma) of ATP to 5´ hydroxyl termini of RNA and DNA. The reaction mixture was incubated for 30 – 45 minutes at 37ºC and stopped by adding 20 µl of stop solution. The samples were purified by denaturing polyacrylamide gel electrophoresis (PAGE) on a 15% PA gel and run at 20 W. After the PAGE, RNA was detected using UV (254 nm) shadowing, which shows dark band on the gel. The band was excised and crushed in a tube (until it had the consistency of a dough), and the RNA was eluted with 300 µl of Tris EDTA buffer (10 mM TrisHCl pH and 0.001 M EDTA) by shaking overnight. The eluate was extracted with equal volume of phenol followed by short vortexing and centrifuging for 2 minutes at 3400x g. The aqueous phase was extracted two more times in the same way but with chisam (24:1 choloroform and

21
isoamyl alcohol). The RNA was precipitated by adding 1/10 volume 3 M NaOAc and 3.5 volumes of 99.5% alcohol to the supernatant. This mixture was frozen overnight and then centrifuged for 20 minutes. The liquid was removed and the pellet dried in a speedvac. The pellet was dissolved in 20 µl H2O and further diluted 1:40 before use.
4. Single turnover kinetics M1 RNA activity was monitored under single turnover conditions at 37°C in a buffer containing 50 mM MES (Methyl Ethyl Sulphonate) pH 6, 0.8 M NH4OAc and 160 mM Mg(OAc)2. The substrate concentration was 0.04 µM and the enzyme concentration for substrate dC-27 was 2.4 µm, where as for all other substrates the enzyme concentration used was 6.4 µM (because for the dC-27 substrate the cleavage assay would reach the saturation point at a low concentration of the enzyme compared to other). Serial dilutions were prepared to get the various concentrations of the enzyme. The kinetic constant, Kobs, under single turnover conditions was determined for each substrate in 50 mM MES buffer. The M1 RNA and the substrate were preincubated separately for seven and two minute’s respectively, where upon they were mixed and incubation continued at 37°C. The reactions were terminated by adding two volumes of stop solution. The time of incubation was adjusted for each substrate to be in the linear part of the curve of kinetics. After the reaction was stopped, the products (non-cleaved substrate and cleaved 5´-product) were separated on denaturing 22% PA gels. The gels were run at 25 W and exposed overnight onto Phosphor Imager cassettes and scanned and analyzed on a Phosphor Imager, MolDyn. 400s. The amount of cleaved substrate was determined by quantification of the bands corresponding to uncleaved substrate and cleaved product. For the calculations 5´ cleavage fragments (cleaved products) were used. The Kobs values were obtained by linear regression from Eadie-Hofstee plots where the cleavage velocity V (mol/min) was plotted against V/ (M1 RNA).
5. Binding assay Size-exclusion gel chromatography was used for determining apparent equilibrium dissociation constants (approximate Kd) for M1 RNA to different model pATSer substrate derivatives. The substrate and enzyme was pre-incubated separately for 10 minutes in 50 mM MES pH 6.0 at 37°C, 0.8 M NH4OAc 0.05% (w/v) NP-40, 0.1% (w/v) SDS and 160 mM CaCl2. The M1 RNA concentration was varied from 0.06 µM to 8 µM (concentration range dependent on substrate, and the substrate concentration was lower than 10 nM). After mixing, the samples were incubated at 37°C for 20 minutes and then immediately loaded on G75 columns and spun for 1 minute at 320x g. The columns and flow through were analyzed in a scintillation counter for the signal. The apparent Kd values were determined by non-linear regression analysis using Origin 7.0 software (Origin lab) and the equation

22
[ ][ ]freed
freet
cRNAMK
RNAMff
1
1
+
!= (Hardt et al., 1995)
Where: fc is the fraction of pATSer in complex with M1 RNA (Cpm eluate/Cpm[column+eluate]) and ft is the maximum fraction of pATSer able to bind M1 RNA, i.e. endpoint.
Acknowledgements I thank Prof. Leif Kirsebom for accepting me as a project student and offering me an interesting project. I am grateful for his guidance and supervision. I also would like to offer my thanks to Dr. Mathias Brännvall, for his guidance and teaching me how to plan and execute the project. I am grateful to Ema Kikovska, for her assistance throughout the project and patience in resolving all my doubts. I also offer my sincere thanks to Prof. Karin Carlson for helping me as my project coordinator. I would like to thank all those who helped in my project – Jaydeep, Shiying, Fabien, Klas, Erik, Evgenia and Chandu. Finally I am grateful to my friend Ela for her support throughout the project: helping with the software, reading my project report and suggesting changes.

23
References
Altman S. and Kirsebom L.A. (1999) In RF Gesteland, T Cech, JF Atkins, eds, The RNA World, Ed 2. Cold Spring Harbor Laboratory Press, Plainview, NY, pp 351-380
Brännvall, M., Kikovska, E. and Kirsebom, L.A. (2004) Cross talk between the +73/294 interaction and the cleavage site in RNase P RNA mediated cleavage. Nucleic Acids Research, 32, 5418-5429.
Brännvall, M., Pettersson, B.M.F. and Kirsebom, L.A. (2002) The residue immediately upstream of the RNase P cleavage site is a positive determinant. Biochimie, 84, 693–703.
Doudna, J.A. and Cech, T.R. (2002) The chemical repertoire of natural ribozymes. Nature, 418, 222–228.
Guerrier-Takada, C., Gardiner, K., Marsh, T., Pace, N. and Altman, S. (1983) The RNA moiety of ribonuclease P is the catalytic subunit of the enzyme. Cell, 35, 849–857.
Haas, E.S. and Brown, J.W. (1998) Evolutionary variation in bacterial RNase P RNAs. Nucleic Acids Research, 26, 4093–4099.
Hardt, W.-D., Schlegl, J., Erdmann, V.A. and Hartmann, R.A. (1995) Kinetics and thermodynamics of the RNase P RNA cleavage reaction: analysis of tRNA 3′-end variants. J. Mol. Biol 247 pp. 161–172
Loria, A. and Pan, T. (1997) Recognition of the T stem-loop of a pre-tRNA substrate by the ribozyme from Bacillus subtilis RNase P, Biochemistry 36 (21): 6317-25.
Milligan, J.F., Groebe, D.R., Whiterell, G.W. and Uhlenbeck, O.C. (1987) Oligoribonucleotide synthesis using T7 RNA polymerase and DNA templates. Nucleic Acids Research, 15, 8783–8798.
Sprinzl, M., Dank, N., Nock, S., Schon, A. (1991) Compilation of tRNA sequences and sequences of tRNA genes. Nucleic Acids Research, 19, Supplement: 2127–2171.
Tallsjö, A., Kirsebom, L.A. (1993) Product release is a rate-limiting step during cleavage by the catalytic RNA subunit of Escherichia coli RNase P. Nucleic Acids Research; 21: 51–57.