Embed Size (px)
Citation preview
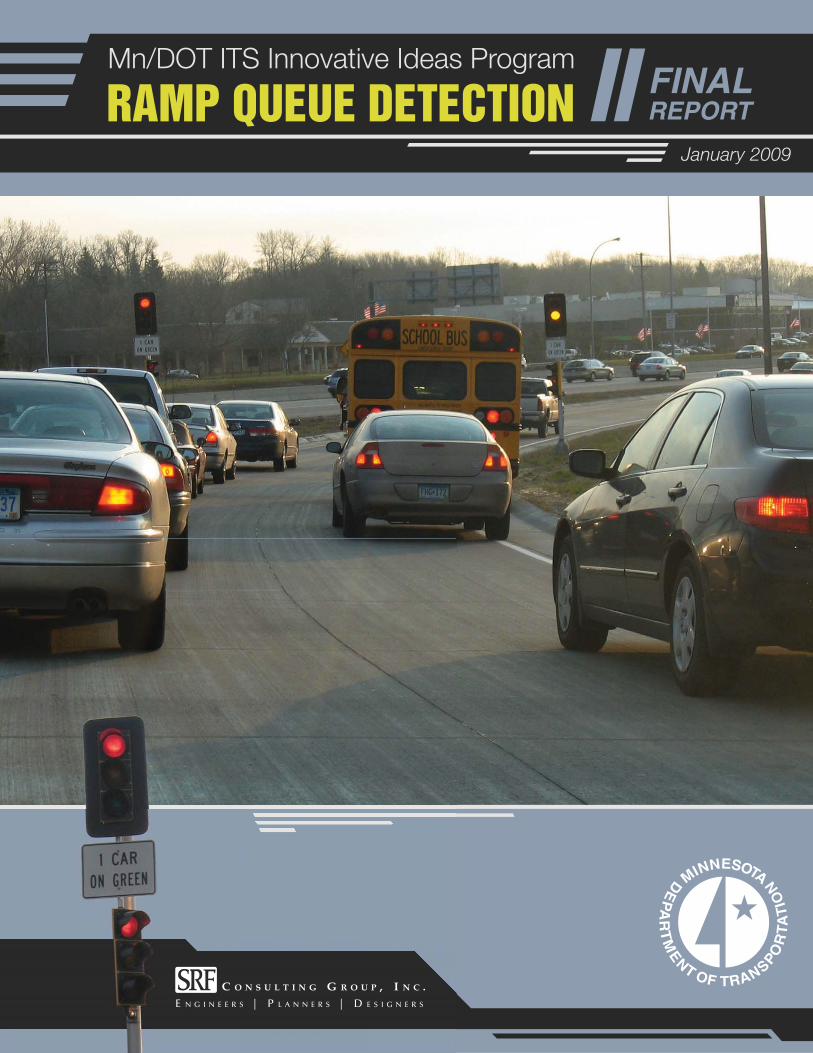
January 2009
FINALREPORTRAMP QUEUE DETECTION
Mn/DOT ITS Innovative Ideas Program
6298 Cover-Final.eps 1/27/09 9:10:33 AM


Final Report
Ramp Queue Detection
January 30, 2009
Prepared for: Minnesota Department of Transportation
Prepared by: SRF Consulting Group, Inc.
SRF No. 0086298


i
Table of Contents EXECUTIVE SUMMARY .......................................................................................................... 1
1. Introduction .................................................................................................................................... 3 2. Literature Search ........................................................................................................................... 5
Ramp Metering Studies .................................................................................................................... 5 Queue Detection Studies .................................................................................................................. 6 Queue Detection Sensors ................................................................................................................. 6 Summary .......................................................................................................................................... 6
3. Evaluation Methodology ............................................................................................................... 7 Cretin Avenue Test Site ................................................................................................................... 7 Sensors Selected For Testing ........................................................................................................... 7
Sensys Networks ....................................................................................................................... 7 Sensys Queue Length Array ...................................................................................................... 8 Sensys Count Array ................................................................................................................... 8 Wavetronix ................................................................................................................................ 9 Wavetronix SmartSensor Advance – Queue Length ............................................................... 10 Wavetronix SmartSensor HD – Count Data ............................................................................ 10
Traffic Data Collection .................................................................................................................. 11 Baseline Data Collection and Verification .............................................................................. 11 Baseline Queue Length Measurement ..................................................................................... 11 Baseline Count ........................................................................................................................ 11
Sensor Calibration .......................................................................................................................... 11 Test Conditions .............................................................................................................................. 11
Traffic Level Test Conditions ................................................................................................. 11 Test 1 (Two 2-Hour Periods) ................................................................................................... 12 Test 2 (One 2-Hour Period) ..................................................................................................... 12
Evaluation Considerations ............................................................................................................. 12 4. Sensor Installation ....................................................................................................................... 13
Lane Closure .................................................................................................................................. 13 Sensys Site Design and Field Installation ...................................................................................... 13 Wavetronix SmartSensor HD Site Design and Field Installation .................................................. 15 Wavetronix SmartSensor Advance Site Design and Field Installation .......................................... 15
5. Sensor Integration ........................................................................................................................ 17 Physical Integration ....................................................................................................................... 17
Sensys Networks ..................................................................................................................... 17 Wavetronix .............................................................................................................................. 18 Wavetronix SmartSensor Advance .......................................................................................... 18 Wavetronix SmartSensor HD .................................................................................................. 18
Data Integration ............................................................................................................................. 18 Sensys Networks ..................................................................................................................... 19 Wavetronix SmartSensor HD .................................................................................................. 19 Wavetronix SmartSensor Advance .......................................................................................... 19

ii
6. Evaluation Results ....................................................................................................................... 21 Sensor Performance ....................................................................................................................... 21
Sensys Count Array ................................................................................................................. 21 Wavetronix SmartSensor HD .................................................................................................. 22 Sensys Queue Length Sensors ................................................................................................. 24 Wavetronix SmartSensor Advance .......................................................................................... 24 Current Loop Detection System .............................................................................................. 25
Sensor System Capital Cost ........................................................................................................... 27 Sensys Count Array ................................................................................................................. 27 Sensys Queue Length Array .................................................................................................... 28 Wavetronix SmartSensor Advance .......................................................................................... 28 Wavetronix SmartSensor HD .................................................................................................. 28
Maintenance Issues/Lifecycle Cost ................................................................................................ 28 Sensys Networks ..................................................................................................................... 30 Wavetronix .............................................................................................................................. 31
Expandability to Other Ramps ....................................................................................................... 31 Short Ramp .............................................................................................................................. 31 Long Ramp .............................................................................................................................. 31 Cloverleaf Ramp or Folded Diamond ..................................................................................... 32
Other Considerations ..................................................................................................................... 33 7. Sensor Comparison ...................................................................................................................... 35
Sensor Comparison Matrix ............................................................................................................ 35 8. Conclusions ................................................................................................................................... 37 Bibliography ........................................................................................................................................ 38

iii
Figures Figure 1. Sensys In-Pavement Sensor and Access Point ................................................................ 8 Figure 2. Sensys Queue Length Array ............................................................................................ 8 Figure 3. Sensys Count Array ......................................................................................................... 8 Figure 4. Sensys Count Array Cross-Section ................................................................................. 9 Figure 5. Wavetronix SmartSensor Advance and SmartSensor HD ............................................. 10 Figure 6. Wavetronix SmartSensor Advance Detection Area. ..................................................... 10 Figure 7. Wavetronix SmartSensor HD Detection Area ............................................................... 11 Figure 8. Sensys Installation ......................................................................................................... 14 Figure 9. Wavetronix SmartSensor Advance Installation and Aiming ......................................... 16 Figure 10. Scatter Plots of Manual Count vs. Sensys Count ........................................................ 22 Figure 11. Scatter Plots of Manual Count vs. Wavetronix SmartSensor HD Count .................... 24 Figure 12. Queue Length Comparison – Manual vs. Sensys ........................................................ 26 Figure 13. Queue Length Comparison – Manual vs. Wavetroinx Advance ................................. 26 Figure 14. Scatter Plot of Manual Count vs. Loop Detectors ....................................................... 27 Figure 15. Long ramp – TH 10 and Main St ................................................................................. 32 Figure 16. Folded diamond ramp – I-494 and Lake Rd. ............................................................... 33 Tables Table 1. Sensys Count Array .......................................................................................................... 9 Table 2. Sensys Data Captured from EVENTPROXY ................................................................. 19 Table 3. Approximate Sensys Costs (Count Array, Five Sensors) ............................................... 27 Table 4. Approximate Sensys Costs (Queue Length Array, Three Sensors) ................................ 28 Table 5. Approximate Wavetronix SmartSensor Advance Costs ................................................. 28 Table 6. Approximate Wavetronix SmartSensor HD Costs ......................................................... 28 Table 7. Sensor Lifecycle Costs .................................................................................................... 30
SRF.Vol3\H\Projects\6298\Ramp Queue Detection\Task 6-Final Report/FinalReportJanuary2009.docx
- 1 -
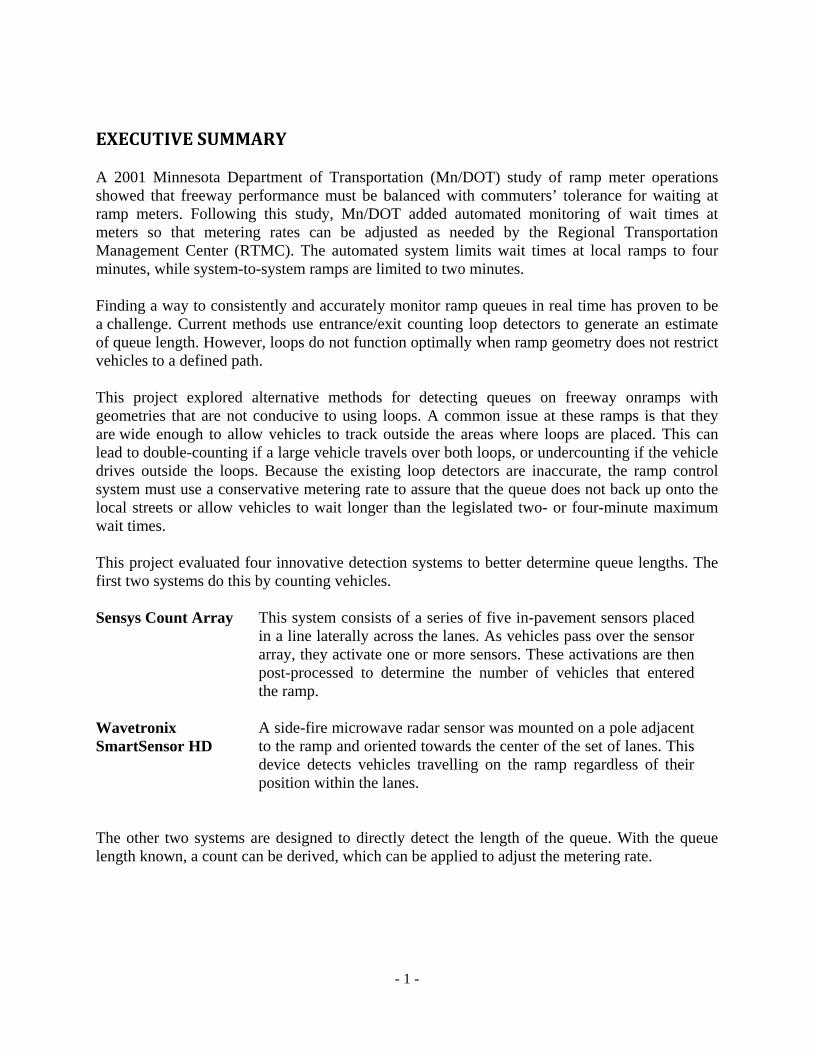
EXECUTIVE SUMMARY A 2001 Minnesota Department of Transportation (Mn/DOT) study of ramp meter operations showed that freeway performance must be balanced with commuters’ tolerance for waiting at ramp meters. Following this study, Mn/DOT added automated monitoring of wait times at meters so that metering rates can be adjusted as needed by the Regional Transportation Management Center (RTMC). The automated system limits wait times at local ramps to four minutes, while system-to-system ramps are limited to two minutes. Finding a way to consistently and accurately monitor ramp queues in real time has proven to be a challenge. Current methods use entrance/exit counting loop detectors to generate an estimate of queue length. However, loops do not function optimally when ramp geometry does not restrict vehicles to a defined path. This project explored alternative methods for detecting queues on freeway onramps with geometries that are not conducive to using loops. A common issue at these ramps is that they are wide enough to allow vehicles to track outside the areas where loops are placed. This can lead to double-counting if a large vehicle travels over both loops, or undercounting if the vehicle drives outside the loops. Because the existing loop detectors are inaccurate, the ramp control system must use a conservative metering rate to assure that the queue does not back up onto the local streets or allow vehicles to wait longer than the legislated two- or four-minute maximum wait times. This project evaluated four innovative detection systems to better determine queue lengths. The first two systems do this by counting vehicles. Sensys Count Array This system consists of a series of five in-pavement sensors placed
in a line laterally across the lanes. As vehicles pass over the sensor array, they activate one or more sensors. These activations are then post-processed to determine the number of vehicles that entered the ramp.
Wavetronix SmartSensor HD
A side-fire microwave radar sensor was mounted on a pole adjacent to the ramp and oriented towards the center of the set of lanes. This device detects vehicles travelling on the ramp regardless of their position within the lanes.
The other two systems are designed to directly detect the length of the queue. With the queue length known, a count can be derived, which can be applied to adjust the metering rate.

- 2 -
Sensys Queue Length Array
Six in-pavement sensors were placed every 50 feet in alternating lanes, starting 50 feet upstream of the ramp meter and extending the entire length of the ramp. The queue length is measured by analyzing the number of detectors with slow-moving or stopped vehicles over them.
Wavetronix SmartSensor Advance
This forward-firing sensor was mounted on a pole near the entrance of the ramp. It was aimed towards the ramp meters so that it would cover as much of the ramp as possible. As vehicles drove down the ramp, the sensor tracked them to determine their distance and speed. Based on those parameters, it determined when vehicles were queued and reported the length of the queue.
All four systems were found to perform accurately and to be implementable on most ramps. However, two systems are recommended because they are viable for a wider variety of ramp types. These two systems are also relatively easy to install, configure, integrate and maintain, but take different approaches to measuring the queue. The Wavetronix SmartSensor HD could be easily integrated as a loop replacement in locations where a count method is acceptable and/or preferred. For sites where queue length is a better parameter to monitor, the Sensys Queue Length Array is recommended.

- 3 -
1. INTRODUCTION Delays experienced at ramp meters have been a major concern for Twin City commuters. One of the key insights learned from the 2001 ramp meter study was commuters’ tolerance for waiting at a ramp meter needs to be balanced with freeway performance. Following the ramp meter study, Mn/DOT added automated monitoring of wait times at meters so they can be adjusted as needed by the Regional Transportation Management Center (RTMC). The system limits wait times at local ramps to four minutes while system to system ramps are limited to two minutes. However, finding a way to consistently and accurately monitor ramp queues in real time has proven to be a challenge. Current methods use entrance/exit counting to generate an estimate of queue length. This method can produce estimates that become less accurate over the course of each metering period. A more accurate measurement of wait time can help Mn/DOT recapture some of the lost efficiency of the freeway throughput at key locations. Variation in delays at ramp meters is primarily caused by variation in demand. This can be due to normal traffic volume variation from day to day, randomness in arrival patterns, or due to variation in demand caused by motorists that are dynamically altering their routes due to congestion on other parts of the system. This high degree of variability makes it difficult to maintain the maximum delay targets without accurate real time information on the queue length. Mn/DOT may be over-estimating the queue length/wait time, resulting in a faster metering rate, which contributes to the breakdown of mainline freeway in some locations. The Department currently uses inductive loop detectors to count vehicles as they enter and depart from each on-ramp. The difference between these values provides an estimate of the queue length at any given time. The ramp metering rate is also known, so a simple calculation provides an estimate of the wait time. The issue with this approach is that the loop detectors do not provide a perfect form of detection. Loop detectors at on-ramps pose the following challenges: • The ramp geometry varies from location to location. Many ramps are wide enough for two
vehicles to enter the ramp simultaneously. Placement of a loop becomes challenging: installing two loops may cause double counting when a single vehicle drives down the center of the ramp, installing a single large loop may cause vehicles to be missed when two vehicles enter the ramp at the same time.
• Even small detection errors compound over time, resulting in inaccurate estimates of wait
time over the course of a peak period. This project evaluated four new detection methods that can more accurately measure queue length on ramps with substandard geometrics. These commercially-available sensors are manufactured by Wavetronix LLC (Wavetronix) and Sensys Networks, Inc. (Sensys). The Wavetronix SmartSensor HD, is a pole-mounted side-fire microwave radar sensor that provides

- 4 -
vehicle counts and other parameters. The Wavetronix SmartSensor Advance is a forward-firing sensor that can directly measure queue length. The system manufactured by Sensys Networks was tested in two different configurations. Both configurations used in-pavement magnetometers that are self-powered for 10 years and communicate wirelessly to a host system to provide vehicle count and presence information in real time. The first configuration was a series of five sensors laterally placed across the lanes to count vehicles entering the ramp. The other configuration was a series of sensors placed longitudinally along the ramp to directly determine queue length. The project was guided by the following project team members: • J. Antonio Fischer, Mn/DOT Project Manager • Brian Kary, Mn/DOT • Doug Lau, Mn/DOT • Terry Haukom, Mn/DOT • Ralph Adair, Mn/DOT • Jim Kranig, Mn/DOT • Steve Misgen, Mn/DOT • Brian Scott, SRF Consulting Group • Erik Minge, SRF Consulting Group • Scott Petersen, SRF Consulting Group
The following factors were considered in the evaluation of the sensors: • Queue length accuracy • Ease of deployment • Ease of configuration and data capture • Deployment cost • System operations and maintenance costs • Expandability to other ramps The sensor or sensors recommended for further deployment should satisfy these factors and should provide better performance than traditional loops.

- 5 -
2. LITERATURE SEARCH A literature review was conducted using the Transportation Research Information Services (TRIS) database and Internet searches to explore prior research on queue detection at ramp meters. The two subjects that were searched were “ramp meter” and “queue detection.” The literature search mostly found prior work in two basic areas: applications to detect traffic queues, and strategies for optimizing metering algorithms. Only one application was found that examined strategies for detecting queues at ramp meters. The literature search also revealed studies undertaken by Mn/DOT and researchers to improve the ramp metering system by accommodating for the shortcomings in the existing queue detection methods.
Ramp Metering Studies The Twin Cities Metro Area Ramp Meter Study (Mn/DOT, 2001) documented the effects of turning ramp metering system for six weeks and then later back on with modified ramp metering strategies. The study found increased system wide delay and crashes with the metering system off, but also found that user satisfaction increased with the shorter ramp wait times. The study recommended goals for creating a new metering strategy that incorporates mainline congestion levels, while maintaining short maximum ramp queue wait times. The study did not address queue detection methods. The Improving Minnesota's Stratified Ramp Control Strategy (Feng, 2005) study aimed to enhance the current Stratified Zone Metering strategy and test it at two freeway sites under various demand scenarios through a state-of-the-art microscopic simulator. The researcher found that the enhanced Stratified Zone Metering strategy would decrease delay and freeway congestion while maintaining the maximum ramp delay requirement. The study did not address shortcomings in detection. In Improving Queue Size Estimation for Minnesota’s Stratified Zone Metering Strategy (Liu, Wu, & Michalopolous, 2007), the researchers analyzed Mn/DOT’s current method for controlling ramp metering rates using loop detectors. They proposed an improvement that would sort ramps into three classes according to their detection accuracy and proposed new models that deal with the errors for each of the ramp classifications. The researchers tested the models on Mn/DOT ramp meters meeting each of the classes. They found that the proposed methods improved all three classes of ramp metering. In the case of the Class III ramps, the results of the two tested models were similar and the researchers recommended the Regression Model for its simplicity. This study shows the significant level of effort required to gain marginal improvements in accurate queue detection. Even with these models, the queues cannot be accurately estimated as well as a more robust system that relies on better detection methods.
- 6 -
Queue Detection Studies The two most prominent applications for queue detection are 1) congestion identification and 2) left turn queues at signals. Congestion identification ranges from detecting queue length upstream of a work zone, to identifying congestion on a freeway system. Queue detection at traffic signals has primarily used inductive loop detector technology. A review of these queue detection studies found nothing applicable to detecting queues that occur at ramp meters.
Queue Detection Sensors Video-based detection has been commonly used for advanced queue detection research. While established video sensor manufacturers, such as Autoscope, have been applied to queue detection applications, newer detection systems, such as, Citilog and Traficon, are also offering queue detection capabilities. Early efforts regarding video queue detection were documented in Traffic Queue Length Measurement Using an Image Processing Sensor (Higashikubo, Hinenoya, & Takeuchi, 1993) and A New Integrated Video Sensor Technology for Traffic Management Applications (Panda, Anderson & Michalopoulos, 1998). In these papers, the video detection methods and capabilities were detailed, but often not thoroughly evaluated. Video detection methods are often expensive and can be prone to errors related to varying light conditions. Other studies have focused on refining the detection technologies and evaluating marketed products, such as, Road Safety Through Video Detection (Versavel, 1999). Sensys sensors have been used for ramp metering by the Utah Department of Transportation as loop replacements. Sensys is also currently working on a process for determining travel time with vehicle re-identification. The concept is that an upstream sensor detects a vehicle’s magnetic signature. Then, when a downstream sensor later re-identifies this vehicle, the travel time between the two points is known. This approach can be used for queue detection: as the vehicle enters the queue, the system has an estimate of how many vehicles are in the queue. When the vehicle exits the queue, the system knows the number of vehicles that have exited the queue while the vehicle was in the queue. The difference between the former estimate and the newly found queue length is the presumed error when the vehicle entered the queue. This can be factored in to correct compounding queue counting errors.
Summary In summary, the literature search found several examples of strategies for optimizing metering algorithms, and one project in Utah to improve methods for detecting ramp meter queues. The literature search also revealed studies undertaken by Mn/DOT and the University of Minnesota to improve the ramp metering system by accommodating for shortcomings in the existing queue detection methods. This research shows that there is significant interest in improving the operation of ramp metering facilities and research is just beginning to examine queue detection at ramp meters.

- 7 -
3. EVALUATION METHODOLOGY The test methodology used in this project was designed to evaluate various components of the installation and use of the sensor systems. The focus is the evaluation of the sensors’ accuracy in measuring the ramp’s queue. In addition, expandability to other ramps, ease of deployment and maintenance, and cost were evaluated. This section will further explain the capabilities of the sensors in order to show how the tested concepts would transfer to a full sensor deployment.
Cretin Avenue Test Site The following criteria were used to select the system test site: • Existing infrastructure to which equipment could be mounted • Moderate vertical slope • Straight horizontal geometry • Suitable ramp length for the evaluation • Power available at ramp meter cabinet • Excellent viewability from RTMC camera The sensors were installed at the ramp from Cretin Avenue to eastbound I-94 in St. Paul because, of the four sites identified as possible candidates, this location was best suited to meet these criteria.
Sensors Selected For Testing
Sensys Networks Sensys Networks’ in-pavement magnetometer sensor communicates with an access point that gathers, stores and reports the detection data. The devices are pictured in Figure 1. Sensys In-Pavement Sensor and Access Point. The Sensys sensors were applied to ramp queue detection in two different methods: a count method and a queue length method. The count method simply counts vehicles entering and exiting the queue, similar to the way loop detectors are currently used. The difference between these counts at any given time is the current queue. The queue length method instead directly measures the distance of the queue which can be converted to an approximate vehicle queue count.

- 8 -
Figure 1. Sensys In-Pavement Sensor and Access Point
Sensys Queue Length Array For the Sensys length measurement configuration, a total of six sensors were installed every 50 feet along the ramp, starting 50 feet upstream of the ramp meters. This configuration is shown in Figure 2. Sensys Queue Length Array. The sensors were spaced so that every other sensor is in a different lane. This is not mandatory to make the system function, but has the benefit that if one lane of traffic was closed, the other lane could still detect queue length, although to a lesser accuracy. The concept of this system is that the occupancy of each sensor will be reported. When the occupancy of a sensor is above a given threshold, it can be assumed that the queue is at least that long. The average queue length is approximated to be half the distance from the last occupied sensor to the next upstream sensor.
Figure 2. Sensys Queue Length Array
Sensys Count Array The Sensys sensors in the count configuration were installed across the lanes near the entrance loops. Five in-pavement sensors were arranged in the pattern shown in Figure 3 and Figure 4.
Figure 3. Sensys Count Array

- 9 -
Figure 4. Sensys Count Array Cross-Section
In this arrangement, the sensors detected both single-file vehicles and vehicles that entered the ramp side by side. Based on which sensors were activated, a simple algorithm developed for this project determined how many vehicles were present. For example, if a vehicle drove down the center of the array, it might trigger Sensors 2 and 3. This would be interpreted as a single vehicle. However, if Sensors 1, 2, 4 and 5 were triggered, the algorithm determined that they were two vehicles. Please note that Sensys has also developed a similar method for real time traffic counting based on multiple sensors. However, the algorithm developed for this project was used in order to gain a deeper understanding of this approach. The set of possible cases is shown in Table 1. Sensys Count Array. Any cases that are not met were likely sensor errors and fell to the closest case as determined by the algorithm that was developed to process this data.
Sensor Triggered
Number of Vehicles Sensor
TriggeredNumber of Vehicles Sensor
TriggeredNumber of Vehicles
1 1 1 & 3 2 2, 4 & 5 2 2 1 2 & 4 2 2, 3 & 4 2 3 1 3 & 5 2 1, 2 & 3 2 4 1 1 & 4 2 3, 4 & 5 2 5 1 2 & 5 2
1 & 2 1 1 & 5 2 2 & 3 1 1, 2 & 4 2 3 & 4 1 1, 2, & 5 2 4 & 5 1 1, 4 & 5 2
Table 1. Sensys Count Array
Data was captured each time the sensor was activated or deactivated. Each data point had an associated timestamp to precision of less than ten milliseconds. This time was rounded to the nearest tenth of a second for ease of data manipulation while still detecting fast-moving vehicles that only activated the sensor for a fraction of a second. Typically, the shortest period a sensor was activated was two-hundred milliseconds.
Wavetronix Wavetronix’ sensors were mounted on roadside hardware and along the side of the ramp. The two sensors tested have different modes of operation and provide different types of information. The SmartSensor Advance measures the queue directly and the SmartSensor HD counts vehicles entering the queue. These two approaches are analogous to the two approaches used by the Sensys sensors.

- 10 -
Figure 5. Wavetronix SmartSensor Advance and SmartSensor HD
Wavetronix SmartSensor Advance – Queue Length The Wavetronix SmartSensor Advance was mounted in a forward-firing mode to detect traffic departing from the sensor as shown in Figure 6. Wavetronix SmartSensor Advance Detection Area. It uses microwave RADAR to measure how far vehicles are from the sensor. The sensor tracks vehicles as they move through the queue. The sensor detects slow-moving vehicles and outputs contact closure alerts for the zones where vehicles are moving slower than a predefined threshold, indicating a queue has reached a certain length. The sensor output was monitored to collect the data. The approximate range covered by this sensor is shown in Figure 6.
Figure 6. Wavetronix SmartSensor Advance Detection Area.
Wavetronix SmartSensor HD – Count Data The Wavetronix SmartSensor HD is a side-fire microwave sensor that can detect from one to ten lanes of traffic. The Wavetronix SmartSensor HD sensor was installed on a light standard adjacent to the roadway. This location has a clear perpendicular view of the subject lanes. The sensor was placed so that it viewed vehicles at the same point as the Sensys sensor array. The sensor’s detection area is shown in Figure 7. Wavetronix SmartSensor HD Detection Area.

- 11 -
Figure 7. Wavetronix SmartSensor HD Detection Area
Traffic Data Collection
Baseline Data Collection and Verification Baseline data was collected with manual observations and review of video from one of two videos recorded during the data collection periods. When it was available, video from the RTMC camera was used. For the times when that camera needed to pan away to view the mainline or was otherwise not available, video from a camcorder set on top of the control cabinet was used.
Baseline Queue Length Measurement The ramp was marked with temporary paint every 50 feet along the length of the ramp. Manual observations of the queue length were taken every 15 seconds. The manual observations were taken to 25-foot precision.
Baseline Count A manual count was done for each test period by manually reviewing the video. As each vehicle passed the location on the ramp where the Wavetronix SmartSensor HD and Sensys Count Array were installed, a record was made including a time stamp and some information about the type of vehicle. Three “lanes” were used to manually count the vehicles. If a vehicle was alone and in the middle of the ramp, it was logged in the middle “lane.” If a solitary vehicle was clearly outside this middle “lane,” the vehicle was recorded as being in either the left or right lane. This aided matching vehicles to the sensor data sets.
Sensor Calibration Calibration is a major consideration for producing accurate results for the evaluation. The sensors were calibrated as recommended by the manufacturers. Before the system was tested with live traffic, some initial testing was done to verify that each of the detectors was calibrated properly and would record usable data.
Test Conditions
Traffic Level Test Conditions Data was collected for three two-hour afternoon peak periods. Mn/DOT personnel varied the metering rate from approximately 2-15 seconds per vehicle so that a queue formed along the length of the ramp as specified in the test requirements.

- 12 -
Test 1 (Two 2-Hour Periods) During the first testing period, the ramp meter timing was manually adjusted so a consistently long queue formed. The queue extended past the point where the count sensors were positioned. This tested whether the count sensors can accurately count vehicles at stop-and-go queuing speeds.
Test 2 (One 2-Hour Period) For the second test, ramp meter timing was adjusted to alternate long and short queues. The queue varied throughout the testing period to measure how well the systems respond to changes in the queue.
Evaluation Considerations The following items were identified as important criteria for selecting a sensor: • Comparison to Existing Loop Detectors - The ability of the sensor systems to report
accurate and precise queue lengths is one of the main components of the evaluation. The systems need to be able to determine queue lengths better than existing loop detectors, otherwise they aren’t offering a viable alternative.
• Ease of Installation/Calibration - The ease of installation and calibration of each of the sensor systems was evaluated. All of the sensor systems being evaluated in this test require hardware to be mounted to nearby poles or other infrastructure. This flexibility in mounting to existing infrastructure was evaluated.
• System Capital Cost - The system cost varies depending on the size of the ramp and the chosen technology. Costs have been developed for a typical ramp (500 feet). Lifecycle costs have also been estimated.
• Maintenance Issues - Although each of the systems tested for this evaluation is claimed to be maintenance-free, these claims were evaluated throughout the test period. Issues such as surge suppression and battery performance were also evaluated.
• Expandability to Other Ramps - The ability for the selected detection methods to be ported to other ramps is important. The suitability for each system to be used on a short ramp, long ramp, or a folded diamond or clover leaf ramp has been evaluated.
• Other Evaluation Considerations - Other issues that have been introduced in project team meetings, such as, the ability to mount the sensors on sloping ramps and the potential for interference with other radio systems, such as 2.4 GHz radios, have been investigated.
- 13 -
4. SENSOR INSTALLATION This section documents and evaluates the design and installation process. All the sensors were installed in one day with some additional time for configuration and calibration. Representatives from both sensor manufacturers and their local vendors were on hand to assist with installation.
Lane Closure In order to facilitate the installation, a lane closure was performed. Only one of the two lanes of the ramp was closed at any one time so that the ramp did not have to be completely shut down. The lane was closed to allow room for the Sensys sensors to be installed in the pavement and for some of the roadside equipment to be safely attached to roadside poles. Additionally, one of the left turn lanes on Cretin Avenue was closed to limit vehicles to only one lane. These precautions were necessary and sufficient for the installation contractor to complete the installation work. Many applications of Wavetronix sensors would not require a lane to be closed, but this depends on the site geometry.
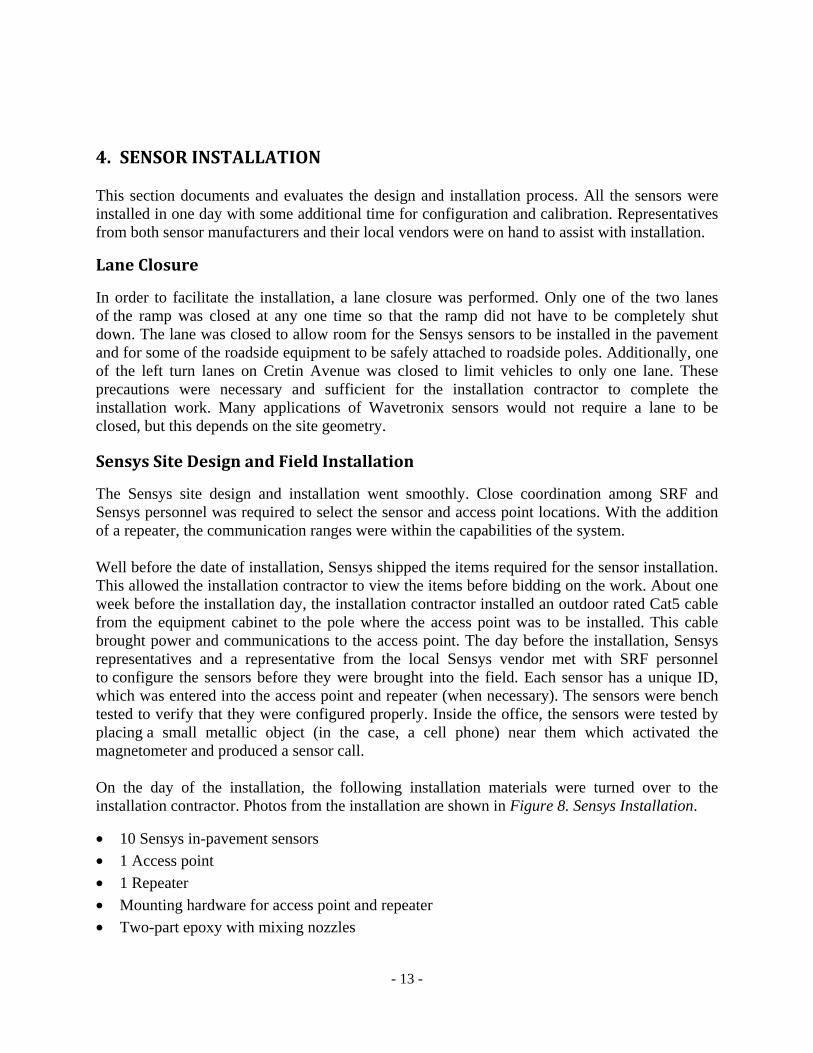
Sensys Site Design and Field Installation The Sensys site design and installation went smoothly. Close coordination among SRF and Sensys personnel was required to select the sensor and access point locations. With the addition of a repeater, the communication ranges were within the capabilities of the system. Well before the date of installation, Sensys shipped the items required for the sensor installation. This allowed the installation contractor to view the items before bidding on the work. About one week before the installation day, the installation contractor installed an outdoor rated Cat5 cable from the equipment cabinet to the pole where the access point was to be installed. This cable brought power and communications to the access point. The day before the installation, Sensys representatives and a representative from the local Sensys vendor met with SRF personnel to configure the sensors before they were brought into the field. Each sensor has a unique ID, which was entered into the access point and repeater (when necessary). The sensors were bench tested to verify that they were configured properly. Inside the office, the sensors were tested by placing a small metallic object (in the case, a cell phone) near them which activated the magnetometer and produced a sensor call. On the day of the installation, the following installation materials were turned over to the installation contractor. Photos from the installation are shown in Figure 8. Sensys Installation. • 10 Sensys in-pavement sensors • 1 Access point • 1 Repeater • Mounting hardware for access point and repeater • Two-part epoxy with mixing nozzles

- 14 -
• Cabinet hardware with Ethernet breakout card • Core drill bit (loaned by Sensys)
Figure 8. Sensys Installation
The core-drilling and sensor installation went as planned. The locations for each sensor were pre-marked with marking paint after the lane closure. The installation contractor had seen a video of the installation of a Sensys sensor at the pre-bid meeting. The installation contractor brought drilling equipment. While Sensys claimed that a sensor could be installed in five minutes, the installation of each sensor averaged about fifteen minutes. Some time was saved by additional personnel helping fill the core-drilled holes with epoxy. Overall, the process could have been done more quickly, but proper installation was paramount and the installation contractor did not

- 15 -
race to finish the job. Sensys’ claims of a five-minute installation could be realized if all items were prepared beforehand and an experienced contractor performed the installation. After completing the installation, the sensors were each tested to make sure they were properly communicating with the access point. The Sensys representative made a minor change to the sensor setup to complete the installation. Because the sensors self-calibrate, no additional work was needed. Throughout the installation process, much of the configuration was done by the Sensys representative. Training is required to configure the sensors. A local representative for Sensys is being trained and would be able to assist in future installations.
Wavetronix SmartSensor HD Site Design and Field Installation The design and installation of the Wavetronix SmartSensor HD sensor went smoothly. Several possible sensor mounting locations were shown to Wavetronix from which they selected a light standard and recommended a mounting height of 12 feet. Before the day of installation, the installation contractor installed a multiconductor cable from the equipment cabinet to the location where the sensor would be mounted. The installation and calibration of the Wavetronix SmartSensor HD was completed within an hour. The sensor was mounted and connected to the cable that ran back to the equipment cabinet. The sensor was calibrated by the Wavetronix representative using both free-flow and queued traffic conditions. Because this sensor counts vehicles and has an automatic configuration capability, it was relatively easy to calibrate and test the sensor. The Wavetronix representative spent less than thirty minutes configuring the sensor and no additional configuration was needed for this sensor.
Wavetronix SmartSensor Advance Site Design and Field Installation The Wavetronix SmartSensor Advance is a forward-firing sensor that can monitor either oncoming or departing traffic. For this project, the sensor was installed to view departing traffic so that the sensor could see the last vehicles in the queue. If the sensor is mounted in front of the queue, a tall vehicle could potentially block the sensor from detecting vehicles behind it. The installation and calibration was more involved than the HD model, due to an unforeseen consequence of using the sensor in a new application. The initial physical installation of the sensor was easily done. The sensor was simply pointed at the traffic lanes and then rotated so that the top of the sensor was parallel to the center stripe if viewed from behind the sensor. This sensor alignment procedure is not common for non-intrusive sensors, but should not pose a problem for a competent installer. The sensor was installed on an RTMC camera pole at a height of 20 feet. The Wavetronix SmartSensor Advance installation is shown in Figure 9. Wavetronix SmartSensor Advance Installation and Aiming.

- 16 -
Figure 9. Wavetronix SmartSensor Advance Installation and Aiming
Once the sensor was installed, the Wavetronix representative initially thought that the sensor was broken, so a replacement sensor was later installed. This sensor also did not function properly. After returning to their office, Wavetronix engineers discovered that the sensor firmware was not able to track vehicles moving away from the sensor. A modification was made to the sensor software and firmware and this was uploaded to the sensor to make it perform correctly. Wavetronix coordinated with the local vendor to capture data which was used to calibrate the sensor. A significant amount of effort was taken by Wavetronix to calibrate the SmartSensor Advance. Wavetronix personnel could not be onsite for this calibration effort, so the vendor and SRF personnel coordinated to capture data and video which could be sent back to Wavetronix for further calibration. Through a few iterations of this calibration process, Wavetronix sent a finalized sensor configuration file. These configuration settings performed well, although it is possible that if Wavetronix personnel could have been onsite for further calibration, the sensor could have performed even better.

- 17 -
5. SENSOR INTEGRATION Besides the physical installation of the sensors, effort was needed to integrate the sensors into the RTMC’s traffic management infrastructure. The challenges encountered raise some concerns about installing sensors on certain ramp configurations. While all the sensors functioned well on the short, straight ramp at the Cretin Avenue test site, some considerations must be made for longer ramps and ramps with sharp curves, such as a clover leaf interchange. This section further details these issues
Physical Integration
Sensys Networks For both the Sensys count array and queue length configurations, the sensors, access point and repeater must be positioned so that all devices are able to communicate properly. Both the access point and repeater have the ability to communicate directly with sensors. In the simplest scenario, the access point is close enough to communicate directly with all the sensors and a repeater is not needed. The access point can communicate directly with sensors up to approximately 150 feet away. Some ramp installations may be problematic if existing poles are not available to mount the repeaters and access point within the distance limits. In order to obtain maximum communication range, the sensors were mounted flush with the pavement surface and the access point must be oriented so that it is facing the sensors. It is possible to mount the sensor slightly lower than the pavement surface such that the top of it is covered with epoxy, but the communication range is reduced. Mounting the sensor in this way could protect the sensor, but is not necessary because the sensor has a very durable polypropylene cover. In the installation done for this project, the sensors were covered with a very thin film of epoxy. The access point should be oriented towards the sensors that are furthest away to assure good communications with them. However, the access point is not completely unidirectional and can communicate with sensors that are perpendicular to the orientation of the access point (or even behind it) as long as the sensors are close to the access point. Another way to attain better communication with the sensors is to mount the access point or repeater very high. The access point for this project was mounted at 25 feet. The higher the access point is mounted, the more likely the radio waves from the sensor will be able to exit the sensor through the top instead of the side where they would have to travel through dense pavement. If a repeater is used, the placement of the sensors, access point and repeater must be designed so that the sensors are between the access point and repeater with the access point and repeater generally oriented directly at one another. In this way, the repeater and access point communicate with the sensors that are assigned to them and the repeater and access point communicate directly. The maximum range for the repeater/access point pair is 1,000 feet, although other configurations could be done by linking multiple repeaters.

- 18 -
For the count array application, the sensors are located very close to one another so a single access point could communicate directly with all of them. The access point must be mounted on a roadside pole. Depending on the configuration of the ramp, existing poles may not be in appropriate locations and new poles would need to be installed. Existing poles were available at the Cretin Avenue test site. From the access point, a Cat5 cable was run to the nearby ramp control cabinet through existing conduit. This cable supplies power and Ethernet communications to the access point. The Cat5 cable is subject to the Ethernet length restriction of 328 feet, so an additional equipment cabinet and hardware would have been needed if the current equipment cabinet is not in a location suitable to meet this length limit. For the queue length application, communication distances may be more problematic depending on the desired location for the sensors. For this project, six sensors were used for queue length information. Since the sensors were only 50 feet apart, the access point communicated with three of them and the repeater communicated with the other three. The access point and repeater were on opposite sides of the road about 500 feet away from each other. As was discussed in a project team meeting, sensor spacing of 100 feet or only at critical locations of the ramp may be adequate depending on the ramp geometry and operational characteristics.
Wavetronix Both the Wavetronix SmartSensor Advance and SmartSensor HD must be connected to the equipment cabinet via a multiconductor cable. A surge suppressor is installed at the base of the pole. At the equipment cabinet, the multiconductor cable was connected to a card that fit in a standard card file which was then connected to the controller.
Wavetronix SmartSensor Advance The sensor performs best when it is located directly in line with the queue. The sensor was developed to be integrated into a signal system where it would be mounted on a signal mast arm to view approaching vehicles. For this project, the sensor was mounted on a camera pole that was 50 feet from the ramp. This oblique angle was not preferable, but the objective of getting the sensor high up and far enough back to view queuing traffic was reached. Despite this suboptimal sensor placement, the sensor performed well in most cases. It is expected that mounting the sensor closer to the ramp, while still maintaining a good view of the queue, would result in improved performance.
Wavetronix SmartSensor HD The Wavetronix SmartSensor HD is a side-firing sensor that can be located wherever it is desirable to get count information. The sensor needs to be mounted on a pole at a height of approximately 10-25 feet depending on how far it is offset from the road. For this project, the sensor was mounted to a light standard that was approximately five feet from the road. The sensor was mounted perpendicular to the road and oriented towards the center of the roadway at a height of 12 feet.
Data Integration Each of the sensor systems pass data to a controller with a different method. This section documents how data was collected and how data could be used with further integration with Mn/DOT’s IRIS ATMS software.

- 19 -
Sensys Networks For this test, the Sensys access point automatically stored and transmitted data to Sensys’ centralized data hosting platform over a GPRS cellular modem. The data, including per vehicle event data, was available from their website and telnet server. The event data contains an entry for each sensor activation and deactivation and some “watchdog” entries to verify that the sensors are functioning properly. Each of the event entries contains three pieces of information: sensor ID, time in EPOCH format, and a status code. A status code of “1” means that the sensor has been activated. A status code of “0” means that the sensor has been deactivated. A status code of “2” means the system sent a watchdog packet. The following is some sample event data that was captured from a telnet server running Sensys’ EVENTPROXY application:
Sensor ID
Time in EPOCH Format Status Parsed event
0002 1203518221 1 Sensor 2 activated at 8:37:01.000 AM 0003 1203518221 1 Sensor 3 activated at 8:37:01.035 AM 0002 1203518221 0 Sensor 2 deactivated at 8:37:01.326 AM 0003 1203518221 0 Sensor 3 deactivated at 8:37:01.475 AM 0002 1203518264 1 Sensor 2 activated at 8:37:43.920 AM 0003 1203518266 1 Sensor 3 activated at 8:37:45.576 AM 0001 1203518267 1 Sensor 1 activated at 8:37:46.871 AM 0002 1203518267 0 Sensor 2 deactivated at 8:37:47.102 AM 0003 1203518267 0 Sensor 3 deactivated at 8:37:47.381 AM
Table 2. Sensys Data Captured from EVENTPROXY
For future implementation into IRIS, it was discussed that it would be preferred to establish Ethernet connectivity to the sensor instead of the cellular modem. Mn/DOT staff would work with Sensys to identify a protocol that could be integrated with IRIS. Sensys can send information in non-proprietary formats that could be parsed by IRIS.
Wavetronix SmartSensor HD As is done with the Wavetronix SmartSensor 105 elsewhere in the Twin Cities Metro Area, Mn/DOT can poll the Wavetronix SmartSensor HD to get binned data through a serial connection. Depending on what hardware is available, this connection could be made over Ethernet. Because Mn/DOT has already conducted the effort to poll Wavetronix sensors, it will be easy to integrate this sensor into IRIS.
Wavetronix SmartSensor Advance The Wavetronix SmartSensor Advance functions much differently than the HD sensor and will require a workaround and some additional integration to get data into IRIS. The sensor outputs up to four contact closures, so this sensor will need to be connected to a controller in the equipment cabinet that has connectivity to IRIS. The controller would pass along occupancy data to IRIS. IRIS would interpret the occupancy of a given (contact closure) alert as a certain queue length. For example, the sensor could be configured so that Alert 1 is activated if the queue is at least 100 feet, Alert 2 is activated if the queue is at least 200 feet, Alert 3 is activated if the queue

- 20 -
is at least 300 feet, and Alert 4 is activated if the queue is at least 400 feet. If the simulated “occupancy” value of only Alert 1 is above a predetermined threshold, such as 80%, the queue would be reported to be between Alert 1 and Alert 2. Half the distance between these zones would be 150 feet, which would be used as the queue length. Similar computations could be made for other cases. If there was a case where the further back zones were deemed occupied, but the closer ones were not, the further back zones should take precedence. While this concept is relatively simple, it is a unique use of occupancy data. Note that Wavetronix now offers a programmable controller that can be added to the system so the sensor will output data using Wavetronix protocol. This product was not available at the time of this evaluation. The addition of this module would allow up to eight zones to be used to determine queue length. This new product should make integration easier because it could interface directly with Mn/DOT’s IRIS software without involving the controller.

- 21 -
6. EVALUATION RESULTS This section presents the evaluation findings for the project. This section contains documentation of the accuracy and precision findings, cost information, maintenance information, expandability findings and other considerations discussed at project team meetings.
Sensor Performance All of the sensors provided generally accurate data, but because their queue detection methods differ, it is difficult to compare them head-to-head. The two methods that count vehicles entering the ramp generate queue length estimates that become less accurate over a metering period because the counting errors accumulate over time. The two methods that directly measure the queue do not have this problem because they are directly measuring the queue in real time. The count systems’ queue estimates are most accurate just after a “reset point,” such as an empty or completely filled queue. If the count stays accurate, the queue estimate will be accurate. In discussion with the project team, it was decided that the detection system’s estimate must remain within 50 percent of the ramp’s capacity for at least 30 minutes in order to remain effective. This result was determined by conducting a rudimentary sensitivity analysis with variables of count accuracy and metering rate. If the count has consistent errors, over time the queue accuracy will diminish until either a reset point is achieved or the queue estimate is erroneous enough to cause unacceptable wait times. This section includes objective sensor performance. The sensors are subjectively compared in the section related to system expandability and the Sensor Comparison Matrix.
Sensys Count Array The Sensys count array performed generally well, especially in free-flow traffic conditions. A few specific problems were noted related to undercounting vehicles, but this was often a due to a combination of the algorithm used to process the data and the instances when the sensor was stuck “on.” In free flow conditions, the sensor data and algorithm used to process the sensor performed close to 100% accuracy. Because sensor activations occurred sequentially and could be easily parsed by the algorithm, the processed sensor data closely reflected the actual traffic. However, most of the data that was captured was in stop-and-go conditions and a few problems with how the sensors functioned caused errors. One type of error was introduced because large trucks that are stopped over the sensor register two detections, one for each set of axles. This error is relatively insignificant for most ramps, although this ramp experiences a high volume of truck traffic from the industrial park north of I-94 near the Cretin Avenue test interchange. Another minor issue occurred when sensors erroneously held the “on” signal past the time when the vehicle passed the sensor. In most cases these errors cleared when the next vehicle passed the sensor

- 22 -
Despite these minor errors, the sensor was still within 10% for 1-minute interval absolute average error over a two-hour time period and within 3% for a 15-minute interval absolute average error over the same period. This indicates that there was some overcounting and some undercounting. Data from an example test period is shown in Figure 10. Scatter Plots of Manual Count vs. Sensys Count. The first graph shows a bubble scatter plot of the distribution of manual vs. Sensys counts for each one-minute interval over the two hour period. If the sensor counted exactly correctly, the points would all fall along the diagonal line. For example, if there were 10 vehicles (manually counted) in the one minute interval, the sensor should also report that there were 10 vehicles and a point would be plotted at (10,10). Any variation from the line is due to sensor error. The bubble scatter plot on the left side shows a large dot where data points occurred multiple times. The other graph shows sensor performance over the 15 minute intervals. Seven intervals are shown over the two-hour period. One interval was not used because manually-collected data was not available for the entire interval.
Figure 10. Scatter Plots of Manual Count vs. Sensys Count
Wavetronix SmartSensor HD The Wavetronix SmartSensor HD also performed generally well, although the stop-and-go traffic that it was subjected to also presented challenges to the sensor. Because the sensor processes the data and reports its findings, it is more difficult to determine why the sensor had some errors, but the errors that were found were very comparable to the Sensys Count Array. There was no general undercounting or overcounting trend, but the sensor did perform much better with free-flow traffic than stop-and-go traffic. In other studies that have focused on free-flow traffic, the sensor generally performs within 0-3% error. In this study where the sensor was mostly subjected to stop-and-go traffic, the sensor was within 14% for 1-minute interval absolute average error over a two-hour time period and within 3% for a 15-minute interval absolute average error over the same period.

- 23 -

- 24 -
As with the Sensys data, an example period is shown in Figure 11. Scatter Plots of Manual Count vs. Wavetronix SmartSensor HD Count. The first graph shows a bubble scatter plot of the distribution of manual vs. Wavetronix SmartSensor HD counts for each one-minute interval over the two hour period. The other graph shows sensor performance over the 15 minute intervals. The analysis used for these graphs is explained in the previous section.
Figure 11. Scatter Plots of Manual Count vs. Wavetronix SmartSensor HD Count
Sensys Queue Length Sensors Overall, the Sensys queue length sensors performed very well, providing accurate queue length data. Sensor precision is dictated by their spacing along the ramp. In this case, the spacing and precision was 50 feet. The queue was manually recorded every 15 seconds and the sensor queue length was recorded every tenth of a second, but then aggregated to every second to ease analysis. The average error for the entire data collection period was -14.7 feet. This means that on average, the sensor underestimated the queue by about 15 feet. The average of the absolute value of the error was 30.7 feet. This is excellent compared to the system’s precision of 50 feet. A graph of manually-collected queue length and sensor queue length is presented in Figure 12. Queue Length Comparison – Manual vs. Sensys. The graph shows how the Sensys sensors compared to the manual measurement over the testing period. While a perfect sensor would match the manual data exactly, it is evident that the sensor does a very good job of reading the queue length.
Wavetronix SmartSensor Advance The Wavetronix SmartSensor Advance’s performance was very good considering that the sensor reports queue length in four steps. The sensor can be configured to have up to eight alerts, but the hardware limits the alerts to four contact closures. Also, because the only output that the hardware can give are contact closures, the type of data that can be taken from the sensor is

- 25 -
limited. With these limitations in mind, the sensor was set up to give alerts when a certain threshold for speed was met. After carefully calibrating the sensor as described earlier, the sensor performed very well. The average error was 9.2 feet and the absolute average error was 36.1 feet. Some smoothing was done to soften the transition areas between alerts. The alerts were set at 100 feet, 200 feet, 250 feet and 275 feet. When the queue was midway between alerts, the sensor would often vacillate between alerts. Because there are only four alerts, this accounted for a significant amount of the total duration. However, by smoothing the data, the transition is more gradual. Several smoothing intervals were considered, but excellent results were obtained by averaging the 10 seconds before and after each data point. Figure 13. Queue Length Comparison – Manual vs. Wavetronix Advance compares the Wavetronix SmartSensor Advance data to the manually collected queue length.
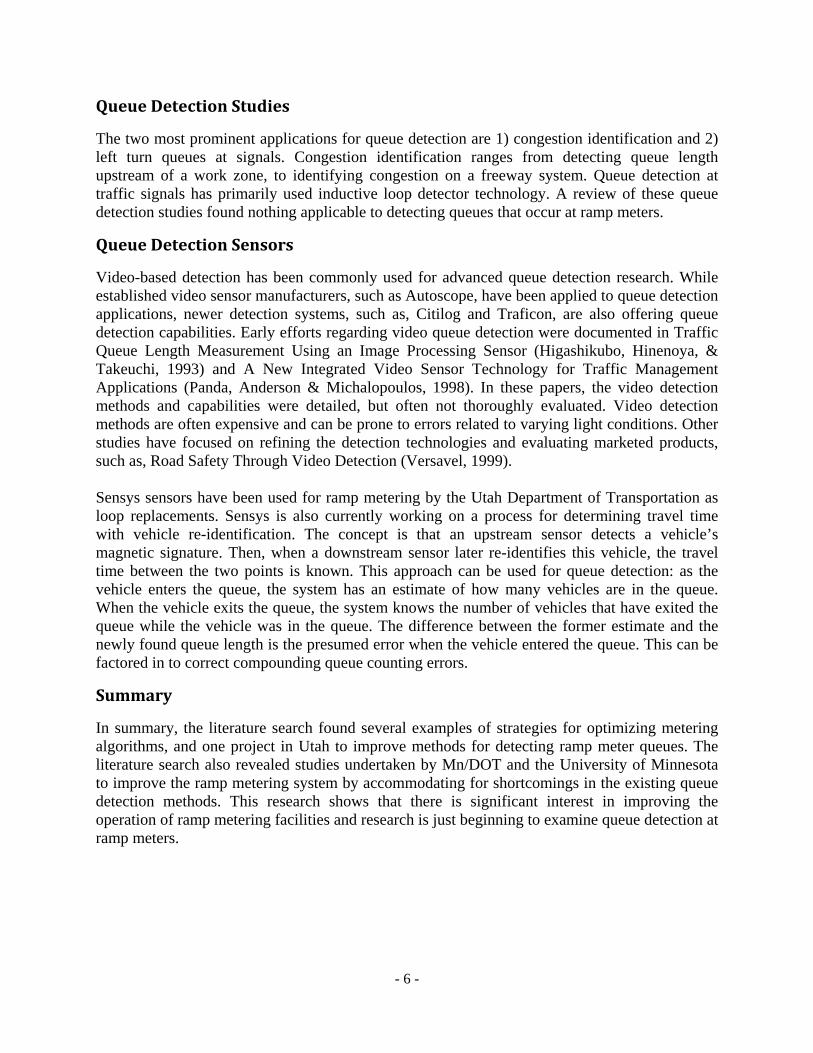
Current Loop Detection System Count data from the existing entrance loop detectors at the Cretin Avenue ramp was compared to the manual observations. This data showed that the absolute average error for the loop detectors is about 12 vehicles per 15-minute period, which is about 9.5% error for a peak hour with stop-and-go congested conditions created for this test. This is about three times worse than the alternative count methods evaluated by this project. The loops generally undercounted vehicles. A scatter plot of this data is shown in Figure 14. Scatter Plot of Manual Count vs. Loop Detectors.

- 26 -
Figure 12. Queue Length Comparison – Manual vs. Sensys
Figure 13. Queue Length Comparison – Manual vs. Wavetronix Advance
- 27 -
Figure 14. Scatter Plot of Manual Count vs. Loop Detectors
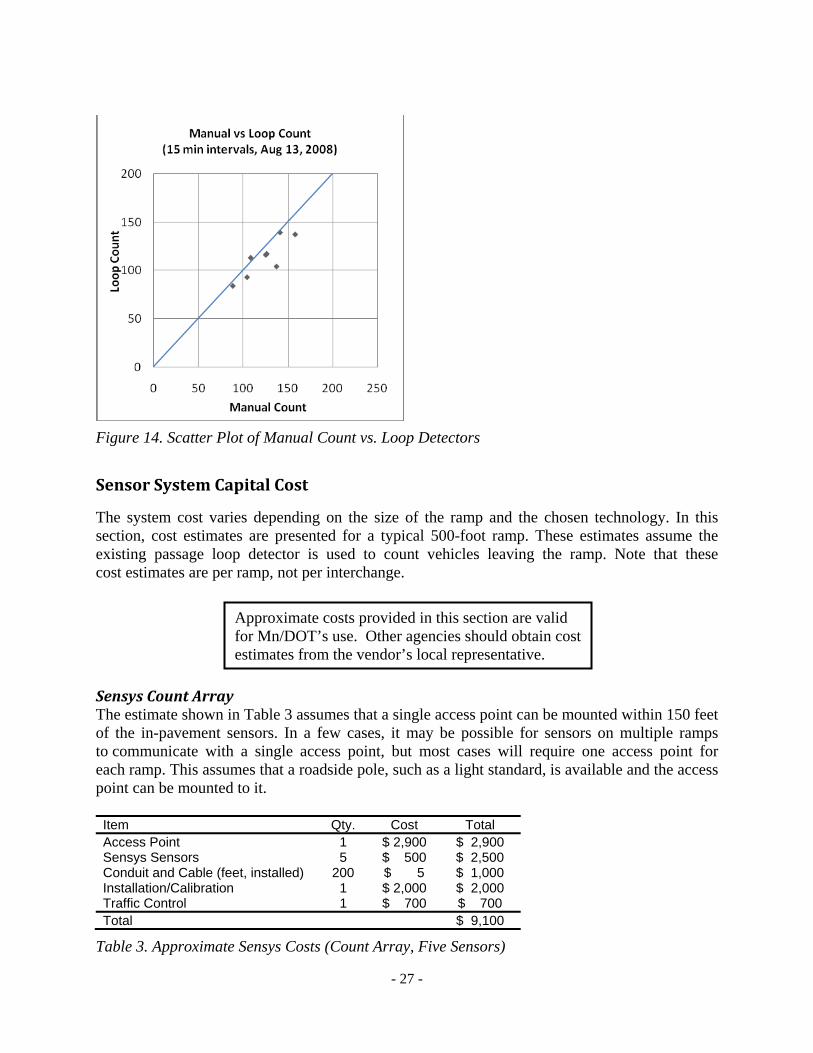
Sensor System Capital Cost The system cost varies depending on the size of the ramp and the chosen technology. In this section, cost estimates are presented for a typical 500-foot ramp. These estimates assume the existing passage loop detector is used to count vehicles leaving the ramp. Note that these cost estimates are per ramp, not per interchange.
Sensys Count Array The estimate shown in Table 3 assumes that a single access point can be mounted within 150 feet of the in-pavement sensors. In a few cases, it may be possible for sensors on multiple ramps to communicate with a single access point, but most cases will require one access point for each ramp. This assumes that a roadside pole, such as a light standard, is available and the access point can be mounted to it. Item Qty. Cost Total Access Point 1 $ 2,900 $ 2,900 Sensys Sensors 5 $ 500 $ 2,500 Conduit and Cable (feet, installed) 200 $ 5 $ 1,000 Installation/Calibration 1 $ 2,000 $ 2,000 Traffic Control 1 $ 700 $ 700 Total $ 9,100
Table 3. Approximate Sensys Costs (Count Array, Five Sensors)
Approximate costs provided in this section are valid for Mn/DOT’s use. Other agencies should obtain cost estimates from the vendor’s local representative.

- 28 -
Sensys Queue Length Array The estimate shown in Table 4 assumes a similar sensor configuration as was installed at the Cretin Avenue site with a repeater and access point attached to existing roadside hardware. It is unlikely that multiple ramps could communicate with the same access point because the directionality of the access point and repeater is very important to maintain communications over long distances. Item Qty. Cost Total Access Point 1 $ 2,900 $ 2,900 Repeater (Extended Life) 1 $ 1,400 $ 1,400 Sensys Sensors 3 $ 500 $ 1,500 Conduit and Cable (feet, installed) 200 $ 5 $ 1,000 Installation/Calibration 1 $ 1,600 $ 1,600 Traffic Control 1 $ 700 $ 700 Total $ 9,100
Table 4. Approximate Sensys Costs (Queue Length Array, Three Sensors)
Wavetronix SmartSensor Advance The estimate shown in Table 5 assumes that the sensor can be installed in a location that is suitable for sensing a long distance. In most cases, the ramp would have to be relatively straight to get optimal results. Item Qty. Cost Total SmartSensor Advance 1 $ 4,400 $ 4,400 Conduit and Cable (feet, installed) 200 $ 5 $ 1,000 Installation/Calibration 1 $ 2,400 $ 2,400 Total $ 7,800
Table 5. Approximate Wavetronix SmartSensor Advance Costs
Wavetronix SmartSensor HD This sensor is likely the most flexible when considering mounting locations. The estimate shown in Table 6 assumes that a suitable mounting location can be found on a roadside pole near the area where vehicles would be counted. Item Qty. Cost Total SmartSensor HD 1 $ 5,800 $ 5,800 Conduit and Cable (feet, installed) 200 $ 5 $ 1,000 Installation/Calibration 1 $ 2,000 $ 2,000 Total $ 8,800
Table 6. Approximate Wavetronix SmartSensor HD Costs
Maintenance Issues/Lifecycle Cost Besides the initial cost of implementing a detection system, maintenance costs will also be incurred. While the sensors are generally maintenance-free, some additional cost will be incurred with the replacement of battery powered components and maintaining the system.

- 29 -
The whole life costs for each system assume that the costs for all items are incurred in year 0 and additional costs are incurred as items reach their expected life. The average replacement cost is the Year 0 cost multiplied by 134% (3% compounded annually for 10 years). Salvage and removal costs are considered to be incidental to the installation item. Table 7 shows these costs for a typical 500-foot ramp over a 20-year time horizon.

- 30 -
Item Capital Cost
(Year 0)
UsableLife
(years)
Number of Replacements
in 20 years
Replacement
Cost
Whole LifeCost
(20 years) Sensys Count Array Access Point $ 2,900 10 1 $ 3,886 $ 6,786 Sensys Sensors $ 2,500 10 1 $ 3,350 $ 5,850 Conduit and Cable $ 1,000 20 0 N/A $ 1,000 Installation/Calibration/ Traffic Control $ 2,700 10 1 $ 3,618 $ 6,318 Total $19,954 Sensys Queue Length Array Access Point $ 2,900 10 1 $ 3,886 $ 6,786 Repeater (Extended Life) $ 1,400 8 2 $ 482* $ 1,882 Sensys Sensors $ 1,500 10 1 $ 2,010 $ 3,510 Conduit and Cable $ 1,000 20 0 N/A $ 1,000 Installation/Calibration/ Traffic Control $ 2,300 10 1 $ 3,082 $ 5,382 Total $18,560 Wavetronix SmartSensor Advance SmartSensor Advance $ 4,400 10 1 $ 5,896 $10,296 Conduit and Cable $ 1,000 20 0 N/A $ 1,000 Installation/Calibration $ 2,400 10 1 $ 3,216 $ 5,616 Total $16,912 Wavetronix SmartSensor HD SmartSensor HD $ 5,800 10 1 $ 7,772 $13,572 Conduit and Cable $ 1,000 20 0 N/A $ 1,000 Installation/Calibration $ 2,000 10 1 $ 2,680 $ 4,680 Total $19,252
* Assume battery replacement only.
Table 7. Sensor Lifecycle Costs
Sensys Networks Because some of the components for the Sensys system are battery powered, they require scheduled replacement. The sensors are claimed to last for 10 years. This claim has largely been substantiated by an independent study commissioned by the Victoria Department of Roads (VicRoads) in Australia. This study estimated that the sensor battery would last for 10 years for a lane that receives 3500 vehicles per hour. For comparison, the ramp tested for this project saw less than 600 vehicles per hour during the peak hour in which the sensors were tested. At that

- 31 -
range of volumes the VicRoads study indicates that the sensor’s battery life could be over 20 years. The other Sensys component that is battery-powered is the repeater. A standard Sensys repeater lasts two years. An extended-life repeater is claimed to last eight years. The VicRoads study did not address repeater battery life. Currently, repeaters can only be battery powered, but Sensys is developing a new repeater that can be directly powered. Another issue is that the sensors are mounted flush with the pavement. Although their cases and epoxy preserve the sensor, if a mill and overlay would need to be done on the road, the sensors would have to be replaced. Snow plow blades and traffic are not expected to disrupt the sensors.
Wavetronix Wavetronix advises that the mean time between failures for both of the sensors tested in this project is 10 years.
Expandability to Other Ramps This section shows how the sensors could be implemented at various ramp types.
Short Ramp This type of ramp is similar to the Cretin Avenue test site. The queue length sensors would be installed so that the queue length could be obtained throughout the ramp. Fewer sensors would be needed than were installed at the Cretin Avenue ramp. For a short ramp, it is recommended that sensors be spaced no less than 100 feet. If the specific queuing conditions are known well, the number of sensors could be limited to only two to three defined spots. The Wavetronix Advance could monitor the entire ramp. The best location for the count sensors would be near the ramp entrance before the vehicles have begun to queue. It would be best to choose a location where the traffic has straightened out from its turn onto the ramp from the local street, yet far enough up the ramp that stop-and-go traffic does not backup into the detection zone on a regular basis. The Wavetronix SmartSensor HD is most accurate when vehicles are perpendicular to it, although it can still detect vehicles at an angle. The Sensys count array was also set up to count vehicles moving straight down the ramp. At the location the sensors were installed on the Cretin Ave ramp, some vehicles were still completing their turn as they passed the count array. This caused the detected vehicles to shift as they passed the sensor array. The algorithm was able to track these vehicles in most cases. However, this phenomenon demonstrated the importance of placing the sensor array far enough downstream that these effects are minimized.
Long Ramp For a long ramp, many of the same principles that apply to a short ramp would apply. The count sensors will function much the same. Because there will likely be more room in the ramp for long queues, it is especially important that the queue count be accurate. It is likely that the queue will never back up to where the count sensor is positioned except in the case of the mainline traffic flow breaking down, so there will not be an issue with the sensor needing to detect stop-and-go traffic. The count sensors should be able to provide a very accurate count of vehicles in the queue. Another consideration for a long queue is that the sensor may have to be located farther from the equipment cabinet than is practical in some applications. The installation of an
- 32 -
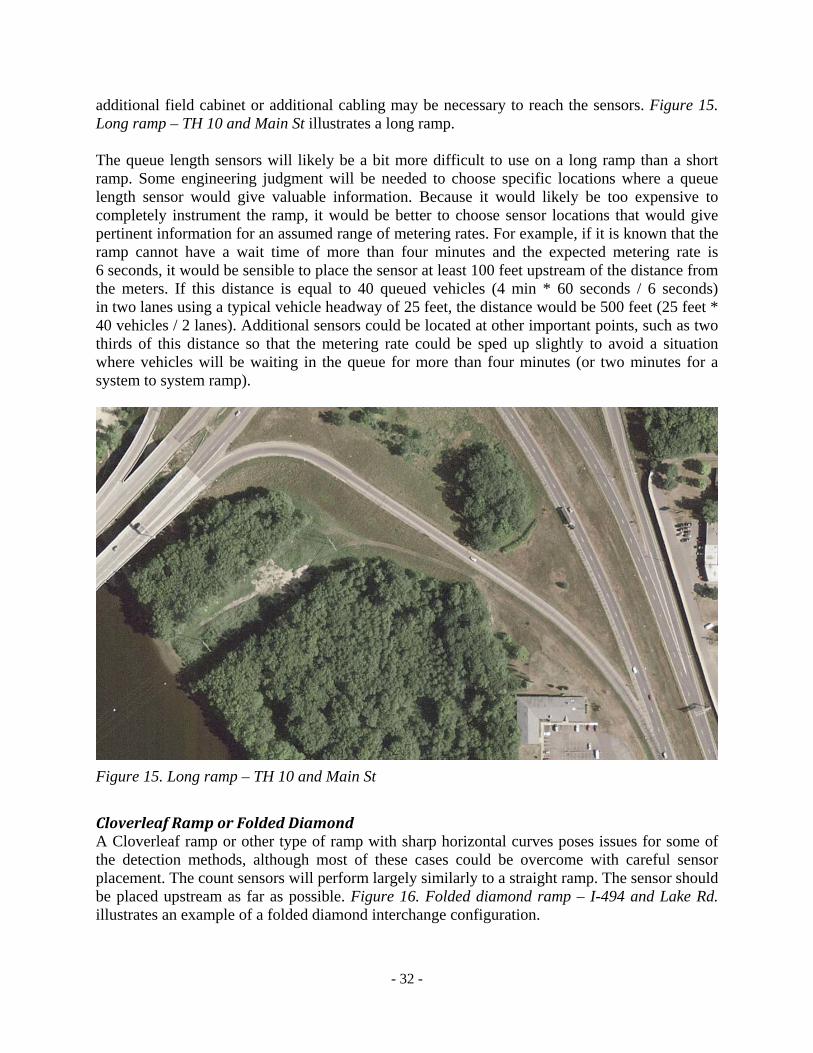
additional field cabinet or additional cabling may be necessary to reach the sensors. Figure 15. Long ramp – TH 10 and Main St illustrates a long ramp. The queue length sensors will likely be a bit more difficult to use on a long ramp than a short ramp. Some engineering judgment will be needed to choose specific locations where a queue length sensor would give valuable information. Because it would likely be too expensive to completely instrument the ramp, it would be better to choose sensor locations that would give pertinent information for an assumed range of metering rates. For example, if it is known that the ramp cannot have a wait time of more than four minutes and the expected metering rate is 6 seconds, it would be sensible to place the sensor at least 100 feet upstream of the distance from the meters. If this distance is equal to 40 queued vehicles (4 min * 60 seconds / 6 seconds) in two lanes using a typical vehicle headway of 25 feet, the distance would be 500 feet (25 feet * 40 vehicles / 2 lanes). Additional sensors could be located at other important points, such as two thirds of this distance so that the metering rate could be sped up slightly to avoid a situation where vehicles will be waiting in the queue for more than four minutes (or two minutes for a system to system ramp).
Figure 15. Long ramp – TH 10 and Main St
Cloverleaf Ramp or Folded Diamond A Cloverleaf ramp or other type of ramp with sharp horizontal curves poses issues for some of the detection methods, although most of these cases could be overcome with careful sensor placement. The count sensors will perform largely similarly to a straight ramp. The sensor should be placed upstream as far as possible. Figure 16. Folded diamond ramp – I-494 and Lake Rd. illustrates an example of a folded diamond interchange configuration.

- 33 -
The queue length sensors can also be implemented on this type of ramp. The Sensys queue length sensors could be fairly easily implemented, but the curve will require the access point and repeater to be carefully placed so that the sensors can communicate with the sensors. The Wavetronix SmartSensor Advance performs best when vehicles are traveling in a straight line to or from the sensor, but it still can detect vehicles at an angle from the sensor. This project did not evaluate what angle is acceptable, so no recommendation can be given about its performance on a horizontal curve. It is likely that the sensor would perform well for a short segment of 150 to 200 feet and this may be all the detection that would be needed for some ramps.
Figure 16. Folded diamond ramp – I-494 and Lake Rd.
Other Considerations This section addresses questions about the sensors that were brought up throughout the project and are not specifically answered by the other evaluation sections. Sensys: Non-ferrous objects – Sensys uses magnetic sensing techniques that cannot detect non-ferrous objects. A very small portion of vehicles in the traffic stream have very little ferrous metal, making them difficult to detect. Loop detectors do not have this limitation. Sensys is conducting further research to develop a method to detect these vehicles.

- 34 -
Wavetronix: Vehicle Occlusion – Occlusion occurs when a large vehicle blocks the line of sight from the sensor to vehicles behind it. While not examined in this study, occlusion is expected to result in some missed detections.
Sensys: Surge suppression – All external Sensys devices have surge suppression. The Sensys devices are electrically isolated such that they do not have a metallic ground path between devices. Additionally, each device is fused with resettable fuses.
Wavetronix: Surge Suppression – It is recommended that Wavetronix surge suppression units be installed in both the cabinet and pole bases. This prevents surges from either the sensor or cabinet end affecting other equipment.

- 35 -
7. SENSOR COMPARISON This section provides comparative results for the four detection methods and standard loop detectors at ramps with poorly defined lanes. Testing was done under stop-and-go traffic conditions.
Sensor Comparison Matrix
Sensys Count Array
Sensys Queue Length
Array
Wavetronix SmartSensor
Advance
Wavetronix SmartSensor
HD Loops
Count Accuracy 3% Error N/A N/A 3% Error 9.5% Error
Queue Length Accuracy
N/A 31 feet 36 feet N/A N/A
Capital Cost
• Most sites would require an access point, repeater, conduit/cabling, and five sensors, incidental hardware ($9,100)
• Variable • Most sites would require an access point, repeater, conduit/cabling, and at least three sensors, incidental hardware ($9,100)
• Sensor and conduit/cabling, incidental hardware ($7,800)
• Sensor and conduit/cabling, incidental hardware ($8,800)
• Two loops, conduit/cabling and detection card ($3,200)
Physical Integrat- ability
• Good • Precise sensor placement is important • Requires existing pole
• Good • Site analysis must be conducted to determine optimal sensor location • Requires existing pole(s)
• Good • Site considerations make placing the sensor on existing pole possibly problematic
• Good • Requires existing pole
• Good • Precise loop placement is important • Vehicle path must be defined
Data Integrat- ability
• Poor • Some work would have to be done with Sensys API to interface with IRIS • Ethernet to the site would be required • Additional work would have to be done to prepare algorithm for
• Good • Some work would have to be done with Sensys API to interface with IRIS, Ethernet to the site would be required
• Marginal • Data could be fed to an existing controller • Data granularity would be limited to controller binning interval
• Good • Could be interfaced directly using Wavetronix protocol Mn/DOT has already developed
• Good

- 36 -
counting vehicles
Sensys Count Array
Sensys Queue Length
Array
Wavetronix SmartSensor
HD
Wavetronix SmartSensor
Advance Loops
Maintain- ability
• Good • Battery powered components need to be replaced
• Good • Battery powered components need to be replaced
• Very good • Limited maintenance required
• Very good • Limited maintenance required
• Very good • “Never Fail” loops have proven to be maintenance-free (15+ years)
Short Ramp Suitability
• Excellent • Excellent • Excellent • Good • Marginal
Long Ramp Suitability
• Excellent • Excellent if a short range is needed to be monitored • Moderate if longer range is needed
• Excellent • Good for a range of up to 300 feet
• Marginal • Errors more likely to compound on longer ramps
Cloverleaf/ Folded Diamond Suitability
• Excellent • Good • May require additional repeaters
• Excellent • Not recom- mended for sharp horizontal curves
• Marginal

- 37 -
8. CONCLUSIONS This project evaluated four innovative methods for queue detection at a metered ramp and examined the viability of expanding these new queue measurement techniques to metered ramps throughout the metropolitan area. These findings verify that viable alternatives are available to improve Mn/DOT’s ability to monitor and react to ramp wait times, allowing Mn/DOT to ensure it is meeting the wait time performance measures while increasing the mainline freeway throughput and efficiency. Because these are novel queue detection methods, some effort was made to truly “exercise” the sensors by subjecting them to challenging traffic conditions. For the count sensors, most of the vehicles passing the sensors were at stop-and-go speeds. Previous research has found that this condition is difficult for sensors to accurately count. Also, the queue detection sensors were subjected to queues that were very rapidly built and discharged. These conditions were introduced to demonstrate the capabilities of the sensors in a challenging operating environment. Most ramps would be less challenging. It was found that all four queue detection methods function accurately. In stop-and-go conditions, the two count systems performed better than the existing loops by 4 to 6%. This improvement in accuracy is enough to provide accurate wait time estimates at most ramps. While loops are easy to integrate into the existing system, past efforts to install them on problem ramps where vehicle paths are not constrained has led to inaccurate results. The two proposed methods solve this issue by detecting vehicles driving anywhere within the lanes. The two methods that directly measure the queue length were able to give results to within 50 feet of the actual queue length. Because these methods are independent of count accuracy, they are always accurate, no matter how much time has passed between “reset points,” such as, the queue emptying or completely filling, or at the end of a metering period. These methods also have a role to play in addressing Mn/DOT’s queue detection needs. Besides accuracy, other factors were examined, such as, cost, extendibility to other ramps, maintainability and integratibility into Mn/DOT’s existing traffic management system. Based on these factors, two sensor systems are recommended for further deployment. Of the count sensors, the Wavetronix SmartSensor HD was recommended for its ease of installation and integration. For queue length determination, the Sensys queue length array is recommended because it accurately determines queue length. These two methods for queue determination (count and queue length) are useful tools for more accurately determining a queue at a variety of ramps.

- 38 -
BIBLIOGRAPHY Feng, B. (2005), “Improving Minnesota’s Stratified Zone Ramp Control Strategy.” Thesis. Department of Civil Engineering, University of Minnesota. Higashikubo, M., Hinenoya, T., & Takeuchi, K., (1993). “Traffic Queue Length Measurement Using an Image Processing Sensor. ITS America. Liu, H., Wu, X. and Michalopolous, P. (2007). “Improving Queue Size Estimation for Minnesota’s Stratified Zone Metering Strategy.” TRB 86th Annual Meeting Compendium of Papers CD-ROM. Minnesota Department of Transportation (2001), “Twin Cities Ramp Meter Evaluation’” Final Report, Minnesota Department of Transportation. Panda, D., Anderson, C., & Michalopoulos, (1998). A New Integrated Video Sensor Technology For Traffic Management Applications.” ITS America. Versavel, J. (1999). “Road Safety Through Video Detection.” Institute of Transportation Engineers.