Embed Size (px)
Citation preview
1/31 CERTS Review, Aug 5-‐6, 2014
Random Topology Power Grid Modeling and Automated
Simulation Platform
Zhifang Wang Virginia Commonwealth University
Robert J. Thomas Cornell University
2/31 CERTS Review, Aug 5-‐6, 2014
Project Objectives
u Complete a comprehensive study of realistic power grid topology and parameters.
u Formulate appropriate random topology power grid models.
u Provide an automated simulation platform enable sufficient testing and verification of
new concepts, methods, and controls in power grids
compatible with MATPOWER
3/31 CERTS Review, Aug 5-‐6, 2014
Motivation of the Project
u Future power engineers and researchers need appropriate randomly generated grid network topologies to do genuine Monte Carlo experiments. Ø If the random networks are truly representative and if the
concepts or methods test well in this environment they would test well on any instance of such a network.
u Current situation
extremely difficult to obtain realistic system data from utilities
limited reference test cases
existing models with shortcomings, i.e. connectivity and scaling property
4/31 CERTS Review, Aug 5-‐6, 2014
Critical Applications for the Grid
• Renewable generation interconnection
• PMU placements to facilitate fast state estimation and real-time state awareness
• Transmission expansion planning
• Grid vulnerability and security analysis • Transient stability controls
• Power market strategy experiments • Smart grid communication infrastructure – especially when the communication network
layout partially or fully overlaps with the grid itself, e.g. power line communication.
5/31 CERTS Review, Aug 5-‐6, 2014
Precursors of our study
• Most of the literature has used one specific real grid or reference models for testing – IEEE 30 57, 118 and 300 bus systems – Power systems test case archive: http://www.ee.washington.edu/research/pstca/
• Scalable models to grasp macroscopic trends – [Parashar and Thorp ’04] ring topology – [Rosas-Casals, Valverde, Solé ’07] tree topology
– [Watts, Strogatz ’98], small-world topology
– Other models
6/31 CERTS Review, Aug 5-‐6, 2014
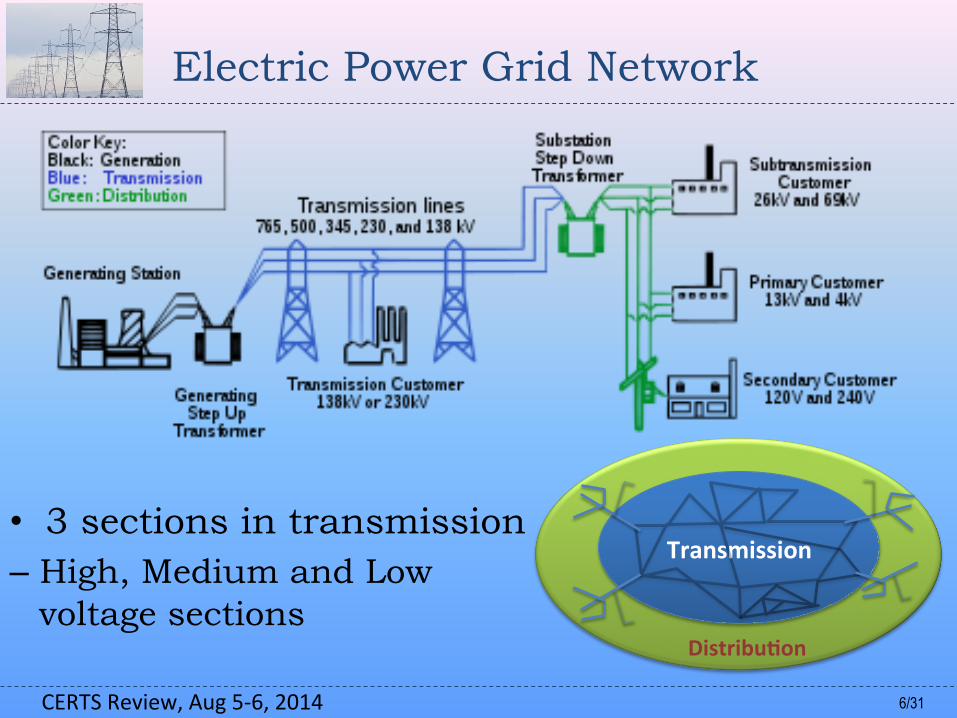
Electric Power Grid Network
• 3 sections in transmission – High, Medium and Low
voltage sections
Transmission
Distribu.on
7/31 CERTS Review, Aug 5-‐6, 2014
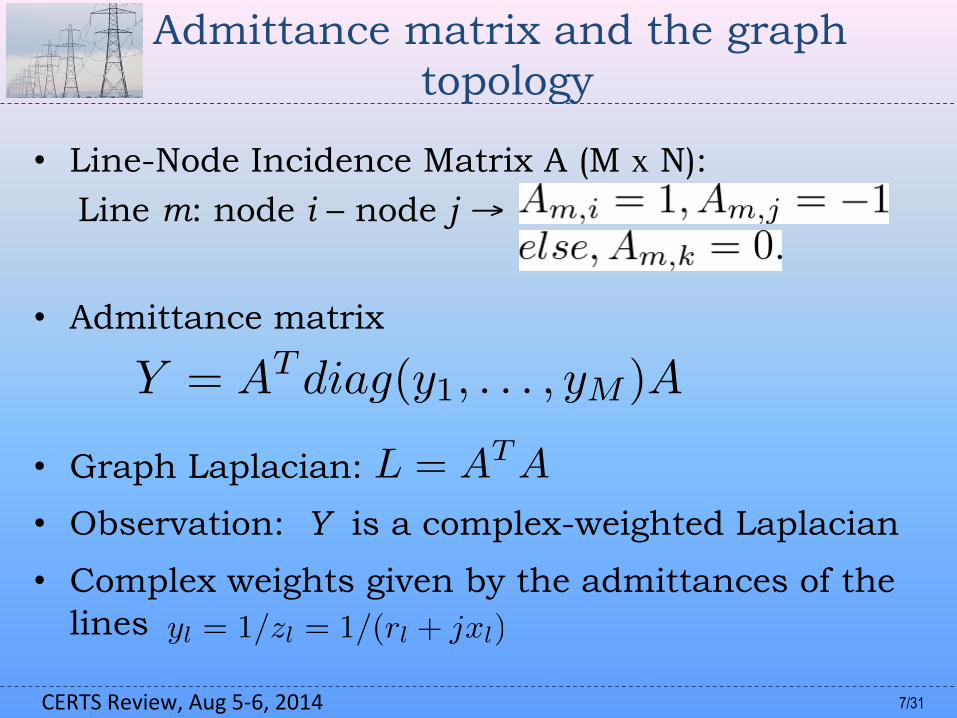
Admittance matrix and the graph topology
• Line-Node Incidence Matrix A (M x N):
Line m: node i – node j →
• Admittance matrix
• Graph Laplacian:
• Observation: Y is a complex-weighted Laplacian
• Complex weights given by the admittances of the lines
Y = AT diag(y1, . . . , yM )A
L = ATA
yl = 1/zl = 1/(rl + jxl)
8/31 CERTS Review, Aug 5-‐6, 2014
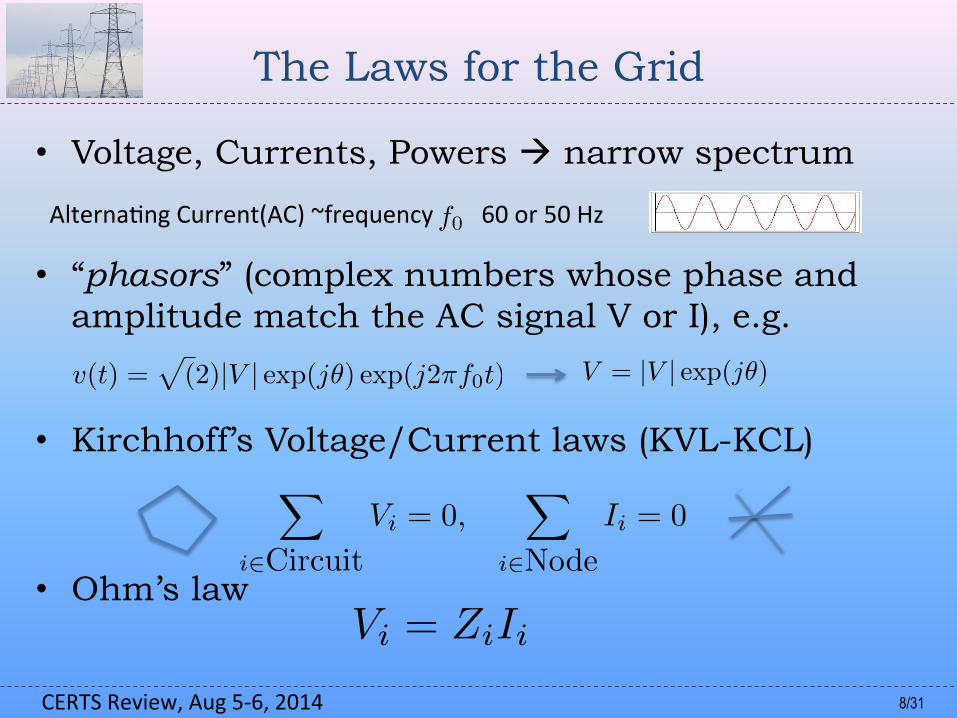
The Laws for the Grid
• Voltage, Currents, Powers à narrow spectrum
• “phasors” (complex numbers whose phase and amplitude match the AC signal V or I), e.g.
• Kirchhoff’s Voltage/Current laws (KVL-KCL)
• Ohm’s law
Alterna;ng Current(AC) ~frequency 60 or 50 Hz
X
i2Circuit
Vi = 0,X
i2Node
Ii = 0
Vi = ZiIi
f0
V = |V | exp(j✓)v(t) =p(2)|V | exp(j✓) exp(j2⇡f0t)
9/31 CERTS Review, Aug 5-‐6, 2014
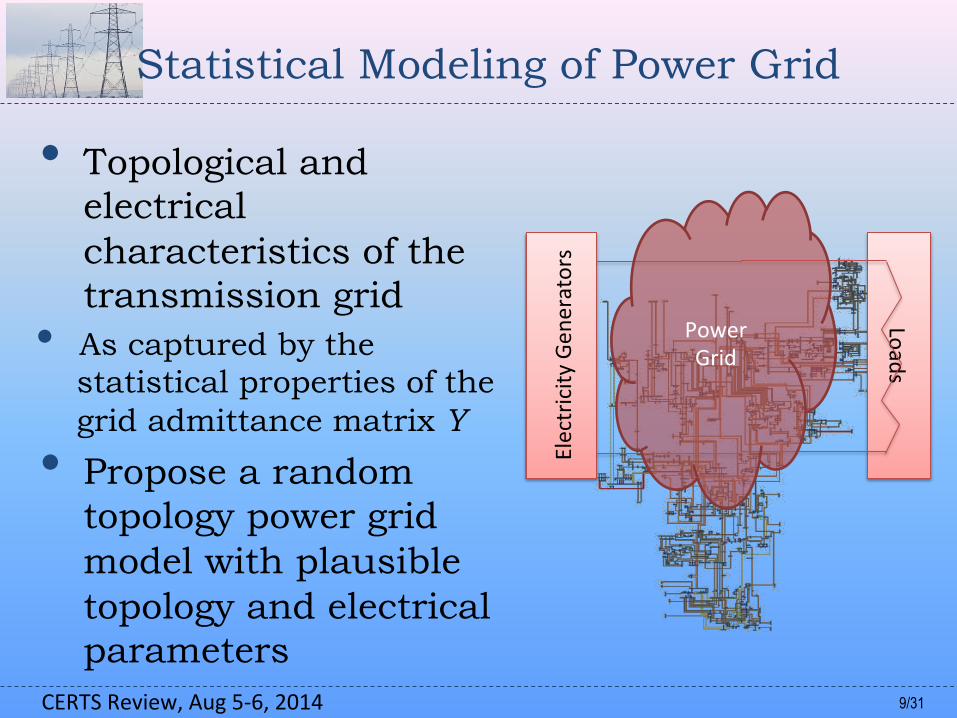
Statistical Modeling of Power Grid
• Topological and electrical characteristics of the transmission grid
• As captured by the statistical properties of the grid admittance matrix Y
• Propose a random topology power grid model with plausible topology and electrical parameters
Electricity
Gen
erators
Loads
Power Grid
10/31 CERTS Review, Aug 5-‐6, 2014
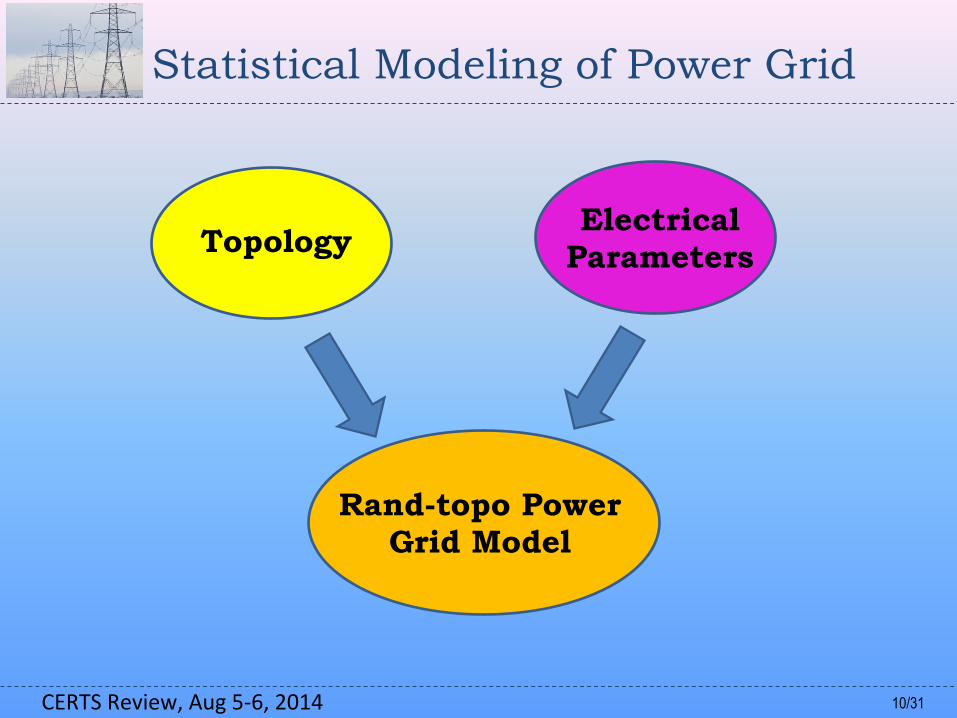
Statistical Modeling of Power Grid
Topology Electrical
Parameters
Rand-topo Power Grid Model
11/31 CERTS Review, Aug 5-‐6, 2014
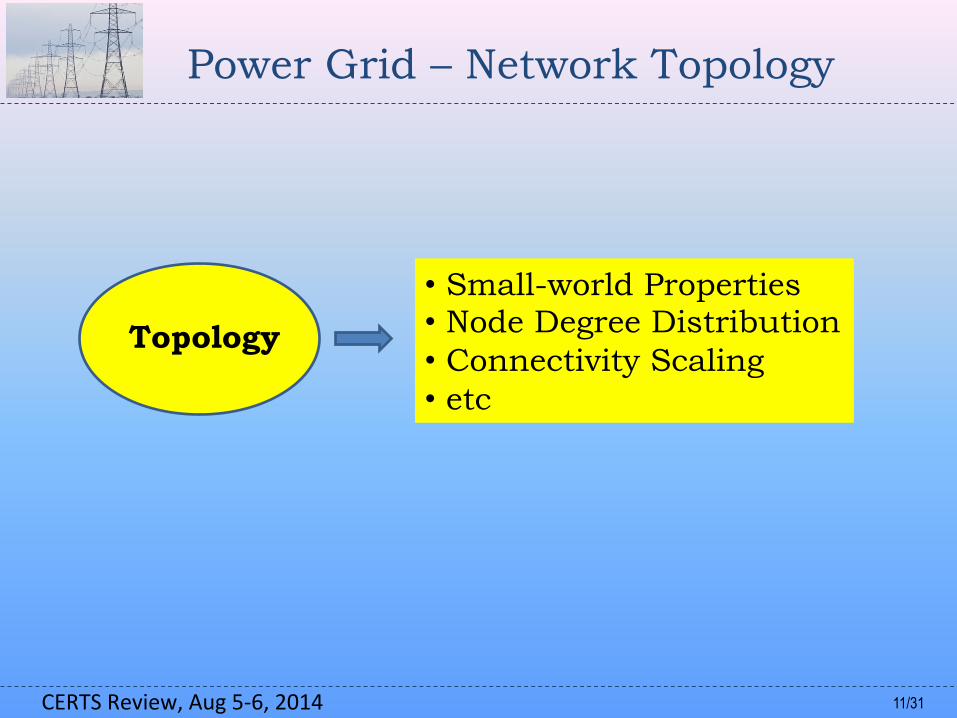
Power Grid – Network Topology
Topology
• Small-world Properties • Node Degree Distribution • Connectivity Scaling • etc
12/31 CERTS Review, Aug 5-‐6, 2014
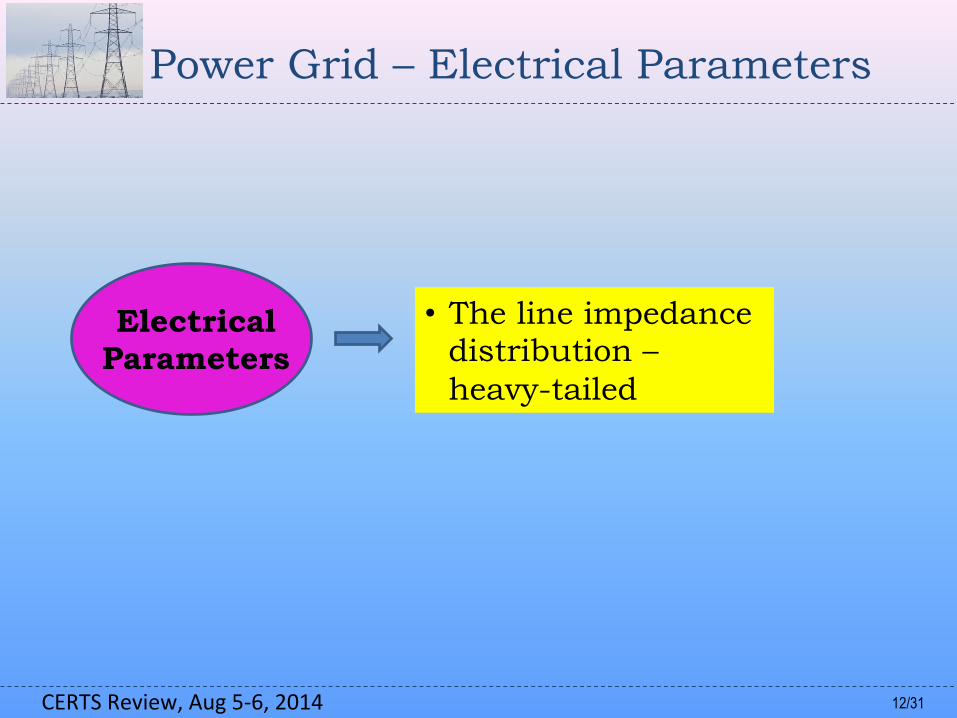
Power Grid – Electrical Parameters
• The line impedance distribution – heavy-tailed
Electrical Parameters
13/31 CERTS Review, Aug 5-‐6, 2014
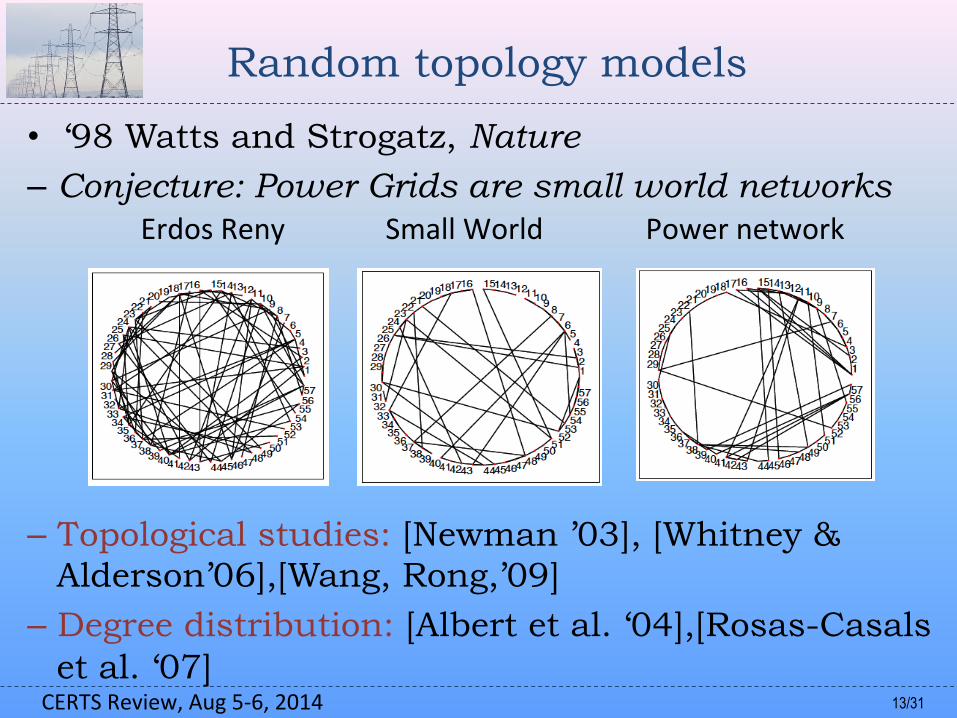
Random topology models
• ‘98 Watts and Strogatz, Nature
– Conjecture: Power Grids are small world networks
– Topological studies: [Newman ’03], [Whitney & Alderson’06],[Wang, Rong,’09]
– Degree distribution: [Albert et al. ‘04],[Rosas-Casals et al. ‘07]
Erdos Reny Small World Power network
14/31 CERTS Review, Aug 5-‐6, 2014
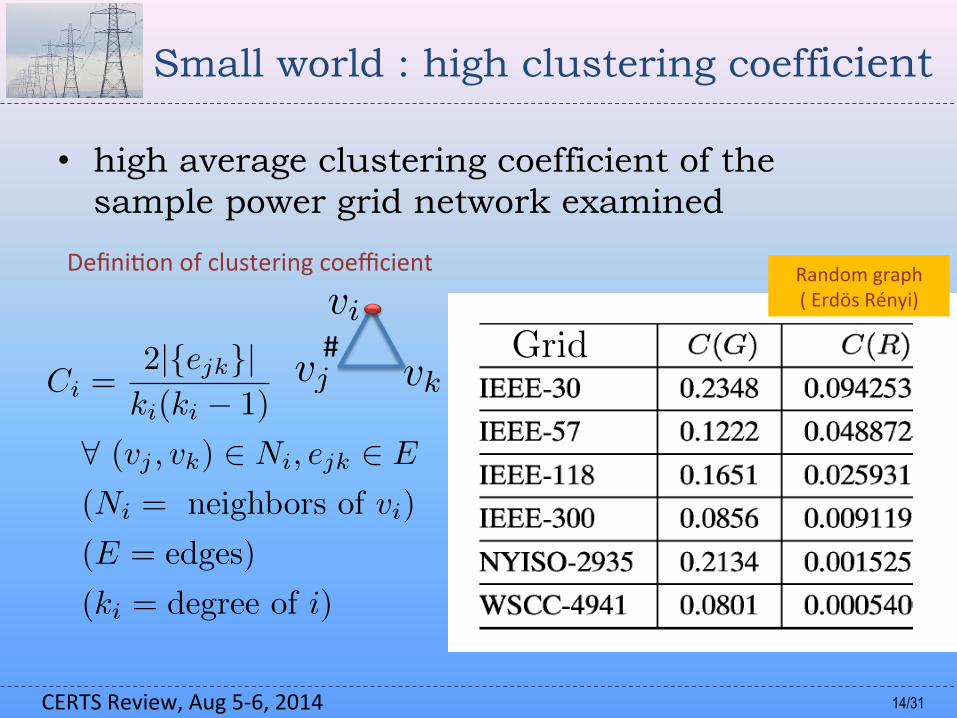
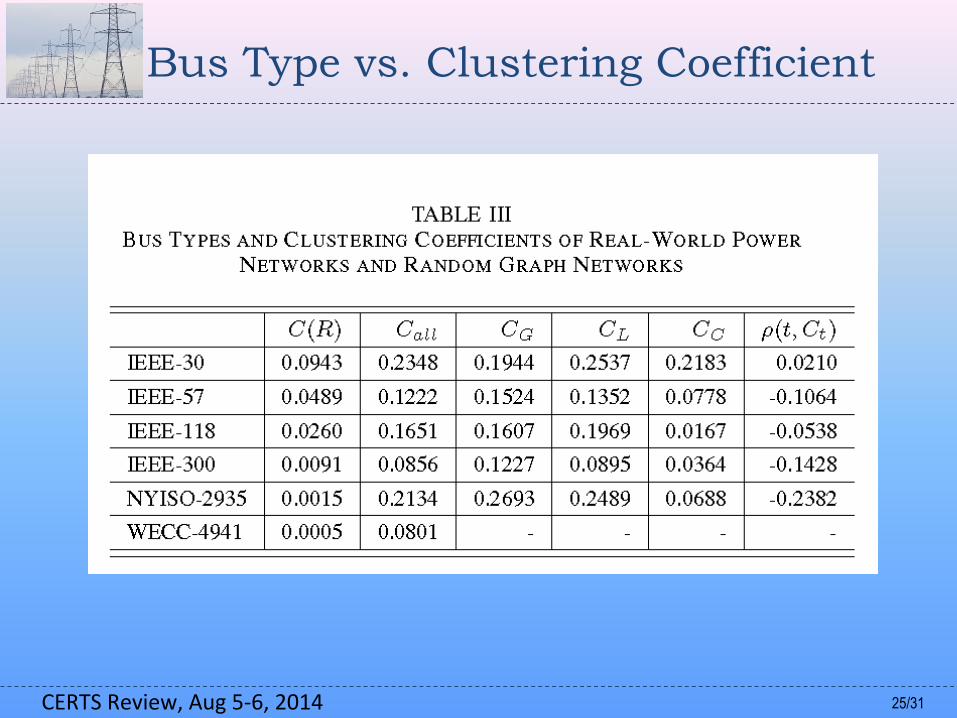
Small world : high clustering coefficient
• high average clustering coefficient of the sample power grid network examined
Defini;on of clustering coefficient
#vi
vj vkCi =2|{ejk}|ki(ki � 1)
8 (vj , vk) 2 Ni, ejk 2 E
(Ni = neighbors of vi)
(E = edges)
(ki = degree of i)
Random graph ( Erdös Rényi)
Grid
15/31 CERTS Review, Aug 5-‐6, 2014
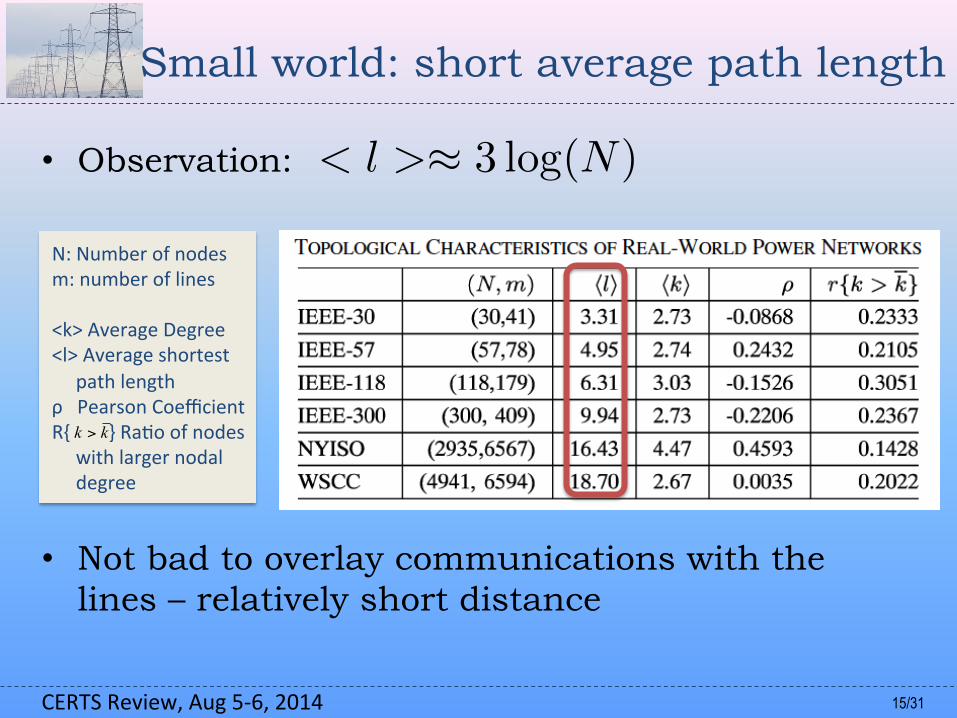
Small world: short average path length
• Observation:
• Not bad to overlay communications with the lines – relatively short distance
N: Number of nodes m: number of lines <k> Average Degree <l> Average shortest
path length ρ Pearson Coefficient R{ } Ra;o of nodes
with larger nodal degree
< l >⇡ 3 log(N)
k k>
16/31 CERTS Review, Aug 5-‐6, 2014
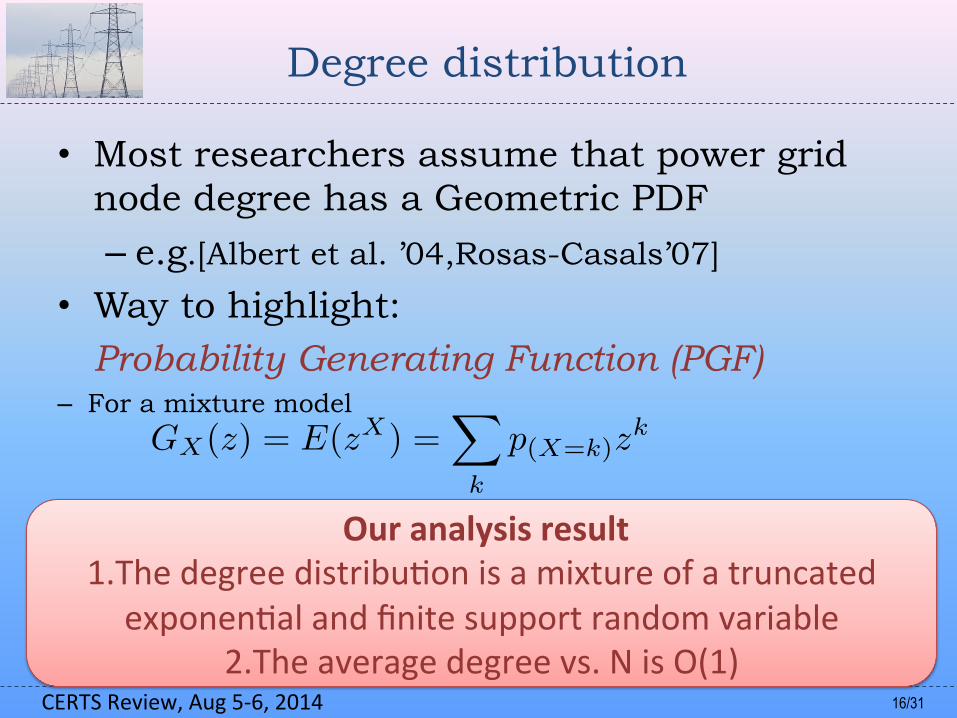
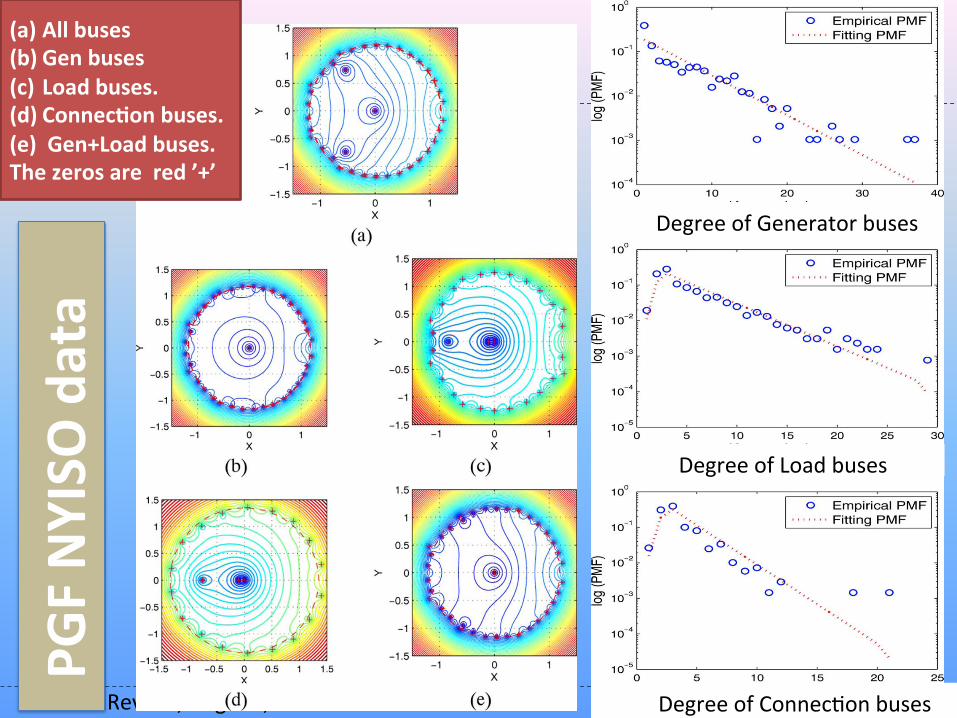
Degree distribution
• Most researchers assume that power grid node degree has a Geometric PDF
– e.g.[Albert et al. ’04,Rosas-Casals’07]
• Way to highlight: Probability Generating Function (PGF)
– For a mixture model
Our analysis result 1.The degree distribu;on is a mixture of a truncated exponen;al and finite support random variable
2.The average degree vs. N is O(1)
GX(z) = E(zX) =X
k
p(X=k)zk
17/31 CERTS Review, Aug 5-‐6, 2014
Results (a) All buses (b) Gen buses (c) Load buses. (d) Connec.on buses. (e) Gen+Load buses. The zeros are red ’+’
Degree of Generator buses
Degree of Load buses
Degree of Connec;on buses PGF NYISO
data
18/31 CERTS Review, Aug 5-‐6, 2014
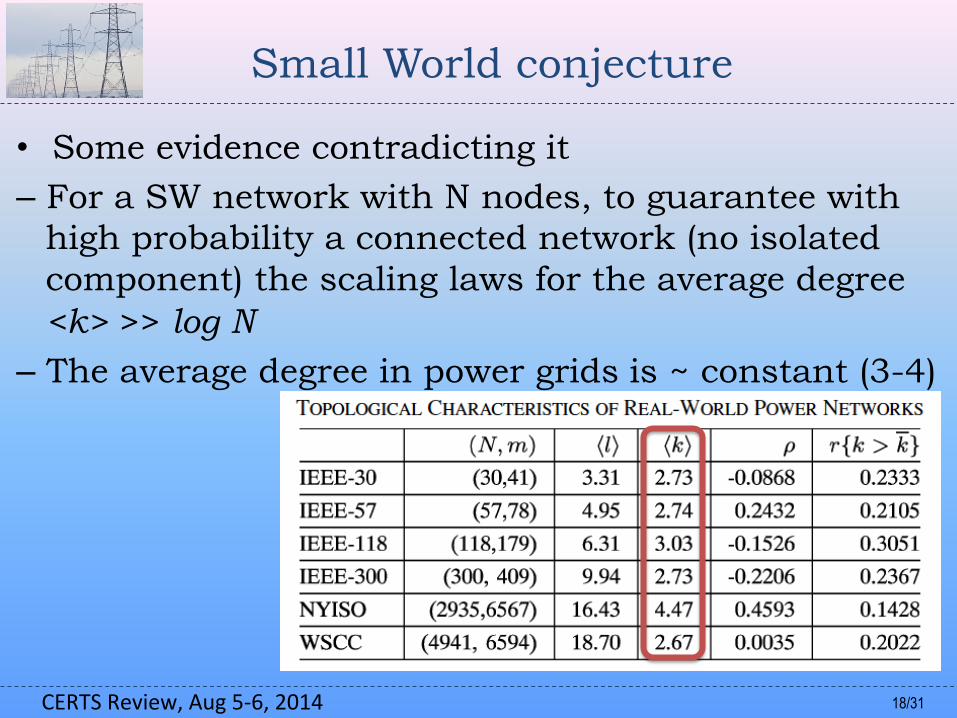
Small World conjecture
• Some evidence contradicting it
– For a SW network with N nodes, to guarantee with high probability a connected network (no isolated component) the scaling laws for the average degree <k> >> log N
– The average degree in power grids is ~ constant (3-4)
19/31 CERTS Review, Aug 5-‐6, 2014
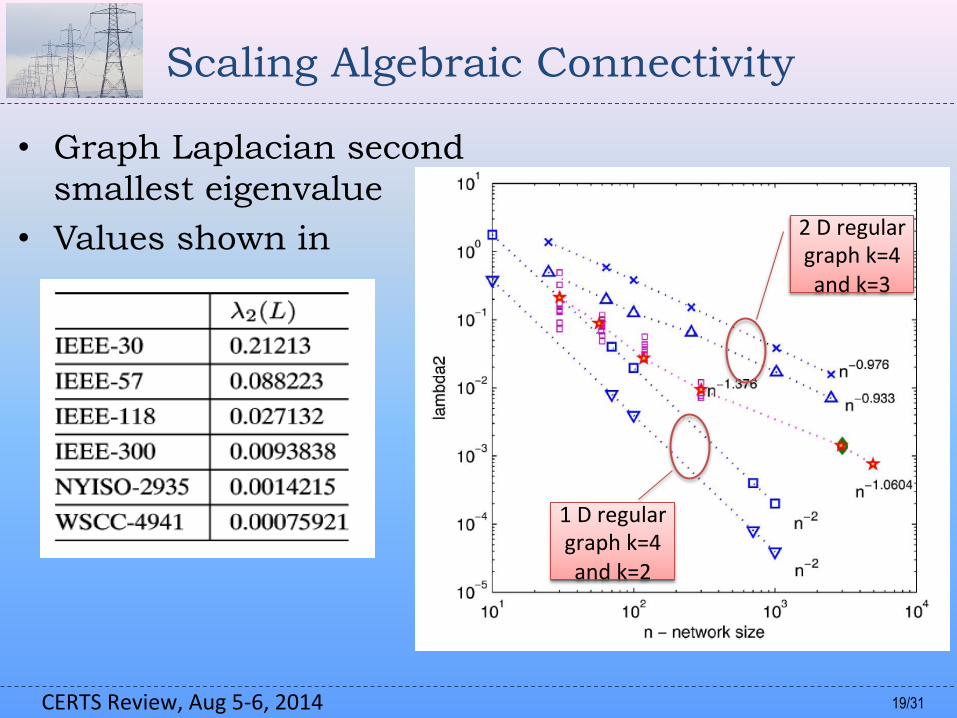
Scaling Algebraic Connectivity
• Graph Laplacian second smallest eigenvalue
• Values shown in 2 D regular graph k=4 and k=3
1 D regular graph k=4 and k=2
20/31 CERTS Review, Aug 5-‐6, 2014
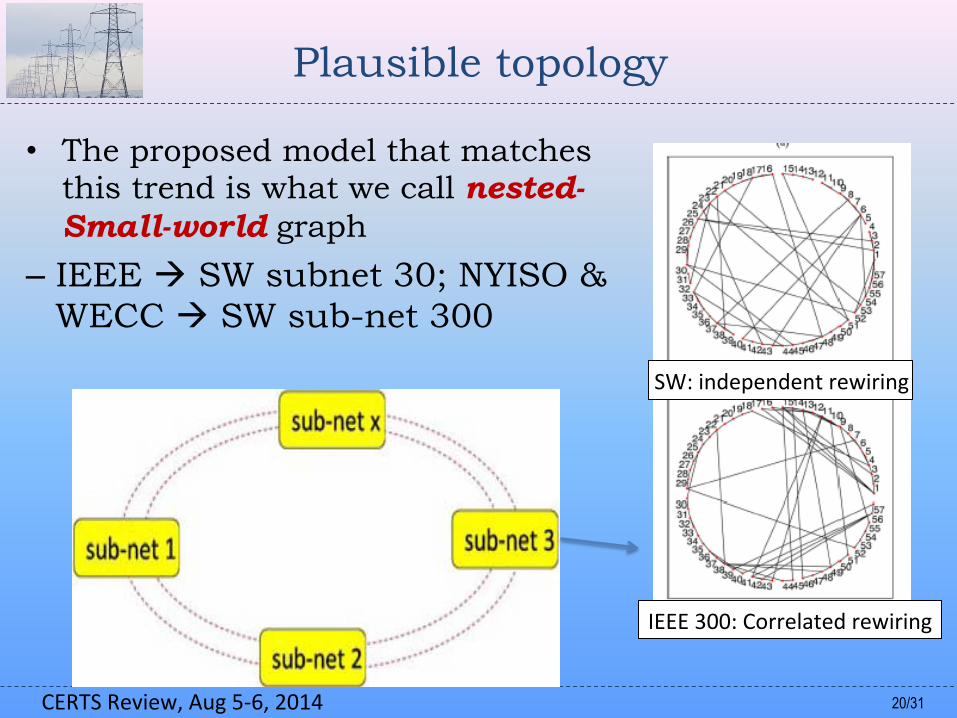
Plausible topology
• The proposed model that matches this trend is what we call nested-Small-world graph
– IEEE à SW subnet 30; NYISO & WECC à SW sub-net 300
IEEE 300: Correlated rewiring
SW: independent rewiring
21/31 CERTS Review, Aug 5-‐6, 2014
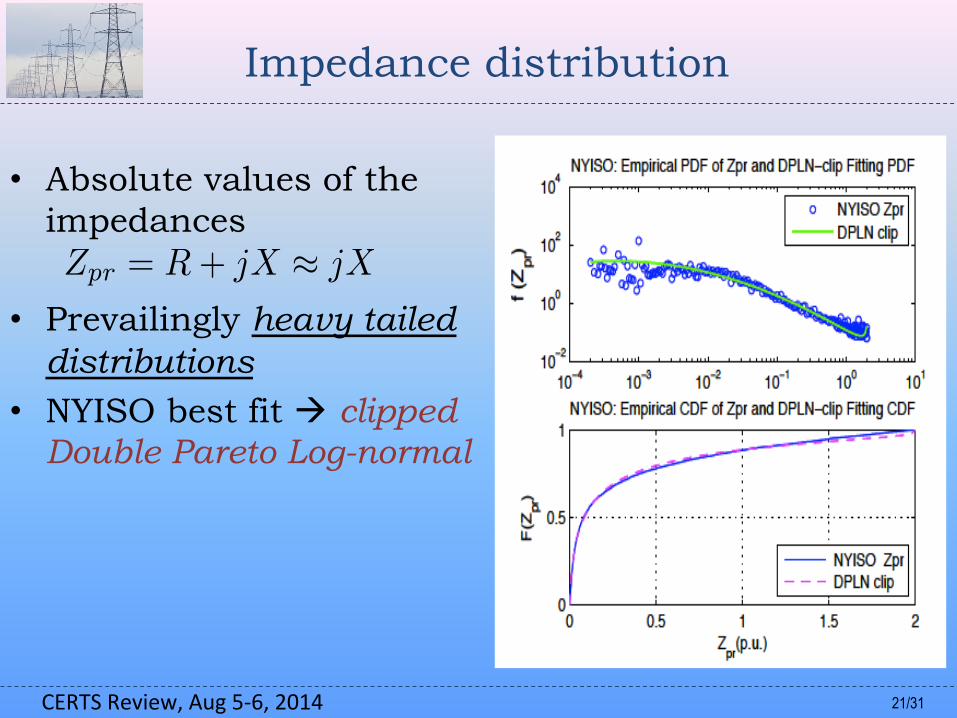
Impedance distribution
• Absolute values of the impedances
• Prevailingly heavy tailed distributions
• NYISO best fit à clipped Double Pareto Log-normal
Zpr = R + jX ⇡ jX
22/31 CERTS Review, Aug 5-‐6, 2014
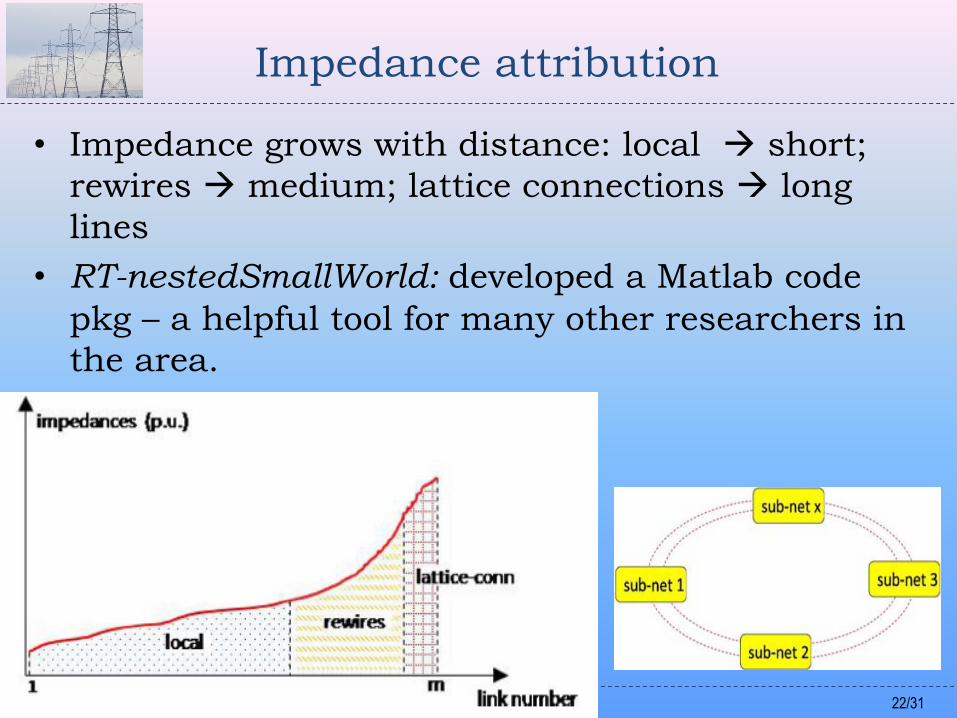
Impedance attribution
• Impedance grows with distance: local à short; rewires à medium; lattice connections à long lines
• RT-nestedSmallWorld: developed a Matlab code pkg – a helpful tool for many other researchers in the area.
23/31 CERTS Review, Aug 5-‐6, 2014
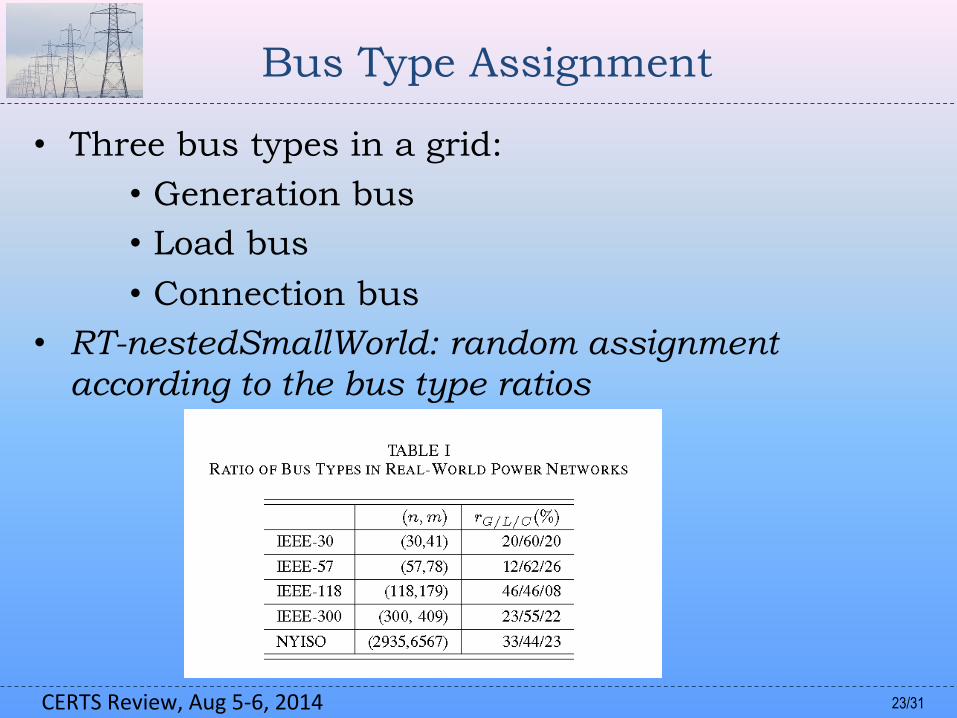
Bus Type Assignment
• Three bus types in a grid:
• Generation bus • Load bus
• Connection bus • RT-nestedSmallWorld: random assignment
according to the bus type ratios
24/31 CERTS Review, Aug 5-‐6, 2014
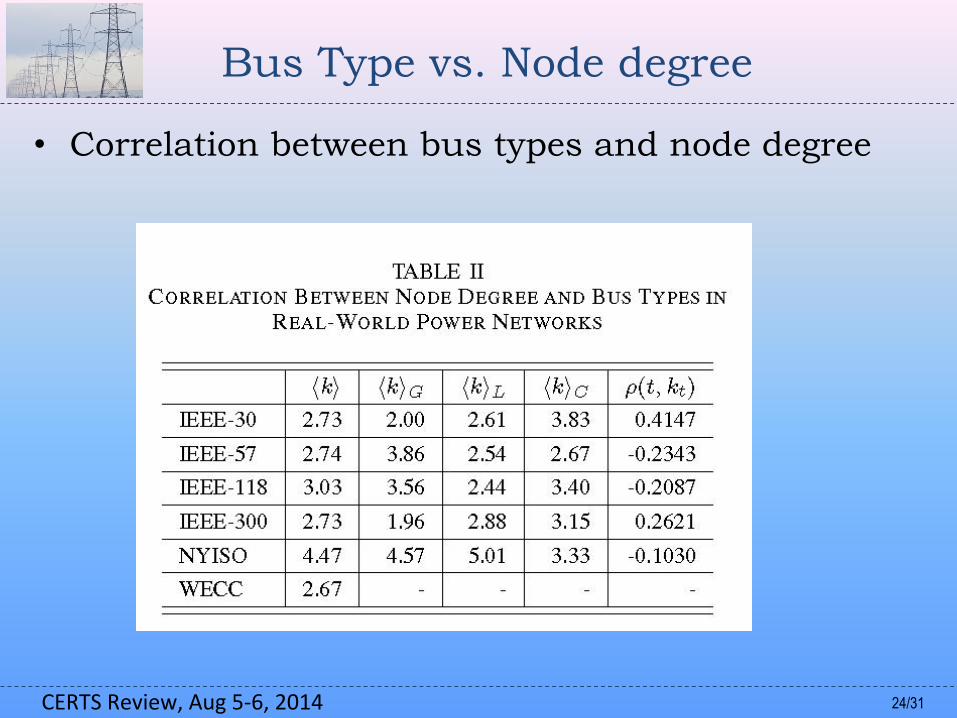
Bus Type vs. Node degree
• Correlation between bus types and node degree
25/31 CERTS Review, Aug 5-‐6, 2014
Bus Type vs. Clustering Coefficient
26/31 CERTS Review, Aug 5-‐6, 2014
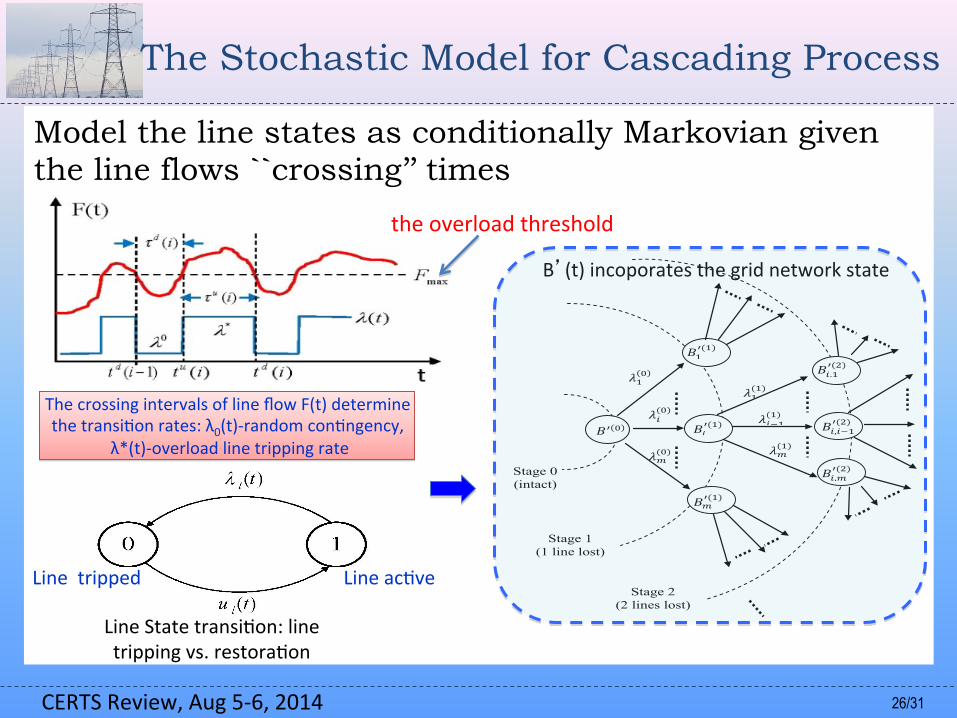
The Stochastic Model for Cascading Process
Model the line states as conditionally Markovian given the line flows ``crossing’’ times
B’(t) incoporates the grid network state
Line State transi;on: line tripping vs. restora;on
The crossing intervals of line flow F(t) determine the transi;on rates: λ0(t)-‐random con;ngency,
λ*(t)-‐overload line tripping rate
ܤᇱ()ܤ
ଵᇱ(ଵ)ܤ
ܤᇱ(ଵ)
ᇱ(ଵ)ܤ
,ଵܤᇱ(ଶ)
,ିଵܤᇱ(ଶ)
,ܤᇱ(ଶ)
ଵ()ߣ
ߣ()
()ߣ
ିଵߣ(ଵ)
ଵ(ଵ)ߣ
(ଵ)ߣStage 0 (intact)
Stage 1 (1 line lost)
Stage 2 (2 lines lost)
Line ac;ve Line tripped
the overload threshold
27/31 CERTS Review, Aug 5-‐6, 2014
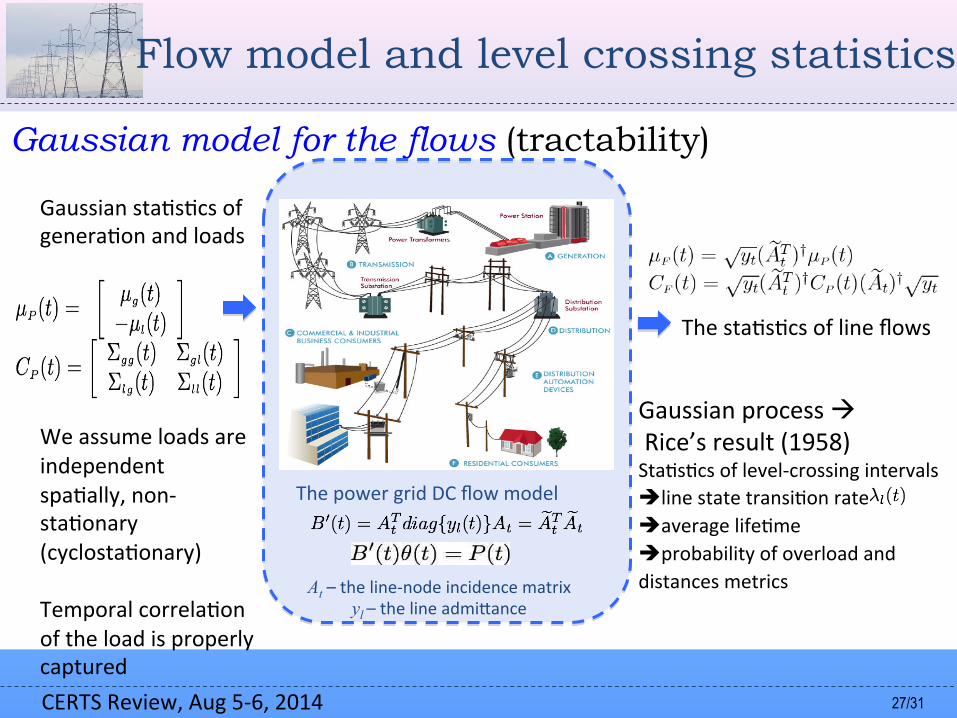
Flow model and level crossing statistics
Gaussian model for the flows (tractability)
Gaussian sta;s;cs of genera;on and loads We assume loads are independent spa;ally, non-‐sta;onary (cyclosta;onary) Temporal correla;on of the load is properly captured
The sta;s;cs of line flows
Gaussian process à Rice’s result (1958) Sta;s;cs of level-‐crossing intervals èline state transi;on rate èaverage life;me èprobability of overload and distances metrics
The power grid DC flow model
At – the line-‐node incidence matrix yl – the line admimance
28/31 CERTS Review, Aug 5-‐6, 2014
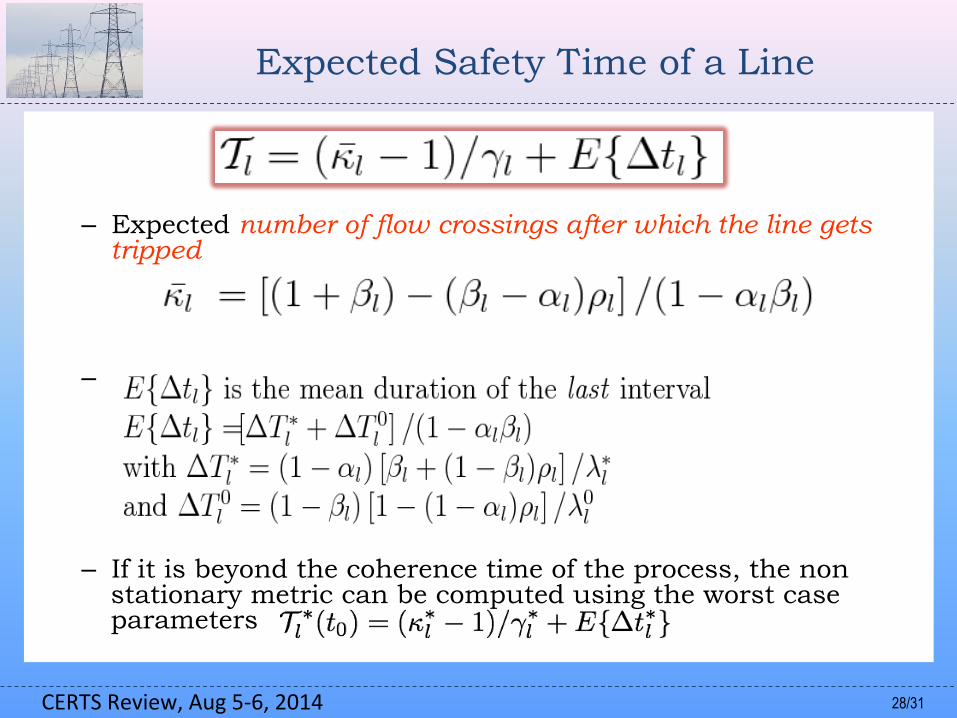
– Expected number of flow crossings after which the line gets tripped
–
– If it is beyond the coherence time of the process, the non stationary metric can be computed using the worst case parameters
Expected Safety Time of a Line
29/31 CERTS Review, Aug 5-‐6, 2014
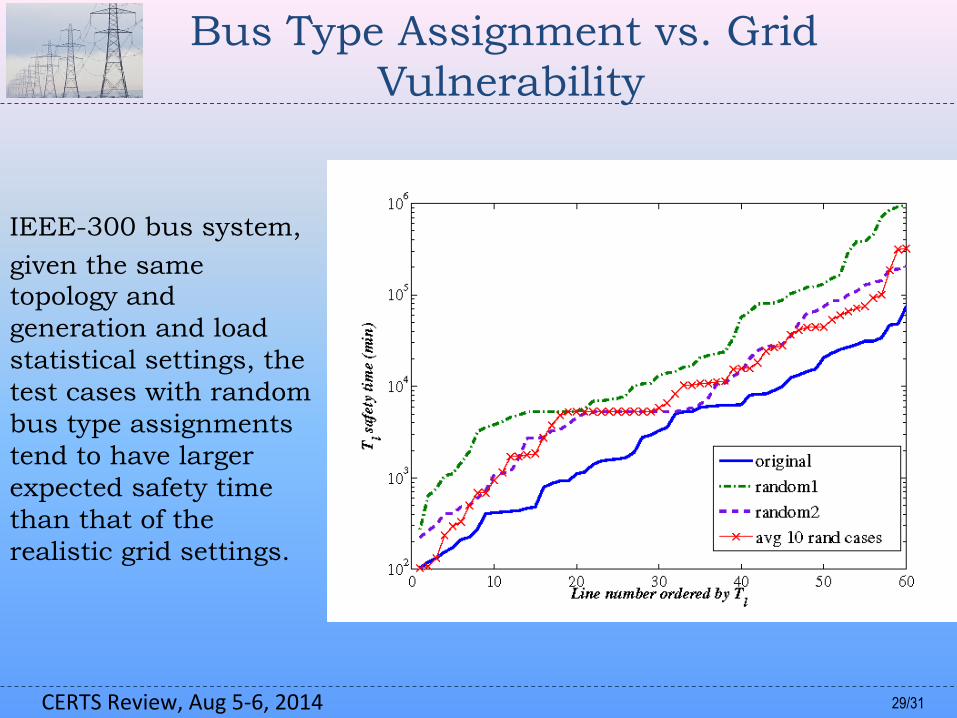
Bus Type Assignment vs. Grid Vulnerability
IEEE-300 bus system,
given the same topology and generation and load statistical settings, the test cases with random bus type assignments tend to have larger expected safety time than that of the realistic grid settings.
30/31 CERTS Review, Aug 5-‐6, 2014
Conclusions
• The admittance matrix of power grids has peculiar features that follow clear statistical trends.
• RT-nestedSmallWorld model is designed to capture the accurate statistical properties of real grid topology and electrical parameters.
• It is critical to understand how to design the RT-power grid model better.
• Random assignment of bus types will be replaced with a more accurate one which is consistent with that of realistic grids.

31/31 CERTS Review, Aug 5-‐6, 2014
Questions? J
Thank You!


![Beyond Node Degree: Evaluating AS Topology Models · erated using pure-random, Waxman [32], exponential and several locality based models of topology such as Transit-Stub. They use](https://img.pdfslide.net/doc/110x75/5f03fe937e708231d40bcb2a/beyond-node-degree-evaluating-as-topology-models-erated-using-pure-random-waxman.jpg)