Embed Size (px)
Citation preview

8/8/2019 Randomized Algorithmic Approach for Bi Clustering of Gene Expression Data
http://slidepdf.com/reader/full/randomized-algorithmic-approach-for-bi-clustering-of-gene-expression-data 1/7
(IJACSA) International Journal of Advanced Computer Science and Applications,
Vol. 1, No.6, December 2010
80 | P a g e
http://ijacsa.thesai.org/
Randomized Algorithmic Approach for Biclustering
of Gene Expression Data
Sradhanjali Nayak 1, Debahuti Mishra2, Satyabrata Das3 and Amiya Kumar Rath4
1,3,4Department of Computer Science and Engineering, College of Engineering Bhubaneswar, Odisha, INDIA
2 Institute of Technical Education and Research, Siksha O Anusandhan University, Bhubaneswar, Odisha, INDIA
[email protected], [email protected], [email protected] and [email protected]
Abstract — Microarray data processing revolves around the
pivotal issue of locating genes altering their expression in
response to pathogens, other organisms or other multiple
environmental conditions resulted out of a comparison between
infected and uninfected cells or tissues. To have a comprehensive
analysis of the corollaries of certain treatments, deseases and
developmental stages embodied as a data matrix on gene
expression data is possible through simultaneous observation andmonitoring of the expression levels of multiple genes. Clustering
is the mechanism of grouping genes into clusters based on
different parameters. Clustering is the process of grouping genes
into clusters either considering row at a time(row clustering) or
considering column at a time(column clustering). The application
of clustering approach is crippled by conditions which are
unrelated to genes. To get better of these problems a unique form
of clustering technique has evolved which offers simultaneous
clustering (both rows and columns) which is known as
biclustering. A bicluster is deemed to be a sub matrix consisting
data values. A bicluster is resulted out of the removal of some of
the rows as well as some of the columns of given data matrix in
such a fashion that each row of what is left reads the same string.
A fast, simple and efficient randomized algorithm is explored in
this paper, which discovers the largest bicluster by randomprojections.
Keywords: Bicluster; microarray data; gene expression;
randomized algorithm
I. INTRODUCTION
Gene expression data is typically arranged in the form of amatrix with rows corresponding to genes, and columnscorresponding to patients, tissues, time points, etc. Geneexpression data are being generated by DNA chip and othermicroarray technology and they are presented as matriceswhere each entry in the matrix represents the expression levelsof genes under various conditions including environments,
individuals and tissues. Each of the N rows represents a gene(or a clone, ORF, etc.) and each of the M columns represents acondition (a sample, a time point, etc.) [8]. It can either be anabsolute value (e.g. Affymetrix GeneChip) or a relativeexpression ratio (e.g. cDNA microarrays). A row/column issometimes referred to as the ―expression profile‖ of thegene/condition [4]. Due to complex procedure of microarrayexperiment, gene expression data contains a huge amount of data. Clustering is applied to extract useful information fromthe gene expression data matrix. The process of grouping data
objects into a set of disjoint class clusters, so that objectswithin a class have high similarity to each other, while objectsin separate classes are more dissimilar [1]. Clustering can beapplied either conditions (column clustering). Table 1 showthe row clustering where, all the columns for the rows G2, G3and G4 is selected and table 2 shows column clustering, whereC3, C4 and C5 column is clustered with all the rows/genes.
TABLE 1: Row Clustering
C1 C2 C3 C4 C5 C6 C7
G1 a11 a12 a13 a14 a15 a16 a17
G2 a21 a21 a23 a24 a25 a26 a27
G3 a31 a32 a33 a34 a35 a36 a37
G4 a41 a42 a43 a44 a45 a46 a47
G5 a51 a52 a53 a54 a55 a56 a57
G6 a61 a62 a63 a64 a65 a66 a67
The classical approach to analyze microarray data isclustering. The process of clustering partitions genes intomutually exclusive clusters under the assumption that genesthat are involved in the same genetic pathway behave similarlyacross all the testing conditions. The assumption might be truewhen the testing conditions are associated with time points.However, when the testing conditions are heterogeneous, suchas patients or tissues, the clustering can be proven as themethod of extraction information [6].
TABLE 2: Column Clustering
C1 C2 C3 C4 C5 C6 C7
G1 a11 a12 a13 a14 a15 a16 a17
G2 a21 a21 a23 a24 a25 a26 a27
G3 a31 a32 a33 a34 a35 a36 a37
G4 a41 a42 a43 a44 a45 a46 a47
8/8/2019 Randomized Algorithmic Approach for Bi Clustering of Gene Expression Data
http://slidepdf.com/reader/full/randomized-algorithmic-approach-for-bi-clustering-of-gene-expression-data 2/7
(IJACSA) International Journal of Advanced Computer Science and Applications,
Vol. 1, No.6, December 2010
81 | P a g e
http://ijacsa.thesai.org/
G5 a51 a52 a53 a54 a55 a56 a57
G6 a61 a62 a63 a64 a65 a66 a67
However clustering has got its own limitations. Clusteringis based on the assumption that all the related genes behavesimilarly across all the measured conditions. It may reveal thegenes which are very closely co-regulated along the entirecolumn. Based on a general understanding of the cellularprocess, the subsets of genes are co-regulated and co-expressed under certain experimental conditions. But theybehave almost independently under other conditions.Moreover, clustering partitions the genes into disjoint sets i.e.each gene is associated with a single biological function,which is in contradiction to the biological system [8]. In orderto make the clustering model more flexible and to overcomethe difficulties associated with clustering the concept of biclustering was introduced (see table 3). Biclustering isclustering applied in two dimensions, i.e. along the row andcolumn, simultaneously. This approach identifies the geneswhich show similar expression levels under a specific subsetof experimental conditions. The objective is to discovermaximal subgroups of genes and subgroups of conditions.Such genes express highly correlated [18] activities over arange of conditions.
One would expect that a group of genes would exhibitsimilar expression patterns only in a subset of conditions, suchas the subset of patients suffering from the same type of disease. Under this circumstance, biclustering becomes thealternative to the traditional clustering paradigm. Biclusteringis a process which performs clustering in two dimensionssimultaneously. Clustering method derives a global modelwhile biclustering produces a local model. Biclusteringenables one to discover hidden structures in gene expression
data in which many genetic pathways might be embedded [2].It might also allow one to uncover unknown genetic pathways,or to assign functions to unknown genes in already knowngenetic pathways, while clustering technique is applied agiven gene cluster is defined using all the conditions ,similarlyeach condition cluster is defined for all genes. But each genein a bicluster is selected using only a subset of the conditionsand each condition in a bicluster is selected using only asubset of genes [2]. The goal of biclustering is to identifysubgroups of genes and subgroups of conditions byperforming simultaneous clustering of both the rows andcolumns instead of in two dimensions separately as inclustering [2].
Randomized algorithm approach is based on the idea of randomly selecting a set of columns and rows [6]. It is a verysimple, effective method to find bicluster on both the aspect of time complexity and space complexity. The sub matrixproduced by the biclustering has the property that each rowreads the same string, so such a sub matrix would thereforecorrespond to a group of genes that exhibit a coherent patternof states over a subset of conditions. [3].
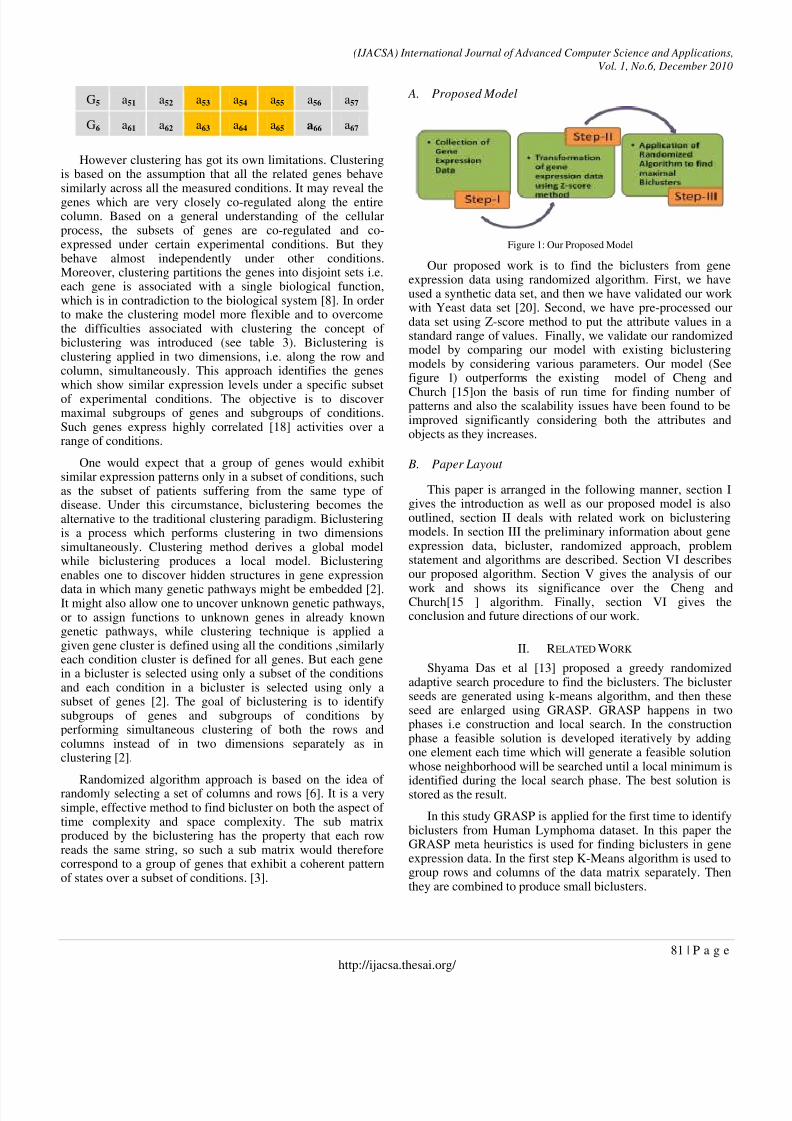
A. Proposed Model
Figure 1: Our Proposed Model
Our proposed work is to find the biclusters from geneexpression data using randomized algorithm. First, we haveused a synthetic data set, and then we have validated our work with Yeast data set [20]. Second, we have pre-processed ourdata set using Z-score method to put the attribute values in astandard range of values. Finally, we validate our randomizedmodel by comparing our model with existing biclusteringmodels by considering various parameters. Our model (Seefigure 1) outperforms the existing model of Cheng and
Church [15]on the basis of run time for finding number of patterns and also the scalability issues have been found to beimproved significantly considering both the attributes andobjects as they increases.
B. Paper Layout
This paper is arranged in the following manner, section Igives the introduction as well as our proposed model is alsooutlined, section II deals with related work on biclusteringmodels. In section III the preliminary information about geneexpression data, bicluster, randomized approach, problemstatement and algorithms are described. Section VI describesour proposed algorithm. Section V gives the analysis of our
work and shows its significance over the Cheng andChurch[15 ] algorithm. Finally, section VI gives theconclusion and future directions of our work.
II. RELATED WORK
Shyama Das et al [13] proposed a greedy randomizedadaptive search procedure to find the biclusters. The biclusterseeds are generated using k-means algorithm, and then theseseed are enlarged using GRASP. GRASP happens in twophases i.e construction and local search. In the constructionphase a feasible solution is developed iteratively by addingone element each time which will generate a feasible solutionwhose neighborhood will be searched until a local minimum is
identified during the local search phase. The best solution isstored as the result.
In this study GRASP is applied for the first time to identifybiclusters from Human Lymphoma dataset. In this paper theGRASP meta heuristics is used for finding biclusters in geneexpression data. In the first step K-Means algorithm is used togroup rows and columns of the data matrix separately. Thenthey are combined to produce small biclusters.
8/8/2019 Randomized Algorithmic Approach for Bi Clustering of Gene Expression Data
http://slidepdf.com/reader/full/randomized-algorithmic-approach-for-bi-clustering-of-gene-expression-data 3/7
(IJACSA) International Journal of Advanced Computer Science and Applications,
Vol. 1, No.6, December 2010
82 | P a g e
http://ijacsa.thesai.org/
Bing Liu et al [7] proposed an efficient semi-unsupervisedgene Selection method via spectral biclustering. Frombiological and clinical point of view finding smaller number of important genes help the doctor to concentrate on these genesand investigating the mechanism for cancer causes and itsremedies.
Haider Banka et al. [8] give an evolutionary biclustering of
gene expression data. They have proposed to uncover geneticpathways (or chains of genetic interactions) which isequivalent to generating clusters of genes with expressionlevels that evolve coherently under subsets of conditions, i.e.,discovering biclusters where a subset of genes are co-expressed under a subset of conditions. Such pathways canprovide clues genes that contribute towards a disease. Thisemphasizes the possibilities and challenges posed bybiclustering. The objective here is to find sub matrices ormaximal subgroups of conditions where the genes exhibithighly co-related activities over a range of conditions.
Stefano Lonardi et al. [6] find biclusters by randomprojection. From a given matrix X composed of symbols, a
bicluster is a sub matrix of X obtained by removing some of the rows and columns, so that each row left will read the samestring. An efficient randomized approach is used to findlargest bicluster which is probabilistic that is each entry of thematrix is associated with the probability.
Daxin Jiang et al. [11] proposed an interactive explorationof gene expression patterns from a gene expression data set.Analyzing coherent gene expression patterns is an importanttask in bioinformatics research and biomedical applications.The development of microarray technology provides a greatopportunity for functional genomics. Identifying co-expressedgenes and coherent expression patterns in gene expression datacan help biologists understand the molecular functions of thegenes and the regulatory network between the genes.However, due to the distinct characteristics of gene expressiondata and the special requirements from the biology domain,mining coherent patterns from gene expression data presentsseveral challenges, which cannot be solved by traditionalclustering algorithms.
III. PRELIMINARIES
A. Microarray or Gene Expression Data
Microarrays is a small chip made of chemically coatedglass , nylon membrane or silicon onto which thousands of DNA molecules are attached in fixed grids[19]. Microarray isused in the medical domain to produce molecular profiles of
diseased and normal tissues of patients. Microarray capturesthe expression level of thousands of genes under oneexperiment. Microarray operations are done under differentcondition to have parallel comparison between theexperimental levels of gene. The relative abundance of mRNAof a gene is called the expression level of a gene [9].This ismeasured using DNA microarray technology whichrevolutionized the gene expression study by simultaneouslymeasuring the expression levels of thousands of genes in asingle experiment [8][13].
The data generated by these experiments high dimensionalmatrix contain thousands of rows (genes) and hundreds of conditions. The experimental conditions can be patients, tissuetypes, different time points etc. Each entry in this matrix is areal number which denotes the expression level of a gene.Genes participating in the same biological process will havesimilar expression patterns. Clustering is the suitable mining
method for identifying these patterns [1][13]. The ability of arrays to monitor thousands of separate but unrelated eventssimultaneously has captured the thoughts of scientistspracticing in both basic and applied research [8][16][17].
The process of microarray formation experiment isassociated with a collection of experimental factors describingthe variables under study, e.g. ―disease state‖,‖gender state‖.Each microarray in an experiment takes on a specific value foreach of the experimental factors, e.g. ―disease state = normal‖and ―gender = male‖ [9][19]. In the very first stage the mRNA(messenger RNA) of normal male cell and a cancer male cellis obtained through RNA isolation process. Then by thereverse transcriptage enzyme the cDNA is obtained frommRNA. The cDNA (complimentary DNA) of the diseased cell
is labeled with red color and the normal cell cDNA is labeledwith green color. Then by the hybridization process thediseased cell and normal cell is hybridized to a small chipmade of chemically coated glass, nylon membrane or siliconcalled as microarray in a fixed form (grids). Gene expressiondata are being generated by DNA chip and other microarraytechnology and they are presented as matrices of expressionlevels of genes under various conditions includingenvironments, individuals and tissues. Gene expressionsprovide a fundamental link between genotypes andphenotypes, and play a major role in biological processes[18][19] and systems including gene regulation, evolution,development and disease mechanism.
A gene expression data from microarray experiment isrepresented by a real valued matrix. M = { Ai j|1≤i≤n , 1≤ j≤m}where rows ,G ={ g1, g2, g3,………. gr}represents theexpression pattern of the genes and the column, S = { s1, s2,s3,…….sc} represents expression profiles for samples andeach element wij is measured expression level of gene i insample j1 which is shown in the below table 3.
TABLE 3: Gene Expression Data
Where, r = no of genes, c = no of samples, M =gene expression data matrix, aij = element in the geneexpression matrix, gene = different whose expression levelsare taken in the row and condition = genes are studied underdifferent conditions which are taken in the column.

8/8/2019 Randomized Algorithmic Approach for Bi Clustering of Gene Expression Data
http://slidepdf.com/reader/full/randomized-algorithmic-approach-for-bi-clustering-of-gene-expression-data 4/7
(IJACSA) International Journal of Advanced Computer Science and Applications,
Vol. 1, No.6, December 2010
83 | P a g e
http://ijacsa.thesai.org/
Gene expression data set contains thousands of geneswhile the no. of tissue sample ranges from tens to hundreds,while analyzing expression profiles, a major issue is geneselection for target phenotype [5][19]. For example Cancer is adisease that begins in the cells of the body. Cancer isultimately the result of cells that uncontrollably grow anddon‘t die. Cancer occurs when cells become abnormal and
keep dividing and forming more cells without order or control.From biological and clinical point of view finding the smallnumber of important genes can help medical researchers toconcentrate on these gens and investigating the mechanism forcancer development. Clustering is a reputed algorithmictechnique that partitions a set of input data (vectors) intosubsets such that data in the same subset are close to oneanother in some metric [3]. Recent developments requirefinding the largest bicluster satisfying some additionalproperty with the largest area. For a given matrix of size n × m over a alphabet set ∑ , a bicluster is a sub matrix composed of selected columns and rows satisfying a certain property [3].Bicluster is a subset of genes that jointly respond across asubset of conditions, where a gene is termed responding under
some condition if its expression level changes significantlyunder that condition with respect to its normal level. Abicluster of a gene expression data is a local pattern such thatthe gene in the bicluster exhibit similar expression patternsthrough a subset of conditions [6].
Each bicluster is represented as a tightly co-regulated submatrix of the gene expression matrix. A ( X , Y ) is a matrix, I =subset of rows, J = subset of columns and ( I , Y ) = a subset of rows that exhibits similar behavior across the set of columns =cluster of rows. ( X , J ) = a subset of columns that exhibitsimilar behavior across set of all rows = cluster of columns. ( I ,
J ) = is a bicluster i.e. subset of genes and subsets of conditions, where the genes exhibit similar behavior across theconditions and vice versa. Cluster of columns ( X , J ) =
(C 3,C 4,C 5), Cluster of Rows ( I , Y ) = (G2, G3,G4), Bicluster ( I , J ) = { (G2, G3,G4), ( C 3,C 4,C 5)}. (See table 4)
TABLE 4: Bicluster
C1 C2 C3 C4 C5 C6 C7
G1 a11 a12 a13 a14 a15 a16 a17
G2 a21 a21 a23 a24 a25 a26 a27
G3 a31 a32 a33 a34 a35 a36 a37
G4 a41 a42 a43 a44 a45 a46 a47
G5 a51 a52 a53 a54 a55 a56 a57
G6 a61 a62 a63 a64 a65 a66 a67
The basic goal of biclustering is to identify subgroups of genes and subgroups of conditions, where the genes exhibithighly correlated activities for every condition, Identify sub-matrices with interesting properties and to performsimultaneous clustering on the rows and column dimensions of
the genes. The underlying bases for using bi-clustering in theanalysis of gene expression data are similar genes may exhibitsimilar behaviors only under a subset of conditions,
not all
conditions, genes may participate in more than one functionresulting in one regulation pattern in one context and adifferent pattern in another.
B. Randomized Approach for finding BiclustersBiclustering algorithms may have two different objectives:
to identify one or to identify a given number of biclusters.Randomized algorithm is an approach to find one bicluster at atime which is very easy to understand and implement [6].
Let‘s assume that, given a large set of a data matrix, X Є ∑ n×m
from which a sub matrix, x(r * ,c*) has to be discoveredwhere the sub matrix x(r * ,c*) is the largest one from the datamatrix set. For the simplicity r
*=| R
*| and c
*= |C
*|. The concept
of the algorithm owes its origin to the following simpleobservation. It is analyzed that if we can know what is thevalue of R* then we can easily determine C * by selecting theclean columns with respect to R
* or if instead we know C *,
then, R
*
could be obtained by taking the maximal set of rowswhich read the same string. Unfortunately, if neither R* nor C * is known then the approach is to ―sample‖ the matrix byrandom algorithm, with the expectation that at least some of the projections will overlap with the solution (R* , C *), one canfocus to either rows or columns, but here, in this algorithm, itis described how to retrieve the solution by sampling columns.
The steps for the algorithm are as described below:
1. Select a random subset of columns as S of size k
uniformly from the set of columns {1 , 2 , . . . , m}.
2. Lets assume that for the instant that S ∩C * ≠ Φ. If we
know S C * , then (R*,C*) could be determined by the
following three steps:
a. select the string(s) w that appear exactly r * times
in the rows of X [1:n.S ∩ C *]
b. set R* to be the set of rows in which w appears
andc. set C * to be the set of clean columns
corresponding to R*.
Given a selection of rows R, we say that a column j, 1 ≤ j ≤m, is clean with respect to R if the symbols in the j
thcolumn of
X restricted to the rows R, are identical. In general, a solutionof the largest bicluster can contain a column of zeros, as longas they appear in all rows of the sub matrix [6].
C. Problem Statement
The main problem behind this algorithm is to find thelargest bicluster from the given data matrix.
Largest Biclsuter(f ) problem
Instance: let ∑ denotes the set of nonempty symbols.
Let X be a gene expression data matrix asdefined over the
alphabet ∑n ×m of symbol.

8/8/2019 Randomized Algorithmic Approach for Bi Clustering of Gene Expression Data
http://slidepdf.com/reader/full/randomized-algorithmic-approach-for-bi-clustering-of-gene-expression-data 5/7
(IJACSA) International Journal of Advanced Computer Science and Applications,
Vol. 1, No.6, December 2010
84 | P a g e
http://ijacsa.thesai.org/
n = no of rows or genes
m = no of columns or conditions
The set ∑ denotes a non-empty alphabet of symbols and astring over ∑ is an ordered sequence of symbol LargestBiclsuter ( f ) problem.
Objective: To find a row selection R and a columnselection C such that the rows of X (R,C) are identical stringsand the objective function f (X(R,C)) is maximized from thealphabet set.
Assume that we are given a large matrix X Є∑n×m in whicha sub matrix X Є(R* , C *) is to be selected. Assume also that thesub matrix X (R
* , C
*) is maximal. To simplify, let the notations
are r * = | R*| = set of rows and C * = |C *| = set of columns. Letthe examples of objective functions which are used as a basisto find the bicluster are as follows:
o f 1(X(R,C)) = | R| + |C |;
o f 2(X(R,C)) = | R| provided that |C | = | R|; and
o
f 3(X(R, C)) = | R||C |.o f4(x(r*,c*) ) = |R*| ∩ |C*|
IV. OUR PROPOSED ALGORITHM
Randomized search (step 1): Select a random subset S of size k uniformly from the set of columns {1, 2, …, m} ;
Example: Let us take an example of data matrix as follows:
TABLE 5: Example Data Matrix
Let us randomly select 3 columns as: C 1*= (1,2,3,4) Let
us randomly select another 4 columns as: C 2*= (2,4,5,6)
Randomized search (Step-2): From the selected columnstake the common columns which are the subset of the givenmatrix X . As per our example the common column is : C 1
*∩
C 2* = (2,4). The common column is shown in green color in
the below table 6.
Randomized search (Step-3): For all the subset of S, findthe occurrences of string w that appears at least r times in eachsubset of S.
As per our example,
The String 11 appears = 1
The String 01 appears = 3
The string 12 appears = 1
The string 02 appears = 1
TABLE 6: Example
Randomized search (Step-4): Record the maximum nostring which appears in the subset and record thecorresponding rows. As per our example, the maximum stringwhich appears is 01 and the corresponding rows are rows are(2,4,6)
Randomized search (step-5):
Select the set of clean columns C with size at least ‗
c‘ corresponding to each R
A column j is clean with respect to R if the symbols
in the jth column of X restricted to the rows R, are
identical.As per our example, the clean column with respect to the
rows are (5,6).
Randomized search (step-6): Save the solutions and repeatstep 1 to 4 for t iterations. As per our example, the largestbicluster is:
X” =
0 1 0 2
0 1 0 2
0 1 0 2
0 1 0 2
Parameters used in the algorithms are as follows:
Projection size k (k min)
Column threshold c
Row threshold r
Number of iterations t
In our example the clean column w.r.t the rows are
(5,6)
V. RESULT ANALYSIS
In this paper, we have simulated the randomizedbiclustering algorithm to find the maximal bicluster embeddedin the data matrix using the synthetic data set as well as Yeast
data set [20]. We have also implemented the the MinimumSquare Residue (MSR) approach of Cheng and Church [15] tofind the biclusers.
We have tested both the approaches in Intel Dual Coremachine with 2GB HDD. The OS used is Microsoft XP and allprograms are written in C. We have observed the similartrends on runtime versus number of biclusters found in bothMSR based approach and our proposed randomized approach,the figure 2 shows the running time is significantly less as
2 1 0 1 1 2
0 0 1 1 0 20 1 2 0 1 1
2 0 0 1 0 2
1 2 1 2 1 2
0 0 2 1 0 1
2 1 0 1 1 2
0 0 1 1 0 2
0 1 2 0 1 1
2 0 0 1 0 2
1 2 1 2 1 20 0 2 1 0 2
8/8/2019 Randomized Algorithmic Approach for Bi Clustering of Gene Expression Data
http://slidepdf.com/reader/full/randomized-algorithmic-approach-for-bi-clustering-of-gene-expression-data 6/7
(IJACSA) International Journal of Advanced Computer Science and Applications,
Vol. 1, No.6, December 2010
85 | P a g e
http://ijacsa.thesai.org/
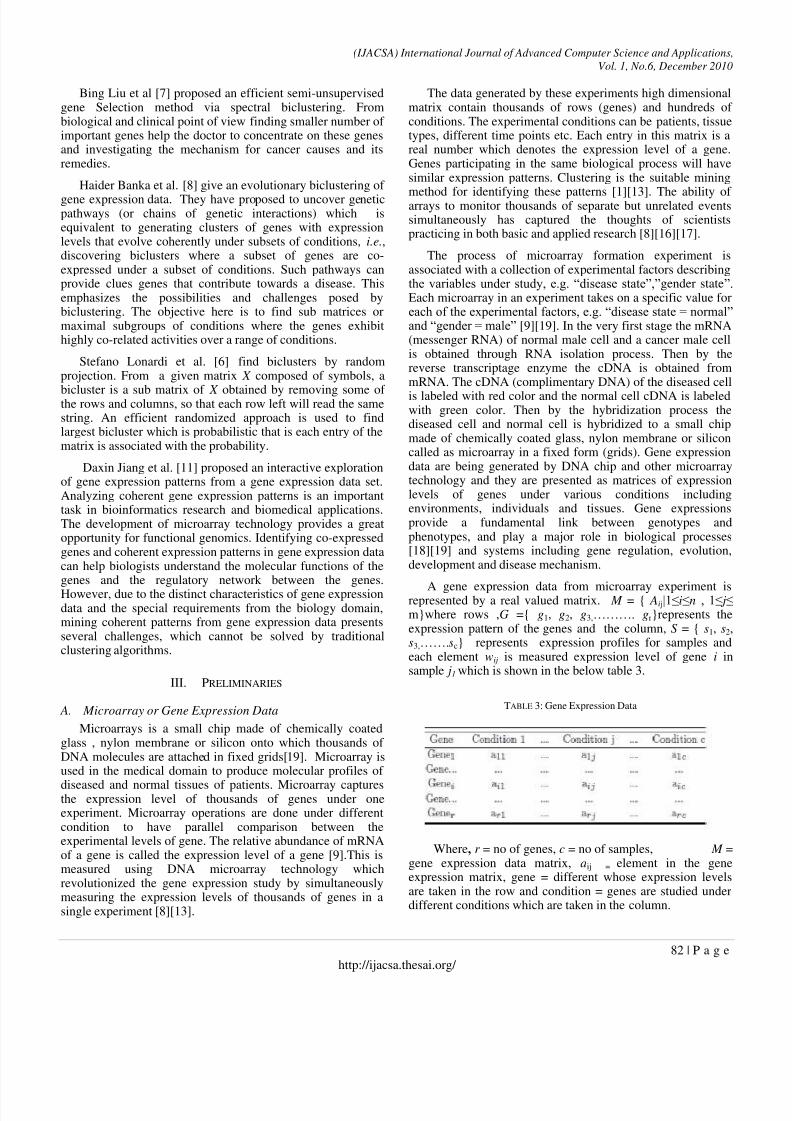
compared to MSR approach. Table 7 shows the comparativestudy on both the approaches.
Figure 3: Performance Analysis
TABLE 7: Comparative Analysis
Model Run Time
(ms)For
synthetic
data set
Run
Time(ms)
for Yeast
data set
No.of
Biclustersfound for
synthetic
data set
No.of
Biclustersfound for
Yeast data
set
MSR based
Method
4000 24000 18 286
Our
Randomized
Approach
1500 20000 24 788
VI. CONCLUSION
The simultaneous clustering of the rows and columns of amatrix falls under diversified names such as biclustering, co-clustering or two mode clustering. The unique features of geneexpression data and the specific demands from the domain of
biology, propels different challenges on the front of coherentpatterns from gene expression data which is a taxing task fortraditional clustering algorithms. The underlying basis forusing biclustering in the analysis of gene expression data aresimilar genes may exhibit similar behaviors only under asubset of conditions, not all conditions. Genes are regulated bymultiple factors/processes concurrently. Genes may participatein more than one function resulting in one regulation pattern inone context
and a different pattern in another. Using
biclustering algorithms, one can obtain sets of genes that areco-regulated under subsets
of conditions. Here, we have
presented a rather simple algorithm based on randomprojections. We have presented a probabilistic analysis of thelargest bicluster problem, which allows one to determine the
statistical significance of a solution. In future we plan toextend our system to the following aspects randomizedapproach provides a flexible and consistent model to organizethe expression patterns in individual data sets. In future thisapproach can be extended to the application of various softcomputing techniques as genetic algorithm, pattern matching,unsupervised learning algorithm which can able to find morethan one bicluster from the single data set. We are hopeful thatthis concept of biclustering will meet the future challenges andwill prove itself as more effective and result oriented.
REFERENCES
[1] Daxin jiang, Chun Tang, and Aidong Zhang ,‖Cluster analysis for geneexpression data: a survey‖, IEEE Transaction On Knowledge and Data
Engineering, Vol. 16, no.11. November 2004.
[2] S.C. Madeira and A.L. Oliveira, ―Biclustering Algorithms for BiologicalData Analysis: A Survey,‖ IEEE/ACM Trans. Computational Biologyand Bioinformatics, Vol. 1, No. 1, pp. 24-45, 2004.
[3] Gahyun Park and Wojciech Szpankowsk , ―Analysis of biclusters with
application to gene expression data‖. International Conference onAnalysis of Algorithms, pp.267 – 274, 2005
[4] Mel N Kronick,‖ Creation of the whole human genome microarray,Technology Profile, Future Drugs Limited , pp.19-28,www.futute-drugs.com
[5] L. Lazzeroni, A. Owen, ―Plaid models for gene expression data‖,Statistica Sinica 12 (1), pp.61 – 86, 2002
[6] Stefano Lonardia,,Wojciech Szpankowskib, QiaofengYanga,‖ Findingbiclusters by random projections‖, Theoretical Computer Science , 368,pp. 217 – 230, 2006
[7] Bing Liu, Chunru Wan , and Lipo Wang , “An Efficient Semi-Unsupervised Gene Selection Method via Spectral Biclustering‖. IEEE Transactions on Nano Bioscience, Vol. 5, No. 2, 2006.
[8] Alain B. Tchnag and Ahmed H.Tewfik,‖ DNA Microarray DataAnalysis: A Novel Biclustering Algorithm Approach‖. Volume 2006,
pp. 1- 12 , DOI 10.1155/ASP/2006/59809,2006[9] Jos´e Caldas, Nils Gehlenborg , Ali Faisal , Alvis Brazma and Samuel
Kaski, “Probabilistic retrieval and visualization of biologically relevantmicroarray experiments”, BMC Bioinformatics., 10(Suppl 13), pp.1-9,2009.
[10] Arifa Nisar, Waseem Ahmady Wei-keng Liao, Alok Choudhary,―HighPerformance Parallel/Distributed Biclustering Using BarycenterHeuristic‖. SIAM, pp. 1050-1061, 2009.
[11] R. Sharan and R. Shamir. Click: A clustering algorithm withapplications to gene expression analysis. In ISMB, pages 307-216, 2000.
[12] Q. Sheng, Y. Moreau, B.D. Moor, ―Biclustering Microarray data byGibbs sampling‖, Proceeding of European Conf. on Computational
Biology”. (ECCB’03) ,pp. 196 – 205,2003.
[13] Shyama Das, Sumam and Mary Idicula,‖ Application of GreedyRandomized Adaptive Search Procedure to the Biclustering of GeneExpression Data‖, International Journal of Computer Applications,
Volume 2 – No.3,pp. 0975 – 8887, 2010.[14] Haider Banka, Sushmita Mitra, ‖Evolutionary Biclustering of Gene
Expressions‖, ACM Ubiquity, Volume 7, Issue 42 , 2006
[15] Yizong Cheng and George M. Church. ―Biclustering of expressiondata‖. In proceedings of the 8
thInternational conference on intelligent
systems for molecular Biology (ISMB ‗00‘), pages 93-103, 2000.
[16] Keisuke Lida, Ichiro Nishimura, ‖Gene expression profiling by DNAMicroarray Technology‖, Critical Reviews in Oral Biology and
Medicine, Vol. 13 no. 1,pp. 35-50, 2002.
[17] Daxin Jiang ,Jian Pei, Aidong Zhang ,‖Towards Interactive Explorationof Gene Expression Patterns ‖, SIGKDD Explorations, 5(2), pp.79-90,2003.
[18] Haider Banka, Sushmita Mitra ‖ Evolutionary biclustering of geneexpression data‖, Proceedings of the 2nd international conference on
Rough sets and knowledge technology, Pages: 284-291, 2007.
[19] Madan Babu,M., Luscombe, N., Aravind, L., Gerstein, M., Teichmann,S.A. , Structure and evolution of transcriptional regulatory networks.Curr. Opin. Struct. Biol. ,2004
[20] UCI Repository for Machine Learning Data bases retrieved fromthe World Wide Web: http://www.ics.uci.edu
[21] Uetz P., et al.‖ A Comprehensive analysis of protein protein interactionin saccharomyces cerevisiae‖, Nature, 403(6770): 601-3, Feb-2000.
[22] Gavin A.C., et. al. ―Functional organization of yeast proteome bysystematic analysis of protein complexes‖. Nature 415(6868) :13-4, Jan-2002.
8/8/2019 Randomized Algorithmic Approach for Bi Clustering of Gene Expression Data
http://slidepdf.com/reader/full/randomized-algorithmic-approach-for-bi-clustering-of-gene-expression-data 7/7
(IJACSA) International Journal of Advanced Computer Science and Applications,
Vol. 1, No.6, December 2010
86 | P a g e
http://ijacsa.thesai.org/
AUTHORS PROFILE
Sradhanjali Nayak is a scholar of M.Tech (CSE) at College of Engineering,
Biju Pattanaik University, Bhubaneswar, Odisha, INDIA. Her research areas
includes Data mining, Soft Computing Techniques etc.
Debahuti Mishra is an Assistant Professor and research scholar in the
department of Computer Sc. & Engg, Institute of Technical Education &
Research (ITER) under Siksha O Anusandhan University, Bhubaneswar,
Odisha, INDIA. She received her Masters degree from KIIT University,
Bhubaneswar. Her research areas include Datamining, Bio-informatics,
Software Engineering, Soft computing. Many publications are there to her
credit in many International and National level journal and proceedings. She is
member of OITS, IAENG and AICSIT. She is an author of a book Aotumata
Theory and Computation by Sun India Publication (2008).
Satyabrata Das is as Assistant Professor and Head in the department of
Computer Sc. & Engineering, College of Engineering Bhubaneswar (CEB).
He received his Masters degree from Siksha O Anusandhan University,
Bhubaneswar. His research area includes Data Mining, Adho-network etc.
Dr.Amiya Kumar Rath obtained Ph.D in Computer Science in the year 2005
from Utkal University for the work in the field of Embedded system. Presentlyworking with College of Engineering Bhubaneswar (CEB) as Professor of
Computer Science & Engg. Cum Director (A&R) and is actively engaged in
conducting Academic, Research and development programs in the field of
Computer Science and IT Engg. Contributed more than 30 research level
papers to many national and International journals. and conferences Besides
this, published 4 books by reputed publishers. Having research interests
include Embedded System, Adhoc Network, Sensor Network, Power
Minimization, Biclustering, Evolutionary Computation and Data Mining.


![Block-Randomized Stochastic Proximal Gradient for …people.oregonstate.edu/~fuxia/main-01-16-2019.pdf2019/01/16 · alternating least squares (ALS) algorithm [3] has an elegant algorithmic](https://img.pdfslide.net/doc/110x75/5eaeb02fdcd6880bce2dca9e/block-randomized-stochastic-proximal-gradient-for-fuxiamain-01-16-2019pdf-20190116.jpg)


![Clustering Non-Ordered Discrete Data - Michigan …pramanik/research/papers/papers/jise2014...CLUSTERING NON-ORDERED DISCRETE DATA 3 CLARANS [7] is a randomized k-medoids [6] based](https://img.pdfslide.net/doc/110x75/5ada038e7f8b9afc0f8bebfe/clustering-non-ordered-discrete-data-michigan-pramanikresearchpaperspapersjise2014clustering.jpg)