Embed Size (px)
Citation preview

Ranking AlgorithmsHow to determine ranking out of complex data
types
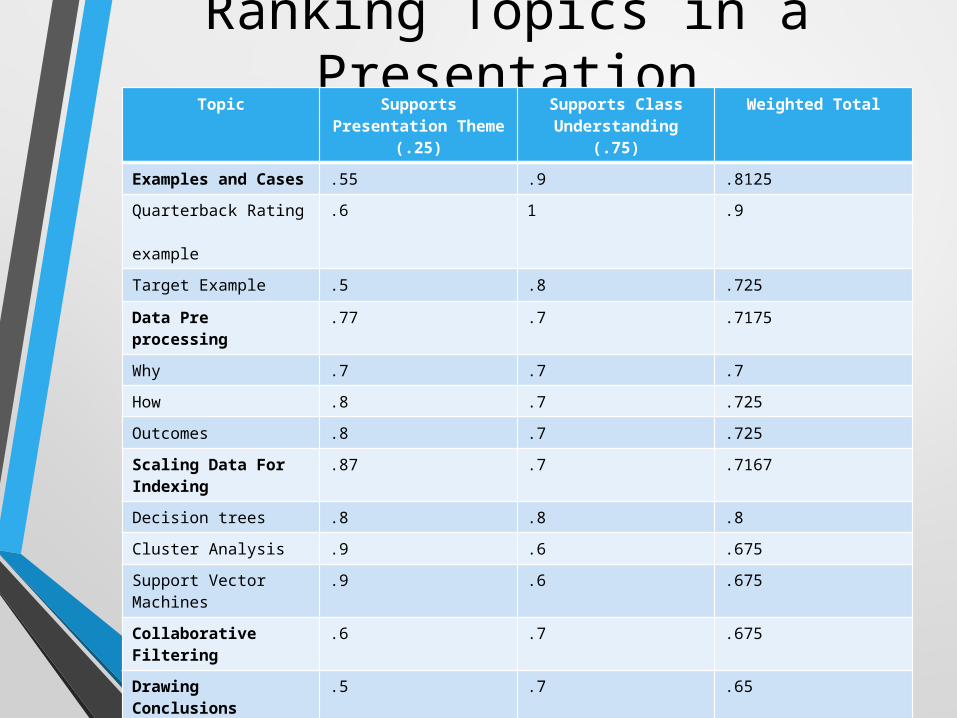
Ranking Topics in a Presentation
Topic Supports Presentation Theme (.25)
Supports Class Understanding
(.75)
Weighted Total
Examples and Cases
.55 .9 .8125
Quarterback Rating example
.6 1 .9
Target Example .5 .8 .725
Data Pre processing
.77 .7 .7175
Why .7 .7 .7
How .8 .7 .725
Outcomes .8 .7 .725
Scaling Data For Indexing
.87 .7 .7167
Decision trees .8 .8 .8
Cluster Analysis .9 .6 .675
Support Vector Machines
.9 .6 .675
Collaborative Filtering
.6 .7 .675
Drawing Conclusions
.5 .7 .65
Multiple regression .5 .8 .725
Anova .5 .7 .65
Meta .5 .6 .575
Conclusion 1 .2 .4
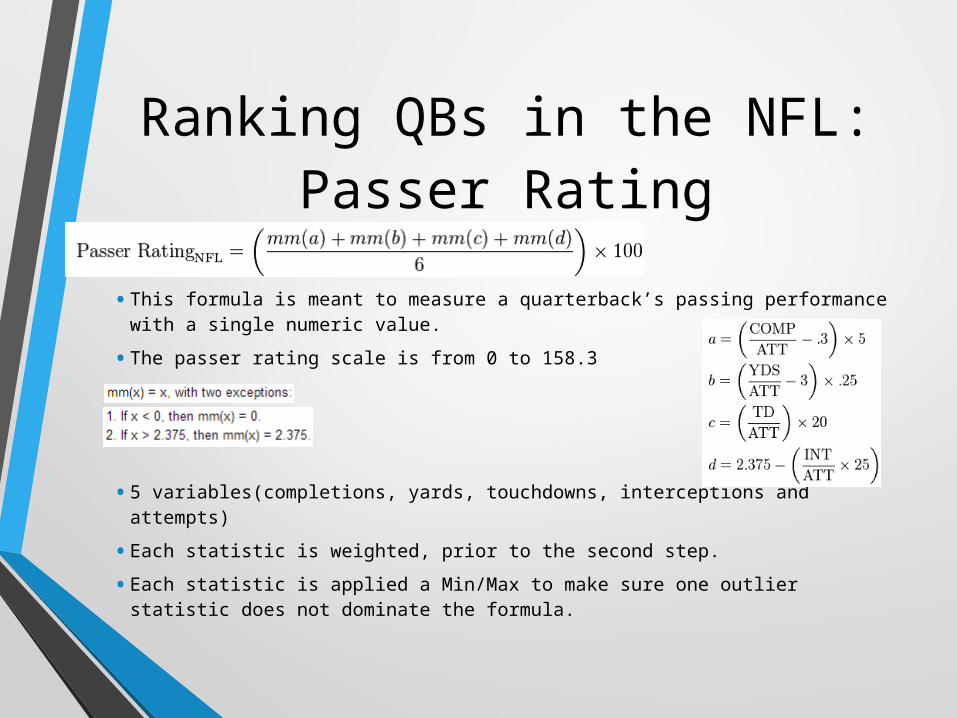
Ranking QBs in the NFL: Passer Rating
• This formula is meant to measure a quarterback’s passing performance with a single numeric value.
• The passer rating scale is from 0 to 158.3
• 5 variables(completions, yards, touchdowns, interceptions and attempts)
• Each statistic is weighted, prior to the second step.
• Each statistic is applied a Min/Max to make sure one outlier statistic does not dominate the formula.

Advantages and Flaws of Passer RatingPros:
• Provides a quick and easy way of evaluating quarterback performance based on a standard formula.
• Captures key variables associated with passer performance.
Cons:
• Incomplete measurement: doesn’t take into consideration dropped passes, times sacked, yards after catch, fumbles, Etc.
• Can be deceptive if the amount of attempts is small.
• Amount of touchdown passes scored is largely dependent on other players.
Scenario: Below are last games statistics. Which quarterback should the coach start next game?
Philip Rivers (current starter): PR = 108.7
Joseph Gast (backup): PR = 158.3
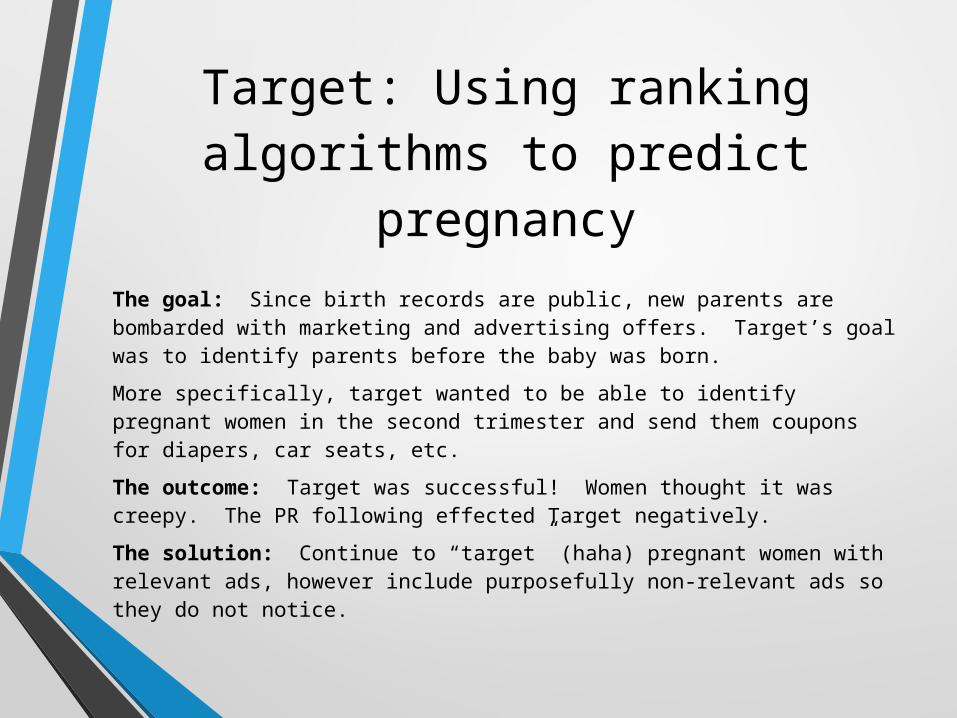
Target: Using ranking algorithms to predict
pregnancyThe goal: Since birth records are public, new parents are bombarded with marketing and advertising offers. Target’s goal was to identify parents before the baby was born.
More specifically, target wanted to be able to identify pregnant women in the second trimester and send them coupons for diapers, car seats, etc.
The outcome: Target was successful! Women thought it was creepy. The PR following effected Target negatively.
The solution: Continue to “target” (haha) pregnant women with relevant ads, however include purposefully non-relevant ads so they do not notice.
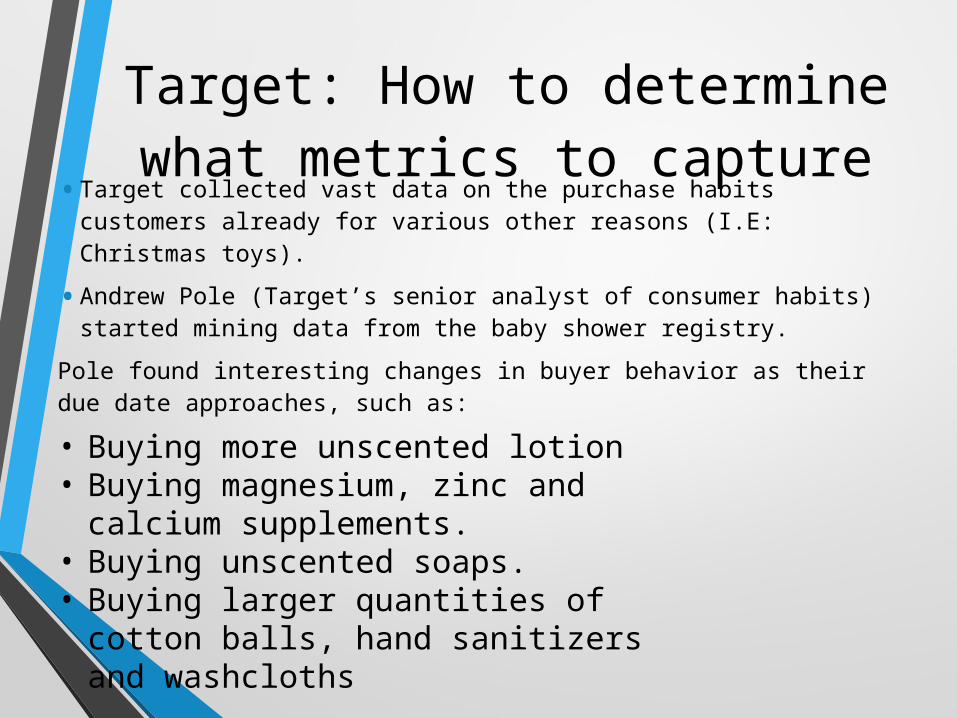
Target: How to determine what metrics to capture
• Target collected vast data on the purchase habits customers already for various other reasons (I.E: Christmas toys).
• Andrew Pole (Target’s senior analyst of consumer habits) started mining data from the baby shower registry.
Pole found interesting changes in buyer behavior as their due date approaches, such as:• Buying more unscented lotion• Buying magnesium, zinc and
calcium supplements.• Buying unscented soaps.• Buying larger quantities of cotton
balls, hand sanitizers and washcloths
Target: Putting pregnancy prediction score to use
• In the end, Pole identified 25 products that, when analyzed together, allowed him to assign each shopper a “pregnancy prediction” score.
• He also could predict shopper’s due dates well enough to send coupons timed to specific stages pregnancy.
• Target then ran studies on how to advertise to pregnant women and found out that the coupons were more likely to be used when coupled with “random” items.
“Just wait. We’ll be sending you coupons for things you want before you even know you want them.” –Andrew Pole
http://rmportal.performedia.com/node/1373
Data Pre-Processing 1: Why data must be pre-processed
• Organizations often require decisions to be formed from multi-criteria datasets; However:
• Original data often suffers from:
• Lacking attributes
• Lacking values
• Containing aggregates
• Data obtained from different sources are often inconsistent (using different attribute names, invalid codes, of different data types)
• Datasets may contain errors or outliers
Data Pre-Processing 2: How Preprocessing Works
• Fill in missing values using central tendency along with learning algorithms to predict value
• Cluster values to isolate outliers
• Smooth data using regression
• Correct inconsistencies using decision-making techniques

Data Pre-Processing 3: Outcomes of Preprocessing
• The purpose of data pre-processing is to produce a better data set without loss of relevant information. This:
• Allows statistical analysis on incomplete datasets
• Allows resulting dataset to be uploaded to data visualization software
• Can be used to test and track many relationships between variables
• Provides a method of ranking similar data from disparate sources
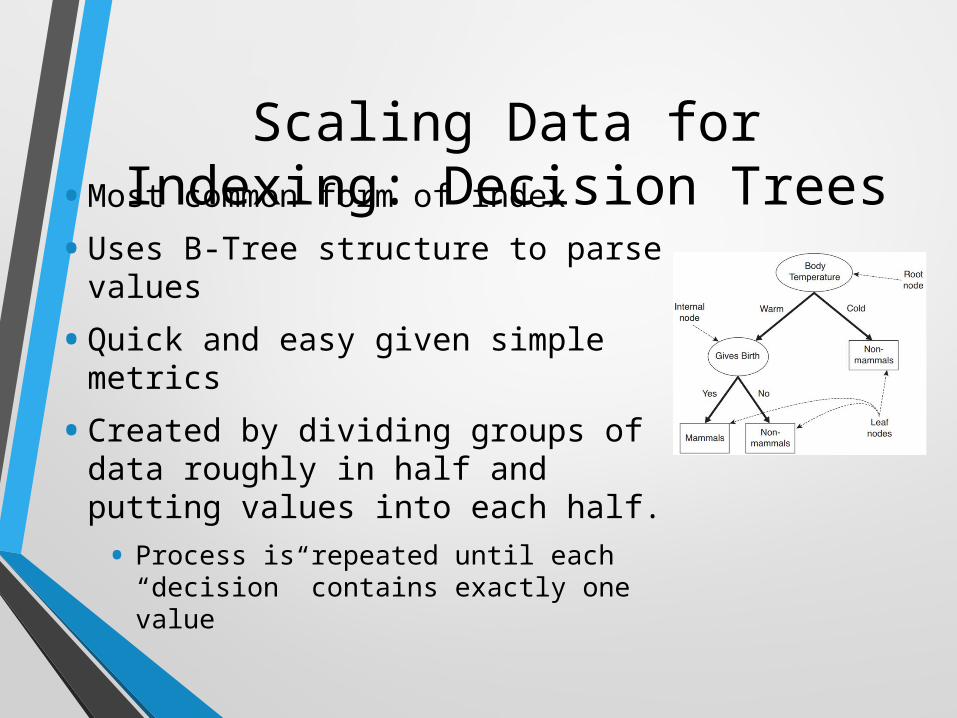
Scaling Data for Indexing: Decision Trees• Most common form of index
• Uses B-Tree structure to parse values
• Quick and easy given simple metrics
• Created by dividing groups of data roughly in half and putting values into each half.
• Process is repeated until each “decision” contains exactly one value
Scaling Data for Indexing: Support-Vector Machines
• Uses machine learning to generate probability
• Requires training and test data
• Complexity grows exponentially with size of training data
• Used to coerce non-standard information into standard classifications (e.g. handwriting recognition algorithms)
• Sample of Support-Vector Application

Scaling Data for indexing: Cluster Analysis
• Starts with decision-tree type analysis
• Data elements with arranged as objects via their attributes
• Similar objects are arranged in clusters
• As clusters get too large, new clusters are formed
• New data is compared against cluster ranges, indexed accordingly
• Data retrieval looks at cluster first, then objects within appropriate clusters
Collaborative Filtering
• Crowd-sourcing rankings based on users likes/dislikes
• Gives users test set of data to rank on Likert scale
• Likert scale is dropped, relative ranking is retained
• Users are matched with others with similar tastes, providing ability to predict new object ranks
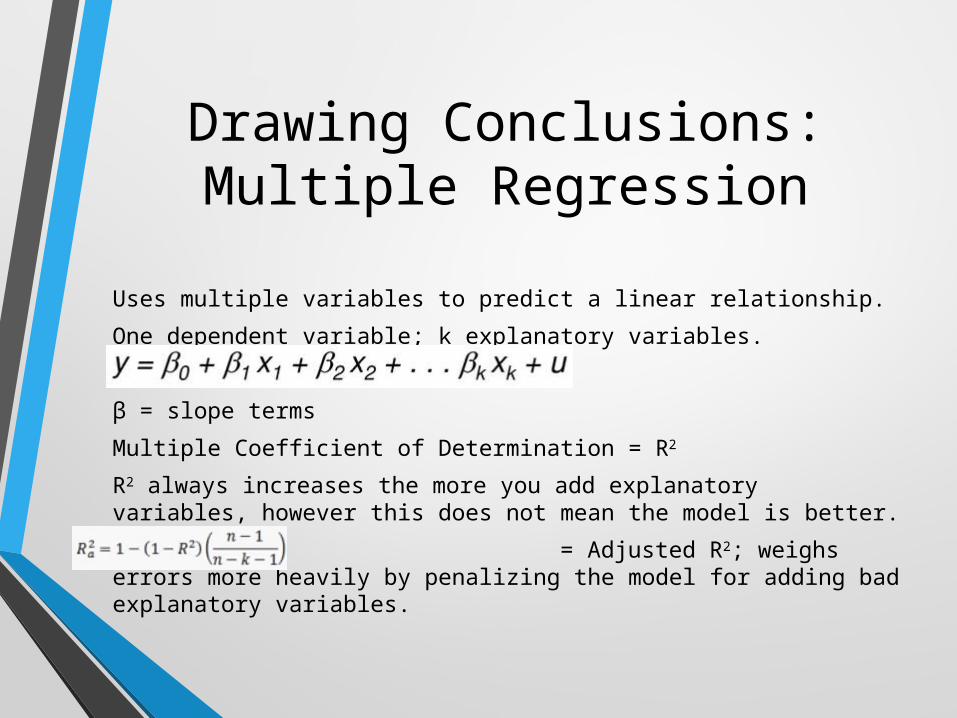
Drawing Conclusions: Multiple Regression
Uses multiple variables to predict a linear relationship.
One dependent variable; k explanatory variables.
β = slope terms
Multiple Coefficient of Determination = R2
R2 always increases the more you add explanatory variables, however this does not mean the model is better.
= Adjusted R2; weighs errors more heavily by penalizing the model for adding bad explanatory variables.
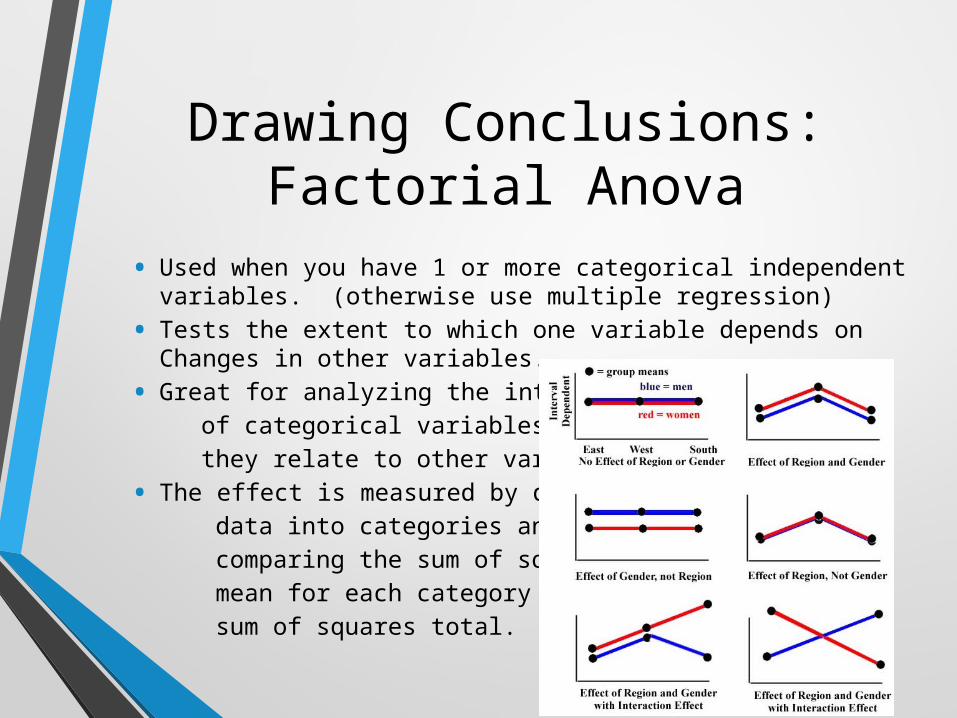
Drawing Conclusions: Factorial Anova
• Used when you have 1 or more categorical independent variables. (otherwise use multiple regression)
• Tests the extent to which one variable depends on Changes in other variables.
• Great for analyzing the interaction of categorical variables. And how they relate to other variables.
• The effect is measured by dividing data into categories and comparing the sum of squares mean for each category to the sum of squares total.
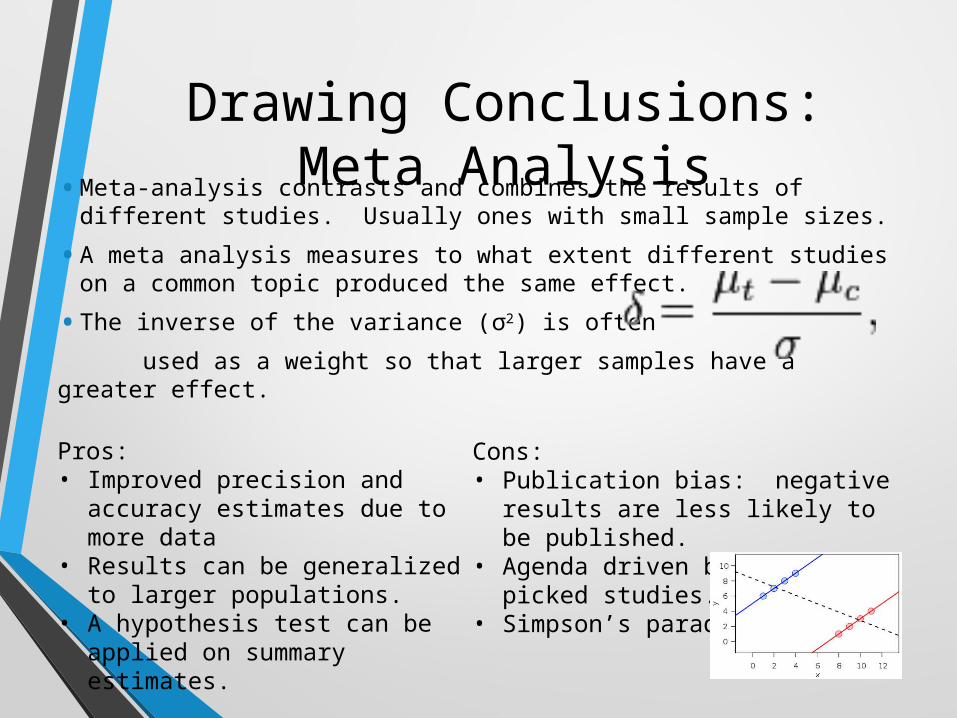
Drawing Conclusions: Meta Analysis• Meta-analysis contrasts and combines the results of different
studies. Usually ones with small sample sizes.
• A meta analysis measures to what extent different studies on a common topic produced the same effect.
• The inverse of the variance (σ2) is often
used as a weight so that larger samples have a greater effect.
Pros:• Improved precision and accuracy
estimates due to more data • Results can be generalized to
larger populations.• A hypothesis test can be applied
on summary estimates.
Cons:• Publication bias: negative
results are less likely to be published.
• Agenda driven bias: cherry picked studies.
• Simpson’s paradox
Conclusion• Using rankings for analyzing multiple
variables is an extremely useful tool for expedited decision making.
• Data preprocessing allows statistical analysis for incomplete datasets (improves data hygiene).
• Indexes are scaled by common attributes: • A decision tree deals with 1 attribute • a cluster deals with multiple attributes • support vector machines rely on computer generated
algorithms for identifying similarity.
• Statistical tests such as regression analysis, factorial Anova analysis and Meta analysis can be used to draw conclusions regarding whether or not variables are related to each other.

Questions?