Embed Size (px)
Citation preview

OXFORD BROOKES UNIVERSITY
RESEARCH AND ANALYSIS PROECT (RAP)
THE BUSINESS AND FINANCIAL PERFORMANCE OF FAUJI CEMENT COMPANY OVER THREE YEARS PERIOD (2009-2011)
PREPARED BY : ROHAIL AMJAD
ACCA REGISTRATION : 1346227
WORD COUNT : 6479
MAY 2012

2
REASON FOR CHOOSING TOPIC………………………………………………………………………………3
REASON FOR CHOOSING COMPANY………………………………………………………………………4
AIMS & OBJECTIVES OF RESEARCH PROJECT…………………………………………………………5
PART II - INFORMATION GATHERING AND ACCOUNTING / BUSINESS TECHNIQUES
RESEARCH QUESTIONS…………………………………………………………………………………………….5
RESEARCH APPROACH…………………………………………………………………………………………….5
PRIMARY SOURCES…………………………………………………………………………………………………7
SECONDARY SOURCES……………………………………………………………………………………………..8
ACCOUNTING/BUSSINESS MODELS USED AND THEIR LIMITATIONS……………………….10
PART III - RESULTS, ANALYSIS, CONCLUSIONS AND RECOMMENDATIONS
PAKISTAN CEMENT INDUSTRY OVERVIEW………………………………….14
COMPANY’S BACKGROUND…………………………… .13
FINANCIAL ANALYSIS………………………………………15
COMPETITOR ANALYSIS……………………………………35
BUSINESS ANALYSIS…………………………………………42
CONCLUSION …………………………………………45
TABLE OF CONTENTS
PART I - PROJECT OBJECTIVES AND OVERALL RESEARCH APPROACH

3
ANNEXURES
ANNEXURE A: References & Bibliography
ANNEXURE B: Statement of Financial Position (FAUJI)
ANNEXURE C: Statement Of Comprehensive income (FAUJI)
ANNEXURE D: Statement Of Financial position (PIONEER)
ANNEXURE E: Statement Of Comprehensive income (PIONEER)
ANNEXURE F: Ratio Calculation
ANNEXURE G: Formula Sheet
PART I - PROJECT OBJECTIVES AND OVERALL RESEARCH APPROACH

4
The first pivotal step of any research dissertation is the choice of an appropriate topic.
But before the eventual decision of topic, there is always a well-thought exercise which
takes into account of various practical factors in meeting the research objectives
adequately. My perplexity regarding the choice of the topic sorted out after having a
brain storming session with my mentor and finally I decided to work on
“The business and financial performance of an organization over a three years period”
This topic has focus over the following two aspects;
1) Financial analysis the assessment of the effectiveness of the debt and investment
that are employed in the business. It also covers the assessment of efficiency and
profitability of business operations and the value and safety against debtor`s claim
against company`s assets.
(Business Dictionary, 2012)
2) Business analysis is an exercise of figuring out business needs and finding
solutions to business problems that are becoming hurdle in the achievement of
desired business objective. Solutions often include a systems development
component, but may also consist of process improvement, organizational change or
strategic planning and policy development
(The free dictionary, 2012)
REASONS OF CHOOSING THE TOPIC
The economic world is now-a-days facing a tough time and the ratio of economic
recession and depression is spreading all round the world. The global recession
has affected the entire world to the extent that the world’s biggest economy has
lost its AAA credit rating and is expected to create double dip recession
(BBC, 2012). This topic founded a platform of analysing the brunt of economic
meltdown over the companies in both financial & non financial prospects.

5
Also from investment point of view, the main pre-requisite includes analysing of
financial and business health of the target company. Conducting research over
this topic will surely improvise my interpretation analysis of the financial
statements.
Moreover, I thought that choosing this topic will increase my understanding of the
accounting and business practices adopted by the companies in Pakistan. Since
ACCA studies have been developed with broad knowledge of accounting and
finance, I now want to apply my knowledge to a real company.
After choosing the topic, I selected Fauji Cement Ltd from cement industry of Pakistan
as my research company.
REASONS FOR CHOOSING THE COMPANY
I choose FAUJI CEMENT COMPANY LIMITED because
Firstly, it is well known for its quality of the Portland cement which is produced at
this company. Not only being a best available cement in the entire cement
industry, it is also is preferred in the construction of highways, bridges,
commercial and industrial complexes, residential homes, and a myriad of other
structures, fundamental to Pakistan's economic vitality and quality of life.
(Accounts manager)
Secondly, the company is run my majority of retired army managers. Army also
had ruled the country for a major time period and the country’s economy in the
time of Army rulers was the best (Defence Pk, 2010). This clearly shows the
competitiveness of the management in running the company. This fact allured
me to pick this company for analysis.
AIMS AND OBJECTIVES OF RESEARCH PROJECT

6
The main aim of my research dissertation, as describe by the topic name, is to analyze
the financial and business analysis of FAUJI CEMENT COMPANY LIMITED over the
past 3 years from FY2009 to FY2011.
This aim is bifurcated into following project objectives;
To do analysis on the financial performance of Fauji cement by applying ratio
analysis over financial data of three years (2009-2011). It will also encompass
the commentary over the variations in the ratios results.
To carry out company’s internal analysis and external analysis by the help of the
SWOT tool.
To assess the macro-environment factors which impacted Fauji cement by
applying PEST model.
To form a conclusion based on my overall research results.
RESEARCH QUESTIONS
Which factors were responsible for variations in profitability ratios over three
years 2009-2011?
Why the financial performance of the company was depressed in 2010?
Which internal or external factors impacted the most in business performance of
company over three years?
RESEARCH APPROACH
My research dissertation will cover business and financial performance of Fauji cement
separately over three years 2009-2011. I will make use of both primary and secondary
sources of information in gathering the required information for covering my project
objectives and research questions.
7
For analyzing and commenting on the year by year financial performance, I will use ratio
analysis covering profitability, liquidity, gearing and investment ratios. For comparison
purpose of financial ratios, I will use an adjacent competitor from the cement industry of
Pakistan.
In evaluating the business performance of Fauji cement, I will apply SWOT and PEST
models which will cover both internal and external implications of various factors on the
company.
Finally I will draw conclusion based on my overall research.
PART II - INFORMATION GATHERING

8
For covering the project objectives adequately, I used both primary and secondary
sources of information.
PRIMARY SOURCE
Once I started to work on financials, I came across many points for discussion which
related to practical key drivers behind variations in financial ratios. For that purpose, I
went to the head office of Fauji cement in my city and took permission from the
administration to have a meeting with the accounts manager Mr. Mohammad Butt. He
discussed the important reasons of variations in financial ratios. He also explained me
the nature of industry practices and key drivers of changes in the cement sector which
helped in my financial and business analysis. He also explained the competitors’
performance which helped me in comparing the results of my chosen company.
Ethical Limitations:
I noticed that accounts manager took a careful approach while discussing the issues
mainly related to company`s internal matters (competitive capabilities/financing modes)
which gave me a practical understanding of confidentiality. As I am a student of
professional body, I decided to overcome this ethical limitation by restricting myself from
asking questions related to internal issues. Also I took permission from him to cover
main points out of this discussion in my project.
Furthermore, owing to monthly closing period in the company, accounts manager could
only give me lesser time as compared to what I expected. But I decided to utilize my
time in an optimum manner and for that I did ground work before my meeting and noted
all the main points for discussion which saved my time in meeting.
SECONDARY SOURCES

9
Annual Reports:
The annual reports of the company and competitor proved a prime source of secondary
data in overall work. The figures taken from financials of the companies were used to
calculate financial ratios and helped in trend analysis. Furthermore, chairman review
and directors report along with notes to the accounts gave a good overview of overall
industry factors and main drivers of changes in recent years. I downloaded the annual
reports from the company`s website.
Books:
After I came to know the technical skills required for analysis I consulted the ACCA
books especially “F7 Financial Reporting” and “P3 Business analysis” to know where
I did stand with regard to the ratio and business analysis. Also for getting a wider
prospect of analysis, I read advance books also mainly from ICAEW namely “Business
reporting” and “Business change”. Since it was an advance level material, I had to
meet my former teacher also for clarification of few points which helped me in applying
financial and business models technically.
Websites:
For getting a wider picture of related industry and companies, I used many websites
(government/Official). They provided me useful information of issues in cement
industries, their linkage to various macro environment factors and many discussion
forums gave me independent comments on the issues prevalent in the industry. Overall
it helped me in developing a basic idea of issues and their impact on the industry.
Print & E media:

10
For acquainting myself with the present situation and latest issues under discussion, I
also used print media (The News) and watched discussion programs on the business
channels (CNBC/Business plus). This gave a good understanding of practical
discussion which helped me in applying the financial and business models with mmore
clarity.
Limitations faced & overcoming them:
Since electricity load shedding is on its peak in Pakistan, I had to face continuous
disruption in using computer. I sorted out this limitation by devising a time table
for avoiding interruption in work.
Also secondary data was prepared for many stakeholders and for sorting out the
relevant data was a time consuming task.
Further limitation of secondary sources was related to latest and updated data.
As many websites were not updated, I tried my best to used authentic websites
and covered all the points in meeting with accounts manager to corroborate my
secondary data. Also I regularly bought cement industry magazines which
helped me in updating my points.
ACCOUNTING AND BUSINESS MODELS USED & THEIR LIMIATIONS

11
Ratios analysis;
It is tool used by individuals to conduct a quantitative analysis of information in a
company's financial statements. In a traditional financial analysis, ratios are calculated
from current year numbers and are then compared to previous years, other companies,
the industry, or even the economy to judge the performance of the company.
(Answers, 2012)
Limitations of ratio analysis:
Ratios analysis only deals with number crunching and ignores issues like product
quality, customer service, employee morale which plays an important part in
overall results.
Ratios are most useful when they are used to compare performance over a long
period of time or against comparable businesses and an industry. This
information is not always available.
(Tutor2u, 2012)
PEST analysis;
PEST analysis is a business measurement tool and it is an acronym for Political,
Economic, Social and Technological factors, which are used to assess the market for a
business or organizational unit. It is also useful for understanding market growth or
decline, and as such the position, potential and direction for a business. Completing a
PEST analysis is very simple and since the factors of PEST are external to the
organization, it is a good subject for workshop sessions and brainstorming meetings.
(Business balls, 2012)
Limitations of PEST;

12
The rapid pace of change in society makes it increasingly difficult to anticipate
developments that may affect an organisation in the future and hence PEST
needs to be updated every time which is practically difficult.
Collecting large amounts of information for PEST makes it difficult to see the
wood for the trees and lead to paralysis by analysis.
(Business High beam, 2012)
SWOT ANALYSIS
SWOT examines and assesses the impacts of internal strengths and weaknesses, and
external opportunities and threats, on the success of the "subject" of analysis. An
important part of a SWOT analysis involves listing and evaluating the firm’s strengths,
weaknesses, opportunities, and threats.
Strengths are those factors that make an organization more competitive than its
marketplace peers.
A weakness is a limitation, fault, or defect within the organization that will keep it
from achieving its objectives.
Opportunities include any favourable current prospective situation in the
organizations environment, such as a trend, market, change etc.
A threat includes any unfavourable situation, trend or impending change in an
organizations environment that is currently or potentially damaging or threatening
to its ability to compete.
(Ventureline, 2012)
LIMITATION OF SWOT ANALYSIS
A SWOT analysis may be limited because it doesn't prioritize issues and provide no
solutions or offer alternative decisions. As it is based on company`s own assumptions, it

13
can generate too many ideas but will not guide you to choose best idea. Also
sometimes it can produce a lot of information.
(Business, 2012)

14
PART III - RESULTS, ANALYSIS, CONCLUSIONS AND
RECOMMENDATIONS
COMPANY`S BACKGROUND
Fauji Cement Company Limited (FCCL), sponsored by FAUJI FOUNDATION,
was incorporated in 1992 in Rawalpindi, Pakistan.
FCCL is from the north region of the country and the cement industries in those
sectors are known for self-sufficiency. The company supplies cement throughout
Pakistan especially in the provinces of Punjab, AJK and NWFP through
extensive dealer’s network.
On June 30, 2010, the Company had installed capacity to produce 1,165,500
metric tons of cement. During the fiscal year ended June 30, 2011, the Company
produced 1,101,677 tons of cement.
(Corporate information, 2012)
The main product of FCCL is Ordinary Portland Cement.
(FCCL, 2012)
15
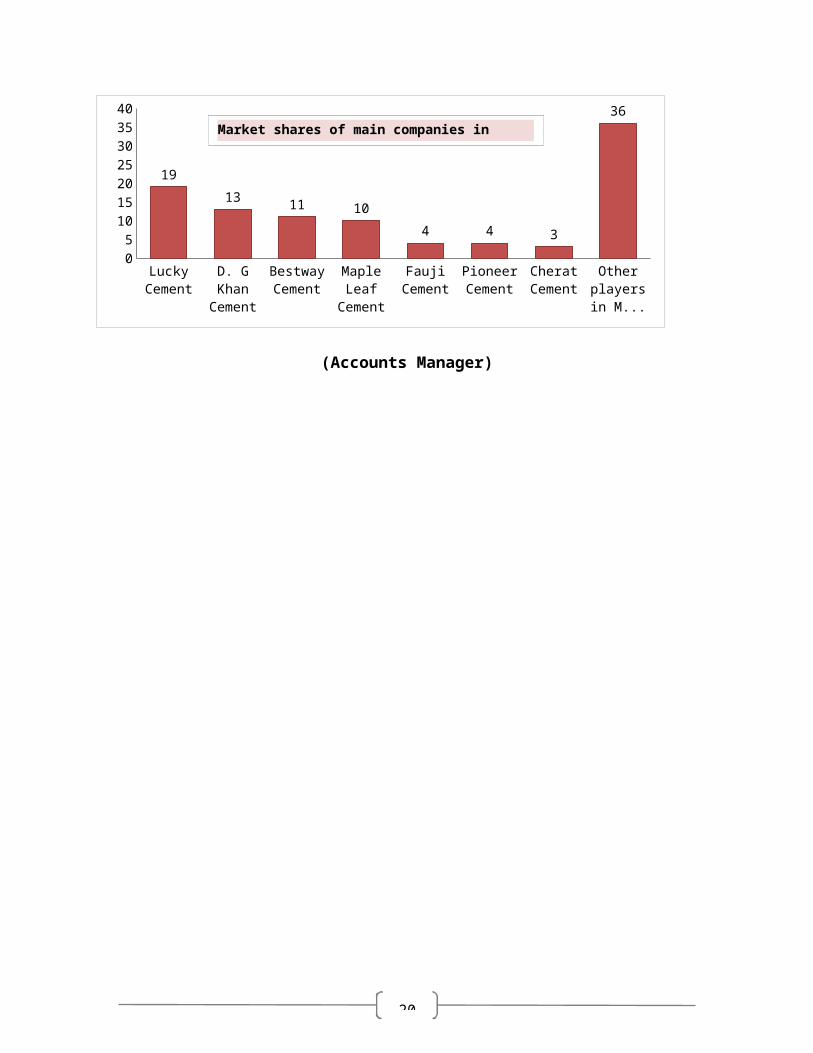
CEMENT INDUSTRY OVERVIEW
Cement industry is among the most important industries that exist in Pakistan at the
moment. Since the required raw materials (Limestone and Gypsum) are present in
abundance in Pakistan along with ample of supply of Natural gas, this great potential
makes the country capable of producing cement not for domestic purpose but also for
international sales.
(South Asian Investors, 2009)
In previous three years, Pakistan cement industry showed a potential for export to
neighboring countries like INDIA, U.A.E, Afghanistan, Iran and Russian states.
(Nation, 2011)
Because of the political instability and lack of availability of funds for sector development
program, cement industry of Pakistan is presently in recession phase. Further situation
is tightened by heavy tax burdens mainly related to levy of Federal Excise duty
@Rs.750 per ton and General Sales tax duty @ 15% on duty paid.
(pkembassy, 2012)
Lucky Cement
D. G Khan Cement
Bestway Cement
Maple Leaf Cement
Fauji Cement
Pioneer Cement
Cherat Cement
Other players in
Market
05
10152025303540
19
13 11 10
4 4 3
36
(Accounts Manager)
Market shares of main companies in Cement Sector (age)

16
FINANCIAL ANALYSIS
Sales Analysis

17
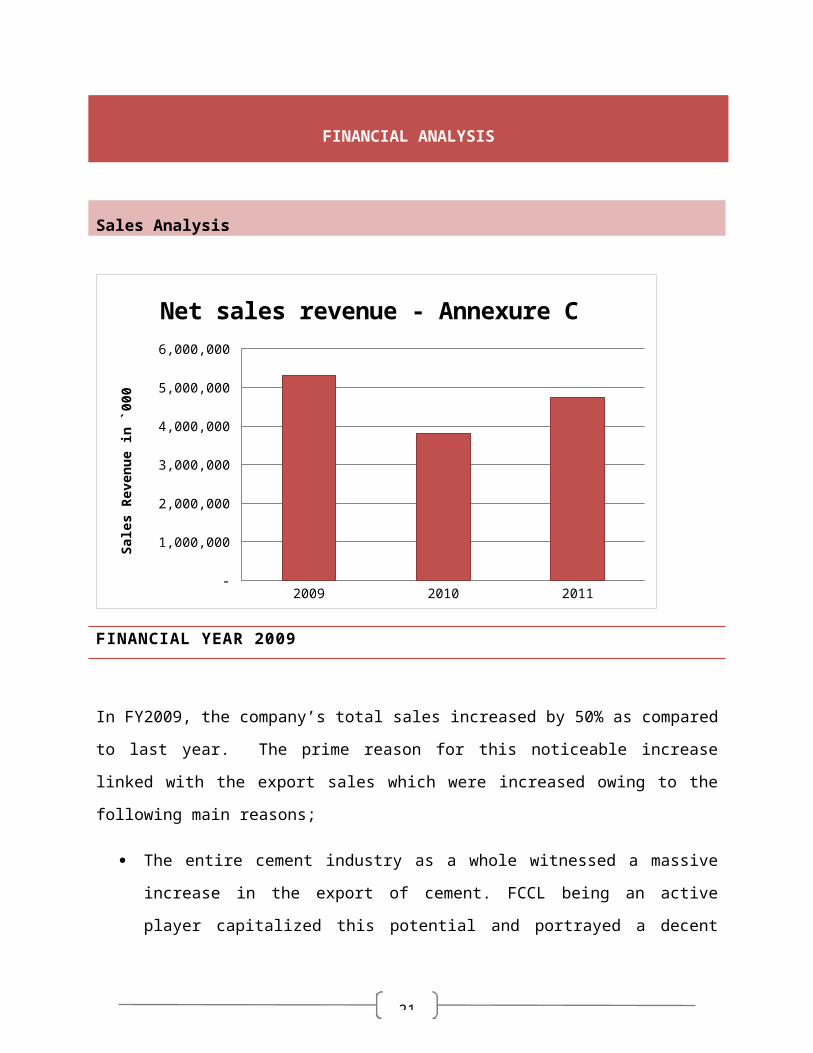
2009 2010 2011
Net sales revenue (`000) 5314538 3808455 4742593
500,000
1,500,000
2,500,000
3,500,000
4,500,000
5,500,000
Net sales revenue - Annexure C Sa
les R
even
ue in
`000
FINANCIAL YEAR 2009
In FY2009, the company’s total sales increased by 50% as compared to last year. The
prime reason for this noticeable increase linked with the export sales which were
increased owing to the following main reasons;
The entire cement industry as a whole witnessed a massive increase in the
export of cement. FCCL being an active player capitalized this potential and
portrayed a decent increase in the exports of the company by 38% from last
year.
(brecorder, 2009)/ (Annual Report 2009, pg14)
The export front in 2009 was opened mainly in neighbouring countries including
Afghanistan, India, Iraq, and Sudan. Since after the end of civil war between
Tamil tigers and government, the reconstruction activities gave further room for
export in neighbouring countries which was well taken by Pakistan cement
industry.
(World trade review, 2009)
18
2008 2009
Local 3889630 5762299
Export 859587 1191024
500,000 1,500,000 2,500,000 3,500,000 4,500,000 5,500,000 6,500,000
Local and export sales (2008-2009) - Annual Report 2009 pg 56
Sale
s in
`000
Further support in sales came from domestic sales of FCCL which rose by 48% from
last year. The following factors supported the local sales;
Increase in rehabilitation activities after army operation in northern area of
Pakistan.
(The free library, 2009)
Further the situation was alleviated by lower prices of cement in 2009. A material
reduction of Rs 45 was witnessed on 50Kg cement bag. As the coal prices worldwide
fell down, this ultimately helped the cement companies’ local sales growth.
(Daily times, 2009)
FINANCIAL YEAR 2010
This year witnessed the weakest sales figure in all three years (2009-2011). The main
reason of this depressed performance was linked with decline in cement prices
domestically and internationally by 27.53% and 12.5% respectively. This was further
exacerbated by reduction in the turnover because of the reduced demand of the
cement. On the other hand, export sales showed increased and rose by trivial 1%
which could not support the overall sales figure.
(Nation, 2010)
19
2009 2010
Local 5762299 3696878
Export 1191024 1205518
500,000 1,500,000 2,500,000 3,500,000 4,500,000 5,500,000 6,500,000
Local and export sales (2009-2010) - Annual Report 2010 pg 52
Sale
s in
`000
FINANCIAL YEAR 2011
This year, the situation was improved and FCCL sales figure rose by 24% from last
year. Although, the cement industry as a whole was suffering from fluctuating level of
sales, yet the performance of FCCL remained smooth in respect of sales during 2011.
Upon analyzing the notes to the accounts, it was revealed that the exports increased by
37%. On the local sales side, the rehabilitation work in flood affected areas surged the
domestic sales which showed an increase by % from last year.
(Tribune, 2011)/ (Annual Report 2011, pg7)
20
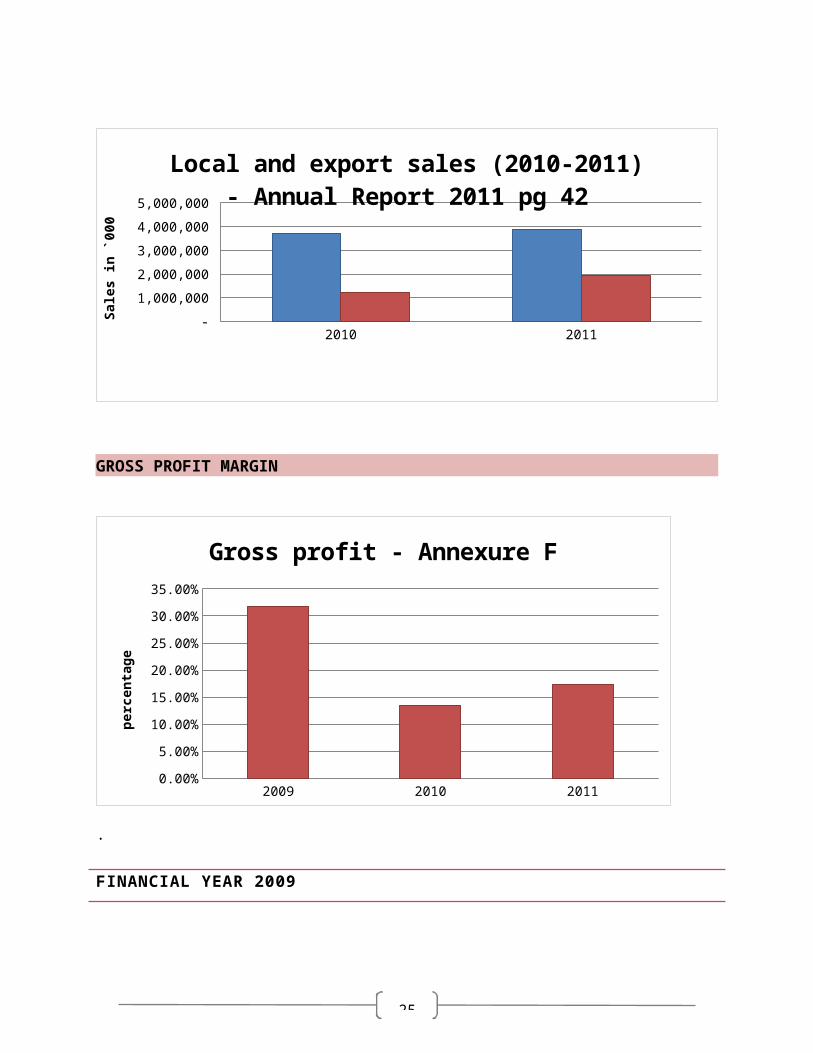
2010 2011
Local 3696878 3864232
Export 1205518 1924070
250,000 750,000
1,250,000 1,750,000 2,250,000 2,750,000 3,250,000 3,750,000 4,250,000
Local and export sales (2010-2011) - Annual Report 2011 pg 42
Sale
s in
`000
GROSS PROFIT MARGIN
2009 2010 2011
GP 0.317500000000001 0.1354 0.1735
2.50%
7.50%
12.50%
17.50%
22.50%
27.50%
32.50%
Gross profit - Annexure F
perc
enta
ge
.
FINANCIAL YEAR 2009
21
The GP in FY 2009 remained the prominent figure in all three years’ time. GP ratio
significantly increased to 31.70% which was 18.56% last year. This strong GP was fully
supported by increase in sales (by 50%) over the same year on both local and exports
fronts.
But at the same time, GP growth was curbed by the variations in following heads of cost
of sales;
Productions have increased by 8962 Metric Tons which result in increased raw
material and packing material consumption. Also there was an increase in fuel
cost which was linked with international fuel prices. As the coal is used in
production of cement, the increase in coal prices also sucked the GP growth by
giving rise on cost of sales.
(Daily times, 2009)
Further pressure came from electricity cost side which caused a 34% increase in
power cost for the year.
(Brecorder, 2009)
FCCL 2008 2009
Power consumption 451,419 604,701
(Annual Report 2009, pg 57 )
FINANCIAL YEAR 2010
FY 2010 was a tough year for FCCL and the company witnessed a reduction in GP ratio
which fell from 31.75% to 13.54% over 2009 to 2010. The major pressure came from
the sales side which reduced dramatically by 28% owing to decrease in selling prices of
cement in Pakistan.

22
Further burden of GP ratio came from cost of sales which did not decrease in proportion
to the sales. The disproportionate decrease in cost of sales was linked with the following
factors;
Depreciation cost increased by 4.5% which was related to the addition of new
plant, machinery and equipment and motor vehicles.
Furthermore, there was also an increase of 14.5% in Power cost. This year,
FCCL owned their own power generating unit. This means that this power cost
could have been increased further, if the company didn’t invest in it.
(Annual report 2010 pg.48, 53)
FCCL 2009 2010
Rs.000 Rs.000
Power Consumption 604,701 692,496
Depreciation
297109 310389
(Annual Report 2010, pg53)
FINANCIAL YEAR 2011
Finally in 2001, Gross profit margin has increased to 17.35% from 13.54% in last year.
This positive result was supported increase in sales which jumped up by 24.53% from
last year.
The GP growth was restricted by the increase in following elements of cost of sales
during the same year;
Fuel cost rose by 43.2 % which ultimately affected the cost of production.

23
Due to increase in production in 2011, cost of packing and Raw material
consumption also rose by 19.03% and 19.39% respectively.
Coal prices went up by 55% internationally which increased the cost of
production
salaries and wages cost rose by 36.99%
(Cem week, 2011)
FCCL 2010 2011
Rs.000 Rs.000
Salaries and Wages
Raw material
consumption
Packing consumption
Fuel Consumption
308169
223889
320124
1337948
224949
279254
356182
1917064
(Annual Report 2011, pg 44)

24
NET PROFIT RATIO
2009 2010 2011
NET PROFIT 0.267477060094407 0.0853130731490854 0.102929557733502
2.50%
7.50%
12.50%
17.50%
22.50%
27.50%
NET PROFIT - ANNEXURE-F
perc
enta
ge
FY 2009
This year the net profit margin was 26% which showed a twofold fold increase from last
year result (NP= 2008.) Upon analysis of notes to the accounts, it was revealed that
increase in sales caused a corresponding increase in NP for year 2009. Sales primarily
showed moment with increase in the price of the cement. Other factors which supported
the NP result were as follows;
The distribution cost showed a decreased by 6% despite with the increase in the
sales. This decrease was linked with the reduction in the export and freight
charges.
Furthermore, the administration cost as compared to sales this year showed a
reduction as compared with the previous year result. It showed that the company
managed to control its administration expense. Administration expenses were
almost 2% of the sales this year as compared to the 2.1% of the sales in the last
year.
(Annual report 2009 pg 30/58)
25
FCCL 2008 2009
Rs.000 Rs.000
Distribution Cost 53383 50260
Administration Cost 76495 103186
(Annual Report 2009, pg58)
FY 2010
In 2010, net profit margin dropped to 8.53% which showed a decrease of 68.1 % as
compared with last year result. Since the sales were depressed during the year, it put a
burden on profit figures. The sales prices went down which impacted the sales figure.
Also, the other income of the company showed a noticeable reduction. It reduced by
600% mainly due to reduction in profit on bank deposit.
The NP for 2010 could have been worse if the finance cost went up also. But
surprisingly, the finance cost showed a reduction of 82% from last year due to fall in
interest on short term borrowings. This gives a trivial relief but overall the NP margin
showed a material reduction from last year result.
(Annual Report 2010.pg 53/54/55)
FCCL 2009 2010
Rs.000 Rs.000
Finance Cost 41,206 224,716
Other income 190,424 27,220

26
(Annual Report 2010, pg 53)
FY 2011
This year, the company took a U-turn and Net Profit margin was 10.29% which showed
an increase of 27% from last year result. This time the support to NP came from the
following two sides;
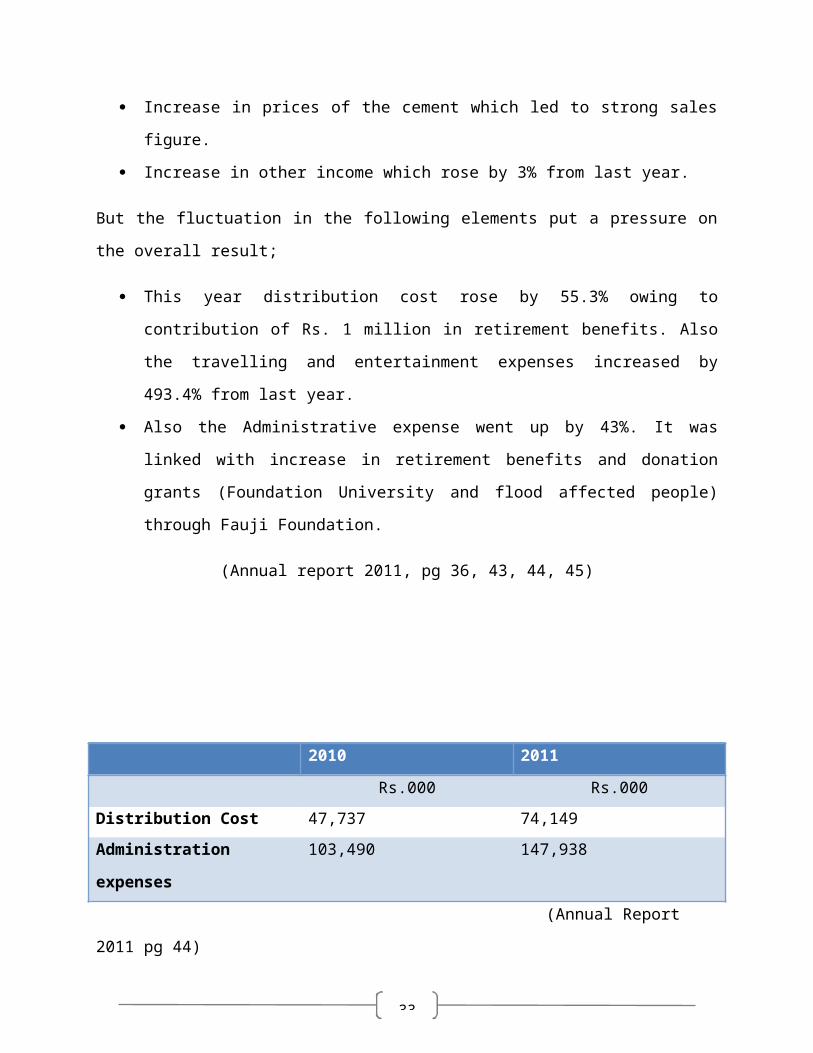
Increase in prices of the cement which led to strong sales figure.
Increase in other income which rose by 3% from last year.
But the fluctuation in the following elements put a pressure on the overall result;
This year distribution cost rose by 55.3% owing to contribution of Rs. 1 million in
retirement benefits. Also the travelling and entertainment expenses increased by
493.4% from last year.
Also the Administrative expense went up by 43%. It was linked with increase in
retirement benefits and donation grants (Foundation University and flood affected
people) through Fauji Foundation.
(Annual report 2011, pg 36, 43, 44, 45)
2010 2011
Rs.000 Rs.000
Distribution Cost 47,737 74,149

27
Administration expenses 103,490 147,938
(Annual Report 2011 pg 44)
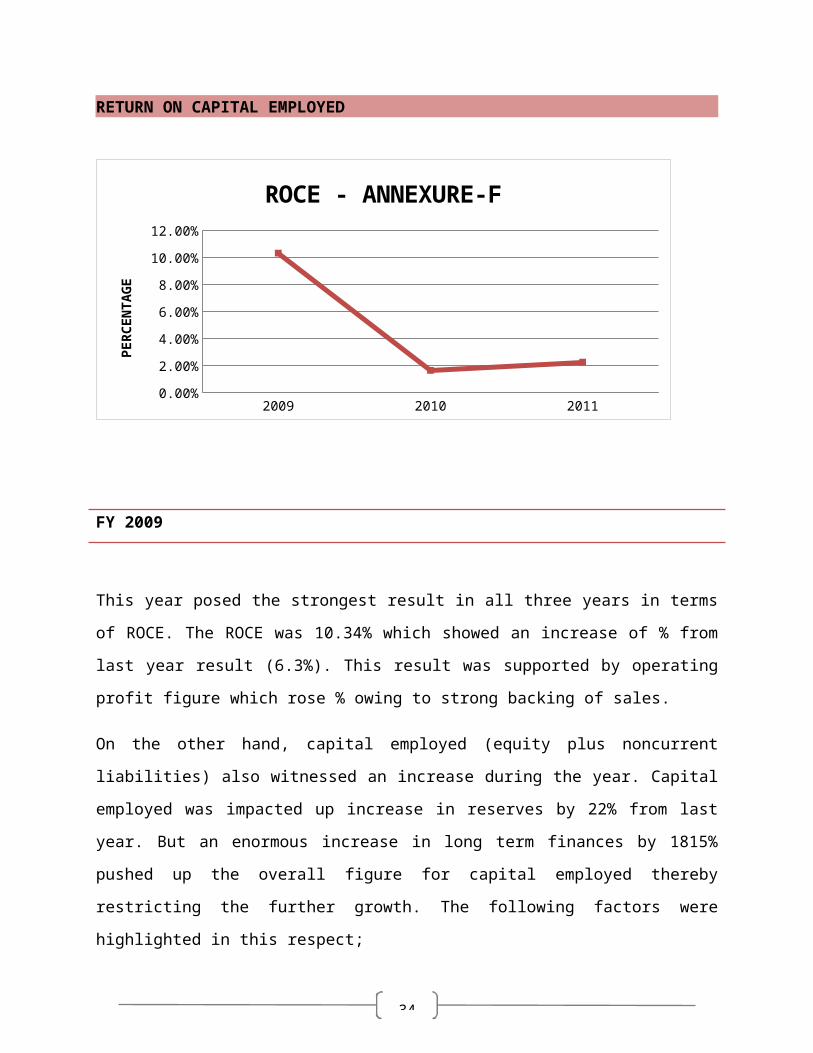
RETURN ON CAPITAL EMPLOYED
2009 2010 2011
ROCE 0.103439628584907 0.0167026350479466 0.0227646757134794
1.00%
3.00%
5.00%
7.00%
9.00%
11.00%
ROCE - ANNEXURE-F
PERC
ENTA
GE
FY 2009
This year posed the strongest result in all three years in terms of ROCE. The ROCE
was 10.34% which showed an increase of % from last year result (6.3%). This result
was supported by operating profit figure which rose % owing to strong backing of sales.
On the other hand, capital employed (equity plus noncurrent liabilities) also witnessed
an increase during the year. Capital employed was impacted up increase in reserves by
22% from last year. But an enormous increase in long term finances by 1815% pushed
up the overall figure for capital employed thereby restricting the further growth. The
following factors were highlighted in this respect;
FCCL partake an agreement of syndicated term finance with a consortium of
banks amounting to Rs. 1740 millions.

28
Also, FCCL took a foreign currency loan from ABN AMRO Bank amounting to
Rs. 4554.7 millions.
(Annual report 2009, pg 30, 45, 46)
FY 2010
This year posed a very depressing result for ROCE which fell down to 1.7% from
10.34% last year.
The major factor for this diminishing performance was huge decrease in profits from the
last year (see sales analysis above). Furthermore, the other prominent reason for this
downfall was increase in capital employed of FCCL. Capital employed rose owing to
prominent increase in long term financing by 91% since last year. The major elements
of this increase were various loans from NBP, HBL and RBS banks. Also some part of
long term finances(Rs 72 million) increase was related currency swap agreements
done by FCCL with RBS(Royal bank of Scotland) to hedge its foreign currency
exposure.
(Annual report 2010, pg 43, 44)
FY 2011
This year, FCCL tried to alleviate the situation was showed a slight increase in ROCE
with 2.6% result. This result was mainly supported by sales figure which provided a
good cushion for operating profit.
Further support came from capital employed side. Its component Reserves showed an
increase of 24.7% from last year mainly due to advances received for issuance of right
issue shares (amounting to Rs.861.9 million). Also a slight contribution in betterment of
result came from the decrease I long term liabilities by 0.9% owing to classification of
current portion of long term liabilities which reduced the overall long term liabilities
figure.

29
(Annual report 2011, pg 23, 33, 34)
Year Ended 2009 2010 2011
Shareholder’s Equity (Rs. millions) 9690.7 9610.7 11014
Long term finance-secured (Rs. millions) 6224.2 11909.0 11805
Capital Employed (Rs. millions) 15914.9 21519.7 22819
Profit before interest and tax (Rs. Millions) 1646.2 366.1 592
ANNEXURE B,C

30
GEARING RATIO
2009 2010 2011
Gearing ratio 0.391093927231536 0.54330222815397 0.453908582260637
5.00%
15.00%
25.00%
35.00%
45.00%
55.00%
Gearing ratio Annexure-F
PERC
ENTA
GE
FY 2009
In 2009, the gearing of the company was 39.11% which showed an increase of % from
last year result. The major reason of this material increase was linked with rise in
amount of long term liabilities.
FCCL`s long term finance (secured) showed a massive increase of 1815.1%
from the previous year. This enormous increase was the upshot of partaking
additional loans from different banks mainly from ABN AMRO bank, Allied
bank, Bank Alfalah and United bank limited. These loans were used to
finance the construction of new production line.

31
(Account Manager)
On the part of equity, the reserves of the company showed a decent increase of 22%.
Since the year end status was profit making for FCCL, it increases the reserves of the
company. Since FCCL shares remained same during the year, this increase in reserves
could not help much in reducing the gearing of 2009.
(Annual Report 2009, pg 28)
FY 2010
In 2010, FCCL posted another adverse gearing situation and gearing ratio was 54%.
This enormous increase in gearing was linked with the following factors;
On part of long term liabilities, they increased by 91.33% from last year.
FCCL took further long term loans (secured) from Royal Bank of Scotland
(RBS), National Bank of Pakistan (NBP) and Habib Bank of Pakistan. This
financing mode was used to support the work under construction (new
product line).
Furthermore, the decrease in equity further deteriorated the result. Equity
although got a support from the profit for the year. But it was reduced by
increase in hedging reserve. This reserve went up by 59.4% and sucked the
figure of equity (the denominator) which leads to a depressing result. This
year share capital remained unchanged again.
(Annual report 2010, pg 42, 43)
FY 2011

32
Finally in 2011, FCCL managed to reduce the alarming gearing position and the gearing
ratio was 45%. It was decreased by % from last year. This time, the betterment came
from the equity side (the denominator) which showed an increase of 14.5% from last
year. This was owed to increase in accumulated profits and advances received
(amounting to Rs.861.87million) for issuance of right issue shares. Also there was a
slight decrease in long term debts by 0.87% of FCCL as the company managed to
repay few debts.
(Annual report 2011, pg 33, 34)
CURRENT RATIO
2009 2010 2011
Current Ratio (times) 0.630000000000007
0.52 0.89
0.050.150.250.350.450.550.650.750.850.95
Current Ratio (times) - Annexure F
times
FINANCIAL YEAR 2009
FCCL current ratio was 0.63 in 2009 which was 2:1 last year. Despite having a strong
position on sales and profits for the same year, FCCL current ratio declined by %age
from last year`s result.
The prime factors which led to this depressed result were;
33
Reduction in current assets mainly cash and stock which reduced by 95% and
40% respectively from last year.
Increase in current liabilities mainly trade and other payables which rose by
192% from last year. The factor which triggered this result was current portion of
currency swaps (50 million) which became payable this year and increased the
overall current liabilities.
. (B recorder, 2009)/ (Annual report 2009 pg.55)
2008 2009
Rs.000 Rs.000
Cash and Bank 3783909 175947
Stock 137451 230089
Trade and other payables 493210 1441825
(Annual Report 2009 pg 28)
FINANCIAL YEAR 2010
In 2010, current ratio declined moderately to 0.52:1 from 0.63:1 last year. The major
reason of this deteriorated result was more increase in current liabilities as compared to
current assets.
Current liabilities during 2010 rose by 51.6% from last year mainly due to
Noticeable increase in Mark-up accrued by 265.94%
Also the current portion of long term financing (NBP-National bank of
Pakistan/Habib Bank of Pakistan) figure showed an increase by 230%% from
last year.
Current assets, on the other hand, showed an increase of 25% from previous year.
Mainly the increase was witnessed on company`s cash balance which rose by 9.25%.
(Annual report 2010, pg 28, 52)
34
2009 2010Rs.000 Rs.000
Mark up accrued 95407 349130Current portion of long term finance
325000 1071384
(Annual Report 2010, pg13)
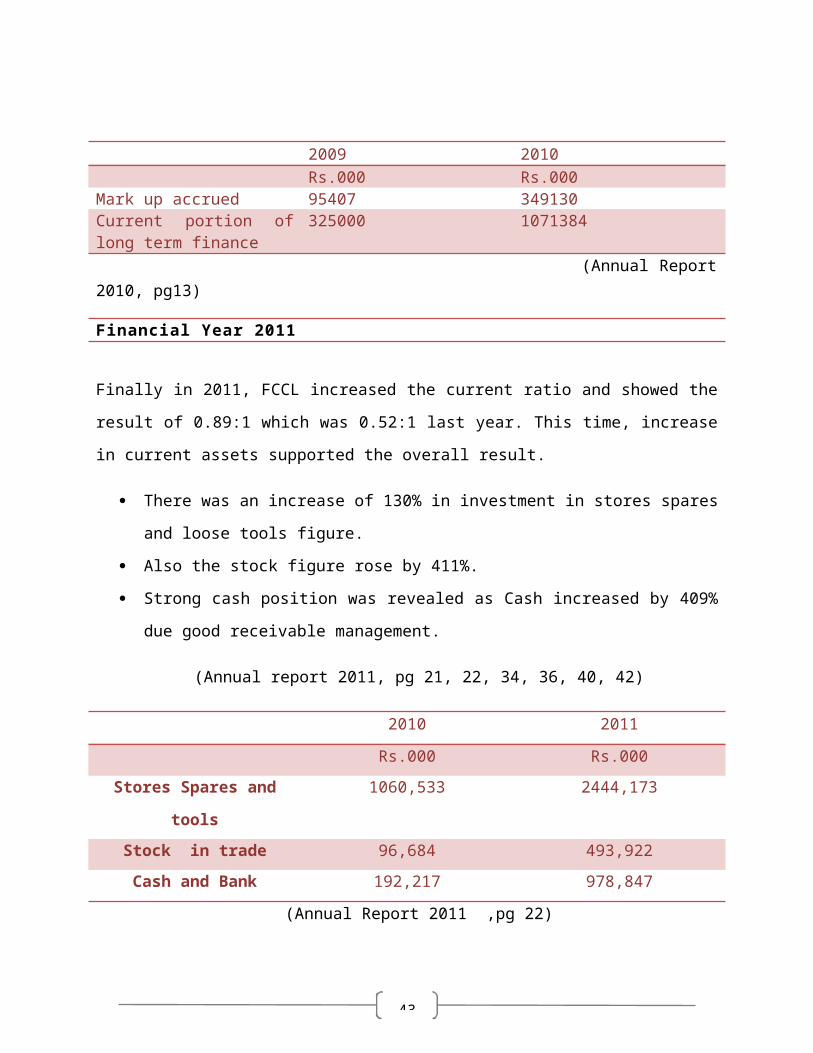
Financial Year 2011
Finally in 2011, FCCL increased the current ratio and showed the result of 0.89:1 which
was 0.52:1 last year. This time, increase in current assets supported the overall result.
There was an increase of 130% in investment in stores spares and loose tools
figure.
Also the stock figure rose by 411%.
Strong cash position was revealed as Cash increased by 409% due good
receivable management.
(Annual report 2011, pg 21, 22, 34, 36, 40, 42)
2010 2011
Rs.000 Rs.000
Stores Spares and tools 1060,533 2444,173
Stock in trade 96,684 493,922
Cash and Bank 192,217 978,847
(Annual Report 2011 ,pg 22)
35
EPS
2009 2010 2011
EPS 1.45 0.310000000000001 0.52
0.1
0.3
0.5
0.7
0.9
1.1
1.3
1.5
EPS ANNEXURE-F
Rupe
es
FY 2009
The EPS of FCCL in 2009 was Rs.1.45 which showed an increase of % from last year
EPS (Rs.0.6). As the sales provided a solid platform for profits figure, FCCL ended up
with highest EPS figure in all three years (2009-2011). The denominator of EPS
remained unchanged as the company didn’t issue any shares during the period.
(Annual report 2009, pg 44)
FY 2010
With the fall in sales and profits for the year 2010, EPS went down to Rs.0.31 in 2010.
This showed a decrease of % from last year result. As the cement prices fluctuated in
adverse manner (see above sales analysis), it created an overall tension on sales side
and ultimately led to reduced profits. Also the shares issued remained unchanged.

36
FY 2011
In 2011, FCCL`s EPS was Rs.0.52 which was linked with increase of profit after tax for
the year by 70%. As there was no change in shares, the profit increase caused
betterment in overall result.
(Annual report 2011, pg 32)

37
COMPETITOR ANALYSIS
COMPETITOR INTRODUCTION:
Pioneer Cement Limited (PCL) was incorporated in Pakistan as a public
company limited by shares on February 09, 1986.
Being a plc, its shares are quoted on all stock exchanges in Pakistan.
The principal activity of the PCL is manufacturing and sale of cement.
PCL Annual Report 2011, pg30
PROFITABILITY COMPARISON
2009 2010 2011
FCCL 0.317511700923017 0.135378782209583 0.173544936282747
PCL 0.266565871404046 -0.0209097523932087 0.140667884468625
-2.50%2.50%7.50%
12.50%17.50%22.50%27.50%32.50%
Gross Profit - Annexure F
perc
enta
ge
FCCL outshined PCL in terms of Gross Profit margins. The company showed strong
results of 31.75%, 13.54% and 17.4% as compared to PCL moderate results of 26.7%,-
2.1% and14.1% over 2009, 2010 and 2011 respectively. In 2010, PCL witnessed gross
loss also. FCCL got a strong support from sales side as compared to PCL over 2009-

38
2011. Another factor which created a noticeable difference was power cost of both
companies. By owing a power generating unit, FCCL took advantage of constants
electric supply whereas PCL electricity and fuel cost remained a cause of concern over
2009-2011.
(PCL annual report 2010, pg 23)
2009
2010
2011
-25.00% -15.00% -5.00% 5.00% 15.00% 25.00%2009 2010 2011
FCCL 0.267477060094407 0.0853130731490854 0.102929557733502
PCL 0.0348595616006048 -0.221883767804145 0.0136213778862741
Net Profit - Annexure F
In line with GP, FCCL again took lead in Net Profit ratio results over three years. PCL
results were noticeably lower than that of FCCL inclusive of one net loss year 2010.
The main factor which lead to the significant difference were PCL` increase in
distribution cost. Since PCL tried to boost sales by targeting both local and export
market to save the situation. It leads to increase in distribution cost which ultimately
impacted the NP over 2009-0211.
(PCL annual report 2010, pg 48, 49)

39
2009 2010 2011
FCCL 0.103439628584907 0.0167026350479467 0.0227646757134795
PCL 0.11038447080647 -0.0971182985999395 0.0878038036328226
-12.50%
-7.50%
-2.50%
2.50%
7.50%
12.50%
ROCE/LOCE - ANNEXURE FPE
RCEN
TAGE
Despite the fact that, PCL posed lower profits from that of FCCL, it produced better
ROCE figures in 2009 and 2011 as compared to FCCL (except 2010 in which it was a
loss on capital employed). This difference was mainly linked with capital employed of
both companies. Since PCL long term loans were not signification, FCCL capital
employed was impacted by long term loans (taken to support product line construction)
which ultimately affected the ROCE result.
(PCL annual report 2010, pg 22/36)
Annexure B,D 2009 2010 2011
Rs`000 Rs`000 Rs`000
Capital employed (FCCL) 15,914,916.00 21,519,715.00 22,819,497.00
Capital employed (PCL) 3,529,315.00 2,684,449.00 2,871,192.00
40
GEARING COMPARISON
2009 2010 2011
FCCL 0.391093927231536 0.54330222815397 0.453908582260637
PCL 0.191846975831595 0.0970288099381532 0.0753769521860131
5.00%15.00%25.00%35.00%45.00%55.00%
Gearing ratios- Annexure FPe
rcen
tage
From gearing point of view, PCL remained low geared company as compared to FCCL
from 2009-2011. Since FCCL main source of finance is external borrowing, it makes the
company more risky from gearing point. PCL on the other hand adopted effective debt
management techniques, technically called restructuring, which helped the company in
reducing the overall gearing in all three years.
(Accounts Manager)
LIQUIDITY COMPARISON
2009 2010 2011
FCCL 0.629378883641997 0.519639189292618 0.889945661257554
PCL 0.292501771931177 0.27 0.27
0.050.150.250.350.450.550.650.750.85
Current Ratios - Annexure F
times

41
FCCL remained better in all three years in term of liquidity position. Upon analysis of
notes the accounts, it was revealed that PCL current liabilities were mounting as
compared to current assets which caused this difference in results. PCL was impacted
by the following;
Current liabilities of PCL went up mainly because of a higher current portion of
long term finances from 2009-2011.
PCL also lacked behind in current assets figures with that of FCCL. It was
basically linked with higher cash balances, stores, spare parts and loose tools of
FCCL.
(PCL annual report 2010, pg 22)
EPS COMPARISON
2009 2010 2011
FCCL 1.45 0.310000000000001 0.52
PCL 0.18 -2.87 0.54
-3.5
-2.5
-1.5
-0.5
0.5
1.5
EPS Ratios - Annexure F
FCCL remained better in terms of EPS as compared to PCL in all three years. Although,
FCCL is presently offering trivial EPS to the investor, yet the company saved itself from
giving loss per share like PCL in 2010. As increase in production cost was same for
both companies, yet FCCL covered its production cost with strong support of sales as
compared to PCL and thereby giving some return on ordinary shares.

42
SWOT ANALYSIS
STRENGTHS
The Portland cement that is being produced by FCCL is the best in country at the
moment.(Annual Report 2011)
The company has a certification from UKAS which is the sole national
accreditation body recognised by the UK government. It gives FCCL an edge
over the other companies as the certification is audited by Moody International
thus giving more credibility and value to the organisation.
FCCL is certified with ISO 9001:2008 and ISO 14001: 2004 certifications.
The awards that were given to FCCL reflect their effort in the development of
their corporate social responsibility. FCCL have two awards for CSR;
1. National CSR award 2010
2. Annual environment excellence award 2011
(Accounts manager)
WEAKNESS
The company’s capacity utilization has been decreasing continuously for the last
three years.
The huge amount of long term finances and related convents have put the
gearing position of FCCL in question in eyes of investors.
(Accounts manager)
OPPORTUNITIES
43
The development of Basha Dam is in the pipeline which provides a good
opportunity to Fauji Cement to increase its local sales in that area.
(Dawn, 2010)
As India has been given the status of “Most favoured Nation” by Pakistan which
creates an opportunity to export in Indian market. It can be very beneficial for the
company.
(Guardian, 2011)
THREATS
If the Basha dam’s project is postponed, the company will be experiencing some
decline in the local sales figure.
(Dawn, 2012)
The cost of production for all cement companies and FCCL could rise if the Coal
and fuel prices continued to increase in future.
As with the reduction of construction activities in European region, their
companies might park their excess capacity in Asian region. If this happens,
there will be a hard-hitting competition for Pakistani cement manufacturers. This
will also lead to price wars and FCCL could be affected as a brunt of it.
(Daily times, 2011)

44
PEST ANALYSIS
POLITICAL
The government of Pakistan was appealed by All Pakistan cement
manufacturers association (APCMA) to cope with the current debacle that exists
in the cement industry.
(Global cement, 2012)
The government had not been fulfilling its promises mainly provision of subsidy
for the inland freight, reduction in Federal Excise duty and General Sales tax.
Furthermore, government also cut the PSDP (Public sector development
programs) by 77% recently. This led to tensed situation for FCCL in 2010 where
the company witnessed depress situation on local sales side.
(Pakistan today, 2011)
Also the export sales of FCCL depend on the political relations with the
neighbouring countries (particularly India). This was seen with the increase in
exports sales during 2009 of FCCL. But after the unfortunate event of Mumbai
attacks, the cross border relations turned stiff afterwards and both countries cut
of trade agreements. This also impacted FCCL export market and company
faced a loss of export sales.
(Accounts manager)
ECONOMICAL
In recent years, the financial crunch has impacted every major economy of the
world. Pakistan also got hit severely and apart from it, the war against terrorism
convoluted the economic situation in the country. This economic pressure
caused fluctuation in inflation rate which impacted the cement sector cost of

45
production. FCCL also witnessed the see-saw of profits along with with changes
in aforesaid factors.
(Trading economics, 2011)
Also FCCL debt structure mainly consists of long term debts on floating interest
rates linked with KIBOR (Karachi interbank offer rate). This means that the
current economic pressure can further provoke variations in interest rates which
can impact the fiancé cost of FCCL adversely.
(Trading economics, 2011)

46
SOCIAL
Also with the increase in housing societies and rising population, it means that there will
likely to be increase local sales in coming years for FCCL. At present, FCCL is
moderately targeting the local market which means that this opportunity should be
further explored by the company otherwise it could have lose a major share of local
sales.
(Trading economics, 2011)
TECHNOLOGICAL
FCCL showed its commitment towards adaptation of latest technology. It was evident
with the following actions;
A new Cement Plant Line (7560 TPD) has just been installed in the company
which is the latest state of the art equipment and is expected to be of great value
to the cement sector as a whole.
(Brecorder , 2011)

47
Also FCCL was the initiator on installation of first ever Refuse Derived Fuel
(RDF) Processing Plant. It cost around Rs. 320 Million for FCCL. This plant used
the solid waste (from Municipal dumping sites) and converted this waste into fuel
for subsequent usage.
(FCCL, 2011)
CONCLUSION

48
After the entire analysis, the following words earn the honour to conclude this project.
FINANCIAL ANALYSIS
FCCL showed moderately decent sales figures over 2009 and 2011 but excluding 2010.
The major influence on sales came from export side and a nominal contribution was
also witnessed on local sales market. Along with that, Government spending on
infrastructure and trade relations with neighboring countries(mostly Asian region) also
contributed its share in boosting up sales figure over 2009-2011.
Other profitability ratios viz, gross profit, Net profit and Return on capital employed,
followed the same movement as directed by sales. Overall in three year (2009-2011),
few external factors remained a source of fluctuation in cost of sales for respective
years. Prominent factors were electricity prices, coal prices and fuel cost. And since, the
aforesaid factors were dependent on uncontrollable external factors (government
policies/international prices movements), FCCL had no choice but to bear them.
The gearing position of FCCL over 2009-2011 remained a cause of concern for the
company. It was noted that company used long term debt financing for supporting the
capital expenditures. This portrays the company`s preference of debt financing apart
from being equity centric. This not only sucked the profit figures with related finance
cost, but also surged up the current liabilities over 2009-2011. This issue was also
highlighted in current ratio results over three year.
In terms of EPS, FCCL offered a moderate return in all three years.
COMPETITOR ANALYSIS
FCCL outshined PCL in terms of profitability ratios results. PCL result showed a less
effective management on production and admin cost as with FCCL. But on gearing side,
PCL showed a better position from of FCCL which means that it will be relatively easier

49
for PCL to obtain external debts in future. PCL could offer attractive return to ordinary
shares holders with their thin EPS results over 2009-2011.
PEST
FCCL business performance witnessed many turns which was linked with government
actions mostly in form of trade relations and tax burdens. From economic prospect, the
company had to bear the brunt of interest rate fluctuations which can only be mitigated
by reducing the debt burden. Technologically, FCCL kept abreast to latest development
which shows that company is committed to improve its operations. Also the social
factors remained supportive for FCCL over 2009-2011.
SWOT
FCCL possesses enough strength to increase its market share on local and export
platforms. But owing to debt financing burden, the company might face problems in
initiating capital investments. Also FCCL results are prone to fluctuation in few external
factors mainly trade relation across border and local rehabilitation projects. Since
Pakistan is going through tough phase, the aforesaid factors should be considered by
the FCCL management.