Embed Size (px)
Citation preview

HAL Id: hal-01621421https://hal.archives-ouvertes.fr/hal-01621421
Submitted on 23 Oct 2017
HAL is a multi-disciplinary open accessarchive for the deposit and dissemination of sci-entific research documents, whether they are pub-lished or not. The documents may come fromteaching and research institutions in France orabroad, or from public or private research centers.
L’archive ouverte pluridisciplinaire HAL, estdestinée au dépôt et à la diffusion de documentsscientifiques de niveau recherche, publiés ou non,émanant des établissements d’enseignement et derecherche français ou étrangers, des laboratoirespublics ou privés.
Sequence of rifting in Afar, Manda-Hararo rift, Ethiopia,2005–2009: Time-space evolution and interactions
between dikes from interferometric synthetic apertureradar and static stress change modeling
Raphael Grandin, A. Socquet, E. Jacques, N Mazzoni, J de Chabalier, G King
To cite this version:Raphael Grandin, A. Socquet, E. Jacques, N Mazzoni, J de Chabalier, et al.. Sequence of rift-ing in Afar, Manda-Hararo rift, Ethiopia, 2005–2009: Time-space evolution and interactions be-tween dikes from interferometric synthetic aperture radar and static stress change modeling. Jour-nal of Geophysical Research : Solid Earth, American Geophysical Union, 2010, 115, pp.2156-2202.�10.1029/2009JB000815�. �hal-01621421�
Sequence of rifting in Afar, Manda‐Hararo rift, Ethiopia,2005–2009: Time‐space evolution and interactionsbetween dikes from interferometric syntheticaperture radar and static stress change modeling
R. Grandin,1,2 A. Socquet,1 E. Jacques,1 N. Mazzoni,1 J.‐B. de Chabalier,1,3
and G. C. P. King1
Received 21 December 2009; revised 5 July 2010; accepted 28 July 2010; published 16 October 2010.
[1] Thirteen dike intrusions in the Manda Hararo rift, Afar (Ethiopia), from September2005 to June 2009, studied using an extensive interferometric synthetic aperture radar(InSAR) data set, provide insight into the mechanics of a major active rift. Kinematicinversions of InSAR data reveal that dikes opened by 0.8–3.5 m at an average 5 km depth,with volumes of 0.04–0.2 km3 (with up to 12 m opening and a volume greater than 1 km3
for the September 2005 megadike). Dikes have their source in a midsegment magmareservoir, which induces a local shallowing of the brittle‐ductile boundary, presumablydue to thermal weakening of the lithosphere. The smaller dikes in 2006–2009 wereemplaced in regions of minimum opening of the September 2005 megadike, above thecentral magma reservoir. In contrast, the most voluminous dike intrusions in 2006–2009occurred near the locus of the peak of maximum opening of the September 2005megadike, ∼10 km north of the magma source. This may suggest that tension on the plateboundary was highest there, both prior to 2005 and possibly also after 2005. Evolution anddistribution of normal stress on the plate boundary throughout the rifting episode mayindicate that tension near to the magma reservoir is lower than toward segment ends.Average relief of normal stresses of tectonic origin coeval to dike intrusions is comparablewith shear stress drops for earthquakes, presumably because dikes in the Manda Hararo riftare intruded at low magma pressure and high tectonic stress.
Citation: Grandin, R., A. Socquet, E. Jacques, N. Mazzoni, J.‐B. de Chabalier, and G. C. P. King (2010), Sequence of rifting inAfar, Manda‐Hararo rift, Ethiopia, 2005–2009: Time‐space evolution and interactions between dikes from interferometricsynthetic aperture radar and static stress change modeling, J. Geophys. Res., 115, B10413, doi:10.1029/2009JB000815.
1. Introduction
[2] Near the Earth’s surface (0–20 km depth range), therheology of rock is elastic‐brittle, implying that relative platemotion is discontinuous in time. Earthquakes are spectacularexamples of an unstable behavior of slip on faults, and theirubiquity in regions of active tectonics has attracted muchattention. Like large earthquakes, dike intrusions may becapable of relieving a significant fraction of the stressesaccumulated along a divergent plate boundary by slowmotionof tectonic plates, and thus deserve to be considered as majorplate boundary events.
[3] A long‐standing debate is whether magma‐assistedrifting is more efficient than tectonic faulting to allow acontinent to break [e.g., Buck et al., 2005]. The two modesof rifting (normal faulting or dike intrusion) share manyanalogies. For instance, factors controlling the fracture ofhost rock during a dike intrusion belong partly to the domainof solid mechanics [e.g., Pollard and Segall, 1987], as doesthe problem of earthquake rupture [e.g., Kostrov and Das,1988]. Moreover, dike intrusions are often clustered in time,forming rifting episodes that can last for several years and thatare separated by hundreds of years of quiescence. This tem-poral pattern is referred to as the magmato‐tectonic cycle, byanalogy with the seismic cycle [e.g., Björnsson, 1985].[4] However, unlike during an earthquake (at least to the
first order), the unstable rupture process in operation duringa dike intrusion involves a complex interplay between fluiddynamics and fracture mechanics. Indeed, dike intrusionscannot occur spontaneously because an input of magma isrequired to fill the crack and sustain its propagation [e.g.,Weertman, 1971]. In the magmatic rifts that constitute thelowest order of segmentation of the mid‐ocean ridge system,the source of magma is commonly a reservoir in the center
1Institut de Physique du Globe de Paris, Laboratoire de Tectonique etMécanique de la Lithosphère, Paris, France.
2Now at Laboratoire de Géologie, École Normale Supérieure, Paris,France.
3Observatoire Volcanologique et Sismologique de Guadeloupe,Gourbeyre, Guadeloupe.
Copyright 2010 by the American Geophysical Union.0148‐0227/10/2009JB000815
JOURNAL OF GEOPHYSICAL RESEARCH, VOL. 115, B10413, doi:10.1029/2009JB000815, 2010
B10413 1 of 18
of the segment, and dikes are observed to propagate laterallyaway from this reservoir [e.g., Brandsdöttir and Einarsson,1979; Smith and Cann, 1999; Dziak et al., 2004]. Thisexplains why theoretical and field studies have suggested thata large number of parameters may play an important roleduring the emplacement of a dike. These include evolution ofthe internal pressure of the source reservoir, conditions forrupture of magma reservoir walls and dike nucleation, size ofthemagma chamber, nature and location ofmagma pathways,surrounding thermal setting, time required for previous dikebodies to solidify, resistance to the flow of magma from thesource reservoir to the crack tip, caused by the combinedeffects of the viscosity of the magma and the small (andvariable) section of the conduit, and competition betweendike widening and magma freezing [e.g., Bruce and Huppert,1989; Takada, 1989; Lister and Kerr, 1991; Rubin, 1995;Mériaux and Jaupart, 1995; Fialko and Rubin, 1998;McLeod and Tait, 1999]. Unfortunately, few observations areavailable to constrain complex models of dike intrusions,particularly those addressing the dynamic problem.[5] The beginning of a major rifting episode in Ethiopia in
2005 represents an invaluable opportunity to provide newinsights into the mechanics of dike injection in a magmaticrift. In this paper, we focus on a sequence of dike intrusionsthat have occurred from September 2005 to June 2009 in theManda Hararo–Dabbahu rift, in the Afar magmatic province.This rifting episode is the most important ever documentedbecause of its duration (more than 4 years), the large numberof dike intrusions (13, at the time of writing), their magnitude(a total of more than 2 km3 of magma was involved in theseintrusions), and the overall length of the rift segment affectedby dike intrusions (∼65 km) [Wright et al., 2006; Yirgu et al.,2006; Ayele et al., 2007; Rowland et al., 2007; Ebinger etal., 2008; Keir et al., 2009; Hamling et al., 2009; Grandinet al., 2009; Ayele et al., 2009; Nooner et al., 2009; Grandinet al., 2010]. Although the dynamics of dike emplacementthroughout the rifting episode is poorly resolved becausedata are sparse, the static surface displacements induced byeach dike can be inferred with great accuracy thanks tosatellite geodesy.[6] Our first objective is to study in detail the succession
of dikes in time and space during this sequence, and tounderstand what controls this organization. To constrain thelocation and shape of the dikes, we rely on interferometricsynthetic aperture radar (InSAR), which, due to the dry andstable climate of Afar, is an efficient geodetic technique thatenables us to measure surface displacements with a resolutionof a few centimeters, over areas of hundreds of square kilo-meters [e.g., Simons and Rosen, 2007]. Assuming an elasticbehavior of the lithosphere during dike injections, InSARdata are inverted to determine the opening distribution ofeach dike within the sequence. The results of these inversionsare then exploited to deduce simple relationships betweengeometrical and kinematic features of the dikes. We alsopropose a comparisonwithmagnitude‐length scaling laws fortectonic earthquakes involving similar amounts of energyrelease.[7] In a second step, we apply simple mechanical modeling
to understand how nearby dikes can influence each other. Wetreat dikes as cracks in an elastic half‐space and computestatic stress change induced by each dike. This approach, inthe case of tectonic earthquakes, has led to the conclusion
that earthquakes tend to occur preferentially in areas whereCoulomb stress has increased as a result of previous earth-quakes [e.g., King, 2007]. By analogy, in the case of therifting episode of Manda Hararo rift, we focus on the evolu-tion of normal stress on the plate interface after each addi-tional dike injection in the sequence, to infer the spatial andtemporal evolution of stress on the plate boundary. We focusin particular on the link between the dikes and the mid-segment magma reservoir considered to have fed them. Weshow that, despite the complexity of the physics describingdike intrusion dynamics mentioned above, a simple model ofstatic stress transfer provides insights into the interactionbetween dikes. Finally, we discuss implications for the stressconditions on the segment of the plate boundary affected bydike intrusions.
2. Manda Hararo–Dabbahu Rifting Episode
[8] The Manda Hararo–Dabbahu rifting episode (Afar,Ethiopia) initiated in a rift segment showing an early stageof seafloor spreading, which, together with the Asal rift, hadpreviously been recognized as one of the most advanced inthe process of oceanization that has been affecting the hotspot‐influenced Afar triple point for nearly 30Ma (Figure 1a)[e.g., Barberi et al., 1972; Varet, 1975; Varet and Gasse,1978; Hayward and Ebinger, 1996; Manighetti et al., 2001;Lahitte et al., 2003; Audin et al., 2004]. The rifting episodecommenced in September 2005 with a massive dike injection(hereafter called “megadike”) that involved opening of theplate boundary, in less than two weeks, of an average 5 mover a length of ∼65 km and a depth ranging from ∼1–2 km to10 km. Dike‐induced slip on faults in excess of 3 m wasreported in some places (Figures 1b and S1a in the auxiliarymaterial and Table 1) [Wright et al., 2006; Yirgu et al.,2006; Ayele et al., 2007; Rowland et al., 2007; Grandinet al., 2009; Ayele et al., 2009].1 The width of the regionwhere surface breaks were reported in 2005 is less than 5 km[Grandin et al., 2009], and the width of the rift systemdeduced from analysis of digital elevation data is less than10 km (Figure 1b) [Rowland et al., 2007].[9] Seismicity and continuous deformation were detected
along the rift in the months following emplacement of themegadike, suggesting ongoing magma movement within thenewly intruded dike [Ebinger et al., 2008; Grandin et al.,2010]. From June 2006 to June 2009, a series of twelvesmaller dikes (∼0.04–0.2 km3 [this study]) were emplaced inthe southern part of the segment that had ruptured in 2005(Figure 1b and Figures S2a to S13a) [Hamling et al., 2009].Seismic and geodetic evidences suggest that these post‐2005dikes have their source in a deep‐seatedmagma reservoir lyingat the center of the segment, the “Wal’is” magma reservoir(Figures 1b) [Keir et al., 2009; Grandin et al., 2010]. Thisresembles activity along other rifts, such as the nearby Asalrift in Afar [e.g., de Chabalier and Avouac, 1994; Doubreet al., 2007], the Northern Volcanic Zone of Iceland [e.g.,Sæmundsson, 1979; Björnsson, 1985], and segments of themid‐ocean ridge system [e.g., Lin et al., 1990; Dziak et al.,2004]. Transient deformation was observed above theinferred central magma reservoir in the time intervals sepa-
1Auxiliary materials are available in the HTML. doi:10.1029/2009JB000815.
GRANDIN ET AL.: SEQUENCE OF RIFTING IN AFAR IN 2005–2009 B10413B10413
2 of 18

rating discrete dike injections, and may be caused byreplenishment of the central reservoir [Grandin et al., 2010].This central reservoir is also likely to have fed the bulk of theSeptember 2005 megadike, except in the northern part of therift, near to the Dabbahu volcano, where local sources ofmagmamay have contributed to dike inflation [Grandin et al.,2009; Ayele et al., 2009]. Interpretation of the explosivesilicic eruption of Da’Ure on 26 September 2005 is debated.The relationship and possible interaction between preexistingmagma chambers below Dabbahu on the one hand, and a hot
basaltic dike originating from the midsegment magma sourceon the other, is not well understood due to a lack of data toconstrain the sequence of events that took place in September2005 [Yirgu et al., 2006; Ayele et al., 2007, 2009].
3. Data and Methods
3.1. InSAR Data
[10] For the megadike of September 2005, two pairs ofSAR images acquired by Envisat satellite with comple-
Table 1. Dates of the Rifting Events of the Manda Hararo–Dabbahu Rifting Episodea
Event Date Source V (km3) S (km2) X (km) Z (km) D� (×10 −5) Ds (bars)
d0 24 Sep 2005 Seismicity (1,2) 1.822 388.9 ‐11.0 5.0 23.8 71d0a 24 Sep 2005 0.777 135.7 ‐11.0 5.0 49.2 147d0b 24 Sep 2005 0.417 124.1 3.0 3.5 30.2 91
d1 17 Jun 2006 Seismicity (3), GPS (4) 0.129 118.9 ‐5.0 3.5 9.9 30d2 25 Jul 2006 Seismicity (3), GPS (4) 0.048 62.2 1.0 1.5 9.9 30d3 10 Sep 2006 Seismicity (4), GPS (4) 0.053 98.4 5.0 5.0 5.4 16d4 7 Dec 2006 GPS (4) 0.044 49.9 ‐3.0 1.5 12.4 37d5 14 Jan 2007 GPS (4) 0.037 72.5 5.0 2.5 6.1 18d6 12 Aug 2007 Modis hot spot (5) 0.055 49.7 1.0 1.5 15.8 48d7 12 Nov 2007 GPS (4) 0.186 242.9 13.0 4.2 4.9 15d7a 12 Nov 2007 0.109 108.6 9.0 4.2 9.6 29d7b 12 Nov 2007 0.077 134.3 23.0 7.0 5.0 15
d8 31 Mar 2008 Seismicity (6) 0.099 161.1 13.0 7.0 4.9 15d9 9 Jul 2008 Seismicity (7) 0.047 74.2 11.0 0.2 7.3 22d10 17 Oct 2008 Seismicity (7) 0.198 140.0 ‐11.0 3.5 12.0 36d11 11 Feb 2009 Seismicity (7) 0.073 83.5 ‐5.0 2.5 9.6 29d12 28 Jun 2009 Modis hot spot (5) 0.044 46.6 1.0 1.5 13.7 41
aSource of information that allowed constraint of these dates: 1, Ayele et al. [2009]; 2,Wright et al. [2006]; 3,Keir et al.; 4,Hamling et al. [2009]; 5,Wrightet al. [2004]; 6, Belachew et al. [2009]; 7, E. Jacques (personal communication, 2010)). V is dike volume, calculated as the product of average dike opening~D and dike surface area S. X and Z givecoordinates of the locus of peak opening deduced from inversion of InSAR data (see Figure 4). Average normal stresschanges Ds are deduced from displacement‐to‐length ratios D� (equation (B1)) multiplied by a Young’s modulus of E = 3 × 10¹⁰ Pa (see Appendix B).
Figure 1. (a) Map of the Afar region. Major rift systems and their propagation direction during Plio‐Quaternary are shown with arrows [after Manighetti et al., 2001]. Dashed area in central Afar isaffected by block rotations. (b) Digital elevation model (DEM) of the Manda Hararo–Dabbahu rift. Blueand yellow dashed lines indicate the location of dike intrusions that occurred in 2005 and 2006–2009,respectively. Neighboring rift systems of Alayta (to the north) and southern Manda Hararo (to the south)are shown with white dashed lines. Stars indicate the location of eruptions (cyan, silicic; red, basaltic).
GRANDIN ET AL.: SEQUENCE OF RIFTING IN AFAR IN 2005–2009 B10413B10413
3 of 18
mentary look directions bracket the date of emplacement ofthe main dike [Wright et al., 2006; Ayele et al., 2007](Table S1 in the auxiliary material). Subpixel correlationsof these SAR images, as well as subpixel correlations of a setof three pairs of SPOT images, are also available for thisevent, and the complete geodetic data set for the September2005 megadike was inverted by Grandin et al. [2009].[11] Since September 2005, systematic SAR acquisitions
were performed by Envisat on four different tracks. A total of12 discrete events of intense surface deformation are identi-fied from June 2006 to June 2009 (Table 1). We processed aseries of interferograms that capture each of these events (see
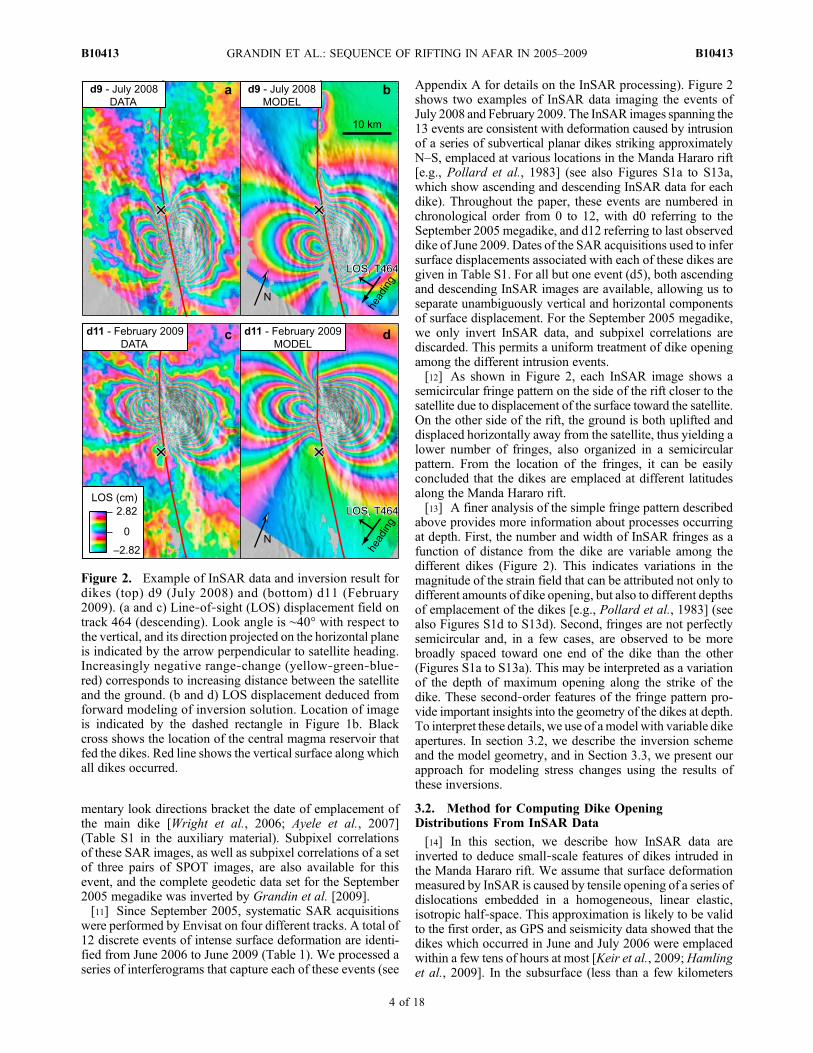
Appendix A for details on the InSAR processing). Figure 2shows two examples of InSAR data imaging the events ofJuly 2008 and February 2009. The InSAR images spanning the13 events are consistent with deformation caused by intrusionof a series of subvertical planar dikes striking approximatelyN–S, emplaced at various locations in the Manda Hararo rift[e.g., Pollard et al., 1983] (see also Figures S1a to S13a,which show ascending and descending InSAR data for eachdike). Throughout the paper, these events are numbered inchronological order from 0 to 12, with d0 referring to theSeptember 2005 megadike, and d12 referring to last observeddike of June 2009. Dates of the SAR acquisitions used to infersurface displacements associated with each of these dikes aregiven in Table S1. For all but one event (d5), both ascendingand descending InSAR images are available, allowing us toseparate unambiguously vertical and horizontal componentsof surface displacement. For the September 2005 megadike,we only invert InSAR data, and subpixel correlations arediscarded. This permits a uniform treatment of dike openingamong the different intrusion events.[12] As shown in Figure 2, each InSAR image shows a
semicircular fringe pattern on the side of the rift closer to thesatellite due to displacement of the surface toward the satellite.On the other side of the rift, the ground is both uplifted anddisplaced horizontally away from the satellite, thus yielding alower number of fringes, also organized in a semicircularpattern. From the location of the fringes, it can be easilyconcluded that the dikes are emplaced at different latitudesalong the Manda Hararo rift.[13] A finer analysis of the simple fringe pattern described
above provides more information about processes occurringat depth. First, the number and width of InSAR fringes as afunction of distance from the dike are variable among thedifferent dikes (Figure 2). This indicates variations in themagnitude of the strain field that can be attributed not only todifferent amounts of dike opening, but also to different depthsof emplacement of the dikes [e.g., Pollard et al., 1983] (seealso Figures S1d to S13d). Second, fringes are not perfectlysemicircular and, in a few cases, are observed to be morebroadly spaced toward one end of the dike than the other(Figures S1a to S13a). This may be interpreted as a variationof the depth of maximum opening along the strike of thedike. These second‐order features of the fringe pattern pro-vide important insights into the geometry of the dikes at depth.To interpret these details, we use of amodel with variable dikeapertures. In section 3.2, we describe the inversion schemeand the model geometry, and in Section 3.3, we present ourapproach for modeling stress changes using the results ofthese inversions.
3.2. Method for Computing Dike OpeningDistributions From InSAR Data
[14] In this section, we describe how InSAR data areinverted to deduce small‐scale features of dikes intruded inthe Manda Hararo rift. We assume that surface deformationmeasured by InSAR is caused by tensile opening of a series ofdislocations embedded in a homogeneous, linear elastic,isotropic half‐space. This approximation is likely to be validto the first order, as GPS and seismicity data showed that thedikes which occurred in June and July 2006 were emplacedwithin a few tens of hours at most [Keir et al., 2009;Hamlinget al., 2009]. In the subsurface (less than a few kilometers
Figure 2. Example of InSAR data and inversion result fordikes (top) d9 (July 2008) and (bottom) d11 (February2009). (a and c) Line‐of‐sight (LOS) displacement field ontrack 464 (descending). Look angle is ∼40° with respect tothe vertical, and its direction projected on the horizontal planeis indicated by the arrow perpendicular to satellite heading.Increasingly negative range‐change (yellow‐green‐blue‐red) corresponds to increasing distance between the satelliteand the ground. (b and d) LOS displacement deduced fromforward modeling of inversion solution. Location of imageis indicated by the dashed rectangle in Figure 1b. Blackcross shows the location of the central magma reservoir thatfed the dikes. Red line shows the vertical surface along whichall dikes occurred.
GRANDIN ET AL.: SEQUENCE OF RIFTING IN AFAR IN 2005–2009 B10413B10413
4 of 18
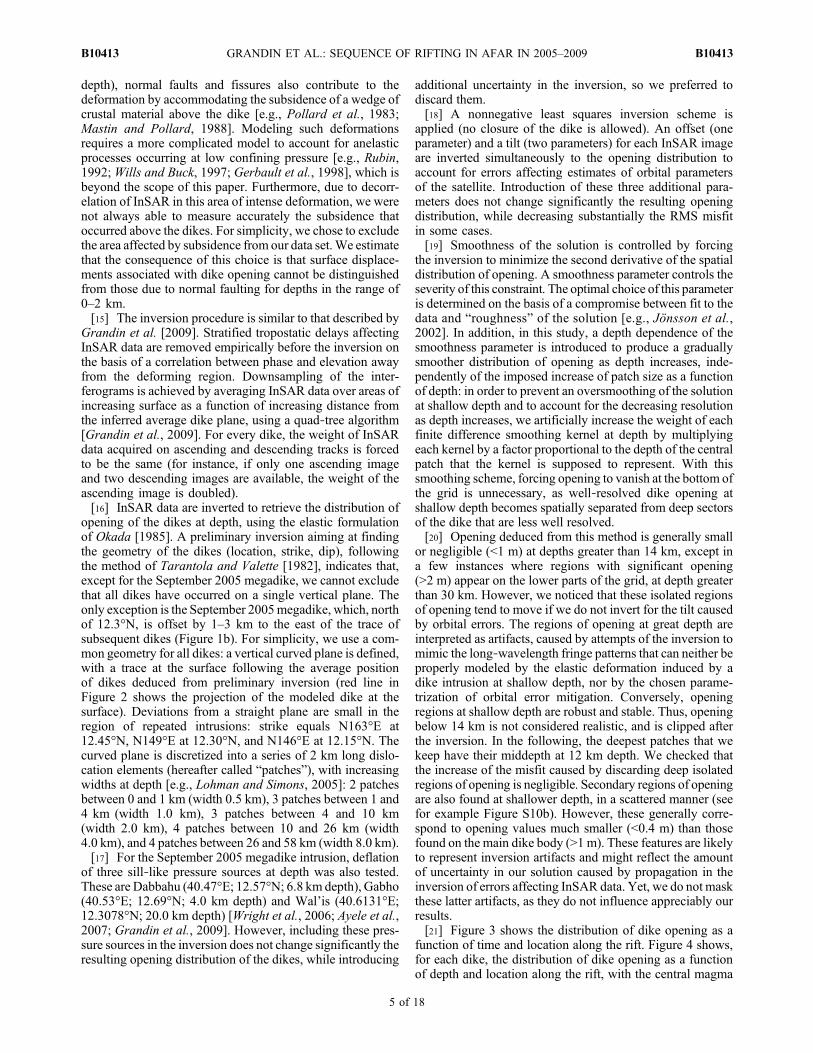
depth), normal faults and fissures also contribute to thedeformation by accommodating the subsidence of a wedge ofcrustal material above the dike [e.g., Pollard et al., 1983;Mastin and Pollard, 1988]. Modeling such deformationsrequires a more complicated model to account for anelasticprocesses occurring at low confining pressure [e.g., Rubin,1992; Wills and Buck, 1997; Gerbault et al., 1998], which isbeyond the scope of this paper. Furthermore, due to decorr-elation of InSAR in this area of intense deformation, we werenot always able to measure accurately the subsidence thatoccurred above the dikes. For simplicity, we chose to excludethe area affected by subsidence from our data set.We estimatethat the consequence of this choice is that surface displace-ments associated with dike opening cannot be distinguishedfrom those due to normal faulting for depths in the range of0–2 km.[15] The inversion procedure is similar to that described by
Grandin et al. [2009]. Stratified tropostatic delays affectingInSAR data are removed empirically before the inversion onthe basis of a correlation between phase and elevation awayfrom the deforming region. Downsampling of the inter-ferograms is achieved by averaging InSAR data over areas ofincreasing surface as a function of increasing distance fromthe inferred average dike plane, using a quad‐tree algorithm[Grandin et al., 2009]. For every dike, the weight of InSARdata acquired on ascending and descending tracks is forcedto be the same (for instance, if only one ascending imageand two descending images are available, the weight of theascending image is doubled).[16] InSAR data are inverted to retrieve the distribution of
opening of the dikes at depth, using the elastic formulationof Okada [1985]. A preliminary inversion aiming at findingthe geometry of the dikes (location, strike, dip), followingthe method of Tarantola and Valette [1982], indicates that,except for the September 2005 megadike, we cannot excludethat all dikes have occurred on a single vertical plane. Theonly exception is the September 2005megadike, which, northof 12.3°N, is offset by 1–3 km to the east of the trace ofsubsequent dikes (Figure 1b). For simplicity, we use a com-mon geometry for all dikes: a vertical curved plane is defined,with a trace at the surface following the average positionof dikes deduced from preliminary inversion (red line inFigure 2 shows the projection of the modeled dike at thesurface). Deviations from a straight plane are small in theregion of repeated intrusions: strike equals N163°E at12.45°N, N149°E at 12.30°N, and N146°E at 12.15°N. Thecurved plane is discretized into a series of 2 km long dislo-cation elements (hereafter called “patches”), with increasingwidths at depth [e.g., Lohman and Simons, 2005]: 2 patchesbetween 0 and 1 km (width 0.5 km), 3 patches between 1 and4 km (width 1.0 km), 3 patches between 4 and 10 km(width 2.0 km), 4 patches between 10 and 26 km (width4.0 km), and 4 patches between 26 and 58 km (width 8.0 km).[17] For the September 2005 megadike intrusion, deflation
of three sill‐like pressure sources at depth was also tested.These are Dabbahu (40.47°E; 12.57°N; 6.8 km depth), Gabho(40.53°E; 12.69°N; 4.0 km depth) and Wal’is (40.6131°E;12.3078°N; 20.0 km depth) [Wright et al., 2006; Ayele et al.,2007; Grandin et al., 2009]. However, including these pres-sure sources in the inversion does not change significantly theresulting opening distribution of the dikes, while introducing
additional uncertainty in the inversion, so we preferred todiscard them.[18] A nonnegative least squares inversion scheme is
applied (no closure of the dike is allowed). An offset (oneparameter) and a tilt (two parameters) for each InSAR imageare inverted simultaneously to the opening distribution toaccount for errors affecting estimates of orbital parametersof the satellite. Introduction of these three additional para-meters does not change significantly the resulting openingdistribution, while decreasing substantially the RMS misfitin some cases.[19] Smoothness of the solution is controlled by forcing
the inversion to minimize the second derivative of the spatialdistribution of opening. A smoothness parameter controls theseverity of this constraint. The optimal choice of this parameteris determined on the basis of a compromise between fit to thedata and “roughness” of the solution [e.g., Jönsson et al.,2002]. In addition, in this study, a depth dependence of thesmoothness parameter is introduced to produce a graduallysmoother distribution of opening as depth increases, inde-pendently of the imposed increase of patch size as a functionof depth: in order to prevent an oversmoothing of the solutionat shallow depth and to account for the decreasing resolutionas depth increases, we artificially increase the weight of eachfinite difference smoothing kernel at depth by multiplyingeach kernel by a factor proportional to the depth of the centralpatch that the kernel is supposed to represent. With thissmoothing scheme, forcing opening to vanish at the bottom ofthe grid is unnecessary, as well‐resolved dike opening atshallow depth becomes spatially separated from deep sectorsof the dike that are less well resolved.[20] Opening deduced from this method is generally small
or negligible (<1 m) at depths greater than 14 km, except ina few instances where regions with significant opening(>2 m) appear on the lower parts of the grid, at depth greaterthan 30 km. However, we noticed that these isolated regionsof opening tend to move if we do not invert for the tilt causedby orbital errors. The regions of opening at great depth areinterpreted as artifacts, caused by attempts of the inversion tomimic the long‐wavelength fringe patterns that can neither beproperly modeled by the elastic deformation induced by adike intrusion at shallow depth, nor by the chosen parame-trization of orbital error mitigation. Conversely, openingregions at shallow depth are robust and stable. Thus, openingbelow 14 km is not considered realistic, and is clipped afterthe inversion. In the following, the deepest patches that wekeep have their middepth at 12 km depth. We checked thatthe increase of the misfit caused by discarding deep isolatedregions of opening is negligible. Secondary regions of openingare also found at shallower depth, in a scattered manner (seefor example Figure S10b). However, these generally corre-spond to opening values much smaller (<0.4 m) than thosefound on the main dike body (>1 m). These features are likelyto represent inversion artifacts and might reflect the amountof uncertainty in our solution caused by propagation in theinversion of errors affecting InSAR data. Yet, we do not maskthese latter artifacts, as they do not influence appreciably ourresults.[21] Figure 3 shows the distribution of dike opening as a
function of time and location along the rift. Figure 4 shows,for each dike, the distribution of dike opening as a functionof depth and location along the rift, with the central magma
GRANDIN ET AL.: SEQUENCE OF RIFTING IN AFAR IN 2005–2009 B10413B10413
5 of 18

reservoir representing the origin of the horizontal axis (seealso Figures S1b to S13b). These results are discussed insections 4.1 and 4.2.
3.3. Method for Calculating Normal Stress ChangeFrom Opening Distributions
[22] A second part of our analysis is based on the compu-tation of static stress changes induced by successive dikeintrusions in order to illuminate the process of dike intrusion.Opening distributions obtained by the method described insection 3.2 are used as an input. In this section, we describehow opening distributions are used to calculate these stresschanges.[23] Slow divergence of the Arabia and Nubia plates is
responsible for an accumulation of elastic strain along the
plate boundary below the Manda Hararo rift. Dike intrusionsact as a means of accommodating this differential motion.Thus, one may consider that dikes fill an opening deficitcreated by slow elastic stretching of the plate boundary inthe interdiking period, which we will call a “tectonic straindeficit.” The succession of dike intrusions guarantees thatthis strain field is heterogeneous in space and that it changeswith time.
Figure 3. Distribution of dikes as a function of time andlatitude deduced from inversion of InSAR data. Thick bargives the scale for opening distributions. Thickness of thegrey curves [this study] indicates dike volume per unit dis-tance along the dike (for instance, dike d10 has an averagethickness of ∼2 × 10⁻² km3/km integrated along its depthand a length of ∼10 km, yielding a volume of ∼0.2 km3).For the September 2005megadike, two end‐member solutionsfor the dike opening distribution of Grandin et al. [2009],obtained by a different inversion strategy, are shown forcomparison (m2, no central magma reservoir deflation coevalto dike intrusion; m3, magma reservoir deflation at 10 kmdepth). Distance from the inferred Wal’is magma reservoir at12.30°N [Grandin et al., 2010] (horizontal dashed line) isshown on the axis of ordinates on the right. Green trianglesshow the direction of the migration of seismicity during dikeinjection (from Ayele et al. [2009] for megadike d0, Keiret al. [2009] for d1 and d2, Belachew et al. [2009] for d7, andE. Jacques (personal communication, 2010) for d9, d10, andd11). Stars indicate eruptions (cyan, silicic; red, basaltic).
Figure 4. Locations of the 13 dikes intruded between 2005and 2009 in the Manda Hararo–Dabbahu rift as a function ofdepth and distance along the rift from the central magmareservoir (dashed vertical line), deduced from inversion ofInSAR data. The surface of each dike is indicated by a greyfill. Each contour represents an increment of 2 m openingfor the September 2005 megadike (d0) and 0.5 m for otherdikes (d1 to d12). The grey dashed contour in the back-ground represents the perimeter of the first megadike (d0)for reference. Stars indicate the location of eruptions. Greenarrows above seven dikes indicate the directivity of thedikes, as deduced from migration of seismicity coeval todike intrusion (see Figure 3 for references).
GRANDIN ET AL.: SEQUENCE OF RIFTING IN AFAR IN 2005–2009 B10413B10413
6 of 18

[24] Implications in terms of stress conditions are thefollowing. In the Afar depression, the occurrence of dikeintrusions and the abundance of active normal faults andfissures show that the tectonic context is extensional at theregional scale. The maximum compressive principal stresscomponent s1 is vertical, the least compressive principalstress component s3 is horizontal, and the intermediateprincipal stress s2, perpendicular to both s3 and s1, is alsohorizontal. In such conditions, dikes emplace perpendicularto the direction of s3, which is consequently perpendicular tothe trend of the Manda Hararo rift (∼N155°E) [Anderson,1938].[25] The magnitudes of principal stresses are more difficult
to assess, but dikes can be used as indicators of the shapeof the stress tensor [e.g., Rubin, 1990]. Here, compressivestresses are defined as positive, and we assume that therelation s1 > s2 > s3 > 0 is verified at any time and any depthbeyond a few hundred meters [e.g., Scholz, 2002]. The ten-dency for a dike to open in a given region increases as thelocal magnitude of the driving stress sd. This parameter isdefined as the difference betweenmagma pressure P, that actsso as to open the dike, and the horizontal stress in the hostrock normal to the dike plane s3, that tends to counter dikeopening [e.g., Delaney and Pollard, 1981; Pollard et al.,1983; Gudmundsson, 1986; Pollard and Segall, 1987;Rubin and Pollard, 1987; Rubin, 1995]:
�d ¼ P � �3 ð1Þ
According to equation (1), changes in magma pressure willinfluence the magnitude of driving stress, and “forceful”intrusion of magma driven by its overpressure may occur.However, dikes intruded in environments similar to slowspreading mid‐ocean ridges, such as Iceland or Afar, seem toemplace at lowmagma overpressure [Rubin, 1990]. This mayimply that the tectonic stress plays the most important role incontrolling the magnitude of driving pressure on the plateboundary.[26] Neglecting for the moment the contribution of magma
pressure, much of the information about the propensity fordikes to open in a given region is contained in the localmagnitude of s3. However, the magnitude of s3 is not uni-form, nor constant in time, because of stress perturbationscaused by dike intrusions [e.g., Pollard and Segall, 1987].These occur in two manners. On the one hand, during dikeinflation, a compression occurs perpendicular to the dike,leading to an increase of the magnitude of s3 off to the sideof the dike [e.g., Arnott and Foulger, 1994]. Since dikes tendto open preferentially in areas where the magnitude of s3 islowest (equation (1)), this means that further intrusions offto the side of the dike are less likely to occur shortly afterthe dike injection [e.g., Rubin, 1992]. On the other hand,s3 decreases (i.e., stresses become more tensile) beyondthe perimeter of the dike off the crack ends, promoting furtherdike intrusion there [Pollard and Segall, 1987].[27] Conversely, the location and timing of a given dike
intrusion are expected to be influenced by the distribution ofs3, and hence by the history of past dike intrusions. So, wemay calculate changes of s3 caused by a succession of dikeintrusions, and then assess whether a given dike falls in anarea of decreased s3 as a result of the previous dikes in thesequence, or in an area where s3 has been increased, or
“consumed”, by previous dikes. By analogy with the relatedproblem of earthquake interaction [e.g., King, 2007], suchan analysis is useful to estimate whether dikes influenceeach other appreciably, or, to the contrary, whether the per-turbation they induce in the ambient stress field is negligible.A similar approach was adopted by Amelung et al. [2007] toexplain the sequence of earthquakes and dike intrusions atMauna Loa (Hawaii) from 1983 to 2005.[28] In the following, we restrict our analysis to the plane
of the plate boundary along which dikes were intruded in2005–2009. We assume that the magnitude of s1, which ismostly controlled by the weight of the overlying rock, doesnot change significantly as a consequence of a dike intrusion,so that only the stress component normal to this plane (s3) isrelevant for our analysis (yet, the initial distribution of s3 isunknown). We also assume that s3 does not change direction,and therefore remains normal to the plate boundary at anytime between 2005 and 2009. This is likely to be the case,since changes in the strike of the dikes were negligible in thisperiod.[29] We ignore temporal variations of s3 during the inter-
vals between dike intrusions and during dike emplacementitself, and using the opening inversions of section 3.2, wecalculate the static normal stress change on the plate boundaryinduced by each dike intrusion [Okada, 1992]. Geometricaland kinematic parameters of the dikes obtained in section 3.2depend only upon the value of Poisson’s ratio n, but forcalculations of stress change, additional knowledge ofYoung’s modulus is required [Okada, 1992]. A value ofn = 0.25 is chosen, in agreement with values of n ≈ 0.26deduced from studies of VP/VS ratio in the region close to theManda Hararo rift [Berckhemer et al., 1975; E. Jacques,personal communication, 2010]. We use a Young’s modulusof E = 3.0 × 10¹⁰ Pa. This value has been proposed by Stein etal. [1991] for modeling crustal deformation due to tectonicloading and magma intrusions in the Asal rift, in eastern Afar,and is consistent with results from mechanical tests of basaltsamples in the laboratory at high confining pressure [e.g.,Touloukian, 1981].[30] Opening at depth greater than 14 km is clipped for the
reasons given in section 3.2. An additional simplification isperformed in the stress modeling, whereby patches are col-lapsed onto a straight plane. The influence of this projectionon the resulting normal stress distribution is negligible due tothe small deviation from straightness of the curved dikemodel used in the inversions.[31] More importantly, stress singularities appear along
the edges of each dislocation element. An example of thesesingularities is shown in Figure 5. They arise from the sharpchanges of opening induced by the discretization of the dikeplane into a series of dislocations. Similar singularities in thestress field also occur on a larger scale, very close to thecrack tip associated with the dike, if dike opening decaysfast toward the crack end [Pollard and Segall, 1987]. For-tunately, these singularities are limited in size to a smallfraction of the crack/dislocation size and may be neglected ifwe wish to focus on spatial scales of the order of 1–2 km orlarger. In order to avoid this local effect, when stress changesare computed from opening distributions, we sample thestress field only at the center of each patch (Figure 5d). Thecontribution of each opening dislocation is then summed,following the principle of superposition.
GRANDIN ET AL.: SEQUENCE OF RIFTING IN AFAR IN 2005–2009 B10413B10413
7 of 18

[32] Opening distributions deduced from InSAR are usedhere as an input to infer static normal stress change on theplate boundary. As a consequence, the final distribution ofstress change on the dike plane relies on the assumption of aregularity of the opening distribution, which is implicitlyimposed in the inversions by the smoothing constraints(section 3.2). Smoother or rougher opening distributions inFigure 4 may equally fit surface displacement data, while
producing significantly different values of the static stresschange: for instance, “sharper” peaks of opening at depth, oroverly smeared asperities, would induce higher or lowermaximum stress changes, respectively. Therefore, the localvalue of the normal stress change on the dike plane shouldbe regarded with caution. However, to the first order, thespatial distribution of normal stress change, and the relativelocation of the regions of stress increase or decrease, con-stitute a reliable result of our modeling.[33] Distributions of normal stress change obtained by this
method for the 13 dikes of Manda Hararo–Dabbahu riftingepisode are shown on the right side of Figure 6 (see alsoFigures S1c to S13c for normal stress change distributionsassociated with each dike). These results are discussed insections 4.3, 4.4, and 4.5.
4. Results and Interpretations
4.1. Spatial and Temporal Pattern of Diking
[34] The dike intrusions of 2005–2009 occurred at dif-ferent dates and locations along the Manda Hararo–Dabbahurift, and show a variety of geometrical and kinematic fea-tures. In this section, we propose a first interpretation of thesequence of rifting using only space‐time arrangement ofthe dikes (Figures 3 and 4 and Table 1). Here, we rely onInSAR data only to constrain the relative locations of thedikes.[35] The September 2005 megadike is segmented in three
parts [Grandin et al., 2009]: the Dabbahu segment at itsnorthern end and two segments along the northern MandaHararo rift (Figures 1b and 3). These two latter subdikes(d0a and d0b) are separated by a local minimum of openingat 12.3°N, close to the inferred Wal’is central magma res-ervoir [Grandin et al., 2009] (Figure 4). Opening north of12.6°N might reflect an interaction between the northwardpropagating dike originating from Wal’is, and preexistingmagma reservoirs beneath Dabbahu volcano [Grandin et al.,2009; Ayele et al., 2009]. However, this phenomenon ispoorly understood, and is not discussed further.[36] During the 9 months following intrusion of the
September 2005 megadike, decelerating inflation of a dike‐like pressure source between 4 km and 10 km depth isinferred from InSAR data at the latitude of Wal’is magmareservoir (dashed line in Figure 3) [Grandin et al., 2010].However, no discrete dike intrusion occurred during thatperiod.[37] The diking event of June 2006 then inaugurated a
sequence of five dike intrusions (d1 to d5) between June2006 and January 2007, with a recurrence intervals of 1 to2 months (Figure 3). After a quiescence interval of 7 months,diking resumed in August 2007 (d6), and culminated in anaxial eruption on 13 August 2007 [Yirgu et al., 2007;Ferguson et al., 2010]. Dikes d1 to d6 were emplaced within10 km of the Wal’is magma reservoir (Figure 4).[38] Following the eruption of August 2007, dike intru-
sions occurred until June 2009 with a longer recurrence timeof 3 to 4 months (Figure 3). The three dikes of November2007, March and July 2008 (d7 to d9) were emplaced morethan 10 km south of Wal’is reservoir, whereas the twofollowing events of October 2008 and February 2009 (d10to d11) occurred north of Wal’is reservoir (Figures 3 and 4).The last observed dike (d12) was accompanied by an axial
Figure 5. Method for computing normal stress change dueto dike injection. Example shows the case of dike d1 (June2006). (a) Opening distribution on the dike plane deducedfrom inversion of InSAR data. Orange dashed line showsan alternative, simplified model which consists only of asingle element of identical volume. (b) Opening distribu-tions along a profile at 5 km depth (dashed black line inFigure 5a). Blue line shows opening distribution for d1.Orange dashed line shows opening distribution for a singleelement of identical volume with constant opening (same asin Figure 5a). (c) Distribution of normal stress change (blue,decrease of tensile stress; yellow, increase of tensile stress).(d) Normal stress change along the horizontal profile. Blueline corresponds to a continuous sampling of normal stresschange given the opening distribution indicated in blue inFigure 5b. Stress change distribution is rough in this casedue to the discontinuities in the opening distribution. Bluedots in Figure 5d show the normal stress distribution sampledat the center of each dislocation element. This coarser sam-pling is adapted to the grid size and has been used to constructsmoothed normal stress change distributions, as shown inFigure 5c. For comparison, orange lines and diamonds corre-spond to the stress changes deduced for a single dislocationelement of identical volume indicated in Figures 5a and 5b.
GRANDIN ET AL.: SEQUENCE OF RIFTING IN AFAR IN 2005–2009 B10413B10413
8 of 18

eruption on 28 June 2009 (G. Yirgu et al., Afar field trippreliminary report, June 2009, available at http://www.see.leeds.ac.uk/afar/afar_text/Karbahi2_Field_report.pdf, in AfarConsortium communications). This second eruption occurredat the same location as the previous eruption associated withdiked 6, and was slightly larger in magnitude and durationthan the first eruption [Ferguson et al., 2010] (Figure 4).[39] Overall, three subsequences of dike intrusions are
identified on the basis of the organization of diking as afunction of distance from the Wal’is magma reservoir(Figures 3 and 4): (1) proximal dike intrusions, d1 to d6;(2) southerly dike intrusions, d7 to d9; and (3) northerly dikeintrusions, d10 to d11. During the two latter subsequences,and possibly also during the first one, dikes seem to have beenemplaced at progressively more proximal locations with
respect to Wal’is central magma reservoir. An additionalobservation is that the two basaltic eruptions coeval to dikeintrusions d6 and d12, at the end of subsequences 1 and 3,were observed near this inferred magma reservoir. Similarfeatures of spatial and temporal arrangement of dike intru-sions were observed during the 1975–1984 rifting episodeof Krafla (Iceland) [Björnsson, 1985; Einarsson, 1991;Buck et al., 2006]. This may suggest that most, if not all,dikes that occurred during the Manda Hararo–Dabbahu rift-ing episode have their source in a single magma reservoir nearthe center of the rift. This is in agreement with the observeddirectivity of earthquake migration during emplacement of atleast six dikes (Figures 3 and 4) [Keir et al., 2009; E. Jacques,manuscript in preparation, 2010]. Furthermore, for the mostdistal dike intrusions (d7 to the south, and d10 to the north),
Figure 6. Color images show (left) the cumulative opening or (right) stress change after chosen subse-quence of dikes. (a and f) For the first megadike of September 2005 (d0). (b‐d and g‐i) For dike subse-quences d1 to d3 (Figure 6b), d4 to d6 (Figure 6c) and d7 to d12 (Figure 6d). (e and j) The cumulativeopening, and corresponding stress change, after the last observed dike d12. For opening distributions, asin Figure 4, contours represent an increment of 2 m opening for the September 2005 megadike (Figures 6aand 6e) and 0.5 m for other dikes (Figures 6b, 6c, and 6d). Distributions of cumulative stress change arecontoured accordingly every 100 bars (Figures 6f and 6j) or 25 bars (Figures 6g, 6h, and 6i). Stresschange is computed with respect to an unknown initial stress. Note that normal stress change is negativewhere tensile stress has increased (red‐yellow regions). A Young’s modulus of E = 3.0 × 10¹⁰ Pa wasused for calculations of stress change. Distance along the rift is measured with respect to Wal’is centralmagma reservoir. For a detailed view of each dike intrusion separately (data, model, opening distribution,stress change), see Figures S1 to S13 in the auxiliary material.
GRANDIN ET AL.: SEQUENCE OF RIFTING IN AFAR IN 2005–2009 B10413B10413
9 of 18

we notice that a few InSAR fringes could not be modeled byour dike model. These residual fringes occur at the locationof the inferred magma reservoir, and the bull’s eye shape ofthe fringes (see residues in Figures S8 and S11) is charac-teristic of deflation of a magma chamber at depth, providingevidence for a counterpart to dike inflation. The time betweensuccessive dike injections is likely controlled by the rate ofrepressurization of this reservoir after it has experienced theabrupt pressure drop coeval to dike escape [Grandin et al.,2010].
4.2. Opening Distributions
[40] The opening distributions deduced from inversion ofInSAR data (section 3.2) are model and related assumptionsdependent and should be treated with caution, especiallywhen interpreting small‐scale features. For instance, thetrade‐off between magnitude of opening and depth of open-ing introduces significant uncertainty in the inversion, whichis difficult to quantify. However, because the InSAR data sethas been processed using a uniform inversion method, thevarious biases affecting the inversion results are expected tobe the same for all dikes, whereas the differences betweenthe dikes are likely to be well constrained. Keeping theselimitations in mind, we compare the locations and openingdistributions of the dikes as a function of time (Figures 4and 6a–6e and Table 1).[41] Maximum opening of ∼12 m occurs in the central
part of the September 2005 megadike, at a depth of ∼5 km(subdike d0a). About 10 km further south, another localopening maximum of ∼7 m occurs (subdike d0b) (Figure 4).These two subdikes represent total volumes of magma of0.8 and 0.4 km3, respectively. Subsequent dikes intrudedfrom 2006 to 2009 have volumes smaller than that of theSeptember 2005 megadike by one order of magnitude (0.04–0.2 km3), and generally exhibit simple convex opening dis-tributions, with a maximum opening ranging from 0.8 m to3.5 m, and a peak opening occurring between 0.5 km and7 km depth. The geometry of these dikes resembles theblade‐like dikes of Rubin and Pollard [1987]. The November2007 event may consist of two distinct subdikes (named d7aand d7b) (Figure 4).[42] The deformation pattern imaged by InSAR suggests
that groups of dikes may exist that produce a very similarshape of the deformation field at the surface. Within theframework of the theory of linear elasticity, this observationis interpreted as being due to an almost identical geometryof the intrusion (depth, latitude, rupture area), but differentmagnitude of the inflation (Figures 4 and 6a–6e). The firstgroup consists of dikes d6 and d12, and possibly d2 (seeFigures S3a, S7a and S13a). These dikes were emplaced atshallow depth, above Wal’is magma reservoir, and the twomost recent dikes d6 and d12 were both accompanied bylava extrusion (Figure 4). The second group is composed ofdikes d1 and d11, which intruded along a 10 km longsegment north of Wal’is magma reservoir (see Figures 4 andS2a and S12a). A third group includes dikes d0a and d10, asthe peaks of maximum opening of these two dikes arelocated at nearly the same depth and latitude (Figures 6e,S1a, and S11a). This may suggest that sequences of dikesd0a‐d1‐d2 on one hand, and d10‐d11‐d12 on the otherhand, follow the same pattern.
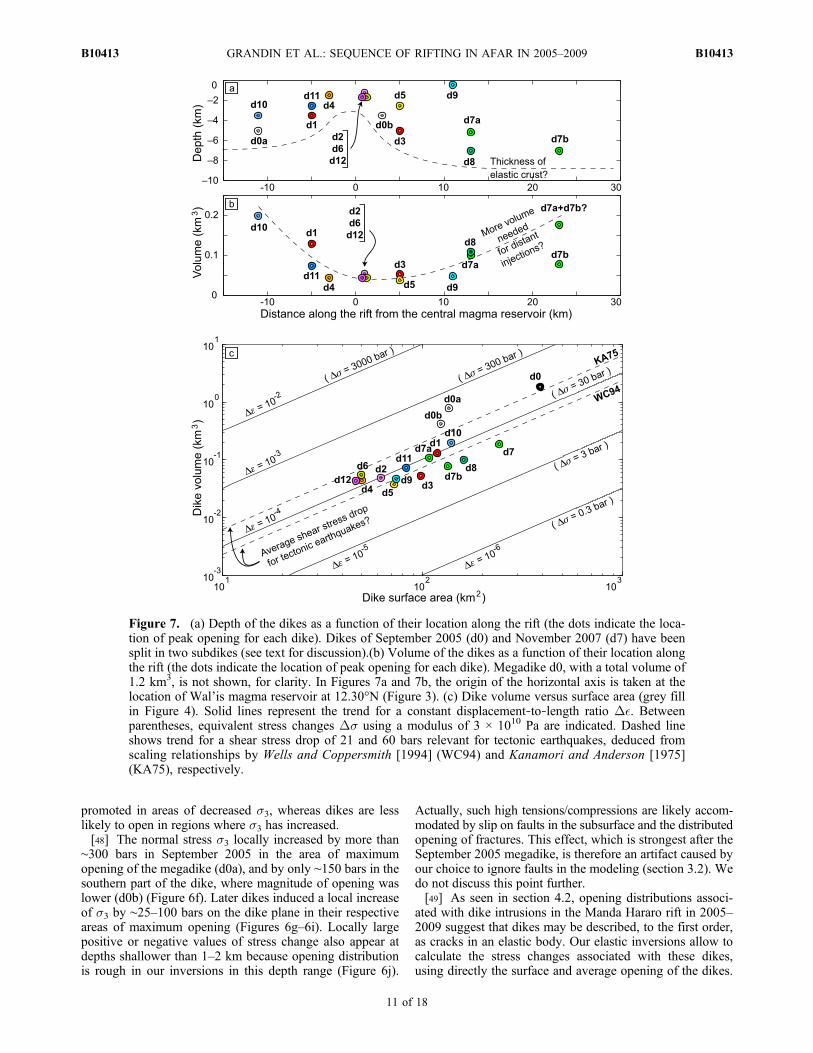
[43] Despite the possible existence of a few multipleevents, most dikes in the 2006–2009 sequence seem tooccupy different depths and/or latitudes along Manda Hararorift. This may suggest that the tectonic strain deficit accu-mulated since the previous rifting episode is progressivelyfilled by successive dike intrusions on the plate boundaryuntil differential stress is completely relieved [e.g., Björnsson,1985]. For instance, most dikes in 2006 and 2007 (e.g., d2, d4,d5, d6, d7b, d8,d9, d12) seem to fill deficits of opening asso-ciated with the September 2005 megadike (see Figures 4 and6a) [see also Hamling et al., 2009]. More surprisingly, a fewother dikes, including the most voluminous ones (e.g., d1,d10 and d11, but also d3, and d7a) appear to have beenemplaced at locations that had previously experienced alarge amount of opening in 2005 (Figure 4). This featurewill be addressed in more detail in section 4.5.[44] Another key observation is that depth of dike opening
is observed to increase at greater distance from the centralmagma reservoir (Figures 4 and 7a). This may reflect thethickening of the elastic‐brittle crust toward segment ends,allowing for the possibility of a higher resistance of thecrust, and less frequent, thicker dike intrusions [Rubin,1995]. This is compatible with the presence of a mantleupwelling at the center of the segment where magma gen-eration and/or melt ascent in the lithosphere are focused,such as at mid‐ocean ridges [Shaw and Lin, 1996;Dunn et al.,2005] or the Asal rift, in eastern Afar [Doubre et al., 2007].Unfortunately, no geophysical data are currently availableto constrain along‐axis variations of the thickness of thebrittle‐elastic lithosphere in the Manda Hararo rift.[45] Finally, the distribution of dike opening as a function
of distance from the central magma reservoir suggests thatmore voluminous dikes tend to travel further (Figure 7b).This is the case of d7 and d8 to the south, and d1 and d10 tothe north. Although the problem of identifying the magmapathway for such distant dikes is not resolved, their largervolume (with respect to more proximal dikes, like d2, d3,d4, d5, d6, d12) may indicate that driving stress is highertoward segment ends to the northern and southern ends ofManda Hararo rift. Since magma pressure in the dike is likelyto decrease as the dike is emplaced at increasingly largedistance from the source reservoir, a high driving stresstoward segment ends may be due to a larger magnitude oftensile stress on the plate boundary there. A more complexmodeling approach, that would include thermomechanics ofdike intrusions and magma storage, is required to investigatethis point.
4.3. Normal Stress Changes off to the Side of the Dikes
[46] In this section, we describe first‐order features of thevariations of the stress field along the dike bodies off to theirsides, and we attempt to draw an analogy between dikes andearthquakes within the framework of linear elastic fracturemechanics (Figures 6f–6j and 7c and Table 1).[47] Prior to the onset of a rifting episode, the brittle crust
is stretched, and opening of a dike relieves a fraction of theaccumulated tension. The initial tensile stress is thus locallylowered by a dike intrusion (section 3.3). We recall thatincreases of s3 correspond to more compressive, or lesstensile stress conditions. The corresponding changes indriving stress (equation (1)) imply that dike intrusions are
GRANDIN ET AL.: SEQUENCE OF RIFTING IN AFAR IN 2005–2009 B10413B10413
10 of 18
promoted in areas of decreased s3, whereas dikes are lesslikely to open in regions where s3 has increased.[48] The normal stress s3 locally increased by more than
∼300 bars in September 2005 in the area of maximumopening of the megadike (d0a), and by only ∼150 bars in thesouthern part of the dike, where magnitude of opening waslower (d0b) (Figure 6f). Later dikes induced a local increaseof s3 by ∼25–100 bars on the dike plane in their respectiveareas of maximum opening (Figures 6g–6i). Locally largepositive or negative values of stress change also appear atdepths shallower than 1–2 km because opening distributionis rough in our inversions in this depth range (Figure 6j).
Actually, such high tensions/compressions are likely accom-modated by slip on faults in the subsurface and the distributedopening of fractures. This effect, which is strongest after theSeptember 2005 megadike, is therefore an artifact caused byour choice to ignore faults in the modeling (section 3.2). Wedo not discuss this point further.[49] As seen in section 4.2, opening distributions associ-
ated with dike intrusions in the Manda Hararo rift in 2005–2009 suggest that dikes may be described, to the first order,as cracks in an elastic body. Our elastic inversions allow tocalculate the stress changes associated with these dikes,using directly the surface and average opening of the dikes.
Figure 7. (a) Depth of the dikes as a function of their location along the rift (the dots indicate the loca-tion of peak opening for each dike). Dikes of September 2005 (d0) and November 2007 (d7) have beensplit in two subdikes (see text for discussion).(b) Volume of the dikes as a function of their location alongthe rift (the dots indicate the location of peak opening for each dike). Megadike d0, with a total volume of1.2 km3, is not shown, for clarity. In Figures 7a and 7b, the origin of the horizontal axis is taken at thelocation of Wal’is magma reservoir at 12.30°N (Figure 3). (c) Dike volume versus surface area (grey fillin Figure 4). Solid lines represent the trend for a constant displacement‐to‐length ratio D�. Betweenparentheses, equivalent stress changes Ds using a modulus of 3 × 10¹⁰ Pa are indicated. Dashed lineshows trend for a shear stress drop of 21 and 60 bars relevant for tectonic earthquakes, deduced fromscaling relationships by Wells and Coppersmith [1994] (WC94) and Kanamori and Anderson [1975](KA75), respectively.
GRANDIN ET AL.: SEQUENCE OF RIFTING IN AFAR IN 2005–2009 B10413B10413
11 of 18

Stress changes obtained in this manner may be comparedwith the static shear “stress drops” for tectonic earthquakes[e.g., Scholz, 2002] (see Appendix B for more details on thecalculations). We define the decrease in tensile stress aver-aged on the surface of the dike coeval to intrusion as the“average normal stress change” (Figure 7c and Table 1). Theaverage normal stress changes associated with dikes in2006–2009 in the Manda Hararo rift are in the range of 15–50 bars, and up to 70 bars for the September 2005 megadike(perhaps reaching 150 bars on subdike d0a). These valuesare comparable with the static shear stress drops of 20–60 bars caused by earthquakes releasing similar amount ofstrain energy [e.g.,Kanamori and Anderson, 1975;Wells andCoppersmith, 1994; Allmann and Shearer, 2009]. The dis-placement‐to‐length ratios for dikes in the Manda Hararo rift(20–50 × 10 −5) are thus the same as those of earthquakeswith similar rupture areas (in the range of 50–150 km2,corresponding to magnitudes M ∼ 6). This feature may betypical of dikes intruded at low magma pressure and highdifferential stress, such as in the volcanic rift zones of Iceland[Rubin, 1990]. The low‐pressure hypothesis is further sup-ported by absence of inflation of the Wal’is magma chamberprior to the September 2005 megadike intrusion [Grandinet al., 2009]. This observation may be an indicator of thepredominant role of tectonic stress in driving dike intrusionsin the tectonic context of the Manda Hararo rift.[50] However, occurrence of multiple events of similar
magnitude emplaced in nearly the same region of the plateboundary, but separated by intervals of time much shorterthan characteristic time of tectonic stress buildup, is nottypical of earthquakes. The cause of this phenomenon likelyarises from the limited magma availability at the onset ofdike propagation due to the limited size of the source res-ervoir feeding the dikes, or, in other words, its inability tosustain high magma pressure during dike expansion [Bucket al., 2006; Rivalta, 2010]. So, even if dike opening doesnot involve contact between the dike walls, limited magmaavailability may be envisioned as the counterpart of somekind of “dynamic friction” in earthquake phenomena, for itlimits the amount of differential stress that can be relievedby a single event. The equivalent of a “static friction” maybe found in the threshold of driving stress in the neigh-borhood of the source reservoir that must be reached tonucleate a dike. Unfortunately, the overwhelming importanceof fluid mechanics in driving dike intrusion, in contrast to theprocess of earthquake rupture, prevents us to make furtheranalogies.
4.4. Cumulative Increase of Tension in the Vicinityof the Magma Source
[51] As shown in Figure 5 and discussed in section 4.3,coeval to magmatic intrusion, s3 increases off to the side ofthe dikes, but s3 also decreases beyond the perimeter of adike, thus facilitating future dike opening there. In thissection, we focus our analysis on the stress change beyondthe surfaces of the dikes, off crack ends (Figures 6f–6j). Werecall that this approach is likely affected by several sourcesof uncertainty and associated errors originating from variousorigins. For instance, opening distributions deduced frominversion of InSAR data are model and geometry dependent.Furthermore, departure from a purely elastic behavior maydistort surface displacement fields, which may bias our
inversions. Also, our analysis implicitly neglects the exis-tence of important variations in magma pressure in thesource magma reservoir at the beginning of dike intrusions.Finally, transient phenomena that might have occurred shortlyafter or before dike intrusions would be undetected by thegeodetic data presented here. Despite these limitations, theuniform handling of InSAR data presented in this studyensures that a consistent treatment is applied to all dikes,and that the differences between strain fields induced by thedifferent dikes at the surface provide reliable information onthe relative locations and volumes of the dikes, which arethe two basic informations used in our stress modeling.[52] After intrusion of the September 2005 megadike, s3
decreased by more than 100 bars beneath the local minimumof opening between d0a and d0b, approximately at the lat-itude of the central magma reservoir (Figure 6f). Subsequentdike intrusions occur above the point of maximum decreaseof s3 at shallow depth (1–4 km depth), leading to a totalcumulative decrease of s3 by as much as 150 bars at the endof the sequence of dike intrusions of 2005–2009 (orangeregion in Figure 6j at 0 km along the rift and 6 km depth).This localized increase of tension emerges because no dis-crete dike intrusion event has occurred at any time in thecenter of the rift at a depth greater than 4 km (section 4.2).This is in keeping with information from seismicity migrationduring dike emplacement, and codiking deflation imaged bygeodesy, which show that this location is approximatelythat of the inferred source of magma for dike injections[Ayele et al., 2009; Hamling et al., 2009]. In addition, thisarea of increased tension on the plate boundary is preciselythe locus of transient events of rift‐perpendicular opening inthe 4–10 km depth range, occurring in the weeks/monthsfollowing most dike injections, as revealed by InSAR[Grandin et al., 2010].[53] We propose that the absence of deep discrete dike
injection at the center of the rift may be caused by thepresence of a local thinning of the brittle‐elastic crust in thisarea, possibly due to proximity of a midsegment heat sourceassociated with focused magma percolation and ascent(Figures 4 and 7a). The slow opening transients reported byGrandin et al. [2010] are not compatible with a simplebrittle‐elastic rheology there and may be caused by adeformation process leading to gradual relaxation of at leastpart of the increased tensions caused by dike intrusions.However, the physical mechanism responsible for thedelayed response of the lithosphere in this area (continueddike opening at depth, viscoelastic process, interaction withpressurized magmatic fluids, etc.) is poorly understood [seeGrandin et al., 2010].
4.5. Interactions Between Dikes
[54] In this section, we follow the evolution of the normalstress s3 on the dike plane as a function of time, in order toassess the possibility of static triggering between dikes inthe 2005–2009 sequence (Figures 6f–6j and 8). We use anapproach similar to that adopted for earthquake sequences,following Amelung et al. [2007] (for a review of stressinteraction between earthquakes, see also King [2007]).[55] In Figure 8, we have plotted the cumulative change of
s3 as a function of time, for a series of target locations onthe dike plane. These locations are chosen to correspond toloci of peak opening (D > 0.9Dmax) during the successive
GRANDIN ET AL.: SEQUENCE OF RIFTING IN AFAR IN 2005–2009 B10413B10413
12 of 18

dike intrusions (Figure 4). The static stress changes followingSeptember 2005 megadike injection are summed, in order toassess whether a given dike lies in an area of increased ordecreased s3 at the time of dike intrusion, given the suc-cession of previous dike intrusions in the sequence. Thestress values prior to September 2005 are unknown, and anychange of tensile stress in the 2005–2009 interval caused byfar‐field tectonic loading, or continuous deformation atdepth during that period, is not taken into account.[56] All dikes north of Wal’is (d1, d10 and d11), and three
dikes to the south (d3, d7a and d9), were emplaced in areaswhere s3 had already increased (i.e., where tension hasdecreased) as a result of intrusion of the September 2005
megadike (Figure 8). This indicates that all the initial (tensile)differential stress was not relieved fully by the first dikeinjection, possibly because not enough magma was available(section 4.3). However, despite a higher magnitude of s3 in2006–2009 than before September 2005, and hence a lowerdriving stress (equation (1)), it was still possible for magmato be emplaced into a series of thick dikes in regions alreadyopened by megadike d0 (see dikes d3, d7, and d10 inFigure 4). Three possibilities may explain this observation:(1) magma pressure was higher in 2006–2009 than in 2005,allowing injections to be triggered despite an overall decreaseof tension in the brittle crust; (2) rupture of the elastic‐brittlecrust was made easier in 2006–2009 than in 2005 due to adecreased resistance of host rock in the region of emplace-ment of the previous dikes; and (3) rupture of the reservoirroof/wall, and escape of magma, was made easier in 2006–2009 than in 2005 due either to a lowered resistance tofracture of the magma reservoir or increased tension aroundthe magma reservoir due to stress transfer induced by nearbyinjections. Identifying the most likely hypothesis requiresknowledge of magma pathway, which is still debated.However, the fact that the three largest events in this popu-lation of 2006–2009 dikes (d1, d10 and d11) were in theupper range of dike injections in terms of volume (Figure 7b),and all occurred north of the inferred central magma reservoir(Figure 3), may indicate that tension was highest in that partof the rift in 2006. The greater tension there may have beencapable of attracting the most voluminous dikes in thesequence. This may still be the case, and one might expectmore injections there in the future.[57] Figure 8 shows that all other dikes (d2, d4, d5, d6, d8
and d12) emplaced in areas of decreased s3 with respect tothe value before September 2005. In our modeling, theseincreased tensions are due to the stress transfer induced bythe September 2005 megadike. As successive intrusionsoccurred in 2006–2009, s3 progressively increased, so thatafter the last observed intrusion of June 2009 (d12), normalstress computed at the loci of maximum opening of thesedikes had nearly returned to the initial level before September2005. Consequently, the cumulative opening of these dikesappears to have just compensated for the decrease of s3induced by the September 2005 megadike alone (Figure 8).This may indicate that these dikes were triggered primarilyby megadike d0, and need not correspond to the relief ofdifferential stress accumulated before September 2005.[58] These smaller dikes occurred at shallow depth, in most
cases near to the magma source (Figure 4). Furthermore, littleopening occurred in this region in September 2005 (Figure 4).These observations suggest that differential stress was rela-tively low in this area both before and after September 2005.In addition, two dikes (d6 and d12) were associated withaxial basaltic eruptions approximately above the centralmagma reservoir (Figure 7). This suggests that magma excesspressure and/or buoyancy dominates over tectonic stress inthe vicinity of the magma source, possibly as a result of alower resistance of the thinned lithosphere there [e.g.,Gudmundsson, 1986]. We could expect that dike intrusionsthat may occur in the following months (if any) in this areawill be both smaller, and associated with more copiouseffusive activity, as remaining tensile stress may be low in the
Figure 8. Evolution of the cumulative normal stress changeat the location of each dike over the duration of the rifting epi-sode (location is chosen as the locus of peak opening, shownin Figures 4 and 7a). Stress change is computed with respectto an unknown initial stress. Note that normal stress change ischosen negative where tensile stress increases (regions inyellow on the right part of Figure 6). Values on the far rightgive the stress change after last observed dike d12 (Figure 6j).For each dike, black circle shows the local value of stressprior to intrusion of the dike. For all cases, with the exceptionsof dikes d1, d3, d10, and d11, tensile stress increased in thearea of emplacement of the upcoming dike as a result ofintrusion of the previous dike in the sequence.
GRANDIN ET AL.: SEQUENCE OF RIFTING IN AFAR IN 2005–2009 B10413B10413
13 of 18

vicinity of the central magma reservoir [e.g., Buck et al.,2006].[59] The case of dike d9 is interesting in its own right:
although it occurred at shallow depth, this dike was emplacedin an area of decreased tension with respect to before dike d0(Figure 8), so that its interpretation is problematic. However,this dike induced an increase of s3 slightly greater than thedecrease of s3 transferred by dike d7 alone. We also noticethat the magnitude of the decrease of s3 at d9 induced by d7is the highest of all decreases of s3 calculated throughout therifting episode for any other pair of dikes between 2006 and2009 (Figure 8). This is due to the surprising complemen-tarity of opening distributions of dikes d7a and d9, the latterdike filling a local minimum of opening of the first dike(Figure 4). Thus, given the uncertainty on the initial stressconditions, dike d9 may also belong to a category of dikestriggered by stress change caused by the previous dike(s) inthe sequence. In this view, taken as a whole, the sequenced7b‐d8‐d9, which occurred ahead, above and below the limitsof dike d0b, respectively (Figure 4), may represent a south-ward propagation of the rupture initiated in September 2005.Repeated inflation during previous dike intrusions d0b, d3and, finally, d7a may have provided the conditions that led toits eventual growth. In addition, we may speculate that themagma emplaced in dikes d8‐d9 flowed through the body ofdike d7a to reach the crack tip region, as dike d7a, with amaximum thickness of 2 m, may have remained open forseveral months (the solidification time scales with the squareof dike thickness, and a dike that is several meters thick mayrequire years to freeze by conduction [Turcotte and Shubert,1982; Carslaw and Jaeger, 1986]). However, more data arerequired to support this hypothesis.
5. Conclusions
[60] The 13 rifting events that occurred from September2005 to June 2009, in the Manda Hararo rift in Afar(Ethiopia), as part of an ongoing rifting episode, provide anunprecedented opportunity to illuminate the process of dikeintrusion at a divergent plate boundary. Using InSAR data,we invert for dike opening as a function of depth and locationalong the rift. Resulting opening distributions are then used tocompute distribution of static normal stress change on theplate boundary as a function of time. Our models rely on aseries of hypotheses. The first is that the lithosphere behavesin an elastic manner on the timescale of dike emplacement(a few tens of hours). Also, we assume that dikes preferen-tially emplace in sectors of the plate boundary where tensionsare highest. Finally, we suppose that dikes are fed by amidsegment magma reservoir located below the rift. Keepingthese assumptions in mind, we interpret the space‐time evo-lution of diking during the current rifting episode using avariety of approaches.[61] Inversion of InSAR data shows that dikes were
emplaced between 0 and 12 km depth, with thicknesses of0.8–3.5 m (up to 12 m peak opening for the September2005 megadike), lengths of 10–15 km (65 km in September2005), and volumes of 0.04–0.2 km3 (probably > 1 km3 inSeptember 2005). Dikes are intruded north, south or aboveof the inferred magma reservoir located in the middle of thesegment (“Wal’is” magma reservoir).
[62] Cumulative opening distributions of the dikes sug-gest that the thickness of the lithosphere intruded by dikesis least at the latitude of this midsegment magma reservoir(∼4–6 km), and is thicker toward segment ends (∼10–12 km).Near the magma reservoir, no deep discrete dike intrusion isobserved, but slow deformation has been reported in the timeintervals separating diking events [Grandin et al., 2010]. Thisis compatible with the presence of a “hot” thermal anomalycaused by focused melt ascent from below the lithosphere,responsible for a shallowing of the brittle‐ductile boundarythere, in analogy with observations made at slow spreadingmid‐ocean ridges [e.g., Lin et al., 1990; Shaw and Lin, 1996;Dunn et al., 2005].[63] The average normal stress changes during individual
dike intrusions off to the sides of the dike bodies are in therange of 15–50 bars (up to 70–150 bars for the September2005 megadike), using a “reduced” Young’s modulus ofE = 3.0 × 10¹⁰ Pa. This is comparable with the average staticshear stress drop reported for tectonic earthquakes, possiblysuggesting that rifting in the tectonic context of the MandaHararo rift is mostly controlled by tension in the brittle lith-osphere as a result of boundary conditions imposed bydivergence of tectonic plates. These dikes, similarly to thoseobserved in the Northern Volcanic Zone of Iceland, or atmagma‐poor slow spreading mid‐ocean ridges, seem to bedriven primarily by tectonic stress and to intrude at lowmagma pressure [Rubin, 1990].[64] We identify groups of successive dike intrusions that
are clustered in space and time, suggesting that dikes interact,and are not randomly distributed on the dike plane. Theobservation that the most voluminous dikes in the 2006–2009sequence (d1, d10 and d11) broke sections of the plateboundary that had been already opened by the September2005 megadike by as much as ∼10 m, suggests that the deficitof opening accumulated since the previous rifting episode(∼102–103 years ago) has remained high at that locationthroughout the duration of the current rifting episode. Othersmaller dikes, less distant from their inferred midsegmentsource (d2, d4, d5, d6 and d12), seem to fill local minima ofopening of the initial megadike intrusion of September 2005.Two dikes propagated to the south of the magma reservoirand have been emplaced in regions that had only moderatelyopened in 2005 (d3 and d7a). They were followed by eventsthat extended the rupture area to the south, beyond the limitsof the 2005 megadike (d7b, d8 and d9). These observationssuggest that models attempting to explain the succession ofdike intrusions during a rifting episode should take intoaccount the possibility that stress transfer may play a role intriggering at least some of the dike intrusions during a riftingepisode.[65] Normal stress modeling also indicates an apparently
higher opening deficit north of the Wal’is magma reservoir,compared to the southern part of the rift, both before andafter emplacement of the September 2005 megadike. This isnot compatible with the driving stress being primarily con-trolled by the along‐rift axial topographic profile [e.g., Fialkoand Rubin, 1998], as both sections of the rift are characterizedby similar elevations. Rather, as suggested by Buck et al.[2006], the initial distribution of (tensile) differential stresson the plate boundary, controlled by the history of previousrifting episodes that ruptured partially the plate interface inthe past [e.g., Björnsson, 1985], and/or the difference in
GRANDIN ET AL.: SEQUENCE OF RIFTING IN AFAR IN 2005–2009 B10413B10413
14 of 18

crustal thickness resulting from a structural or thermalinheritance on geologic timescales [e.g., Rubin, 1995], mayexert a greater control on the style and succession of riftingevents and associated eruptive manifestations.
Appendix A: InSAR Processing
[66] A total of 235 interferograms were computed. InSARdata were processed with ROIPAC software [Rosen et al.,2004]. Envisat state vectors calculated by ESA usingDORIS orbits were used to subtract the orbital fringe pattern[Zandbergen et al., 2002]. The topographic contribution tothe interferometric phase was subtracted using a 90 m SRTMDEM [Farr and Kobrick, 2001]. Unwrapping was per-formed using a cut‐tree algorithm [Goldstein et al., 1988].Topography‐correlated tropospheric delay [e.g., Beauducelet al., 2000; Hannsen, 2001] was removed empirically fromeach InSAR image by determining a linear regression betweenphase and altitude on surrounding volcanic edifices wheredeformation is assumed to be absent [see, e.g., Cavalié et al.,2007]. A planar trend is simultaneously subtracted from LOSdata in the regions not affected by codiking deformation inorder to reduce bias induced by orbital errors.[67] The periodicity of dike intrusions from June 2006 to
June 2009 is sufficient to enable the retrieval of codikinginterferograms for most events on both ascending and des-cending tracks. Furthermore, for each track independently, apixel‐by‐pixel time series inversion was performed onInSAR data to deduce LOS displacement between every twosuccessive SAR acquisitions, with a maximum sampling rateof 35 days [e.g., Berardino et al., 2002; Schmidt andBürgmann, 2003]. A total of 42 InSAR measurements areobtained by this technique (Table S1). For 10 dikes out of 12,both ascending and descending LOS deformation data closelybracketing the diking event are available. For the two dikesof December 2006 and January 2007, which are separatedby a very short interval in time, sparse SAR data do not allowthe events to be easily separated, as the only interferogramsfrom the descending track (464) include the cumulativedeformation produced by the two events. A specific proce-dure was applied for these two dikes. For the January 2007event, codiking deformation was inverted with data fromascending tracks 28 and 300 only (see section 3.2). Then,synthetic deformation deduced from the solution of theinversion was projected onto LOS vector of track 464, andthe resulting synthetic LOS displacement was subtractedfrom the interferogram of track 464 that images both events.The resulting LOS deformation on track 464 thus includesthe deformation produced by the December 2006 eventonly, plus modeling errors. It was then inverted jointly withInSAR data on tracks 28 and 300 spanning the December2006 event.
Appendix B: Method for Calculating AverageStrain‐Stress ChangesB1. Definition of Strain and Stress Changes
[68] Within the framework of linear elastic fracturemechanics, both dikes and earthquakes may be representedas cracks in an elastic body: mode I tensile cracks in the caseof dikes, mode II or III shear cracks for earthquakes [Scholz,2002]. The average strain change D� associated with crack
models is defined here as proportional to the ratio betweenaverage relative displacement of the cracks faces ~D, andcharacteristic length scale of the crack L, approximated hereby the square root of crack area S:
D� ¼ C~D
L�
~DffiffiffiS
p ðB1Þ
where C is a constant that depends on the geometry of thecrack [e.g., Eshelby, 1957; Aki, 1972]. For a roughly circularcrack, C ∼ 1 [Kanamori and Anderson, 1975]. For simplicity,we assume that C = 1, hence the approximate formula inequation (B1). Taking more realistic values of C to accountfor the different geometry of dike d0 would only increaseour estimates of D� by a factor 2 [Boore, 1977]. The term“average” here implies that values of strain change areaveraged over the crack surface.[69] The average strain change is dimensionless, and can
be understood as a displacement‐to‐length ratio, providingan estimate of how much separation or relative slip of thecrack walls occurs for a given crack size. This ratio can bereadily used to compare the amount of strain energy releasedby dikes and earthquakes.[70] The average stress change associated with diking or
earthquake rupture can be deduced from the average strainchange in equation (B1) after multiplication by the appro-priate elastic modulus: shear modulus m for earthquakes andYoung’s modulus E for dikes.
B2. Comparison Between Dikes and Earthquakes
[71] For the dikes studied in this paper, parameters ~D andS are directly constrained by our inversions, and estimationof the magnitude of the strain change is straightforward. Thevalues of ~D and S are calculated individually for each dike,by taking into account patches with an openingD > 0.1Dmax,where Dmax is the maximum dike opening. Strain changesdeduced in this manner are in the range of 5–50 × 10 −5. Witha Young’s modulus of E = 3 × 10¹⁰ Pa [Touloukian, 1981;Stein et al., 1991], we obtain normal stress changes in therange of 15–150 bars for dikes intruded in 2005–2009 in theManda Hararo rift.[72] Because earthquakes represent a means of partially
relieving tectonic stresses, the shear stress change coeval toearthquake rupture is called a “stress drop” by seismologists(hereafter noted Dt). Earthquake shear stress drops are com-monly estimated directly from the spectral content of radiatedseismic waves, which is dependent both on rupture area andaverage slip [e.g., Brune, 1970]. However, this method is notrelevant for dikes, which are largely aseismic objects at highfrequency, probably due to their very low rupture velocity(∼1 km/h for dikes versus >1 km/s for earthquakes) [e.g.,Haskell, 1964], thus hindering any comparison.[73] An alternative for calculating average static shear
stress drops for earthquakes is to exploit the various scalinglaws deduced from study of a large number of earthquakes,which relate geometric and kinematic parameters associatedwith seismic ruptures, such as the magnitude‐length relation[e.g., Kanamori and Anderson, 1975; Romanowicz and Ruff,2002; King and Wesnousky, 2007]. For instance, Wells andCoppersmith [1994] provide an empirical relation betweenmoment magnitude Mw and rupture area S (in m2) for an
GRANDIN ET AL.: SEQUENCE OF RIFTING IN AFAR IN 2005–2009 B10413B10413
15 of 18

extensive global catalogue of earthquakes of various me-chanisms and magnitudes:
Mw ¼ �1:81þ 0:98 log Sð Þ � �1:81þ 1 log Sð Þ ðB2Þ
[74] Using the definition of the moment magnitude [Hanksand Kanamori, 1979],
Mw ¼ �6:03þ 2
3log �S ~D
� � ðB3Þ
where m is the shear modulus (here expressed in Pa), S is therupture area (in m2), and ~D is the mean slip (in m), we deducethat the population of earthquakes following the statisticalrelation of Wells and Coppersmith [1994] corresponds to anaverage shear stress drop ofDt = 21 bars (using the formulaDt = m~D/
ffiffiffiS
p). This is the same order of magnitude as the
value of 60 bars reported by Kanamori and Anderson [1975]and agrees well with several recent compilations of earth-quake stress drops [e.g.,Manighetti et al., 2007; Allmann andShearer, 2009]. Using a shear modulus of m = 3 × 10¹⁰ Pa,these values correspond to a shear strain change in the rangeof 7–20 × 10−5 (dashed lines in Figure 7c).[75] Note that in the above calculations, the values of
Young’s modulus and shear modulus were chosen to beequal. In fact, the “seismological” shear modulus of m = 3 ×10¹⁰ Pa is equivalent to a Young’s modulus of E = 7.5 ×10¹⁰ Pa (using a Poisson ratio of n = 0.25 and the formulaE = 2m (1 + n)). The choice of a “reduced” Young’smodulus of E = 3.0 × 10¹⁰ Pa for stress changes induced bydikes in theMandaHararo rift is justified by numerous studiescarried out in areas of volcanic unrest [e.g., Gudmundsson,1988; Cayol and Cornet, 1998], which have shown that the“seismological” Young’s modulus is too high, perhaps by asmuch as one order of magnitude, to reconcile geodetic mea-surements and pressure changes in magma reservoirs inferredfrom physical modeling.
[76] Acknowledgments. We are grateful to late Pascal Favreau forhis encouragements at an early stage of this work. This paper benefitedfrom fruitful discussions with François Beauducel, Cécile Doubre and BenoîtTaisne. We thank Arthur Delorme and Geneviève Moguilny, who providedassistance for the InSAR processing. One anonymous reviewer and StephenJ. Martel made constructive remarks that helped improve the manuscript. Wethank the European Space Agency (ESA) for programming the Envisatsatellite and providing data crucial to this work (AOE‐272, AOE‐720).The Repeat Orbit Interferometry Package (ROI_PAC) software was pro-vided by Caltech/Jet Propulsion Laboratory (JPL). We acknowledge thecontribution of David Bowman in the development of the Marzipanand Nutcracker softwares, which were used for stress calculations. Mostfigures were prepared with the Generic Mapping Tool (GMT) software[Wessel and Smith, 1991]. This is IPGP contribution 3060.
ReferencesAki, K. (1972), Earthquake mechanism, Tectonophysics, 13, 423–446,doi:10.1016/0040-1951(72)90032-7.
Allmann, B. P., and P. M. Shearer (2009), Global variations of stress dropfor moderate to large earthquakes, J. Geophys. Res., 114, B01310,doi:10.1029/2008JB005821.
Amelung, F., S.‐H. Yun, T. R. Walter, P. Segall, and S.‐W. Kim (2007),Stress control of deep rift intrusion at Mauna Loa Volcano, Hawaii,Science, 316, 1026–1030, doi:10.1126/science.1140035.
Anderson, E. M. (1938), The dynamics of sheet intrusion, Proc. R. Soc.Edinburgh, 58, 242–251.
Arnott, S. K., and G. R. Foulger (1994), The Krafla spreading segment,Iceland. 2: The accretionary stress cycle and nonshear earthquake focalmechanisms, J. Geophys. Res., 99, 23,827–23,827, doi:10.1029/94JB00688.
Audin, L., X. Quidelleur, E. Coulié, V. Courtillot, S. Gilder, I. Manighetti,P.‐Y. Gillot, P. Tapponnier, and T. Kidane (2004), Palaeomagnetism andK‐Ar and 40Ar/39Ar ages in the Ali Sabieh area (Republic of Djiboutiand Ethiopia): constraints on the mechanism of Aden ridge propagationinto southeastern Afar during the last 10 Myr, Geophys. J. Int., 158,327–345, doi:10.1111/j.1365-246X.2004.02286.x.
Ayele, A., E. Jacques, M. Kassim, T. Kidane, A. Omar, S. Tait, A. Nercessian,J.‐B. de Chabalier, and G. C. P. King (2007), The volcano seismic crisis inAfar, Ethiopia, starting September 2005, Earth Planet. Sci. Lett., 255,177–187, doi:10.1016/j.epsl.2006.12.014.
Ayele, A., D. Keir, C. Ebinger, T. J. Wright, G. W. Stuart, W. R. Buck,E. Jacques, G. Ogubazghi, and J. Sholan (2009), September 2005mega‐dike emplacement in the Manda‐Harraro nascent oceanic rift(Afar depression), Geophys. Res. Lett., 36, L20306, doi:10.1029/2009GL039605.
Barberi, F., H. Tazieff, and J. Varet (1972), Volcanism in the Afar depres-sion: Its tectonic and magmatic significance, Tectonophysics, 15, 59–64,doi:10.1016/0040-1951(72)90051-0.
Beauducel, F., P. Briole, and J.‐L. Froger (2000), Volcano‐wide fringesin ERS synthetic aperture radar interferograms of Etna (1992–1998):Deformation or tropospheric effect?, J. Geophys. Res., 105(B7),16,391–16,402, doi:10.1029/2000JB900095.
Belachew, M., C. J. Ebinger, D. Keir, D. M. Cote, and A. Ayele (2009),Comparison of dike intrusions in Afar: Seismic perspective for sourceand extent, Eos Trans. AGU, 90(52), Fall Meet. Suppl., AbstractT31B‐1811.
Berardino, P., G. Fornaro, R. Lanari, and E. Sansosti (2002), A newalgorithm for surface deformation monitoring based on small baselinedifferential SAR interferograms, IEEE Trans. Geosci. Remote Sens.,40, 2375–2383, doi:10.1109/TGRS.2002.803792.
Berckhemer, H., B. Baier, H. Gebrande, J. Makris, H. Menzel, H. Miller,and R. Vees (1975), Deep seismic soundings in the Afar region and onthe highland of Ethiopia, in Proceedings of an International Symposiumon the Afar Region and RiftRelated Problems, Bad Bergzabren, Germany,edited by A. Pilger and A. RÖsler, pp. 89–107, Schweizerbart, Stuttgart,Germany.
Björnsson, A. (1985), Dynamics of crustal rifting in NE Iceland, J. Geophys.Res., 90(B12), 10,151–10,162, doi:10.1029/JB090iB12p10151.
Boore, D. M. (1977), Effect of the free surface on calculated stress drops,Bull. Seismol. Soc. Am., 67(6), 1661–1664.
Brandsdöttir, B., and P. Einarsson (1979), Seismic activity associated withthe September 1977 deflation of the Krafla central volcano in northeasternIceland, J. Volcanol. Geotherm. Res., 6, 197–212, doi:10.1016/0377-0273(79)90001-5.
Bruce, P. M., and H. E. Huppert (1989), Thermal control of basaltic fissureeruptions, Nature, 342, 665–667, doi:10.1038/342665a0.
Brune, J. N. (1970), Tectonic stress and the spectra of seismic shear wavesfrom earthquakes, J. Geophys. Res., 75, 4997–5009, doi:10.1029/JB075i026p04997.
Buck, W. R., L. L. Lavier, and A. N. B. Poliakov (2005), Modes of faultingat mid‐ocean ridges, Nature, 434, 719–723, doi:10.1038/nature03358.
Buck, W. R., P. Einarsson, and B. Brandsdóttir (2006), Tectonic stress andmagma chamber size as controls on dike propagation: Constraints fromthe 1975–1984 Krafla rifting episode, J. Geophys. Res., 111(B12),B12404, doi:10.1029/2005JB003879.
Carslaw, H. S., and J. C. Jaeger (1986), Conduction of Heat in Solids,2nd ed., Oxford Univ. Press, New York.
Cavalié, O., M.‐P. Doin, C. Lasserre, and P. Briole (2007), Ground motionmeasurement in the Lake Mead area, Nevada, by differential syntheticaperture radar interferometry time series analysis: Probing the lithosphererheological structure, J. Geophys. Res., 112, B03403, doi:10.1029/2006JB004344.
Cayol, V., and F. H. Cornet (1998), Three‐dimensional modeling of the1983–1984 eruption at Piton de la Fournaise Volcano, Réunion Island,J. Geophys. Res., 103, 18,025–18,037, doi:10.1029/98JB00201.
de Chabalier, J.‐B., and J.‐P. Avouac (1994), Kinematics of the Asal Rift(Djibouti) determined from the deformation of Fieale Volcano, Science,265, 1677–1681, doi:10.1126/science.265.5179.1677.
Delaney, P. T., and D. D. Pollard (1981), Deformation of host rocks andflow of magma during growth of minette dikes and breccia bearing intru-sions near Ship Rock, New Mexico, U.S. Geol. Surv. Prof. Pap., 1202,61 pp.
Doubre, C., I. Manighetti, C. Dorbath, L. Dorbath, E. Jacques, andJ. C. Delmond (2007), Crustal structure and magmato‐tectonic processesin an active rift (Asal‐Ghoubbet, Afar, East Africa): 1. Insights from a5‐month seismological experiment, J. Geophys. Res., 112, B05405,doi:10.1029/2005JB003940.
Dunn, R. A., V. Lekić, R. S. Detrick, and D. R. Toomey (2005), Three‐dimensional seismic structure of theMid‐Atlantic Ridge (35°N): Evidence
GRANDIN ET AL.: SEQUENCE OF RIFTING IN AFAR IN 2005–2009 B10413B10413
16 of 18

for focused melt supply and lower crustal dike injection, J. Geophys. Res.,110, B09101, doi:10.1029/2004JB003473.
Dziak, R. P., D. K. Smith, D. R. Bohnenstiehl, C. G. Fox, D. Desbruyeres,H. Matsumoto, M. Tolstoy, and D. J. Fornari (2004), Evidence of arecent magma dike intrusion at the slow spreading Lucky Strike segment,Mid‐Atlantic Ridge, J. Geophys. Res., 109, B12102, doi:10.1029/2004JB003141.
Ebinger, C. J., D. Keir, A. Ayele, E. Calais, T. J. Wright, M. Belachew,J. O. S. Hammond, E. Campbell, and W. R. Buck (2008), Capturingmagma intrusion and faulting processes during continental rupture:seismicity of the Dabbahu (Afar) rift, Geophys. J. Int., 174, 1138–1152,doi:10.1111/j.1365-246X.2008.03877.x.
Einarsson, P. (1991), The Krafla rifting episode 1975–1989, in NáttúraMývatns (The Nature of Lake Mývatn), edited by A. G. and Á. Einarsson,p. 97–139, Icelandic Nat. Sci. Soc., Reykjav’k, Iceland.
Eshelby, J. D. (1957), The determination of the elastic field of an ellipsoidalinclusion, and related problems, Proc. R. Soc. London, Ser. A, 241,376–396, doi:10.1098/rspa.1957.0133.
Farr, T. G., and M. Kobrick (2001), The Shuttle Radar TopographyMission, Eos Trans. AGU, 82(47), Fall Meet. Suppl., Abstract G22B‐0214.
Ferguson, D. J., T. D. Barnie, D. M. Pyle, C. Oppenheimer, G. Yirgu,E. Lewi, T. Kidane, S. Carn, and I. Hamling (2010), Recent rift‐relatedvolcanism in Afar, Ethiopia, Earth Planet. Sci. Lett., 292(3–4), 409–418,doi:10.1016/j.epsl.2010.02.010.
Fialko, Y. A., and A. M. Rubin (1998), Thermodynamics of lateral dikepropagation: Implications for crustal accretion at slow spreading mid‐ocean ridges, J. Geophys. Res., 103, 2501–2514, doi:10.1029/97JB03105.
Gerbault, M., A. Poliakov, and M. Daignières (1998), Prediction of faultingfrom the theories of elasticity and plasticity: What are the limits?, J. Struct.Geol., 20, 301–320, doi:10.1016/S0191-8141(97)00089-8.
Goldstein, R. M., H. A. Zebker, and C. L. Werner (1988), Satellite radarinterferometry: Two‐dimensional phase unwrapping, Radio Sci., 23,713–720, doi:10.1029/RS023i004p00713.
Grandin, R., et al. (2009), September 2005 Manda Hararo‐Dabbahu riftingevent, Afar (Ethiopia): Constraints provided by geodetic data, J. Geophys.Res., 114, B08404, doi:10.1029/2008JB005843.
Grandin, R., A. Socquet, M.‐P. Doin, E. Jacques, J.‐B. de Chabalier, andG. C. P. King (2010), Transient rift opening in response to multiple dikeinjections in the Manda Hararo rift (Afar, Ethiopia) imaged by time‐dependent elastic inversion of interferometric synthetic aperture radardata, J. Geophys. Res., 115, B09403, doi:10.1029/2009JB006883.
Gudmundsson, A. (1986), Formation of crustal magma chambers inIceland, Geology, 14, 164, doi:10.1130/0091-7613(1986)14<164:FOCMCI>2.0.CO;2.
Gudmundsson, A. (1988), Effect of tensile stress concentration aroundmagma chambers on intrusion and extrusion frequencies, J. Volcanol.Geotherm. Res., 35, 179–194, doi:10.1016/0377-0273(88)90015-7.
Hamling, I. J., A. Ayele, L. Bennati, E. Calais, C. J. Ebinger, D. Keir,E. Lewi, T. J. Wright, and G. Yirgu (2009), Geodetic observations of theongoing Dabbahu rifting episode: New dyke intrusions in 2006 and 2007,Geophys. J. Int., 178, 989–1003, doi:10.1111/j.1365-246X.2009.04163.x.
Hanks, T. C., and H. Kanamori (1979), A moment magnitude scale, J. Geo-phys. Res., 84, 2348–2350, doi:10.1029/JB084iB05p02348.
Hannsen, R. F. (2001), Radar Interferometry: Data Interpretation andError Analysis, Springer, Heidelberg, Germany.
Haskell, N. A. (1964), Total energy and energy spectral density of elasticwave radiation from propagating faults, Bull. Seismol. Soc. Am., 54(6A), 1811–1841.
Hayward, N. J., and C. J. Ebinger (1996), Variations in the along‐axis seg-mentation of the Afar Rift system, Tectonics, 15, 244–257, doi:10.1029/95TC02292.
Jönsson, S., H. Zebker, P. Segall, and F. Amelung (2002), Fault slip distri-bution of the 1999 Mw 7.1 Hector Mine, California, earthquake, esti-mated from satellite radar and GPS measurements, Bull. Seismol. Soc.Am., 92(4), 1377–1389, doi:10.1785/0120000922.
Kanamori, H., and D. L. Anderson (1975), Theoretical basis of someempirical relations in seismology, Bull. Seismol. Soc. Am., 65(5),1073–1095.
Keir, D., et al. (2009), Evidence for focused magmatic accretion at segmentcenters from lateral dike injections captured beneath the Red Sea rift inAfar, Geology, 37(1), 59–62, doi:10.1130/G25147A.1.
King, G. C. P. (2007), Fault interaction, earthquake stress changes, and theevolution of seismicity, in Treatise on Geophysics, vol. 4, edited byG. Schubert, pp. 225–255, doi:10.1016/B978-044452748-6.00069-9,Elsevier, Amsterdam.
King, G. C. P., and S. G. Wesnousky (2007), Scaling of fault parametersfor continental strike‐slip earthquakes, Bull. Seismol. Soc. Am., 97,1833–1840, doi:10.1785/0120070048.
Kostrov, B. V., and S. Das (1988), Principles of Earthquake SourceMechanics, 286 pp., Cambridge Univ. Press, Cambridge, U. K.
Lahitte, P., P.‐Y. Gillot, T. Kidane, V. Courtillot, and A. Bekele (2003),New age constraints on the timing of volcanism in central Afar, in thepresence of propagating rifts, J. Geophys. Res., 108(B2), 2123,doi:10.1029/2001JB001689.
Lin, J., G. M. Purdy, H. Schouten, J.‐C. Sempere, and C. Zervas (1990),Evidence from gravity data for focused magmatic accretion along theMid‐Atlantic Ridge, Nature, 344, 627–632, doi:10.1038/344627a0.
Lister, J. R., and R. C. Kerr (1991), Fluid‐mechanical models of crackpropagation and their application to magma transport in dykes, J. Geo-phys. Res., 96, 10,049–10,077, doi:10.1029/91JB00600.
Lohman, R. B., and M. Simons (2005), Some thoughts on the use of InSARdata to constrain models of surface deformation: Noise structure and datadownsampling, Geochem. Geophys. Geosyst., 6, Q01007, doi:10.1029/2004GC000841.
Manighetti, I., P. Tapponnier, V. Courtillot, Y. Gallet, E. Jacques, and P.‐Y.Gillot (2001), Strain transfer between disconnected, propagating rifts inAfar, J. Geophys. Res., 106, 13,613–13,665, doi:10.1029/2000JB900454.
Manighetti, I., M. Campillo, S. Bouley, and F. Cotton (2007), Earthquakescaling, fault segmentation, and structural maturity, Earth Planet. Sci.Lett., 253, 429–438, doi:10.1016/j.epsl.2006.11.004.
Mastin, L. G., and D. D. Pollard (1988), Surface deformation and shallowdike intrusion processes at Inyo craters, Long Valley, California, J. Geo-phys. Res., 93, 13,221–13,235, doi:10.1029/JB093iB11p13221.
McLeod, P., and S. Tait (1999), The growth of dykes from magma cham-bers, J. Volcanol. Geotherm. Res., 92, 231–245, doi:10.1016/S0377-0273(99)00053-0.
Mériaux, C., and C. Jaupart (1995), Simple fluid dynamic models of volca-nic rift zones, Earth Planet. Sci. Lett., 136, 223–240, doi:10.1016/0012-821X(95)00170-H.
Nooner, S. L., L. Bennati, E. Calais, W. R. Buck, I. J. Hamling, T. J.Wright, and E. Lewi (2009), Post‐rifting relaxation in the Afar region,Ethiopia, Geophys. Res. Lett., 36, L21308, doi:10.1029/2009GL040502.
Okada, Y. (1985), Surface deformation due to shear and tensile faults in ahalf space, Bull. Seismol. Soc. Am., 75(4), 1135–1154.
Okada, Y. (1992), Internal deformation due to shear and tensile faults in ahalf‐space, Bull. Seismol. Soc. Am., 82(2), 1018–1040.
Pollard, D. D., and P. Segall (1987), Theoretical displacements and stressesnear fractures in rock: with applications to faults, joints, veins, dikes, andsolution surfaces, in Fracture Mechanics of Rock, edited by B. K. Atkin-son, pp. 277–349, Academic, London.
Pollard, D. D., P. T. Delaney, W. A. Duffield, E. T. Endo, and A. T.Okamura (1983), Surface deformation in volcanic rift zones, Tectono-physics, 94(1–4), 541–584, doi:10.1016/0040-1951(83)90034-3.
Rivalta, E. (2010), Evidence that coupling to magma chambers controls thevolume history and velocity of laterally propagating intrusions, J. Geo-phys. Res., 115, B07203, doi:10.1029/2009JB006922.
Romanowicz, B., and L. J. Ruff (2002), On moment‐length scaling of largestrike slip earthquakes and the strength of faults, Geophys. Res. Lett.,29(12), 1604, doi:10.1029/2001GL014479.
Rosen, P. A., S. Henley, G. Peltzer, and M. Simons (2004), Updated repeatorbit interferometry package released, Eos Trans. AGU, 85(5), 47,doi:10.1029/2004EO050004.
Rowland, J. V., E. Baker, C. J. Ebinger, D. Keir, T. Kidane, J. Biggs,N. Hayward, and T. J. Wright (2007), Fault growth at a nascent slow‐spreading ridge: 2005 Dabbahu rifting episode, Afar, Geophys. J. Int.,171(3), 1226–1246, doi:10.1111/j.1365-246X.2007.03584.x.
Rubin, A. M. (1990), A comparison of rift‐zone tectonics in Iceland andHawaii, Bull. Volcanol., 52, 302–319, doi:10.1007/BF00304101.
Rubin, A. M. (1992), Dike‐induced faulting and graben subsidence in vol-canic rift zones, J. Geophys. Res., 97(B2), 1839–1858, doi:10.1029/91JB02170.
Rubin, A. M. (1995), Propagation of magma‐filled cracks, Annu. Rev. EarthPlanet. Sci., 23, 287–336, doi:10.1146/annurev.ea.23.050195.001443.
Rubin, A. M., and D. D. Pollard (1987), Origins of blade‐like dikes in vol-canic rift zones, U.S. Geol. Surv. Prof. Pap., 1350, 1449–1470.
Sæmundsson, K. (1979), Outline of the geology of Iceland, Joekull, 29,7–28.
Schmidt, D. A., and R. Bürgmann (2003), Time‐dependent land uplift andsubsidence in the Santa Clara valley, California, from a large interfero-metric synthetic aperture radar data set, J. Geophys. Res., 108(B9),2416, doi:10.1029/2002JB002267.
Scholz, C. H. (2002), The Mechanics of Earthquakes and Faulting, 2nd ed.,496 pp., Cambridge Univ. Press, Cambridge, U. K.
Shaw, W. J., and J. Lin (1996), Models of ocean ridge lithospheric defor-mation: Dependence on crustal thickness, spreading rate, and segmenta-tion, J. Geophys. Res., 101, 17,977–17,993, doi:10.1029/96JB00949.
GRANDIN ET AL.: SEQUENCE OF RIFTING IN AFAR IN 2005–2009 B10413B10413
17 of 18

Simons,M., and P. A. Rosen (2007), Interferometric synthetic aperture radar,in Treatise on Geophysics, vol. 3, edited by G. Schubert, pp. 391–446,doi:10.1016/B978-044452748-6.00059-6, Elsevier, Amsterdam.
Smith, D. K., and J. R. Cann (1999), Constructing the upper crust of theMid‐Atlantic Ridge: A reinterpretation based on the Puna Ridge, KilaueaVolcano, J. Geophys. Res., 104, 25,379–25,399, doi:10.1029/1999JB900177.
Stein, R. S., P. Briole, J.‐C. Ruegg, P. Tapponnier, and F. Gasse (1991),Contemporary, holocene, and quaternary deformation of the Asal rift,Djibouti: Implications for the mechanics of slow spreading ridges, J.Geophys. Res., 96, 21,789–21,806, doi:10.1029/91JB02118.
Takada, A. (1989), Magma transport and reservoir formation by a system ofpropagating cracks, Bull. Volcanol., 52(2), 118–126, doi:10.1007/BF00301551.
Tarantola, A., and B. Valette (1982), Generalized nonlinear inverse problemssolved using the least squares criterion, Rev. Geophys., 20, 219–232,doi:10.1029/RG020i002p00219.
Touloukian, Y. S. (1981), Physical Properties of Rocks and Minerals,McGraw‐Hill, New York.
Turcotte, D. L., and G. Shubert (1982), Geodynamics: Applications ofContinuum Physics to Geological Problems, John Wiley, New York.
Varet, J. (1975), Geological map of Central Afar, Cent. Natl. de la Res.Sci., Paris.
Varet, J., and F. Gasse (1978), Géologie de l’Afar Central et Méridional,Cent. Natl. de la Res. Sci., Paris.
Weertman, J. (1971), Theory of water‐filled crevasses in glaciers applied tovertical magma transport beneath oceanic ridges, J. Geophys. Res., 76(5),1171–1183, doi:10.1029/JB076i005p01171.
Wells, D. L., and K. J. Coppersmith (1994), New empirical relationshipsamong magnitude, rupture length, rupture width, rupture area, and surfacedisplacement, Bull. Seismol. Soc. Am., 84(4), 974–1002.
Wessel, P., and W. H. F. Smith (1991), Free software helps map and dis-play data, Eos Trans. AGU, 72, 441, doi:10.1029/90EO00319.
Wills, S., andW. R. Buck (1997), Stress‐field rotation and rooted detachmentfaults: A Coulomb failure analysis, J. Geophys. Res., 102, 20,503–20,514,doi:10.1029/97JB01512.
Wright, R., L. P. Flynn, H. Garbeil, A. J. L. Harris, and E. Pilger (2004),MODVOLC: Near‐real‐time thermal monitoring of global volcanism,J. Volcanol. Geotherm. Res., 135, 29–49, doi:10.1016/j.jvolgeores.2003.12.008.
Wright, T. J., C. Ebinger, J. Biggs, A. Ayele, G. J. Yirgu, D. Keir,and A. Stork (2006), Magma‐maintained rift segmentation at continentalrupture in the 2005 Afar dyking episode, Nature, 442, 291–294,doi:10.1038/nature04978.
Yirgu, G., A. Ayele, and D. Ayalew (2006), Recent seismovolcanic crisisin northern Afar, Ethiopia, Eos Trans. AGU, 87(33), 325–329,doi:10.1029/2006EO330001.
Yirgu, G., A. Ayele, S. Fisseha, T. Chernet, K. Damtew, and S. Carn(2007), Manda Hararo: First historical eruption lava flows–SO2 plumefrom rift fissure–August 2007, Bull. Global Volcanism Network, 32(7).
Zandbergen, R., P. Righetti, M. Otten, D. Kuijper, and J. Dow (2002),Routine operational and high‐precision orbit determination of Envisat,paper presented at 34th COSPAR Scientific Assembly, COSPAR,Houston, Tex.
J.‐B. de Chabalier, E. Jacques, G. C. P. King, N.Mazzoni, and A. Socquet,Institut de Physique du Globe de Paris, Equipe de Tectonique et Mécaniquede la Lithosphère, CNRS UMR 7154, 4 place Jussieu, F‐75252 ParisCEDEX 05, France. ([email protected]; [email protected];[email protected]; [email protected]; [email protected])R. Grandin, Laboratoire de Géologie, École Normale Supérieure, CNRS
UMR 8538, 24 Rue Lhmond, F‐75231 Paris CEDEX 05, France.([email protected])
GRANDIN ET AL.: SEQUENCE OF RIFTING IN AFAR IN 2005–2009 B10413B10413
18 of 18