Embed Size (px)
Citation preview
1
Rapid and precise control of sniffing during olfactory discrimination in rats
Adam Kepecs, Naoshige Uchida and Zachary F. Mainen
Cold Spring Harbor Laboratory, 1 Bungtown Road, Cold Spring Harbor, NY 11724
Running head: Sniffing patterns during odor discrimination
Contact: Adam Kepecs
Cold Spring Harbor Laboratory
1 Bungtown Road
Cold Spring Harbor, NY 11724
Phone: (516) 367-6929
E-mail: [email protected]
Keywords: respiration, active sensation, olfaction, theta rhythm, reward, whisking
Page 1 of 43 Articles in PresS. J Neurophysiol (April 25, 2007). doi:10.1152/jn.00071.2007
Copyright © 2007 by the American Physiological Society.

2
Abstract
Olfactory perception relies on an active sampling process, sniffing, to rapidly deliver odorants
from the environment to the olfactory receptors. The respiration cycle strongly patterns the flow
of information into the olfactory systems, but the behavioral significance of particular sniffing
patterns is not well understood. Here, we monitored the frequency and timing of nasal respiration
in rats performing an odor mixture discrimination task that allowed us to test subjects near
psychophysical limits and to quantify the precise timing of their behavior. We found that
respiration frequencies varied widely from 2-12 Hz, but odor discrimination was dependent on 6-
9 Hz sniffing: rats almost always entered and maintained this frequency band during odor
sampling and their accuracy on difficult discrimination dropped when they did not. Moreover,
the switch from baseline respiration to sniffing occurred not in response to odor delivery but in
anticipation of odor sampling and was executed rapidly, almost always within a single cycle.
Interestingly, rats also switched from respiration to rapid sniffing in anticipation of reward
delivery, but in a distinct frequency band, 9-12 Hz. These results demonstrate the speed and
precision of control over respiration and its significance for acquisition of olfactory information.
Page 2 of 43

3
Introduction
Sensory function depends on a combination of feed-forward flow of information from sensory
organs to the brain and the ensuing readjustment of sense organs by feedback from the brain. A
familiar example of this process is the movements we make with our eyes in order to gather
information about the relevant parts of the visual environment, an active process that is integral
to vision (Land 2006). In olfaction the active sampling process is sniffing, rapid, repeated bouts
of nasal inhalation that generate airflow to convey volatile chemicals from the environment to
the olfactory epithelium (Mainland and Sobel 2006). While understanding how olfactory motor
processes dynamically control sensory acquisition is likely to be important to understand
olfactory sensory processing, relatively little is known about the nature of this control and its
functional significance. Of particular interest is how organisms that rely heavily on the sense of
smell for gathering information about the world actively adjust sniffing to alter the flow of
olfactory information.
Respiration is proximally controlled by central pattern generator (CPG) nuclei in the
brainstem (Feldman and Ellenberger 1988; Mellen et al. 2003; Onimaru and Homma 2003 )
which integrate a variety of descending inputs from cortical and subcortical structures (Gaytan
and Pasaro 1998). Studies in anesthetized animals and in vitro preparations have shown that
respiratory patterns can be finely controlled by afferent input (Arata et al. 2000; Morris et al.
2003). Behaviorally, it is also known that sniffing patterns are subject to “bottom-up” regulation
by olfactory stimuli (Laing 1983; Sobel et al. 2000; Warren et al. 1994). For instance, a reflex-
like process equalizes sniff volume using a subcortical feed-back loop in humans (Johnson et al.
2003). Similarly, the frequency and depth of sniffing depends on odor concentration in rats
(Youngentob et al. 1987). Much less is known about cognitive control over respiratory centers.
Page 3 of 43
4
In other forms of active sensing, like vision, it is well established that the timing and pattern of
eye movements are controlled not only by the visual features of a scene, but also through
cognitive processes (Land 2006). For instance, anticipatory visual saccades are able to predict
the location of action-relevant information 0.2s in advance (McLeod 1987; Ripoll et al. 1987).
Whether cognitive processes are exert temporally precise and active control over sniffing in
rodents, as for saccades in primate vision, is not known. However, decerebrate rats do not sniff
and environmental exploration and novel stimuli can initiate sniffing independent of olfactory
stimuli (Welker 1964).
While sniffing clearly subserves olfaction and strongly patterns olfactory processing,
under natural conditions it is usually a component of a coordinated rhythmic movement sequence
involving whisker and head movements. Moreover, sniffing can be elicited by reward
anticipation in absence of odors or environmental novelty (Bindra and Campbell 1967; Clarke
1971) as well as by electrical stimulation of brain areas involved in reward processing (Ikemoto
and Panksepp 1994). These observations suggest a broader context in which control over sniffing
patterns may be relevant for coordinating olfactory processing with other senses and part of an
anticipatory brain state.
Two of the principal axes of control over sniffing are the regulation of timing and
frequency, and we hypothesized that both variables may be under cognitive control in the rat. A
single sniff is sufficient to perform elementary olfactory discriminations for both humans (Laing
1983) and rats (Rajan et al. 2006; Uchida and Mainen 2003), but it has not been established how
rapidly or precisely an animal can time a sniff in relation to task demands. For rats the frequency
of sniffing is typically in the “theta” frequency range (4–12 Hz) during olfactory discrimination
(Rajan et al. 2006; Uchida and Mainen 2003; Youngentob et al. 1987) or exploration (Welker
Page 4 of 43

5
1964), but how accurately sniffing frequency can be regulated and whether olfactory
performance depends on the exact sniffing frequency is not known. Respiratory airflow and
several other characteristics of sniffing covary with its frequency (Walker et al. 1997;
Youngentob et al. 1987), so high frequencies could enhance olfactory transduction (Hahn et al.
1993; Kimbell et al. 1997). Alternatively, particular sniffing frequencies within the theta (4-
12Hz) range may be favorable for the coordination of olfactory processing with other brain
regions (Kay 2005; Kepecs et al. 2006; Komisaruk 1977).
In this study we sought to address two main questions: First, how is sniffing regulated on
a fine temporal scale during olfactory discrimination? Second, how does olfactory performance
depend on rhythmic sniffing? To answer these questions we quantitatively characterized sniffing
patterns and their behavioral regulation during olfactory discrimination behavior in rats. .
Page 5 of 43

6
Materials and Methods
All procedures involving animals were carried out in accordance with National Institutes of
Health standards as approved by the Cold Spring Harbor Laboratory Institutional Animal Care
and Use Committee. All statistics reported are mean ± SD across the 6 rats examined unless
otherwise noted.
Measurement of respiration
Rats were implanted with a temperature sensor (0.005” Teflon-coated thermocouple, Omega,
part # 5TC-TT-K-36-36) in one nostril through a hole made in the dorsal skull and secured with
dental cement. Thermocouples were inserted into the nasal passage through the nasal bone just
rostral to the turbinates. Thermocouples measure the cooling and warming of air due to breathing
(Angyan and Szirmai 1967; Clarke et al. 1970). While junction potentials and positioning
differences make it difficult to interpret the absolute voltage recorded, the timing of inhalations
and exhalations can be readily determined from the cooling-warming patterns. Sniffing signals
were amplified, filtered between 0.1-475Hz and digitized at 1000Hz.
To establish the fidelity of these timing measurements, in pilot experiments we used a
complementary method, a chest plethysmograph (Barrie et al. 1996) to measure respiration. This
device is a piezoelectric belt wrapped around the rat’s body to measure chest expansions in order
to indicate inhalations and exhalations. Figure 1 shows that the thermocouple and chest
plethysmograph signals can agree on a cycle by cycle basis with small (<25ms) differences in
time lags confirming the temporal precision of the thermocouple signal. A comparison of the
thermocouple and plethysmograph signals also reveals that when respiration is slow the
expiration phase is passive. In this range temperature measurements can only provide
information about the timing of the inspiration and cannot distinguish passive from active
Page 6 of 43

7
expiration. However, sometimes the thermocouple and the plethysmograph showed transiently
dissimilar signals (see Figure 1A). These differences could have been due to either movement-
related artifacts or potentially physiological factors. The thermocouple method was preferred due
to its day to day stability and its more direct association with olfactory processing (Figure 2A).
We tested the variability in the timing of the thermocouple signal due to its placement using
paired recordings from both nostrils. These experiments revealed very good correspondence
between nostrils on a cycle-by-cycle basis with small (<25 ms) latency differences (Figure 1C).
Odor discrimination task
Behavioral training and testing were conducted as described previously in Uchida and Mainen
(2003). The behavioral box contains a panel of three ports; a central port for odor delivery (“odor
port”), and two ports on each side (“goal ports”) for water delivery (Figure 3A). Entry and exit
from the ports is detected based on infrared photo beams located inside each port. Odors are
mixed with pure air to produce a 1:20 dilution at a flow rate of 1 L/min using a custom-built
olfactometer. The behavioral session is controlled by custom software written in Matlab
(Mathworks) using computer data acquisition hardware (National Instruments) to record the port
signals and control the valves of the olfactometer and water-delivery.
Male Long-Evans hooded rats were trained to perform olfactory discrimination for water
reward. Animals were maintained on a reverse 12 hr light/dark cycle and tested during their dark
period. They were allowed free access to food but were restricted to water available during the
behavioral session and for 30 minutes after the session.
Rats initiated trials by entering the odor port in the center, which triggered the delivery of
an odor with a random delay. Odor delivery delays followed a uniform random distribution of
0.1-0.2 s for 3 rats, and 0.2-0.5 s for the other 3 rats. Odor was turned off when rats exited the
Page 7 of 43
8
odor port or after a maximum sampling period of 1 second. Water reward was available for
correct choices for up to 2 s after rats left the odor sampling port. Rats were trained until a
performance of 90% correct trials was achieved. Binary odor mixtures of caproic acid and 1-
hexanol (1/10 dilution in mineral oil) were used. For 3 rats eight ratios (100/0, 80/20, 68/32,
56/44, 44/56, 32/68, 20/80 and 0/100; caproic acid/1-hexanol), for another 3 rats four or six
ratios were used (80/20, 68/32, and sometimes 56/44, etc.). Stimuli were delivered in
pseudorandom order within each session.
Analysis methods
The sniffing signals were digitally filtered off-line (0.5-60 Hz) and the timings of inhalation and
exhalation onsets were determined as the local maxima (exhalation onset) and minima
(inhalation onset) of the temperature signal. The determination of inhalation timing was first
done using an automated peak/trough detection algorithm, which was confirmed and adjusted
manually when necessary. This preprocessed signal then served as the basis for our analysis. The
data set consisted of 12018 completed trials with good thermocouple signal recorded from 6 rats
(range:694-3798 trials / animal).
In principle we could have used spectral analysis to calculate the frequency of the signal
(see Figure 1B). But since the respiration signal is strongly non-sinusoidal with often unequal
durations of exhalation and inhalation spectral decomposition would show additional frequency
components that would have to be disambiguated from the carrier frequency, which is our main
interest. In addition because of the rapidly changing nature of the signal it was preferable to
analyze the signal in the time domain. Therefore to characterize respiration frequency we first
determined the instantaneous frequency defined as the inverse of the cycle duration (beginning at
inhalation onset) for the entire duration of each cycle.
Page 8 of 43

9
To measure how distinguishable are the frequencies of different sniffing modes, we used
receiver-operating characteristic (ROC) analysis. The discriminability index is defined as the
area under the ROC curve: dffsPfsPD rewardodor )()( <== ∫∞
∞−
; where odors and rewards refer to
sniffing frequency during odor-sampling and pre-reward periods respectively.
We also assessed whether the increase in respiration frequency is the result of a single
step change reflecting a binary process using a trial-by-trial analysis of frequency change. If the
increase in sniffing frequency constitutes a step change in each trial, then the largest change in
sniff cycle duration should also account for the total change in frequency. The total change in
frequency was defined to be the difference between a baseline (-1000 – -300 ms) to odor-
sampling (0 – 300 ms) frequencies. The largest jump in frequency explained the total change in
73 ± 4% of trials (and accounted for 85 ± 1% of the change in the rest of trials), and it explained
90% of the total change in 89 ± 2% of trials (and accounted for 87 ± 0.5% in the rest of trials;
mean ± SEM across rats). Note that because sniff durations vary even within modes (mean cycle-
by-cycle change: 0.47 ± 0.2 Hz) reaching the high-frequency sniff mode may require more or
less change than total change defined above.
Page 9 of 43

10
Results
Rats were implanted with a thermocouple in one nostril (Figure 2A) to measure the temperature
changes between inspired and expired air (Uchida and Mainen 2003). Although nasal
temperature cannot provide an exact measurement of respiratory volume or flow rate, it does
provide a precise indication about the time of onset of inhalation on a cycle-by-cycle basis
(Figure 2B). While respiration under anesthesia was slow and regular (Figure 2C), awake
animals exhibited rapid and complex respiratory patterns (Figure 2D). To analyze sniffing
patterns, we first determined the timing and duration of each respiration cycle using a semi-
automatic detection algorithm (see Methods; Fig. 2B). During behavior a broad spectrum of
respiration frequencies was observed ranging from below 2Hz to above 12Hz (Figure 2E).
Sniffing in rats is usually defined as rapid, rhythmic respiration (Clarke et al. 1970; Welker
1964; Youngentob et al. 1987). Because rats, unlike humans, always breathe nasally, some of the
observed frequencies presumably correspond to basal respiration while others correspond to
“sniffing” per se. We will refer to all higher (>5Hz) frequencies as sniffing from here on.
To understand how respiration is regulated during behavior we trained rats (n=6) to
perform an olfactory discrimination task (Uchida and Mainen 2003). In this task rats initiate
trials with a nose poke into a conical odor-port. Upon entry a computer-controlled olfactometer
directs the odor flow into the port (Figure 3A). A binary odor mixture is delivered, and the odor
with the higher concentration instructs the response to the left or right goal ports where correct
decisions are rewarded with water (Figure 3B). Rats achieved high performance (>90%) for easy
stimuli (80/20 and 100/0 odor mixtures) in this task, but were challenged by more difficult
discriminations (Figure 3C) as previously reported (Uchida and Mainen 2003).
Page 10 of 43

11
As rats entered the odor-sampling port they increased their sniffing rate. This change in
sniffing pattern can be seen in a raster representation of inhalation durations in Figure 4A. For
each trial the sequence of inhalation periods are marked with a gray bar and aligned to the time
of entry into the odor port. For further analysis we determined the instantaneous frequency of
respiration for each sniff cycle. On average the rate of respiration systematically increased before
rats entered the odor-sampling port (Figure 4B). However, this mean frequency was not
representative of individual trials, where respiration appeared to be restricted into distinct
frequency bands: a low frequency (2–4 Hz) mode before entry and a high frequency (6–9 Hz)
mode during odor sampling. This can be seen by examining the distribution of sniffing
frequencies at different time points relative to odor port entry (Figure 4C). The distribution of
respiration frequencies from 150 ms prior until the time of entry into the odor port was bimodal
in all rats (P < 0.01, Hartigan’s dip statistic). Figure 4D illustrates the full temporal evolution of
respiration frequency aligned to odor port entry. This spectral representation reveals two separate
respiration modes. During the odor sampling period all rats displayed high-frequency respiration
or sniffing at 7.5 ± 0.4 Hz. Rats spent an average of 3 sniffs (range: 1-8) at the odor sampling
port. Because of the delay in the odor onset, on average 2 full sniffs (range: 0–6) were actually
spent sampling odors.
Sniffing frequency changes could reflect the shortening of the duration of inhalations,
exhalations or both. Therefore we separately analyzed changes in inhalation and exhalation sub-
cycles. For every time point in each trial we assigned the instantaneous inhalation and exhalation
durations separately; during inhalation no exhalation durations were assigned and vice versa. By
averaging this representation across trials, we could examine variations in inhalation and
exhalation periods at a high temporal resolution. As Figure 5 shows, the median duration of
Page 11 of 43
12
inhalations changed little while exhalation periods shortened substantially. Consequently the
inhalation-exhalation cycle became more symmetric during the odor-sampling period. While the
overall increase in sniffing frequency was mostly due to the truncation of exhalation periods or
equivalently the rate at which inhalations occurred, this was accompanied by a small but
significant decrease in the mean inhalation duration as well (P < 0.01, Two-sample Kolmogorov-
Smirnov test between -0.5 to -0.4 s and 0.1 to 0.2 s aligned to odor port entry).
Inspection of the time-frequency histogram of sniffing in Figure 4D suggests that rats
switch between modes rapidly, perhaps in a single respiratory cycle. To quantify this suggestion,
we turned to a trial-by-trial analysis. For each trial we found the sniff cycle where the largest
increase in frequency occurred from 1 second before entry into the odor port until leaving it. The
mean size of the largest jump was 4.2 ± 0.3 Hz. This was significantly different from the average
change in sniffing frequency from cycle to cycle (0.47 ± 0.2 Hz, excluding the largest one) as
well as from the second largest jump (1.5 ± 1.2 Hz) in each trial. Therefore we were able to
assign for each trial a time point at which the frequency jump presumably occurred. Figure 6A
shows a sniffing raster with trials sorted according to the presumed time of mode switch.
Aligning each trial to the largest jump in sniff frequency showed that sniffing frequency did not
increase before or after this jump on average (Figure 6B, C). The mean frequencies before and
after the switch correspond to the sniffing modes evident in Figure 4D.
The timing of the jump from low frequency respiration to the faster odor sampling mode
varied from trial to trial. The likelihood of a sniffing mode switch began to increase as early as
500 ms prior to the odor-port entry and peaked around 150–50 ms before (Figure 6D, E). If the
anticipatory increase in mean sniffing frequency (Figure 4B) is the result of rapid yet temporally
variable switches between sniffing modes on individual trials then the distribution of switch
Page 12 of 43
13
times (Figure 6D, E) should account for the shape of frequency increase. Indeed, the mean time-
course of the sniffing frequency change matched well the distribution of switch timings.
Moreover, the size of the putative jumps accounts for the total change in frequency in the
majority of trials (see Methods). Taken together, the results of the trial-by-trial analysis confirm
that the timing of sniffing frequency change is somewhat variable but occurs abruptly in
individual trials and demonstrates that switches between sniffing modes can take place in a
single respiration cycle.
Such rapid and stereotyped control of sniffing pattern raises the question whether
behavioral performance actually depends on sniffing frequency. While in most trials rats sniffed
within the 6–9 Hz mode, there was some variation. This allowed us to calculate the choice
accuracy for each rat as a function of the sniffing frequency during odor sampling. Odor-mixture
stimuli were classified as easy (100/0 and 80/20 ratio mixtures; 94% accuracy) or difficult (68/32
and 56/44 mixtures; 72% accuracy). Because there was variation in absolute frequencies,
accuracy was calculated as function of the normalized frequency for each rat. Figure 7A shows
that choice accuracy slightly improved with increasing sniffing frequency during odor sampling.
Whether the effects of frequency on performance are statistically significant were examined in
two ways: across trials in individual animals and across means at the population level. The
impact of sniffing frequency on accuracy was significant for easy (but not difficult)
discriminations in 3 of 6 rats (P < 0.05, Kruskal Wallis non-parametric analysis of variance
across trials) but this trend was not significant at the population level (P > 0.5, Kruskal Wallis
test across rats). Perhaps it is not the mean odor sampling frequency but only the last sniff before
responding that is important for discrimination performance. Indeed, discrimination accuracy
increased more substantially with instantaneous frequency when only final sniffs were
Page 13 of 43

14
considered (Figure 7B; P < 0.05, Kruskal Wallis test across trials in 2 rats for easy and 3 rats for
difficult mixtures and at the population level P < 0.05, Kruskal Wallis test across means for both
easy and difficult mixtures).
What could account for the correlation between sniffing frequency on performance? It is
possible that frequency influences the process of odorant capture and therefore accuracy should
depend even more strongly on inhalation duration. Indeed, when only the last inhalation period
was considered accuracy decreased as the inhalation duration increased (Figure 7C; P < 0.05,
Kruskal Wallis test across trials 1/6 rats for all stimuli and P < 0.05, Kruskal Wallis test across
means for difficult stimuli). At face value it seems surprising that performance drops when there
is more time available for odorants to reach the olfactory epithelium and olfactory processing.
Perhaps inhalation duration is a correlate of a more relevant variable such as flow rate (Walker et
al. 1997) and shorter inhalations influence performance indirectly through higher flow rates. On
the other hand, performance showed a stronger dependence on the final sniff duration (i.e.
instantaneous frequency, Figure 7B) than on the final inhalation duration alone (P < 0.05,
Friedman's test, 6/6 rats).
After odor sampling, rats tended to exhibit one long exhalation during their movement to
the goal ports (Figure 8A, B). However, respiration did not remain at low-frequency breathing
rates but instead switched to a high frequency pattern before reaching the port. Similar to the
change in sniffing pattern in anticipation of odor-sampling described above, we analyzed this
phenomenon in relation to the time of entry into the goal port. Figure 8C shows that respiration
frequency was higher on average at the goal port than at the odor port. After odor-sampling there
was a low frequency (2–4 Hz) mode corresponding to a sniff with a very long exhalation phase
followed by a higher (9–12 Hz) mode around the time of entry into the goal port (Figure 8D).
Page 14 of 43

15
Respiration frequency distributions were bimodal between 100 and 200 ms before entry into the
goal port for each rat (P < 0.01, Hartigan’s dip statistic). The abrupt switch into this high
frequency mode can be seen in the spectral representation of sniffing (Figure 8E). The mean
frequency of this sniffing mode was 10 ± 0.5 Hz. Note, that while this pre-reward sniffing mode
is at a higher frequency than sniffing during odor-sampling, the amplitude of the thermocouple
signal is smaller (Fig 8A), suggesting lower airflow rates (Walker et al. 1997). This anticipatory
sniffing mode was not associated with licking by visual inspection. Shortly after goal port entry,
respiration frequency dropped again and was in the breathing range (2–4 Hz) while rats were
licking rhythmically around 10 Hz (data not shown).
Both high frequency (>5 Hz) respiration patterns described above (Figure 4 and 8) may
be considered “sniffing” if defined as rapid breathing or polypnea (Welker 1964). However,
sniffing during the pre-reward period had a systematically higher frequency compared to odor-
sampling (difference of 2.1 ± 1 Hz). Even though these distributions overlap, on a trial by trial
basis the frequency of sniffing during these two periods was mostly distinct (Figure 9B, C). To
quantify this, we calculated the discriminability index, which measures how well an optimal
observer could distinguish trial-by-trial the two sniffing modes based on their frequency. This
analysis confirmed that sniffing modes are distinguishable with high accuracy (D = 0.86 ± 0.09,
mean ± SEM). In addition, the frequencies of these different sniffing epochs were generally
uncorrelated within trials (r = 0.08 and 0.10 at P < 0.01 for 2/6 rats, and P > 0.1 for 4/6 rats).
Page 15 of 43

16
Discussion
Olfactory processing in mammals begins with the act of inhalation: a sniff. The central
importance of sniffing to olfaction may be compared to the integral role of eye movements in
vision. As a first step towards understanding the behavioral control of sniffing, we examined
sniffing patterns in rats performing an olfactory discrimination task (Uchida and Mainen 2003).
The well-controlled and stereotyped nature of behavior in our task allowed us to relate sniffing
patterns precisely to behavioral timing and performance. We obtained three principal results.
First, we found two distinct high frequency respiration modes, one for odor sampling and one
associated with reward anticipation, which we term type I and type II sniffing. Second, we
established that switches between modes occur in a single respiratory cycle. Third, we
determined that behavioral performance is degraded when rats do not enter type I sniffing during
odor sampling.
Multiple sniffing modes
Respiration frequency does not vary continuously but rather has different preferred frequency
bands. Before odor-sampling, respiration frequency was around 2–4Hz, and shortly before entry
into the odor port rats switched to a theta frequency mode (6–9 Hz) and remained in this
frequency mode throughout odor presentation. After exiting the odor-port, a long exhalation
followed during the movement to the goal ports. Immediately before reaching the goal ports rats
switched to an even higher frequency (9–12 Hz), sniffing mode.
Rats are obligate nose-breathers and therefore not every act of respiration should be
considered sniffing per se, although it is also clear that even low-frequency respiration is
adequate for smelling. Traditionally, sniffing has been defined as a rapid and shallow breathing
Page 16 of 43
17
or polypnea (Clarke et al. 1970; Welker 1964; Youngentob et al. 1987). Here we found that this
general description can be further refined by considering its precise respiration frequency and the
behavioral epoch in which sniffing occurs. During odor-sampling we observed a relatively
separate frequency band ranging from 6 to 9 Hz, which we term type-I sniffing. In our task, this
mode occurred almost without fail during odor sampling and therefore it is most likely related to
the acquisition of olfactory information. Importantly, this sniffing mode was not triggered by the
odor stimulus, but by the animals’ anticipation of entry into the odor sampling port.
More curiously, there is a second, higher frequency (9–12 Hz) respiration mode, type-II
sniffing, which occurred during the pre-reward period, commencing prior to entry into a goal
port. Because water was delivered after entry into the goal ports for all correct discriminations
(with the valve clicks providing the earliest and most prominent cue) there is no apparent
functional role for olfaction during this second sniffing mode. Also, the amplitude changes in the
thermocouple signal were smaller than during type-I sniffing, indicating lower nasal flow rates
(Walker et al. 1997). If this type of sniffing does not directly serve odor acquisition, what
behavioral function could it be related to? Several lines of evidence suggest that sniffing is
associated with reward anticipation. First, in classical conditioning as rats learn to predict reward
based on a sensory cue, sniffing becomes part of the conditioned response (Bindra and Campbell
1967; Freeman et al. 1983). Similarly, in fixed-ratio conditioning for sucrose or brain-stimulation
reward, sniffing rates increase in anticipation of reward delivery (Clarke 1971; Waranch and
Terman 1975). Finally, brain regions whose activation is intrinsically rewarding, such as the
lateral hypothalamus (Olds and Milner 1954), when electrically stimulated elicit exploratory
behaviors as well as high-frequency sniffing (Ikemoto and Panksepp 1994). Thus sniffing
appears to be a correlate of an anticipatory behavioral state in rats. The odor-discrimination task
Page 17 of 43

18
allowed us to separate odor sampling and reward anticipation periods, revealing that the reward
anticipatory sniffing mode (type II) covers a largely distinct and higher frequency range
compared to the odor sampling mode (type I; Figure 9). The behavioral stereotypy in the task
that allowed us to make these observations may have also contributed to the low variability in
sniffing frequencies. However, the two different frequency bands during different epochs cannot
be solely due to stereotypy and were not predicted by previous observations. On the other hand,
the distinct behavioral and neural demands of other olfactory behaviors may reveal additional
sniffing modes.
The properties of the reward anticipatory sniffing mode call into question whether it can
be properly termed sniffing, if sniffing is defined as nasal inhalation for the purpose of smelling.
Since all respiration in rats occurs nasally, one possibility is that this respiration mode is related
to hyperventilation in humans, a behavior which is linked to certain emotional states. On the
other hand, the non-functional nature of this sniffing mode may be a reflection of the artificial
spatial separation of exploration from appetitive reward in our task. For instance, during foraging
for food, the anticipation of an impending discovery might bring about this higher frequency
sniffing mode. More rapid sampling in turn would enhance the spatial resolution of olfactory
perception and improve the ability of the animal to tag particular odors to specific spatial
locations in the neighborhood of the food source. More ethological studies will be required to
resolve these issues.
Rapid switching between sniffing modes
Changes between different respiration modes occurred very rapidly. Trial-by-trial examination
showed that rats usually increased respiration frequency from basal breathing (2–4 Hz) to type-I
Page 18 of 43
19
sniffing frequencies (6–9 Hz) in a single cycle. The timing of the switch was variable across
trials, but occurred in anticipation of odor-port entry and odor delivery rather than as a reaction
to olfactory stimuli. This result implies that forebrain control of brainstem respiratory CPGs is
rapid and precise during behavior, similar to the peripheral control of respiration (Feldman et al.
2003). One possibility is that there are different CPGs underlying these distinct sniffing modes,
which may constitute discrete networks that are either within the same region or in different
brain regions (Feldman and Del Negro 2006; Janczewski and Feldman 2006; Onimaru and
Homma 2003) Alternatively, it may be that the same pre-Bötzinger complex that is responsible
for normal breathing can be rapidly reconfigured to generate multiple motor patterns (Arata et al.
2000; Lieske et al. 2000), perhaps via neuromodulation (Marder and Calabrese 1996). Either
way, afferent feedback from higher brain areas to the respiratory center must be able to transform
network output quite rapidly, within a single respiration cycle and do so in anticipatory manner.
Relation to rhythmic whisking and hippocampal oscillations
The rapid and precise control of sniffing frequency observed here may be relevant for
understanding other active senses, and in particular the rhythmic control of facial whiskers in
rodents. Whisking subserves tactile sensory acquisition and is also characterized by rhythmic
motion in the “theta” frequency range (Berg and Kleinfeld 2003; Carvell and Simons 1995;
Knutsen et al. 2005), At present, the significance of particular whisking frequency modes is not
well understood (Ahissar et al. 2000; Harvey et al. 2001; O'Connor et al. 2002), but since the
sniffing and whisking rhythms can couple during exploratory behaviors (Welker 1964); our
unpublished data), the distinct sniffing modes observed here raise the possibility of
corresponding whisking modes.
Page 19 of 43
20
The observation of different frequency modes within the theta range (4–12 Hz) has
interesting precedents in the hippocampus. Theta oscillations in the hippocampus are subdivided
into type-1 or type-2 based on frequency (6–12 and 4–6 Hz respectively) and pharmacological
profile (Buzsaki 2002). Both sniffing modes we observed fall within the range of type-1
hippocampal theta and therefore it will be interesting to examine whether both modes could
couple to hippocampal oscillations, as previously reported for sniffing during odor-sampling
(Macrides et al. 1982).
Behavioral correlates of sniffing frequency
The task used allowed us to rigorously test for the first time the possibility that performance
during olfactory mixture discrimination is correlated with sniffing patterns. We took advantage
of the fact that the odor mixture discrimination task challenged the animals’ abilities; rats
performed at about 60% for the most difficult stimuli. Previous research has shown that a single
sniff is sufficient for maximal performance in this task and taking multiple sniffs does not
improve the accuracy of rats (Rajan et al. 2006; Uchida and Mainen 2003). Here we found a
significant effect of sniffing frequency on performance, with accuracy increasing at higher
sniffing frequencies. This effect was primarily due to a minority of trials with frequencies below
the 6–9 Hz range and ,there was little effect within the 6-9 Hz range (Figure 7). Therefore the
impact of sniffing frequency on behavioral performance mostly depended on whether rats
switched from respiration to type-I sniffing, within the theta frequency range, and not on the
precise frequency itself. The correlation between performance and sniffing frequency was
somewhat larger when only the last sniff was considered. Therefore the behavioral impact of
frequency, or in this case inverse sniff duration, cannot be due to changes in the number of sniffs
Page 20 of 43

21
taken. Furthermore, this finding indicates that the last sniff contributes disproportionately to the
decision made by rats, which may be relevant for understanding why taking multiple sniffs does
not improve the performance of rats in our task (Rajan et al. 2006; Uchida and Mainen 2003).
Two types of factors, physical and neural, could contribute to correlations between sniff
frequency and performance. Physical factors center on the possible effects of frequency on the
process of odorant capture. Because odor concentrations in this study were well above threshold
(around 0.1–5% of saturated vapor at 1 L/min flow rate), it is not clear why odorant capture
would be a limiting step for discrimination. While relatively little is known about how sniffing
parameters affect odorant capture, simulations of fluid flow suggest that higher inspiratory flow
rates direct more air toward the olfactory portion of the nasal cavity (Kimbell et al. 1997; Wilson
and Sullivan 1999). Our technique could not measure flow rates directly, but it has been shown
previously that frequency and flow rate are correlated (Walker et al. 1997). Indeed, performance
was better for shorter inhalation durations. However, performance was actually better correlated
with the duration of the full respiration cycle than with the inhalation period alone, suggesting a
process unrelated to odorant capture.
We consider it likely that sniffing frequency and performance are not causally connected
but are both correlated with a third variable such as the level of attention or engagement. A
related idea is that higher sniffing frequencies or frequencies within a particular mode facilitate
neural processing. The intrinsic time constants of neural circuits involved in the processing of
odor signals in the olfactory bulb and piriform cortex may be tuned to 6–9 Hz or theta band
signals (Buonviso et al. 2006). In addition, theta oscillations occur not only in olfactory areas but
also in the hippocampus, amygdala, striatum and neocortex and under some behavioral
conditions sniffing can synchronize with oscillations in different brain areas (Fontanini and
Page 21 of 43

22
Bower 2006; Kay 2005; Macrides et al. 1982). Coordination of these oscillations or phase
coupling of neuronal populations at preferred frequencies is a mechanism that has been proposed
to facilitate sensorimotor integration (Hyman et al. 2005; Kay 2005; Kepecs et al. 2006;
Komisaruk 1977; Siapas et al. 2005). Therefore degraded performance at lower respiration
frequencies might result from the failure of sniffing to couple properly to central frequencies.
Page 22 of 43

23
Acknowledgements
This work was supported by grants from the National Institute on Deafness and Other
Communication Disorders (Z.F.M.) and the Swartz foundation (A.K., N.U. and Z.F.M.). We
thank Sachin Ranade for comments on the manuscript.
Page 23 of 43

24
References
Ahissar E, Sosnik R, and Haidarliu S. Transformation from temporal to rate coding in a somatosensory thalamocortical pathway. Nature 406: 302-306, 2000. Angyan L, and Szirmai I. Recording of respiration with thermocouple in freely moving cats. Acta Physiol Acad Sci Hung 31: 73-76, 1967. Arata A, Hernandez YM, Lindsey BG, Morris KF, and Shannon R. Transient configurations of baroresponsive respiratory-related brainstem neuronal assemblies in the cat. J Physiol 525 Pt 2: 509-530, 2000. Barrie JM, Freeman WJ, and Lenhart MD. Spatiotemporal analysis of prepyriform, visual, auditory, and somesthetic surface EEGs in trained rabbits. J Neurophysiol 76: 520-539, 1996. Berg RW, and Kleinfeld D. Rhythmic whisking by rat: retraction as well as protraction of the vibrissae is under active muscular control. J Neurophysiol 89: 104-117, 2003. Bindra D, and Campbell JF. Motivational effects of rewarding intracranial stimulation. Nature 215: 375-376, 1967. Buonviso N, Amat C, and Litaudon P. Respiratory modulation of olfactory neurons in the rodent brain. Chem Senses 31: 145-154, 2006. Buzsaki G. Theta oscillations in the hippocampus. Neuron 33: 325-340, 2002. Carvell GE, and Simons DJ. Task- and subject-related differences in sensorimotor behavior during active touch. Somatosens Mot Res 12: 1-9, 1995. Clarke S. Sniffing and fixed-ratio behavior for sucrose and brain stimulation reward in the rat. Physiol Behav 7: 695-699, 1971. Clarke S, Panksepp J, Trowill J, and Pankseep J. A method of recording sniffing in the free-moving rat. Physiol Behav 5: 125-126, 1970. Feldman JL, and Del Negro CA. Looking for inspiration: new perspectives on respiratory rhythm. Nat Rev Neurosci 7: 232-242, 2006. Feldman JL, and Ellenberger HH. Central coordination of respiratory and cardiovascular control in mammals. Annu Rev Physiol 50: 593-606, 1988. Feldman JL, Mitchell GS, and Nattie EE. Breathing: rhythmicity, plasticity, chemosensitivity. Annu Rev Neurosci 26: 239-266, 2003. Fontanini A, and Bower JM. Slow-waves in the olfactory system: an olfactory perspective on cortical rhythms. Trends Neurosci 29: 429-437, 2006. Freeman WJ, Viana Di Prisco G, Davis GW, and Whitney TM. Conditioning of relative frequency of sniffing by rabbits to odors. J Comp Psychol 97: 12-23, 1983. Gaytan SP, and Pasaro R. Connections of the rostral ventral respiratory neuronal cell group: an anterograde and retrograde tracing study in the rat. Brain Res Bull 47: 625-642, 1998. Hahn I, Scherer PW, and Mozell MM. Velocity profiles measured for airflow through a large-scale model of the human nasal cavity. J Appl Physiol 75: 2273-2287, 1993. Harvey MA, Bermejo R, and Zeigler HP. Discriminative whisking in the head-fixed rat: optoelectronic monitoring during tactile detection and discrimination tasks. Somatosens Mot Res 18: 211-222, 2001.
Page 24 of 43

25
Hyman JM, Zilli EA, Paley AM, and Hasselmo ME. Medial prefrontal cortex cells show dynamic modulation with the hippocampal theta rhythm dependent on behavior. Hippocampus 15: 739-749, 2005. Ikemoto S, and Panksepp J. The relationship between self-stimulation and sniffing in rats: does a common brain system mediate these behaviors? Behav Brain Res 61: 143-162, 1994. Janczewski WA, and Feldman JL. Novel data supporting the two respiratory rhythm oscillator hypothesis. Focus on "respiration-related rhythmic activity in the rostral medulla of newborn rats". J Neurophysiol 96: 1-2, 2006. Johnson BN, Mainland JD, and Sobel N. Rapid olfactory processing implicates subcortical control of an olfactomotor system. J Neurophysiol 90: 1084-1094, 2003. Kay LM. Theta oscillations and sensorimotor performance. Proc Natl Acad Sci U S A 102: 3863-3868, 2005. Kepecs A, Uchida N, and Mainen ZF. The sniff as a unit of olfactory processing. Chem Senses 31: 167-179, 2006. Kimbell JS, Godo MN, Gross EA, Joyner DR, Richardson RB, and Morgan KT. Computer simulation of inspiratory airflow in all regions of the F344 rat nasal passages. Toxicol Appl Pharmacol 145: 388-398, 1997. Knutsen PM, Derdikman D, and Ahissar E. Tracking whisker and head movements in unrestrained behaving rodents. J Neurophysiol 93: 2294-2301, 2005. Komisaruk BR. The role of rhythmical brain activity in sensorimotor integration. In: Progress in Psychobiology and Physiological Psychology, edited by Sprague JM, Epstein, A. N. New York: Academic Press, 1977, p. 55-90. Laing DG. Natural sniffing gives optimum odour perception for humans. Perception 12: 99-117, 1983. Land MF. Eye movements and the control of actions in everyday life. Prog Retin Eye Res 2006. Lieske SP, Thoby-Brisson M, Telgkamp P, and Ramirez JM. Reconfiguration of the neural network controlling multiple breathing patterns: eupnea, sighs and gasps [see comment]. Nat Neurosci 3: 600-607, 2000. Macrides F, Eichenbaum HB, and Forbes WB. Temporal relationship between sniffing and the limbic theta rhythm during odor discrimination reversal learning. J Neurosci 2: 1705-1717, 1982. Mainland J, and Sobel N. The sniff is part of the olfactory percept. Chem Senses 31: 181-196, 2006. Marder E, and Calabrese RL. Principles of rhythmic motor pattern generation. Physiol Rev 76: 687-717, 1996. McLeod P. Visual reaction time and high-speed ball games. Perception 16: 49-59, 1987. Mellen NM, Janczewski WA, Bocchiaro CM, and Feldman JL. Opioid-induced quantal slowing reveals dual networks for respiratory rhythm generation. Neuron 37: 821-826, 2003. Morris KF, Baekey DM, Nuding SC, Dick TE, Shannon R, and Lindsey BG. Invited review: Neural network plasticity in respiratory control. J Appl Physiol 94: 1242-1252, 2003.
Page 25 of 43

26
O'Connor SM, Berg RW, and Kleinfeld D. Coherent electrical activity between vibrissa sensory areas of cerebellum and neocortex is enhanced during free whisking. J Neurophysiol 87: 2137-2148, 2002. Olds J, and Milner P. Positive reinforcement produced by electrical stimulation of septal area and other regions of rat brain. J Comp Physiol Psychol 47: 419-427, 1954. Onimaru H, and Homma I. A novel functional neuron group for respiratory rhythm generation in the ventral medulla. J Neurosci 23: 1478-1486, 2003. Rajan R, Clement JP, and Bhalla US. Rats smell in stereo. Science 311: 666-670, 2006. Ripoll H, Fleurance P, and Cazeneuve D. Analysis of visual patterns of table tennis players. In: Eye movements: from physiology to cognition, edited by Levy-Schoen JKORA. Amsterdam: Elsevier, 1987, p. 616-617. Siapas AG, Lubenov EV, and Wilson MA. Prefrontal phase locking to hippocampal theta oscillations. Neuron 46: 141-151, 2005. Sobel N, Khan RM, Hartley CA, Sullivan EV, and Gabrieli JD. Sniffing longer rather than stronger to maintain olfactory detection threshold. Chem Senses 25: 1-8, 2000. Uchida N, and Mainen ZF. Speed and accuracy of olfactory discrimination in the rat. Nat Neurosci 6: 1224-1229, 2003. Walker JK, Lawson BL, and Jennings DB. Breath timing, volume and drive to breathe in conscious rats: comparative aspects. Respir Physiol 107: 241-250, 1997. Waranch HR, and Terman M. Control of the rat's sniffing behavior by response-independent and dependent schedules of reinforcing brain stimulation. Physiol Behav 15: 365-372, 1975. Warren DW, Walker JC, Drake AF, and Lutz RW. Effects of odorants and irritants on respiratory behavior. Laryngoscope 104: 623-626, 1994. Welker WI. Analysis of sniffing of the albino rat. Behavior 22: 223-244, 1964. Wilson DA, and Sullivan RM. Respiratory airflow pattern at the rat's snout and an hypothesis regarding its role in olfaction. Physiol Behav 66: 41-44, 1999. Youngentob SL, Mozell MM, Sheehe PR, and Hornung DE. A quantitative analysis of sniffing strategies in rats performing odor detection tasks. Physiol Behav 41: 59-69, 1987.
Page 26 of 43
27
Figure Legends
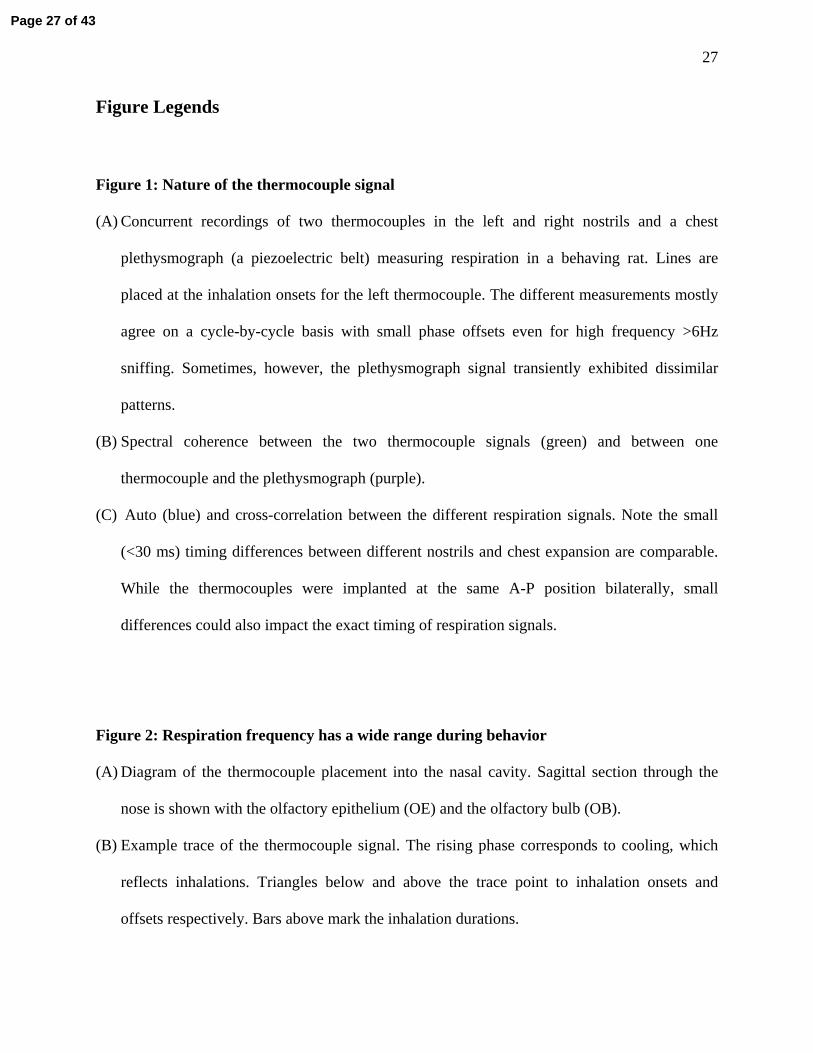
Figure 1: Nature of the thermocouple signal
(A) Concurrent recordings of two thermocouples in the left and right nostrils and a chest
plethysmograph (a piezoelectric belt) measuring respiration in a behaving rat. Lines are
placed at the inhalation onsets for the left thermocouple. The different measurements mostly
agree on a cycle-by-cycle basis with small phase offsets even for high frequency >6Hz
sniffing. Sometimes, however, the plethysmograph signal transiently exhibited dissimilar
patterns.
(B) Spectral coherence between the two thermocouple signals (green) and between one
thermocouple and the plethysmograph (purple).
(C) Auto (blue) and cross-correlation between the different respiration signals. Note the small
(<30 ms) timing differences between different nostrils and chest expansion are comparable.
While the thermocouples were implanted at the same A-P position bilaterally, small
differences could also impact the exact timing of respiration signals.
Figure 2: Respiration frequency has a wide range during behavior
(A) Diagram of the thermocouple placement into the nasal cavity. Sagittal section through the
nose is shown with the olfactory epithelium (OE) and the olfactory bulb (OB).
(B) Example trace of the thermocouple signal. The rising phase corresponds to cooling, which
reflects inhalations. Triangles below and above the trace point to inhalation onsets and
offsets respectively. Bars above mark the inhalation durations.
Page 27 of 43

28
(C) Typical thermocouple signal during anesthesia illustrates the slow and regular breathing
pattern <1Hz. Scale bar below.
(D) Example traces show the rapid and variable respiratory patterns typical in the freely behaving
rat. Scale bar above.
(E) Histogram of instantaneous respiration frequency (inverse of the respiration cycle duration)
across an entire behavioral session shows the wide range of respiratory cycles.
Figure 3: Two-choice odor-mixture discrimination task
(A) Picture of a rat performing the olfactory discrimination task. Entry into the center port
triggers the delivery of an odor, which is available until the rat stays (or a maximum of 2 s).
Based on the identity of the odor rats are trained to respond to the left or right goal port
where correct decisions are rewarded with water.
(B) Temporal structure of task events. Entry and exit from the ports are recorded using
photodetectors.
(C) Discrimination accuracy as a function of mixture ratio (n = 6 rats). Odor mixture pairs are
pooled and plotted as a function of mixture contrast (e.g. 80/20 and 20/80 ratios yield |80-20|
= 60). Empty circles represent the performance of an individual rat.
Figure 4: Anticipatory sniffing mode switch
Page 28 of 43

29
(A) Sniffing raster. Each row shows a single trial with the timing aligned to the entry into the
odor port. Gray bars represent inhalation periods, the exhalations in between are not marked.
A random selection of 60 trials in one behavioral session is shown.
(B) The mean frequency of respiration (instantaneous frequency averaged across trials) locked to
the time of entry into to the odor port. Note that the increase in frequency starts before odor
port entry.
(C) Snapshots of sniffing frequency distributions in different 50 ms time periods. The colors
reflect the time intervals indicated in (B). Top: -0.4 to -0.35 s; Middle:-0.1 to -0.05 s;
Bottom: 0.1 to 0.15 s. Time of odor port entry is 0.
(D) Time-frequency representation of respiration locked to odor port entry.
Figure 5: Sniffing frequency increase reflects shortening of exhalations
(A) Time course of inhalation duration (median) for one rat.
(B) Mean time course of inhalation duration across 6 rats.
(C) Time course of exhalation duration (median) for one rat. Shading represents S.E.M across
trials.
(D) Mean time course of exhalation duration across 6 rats. Shading represents S.E.M. across rats.
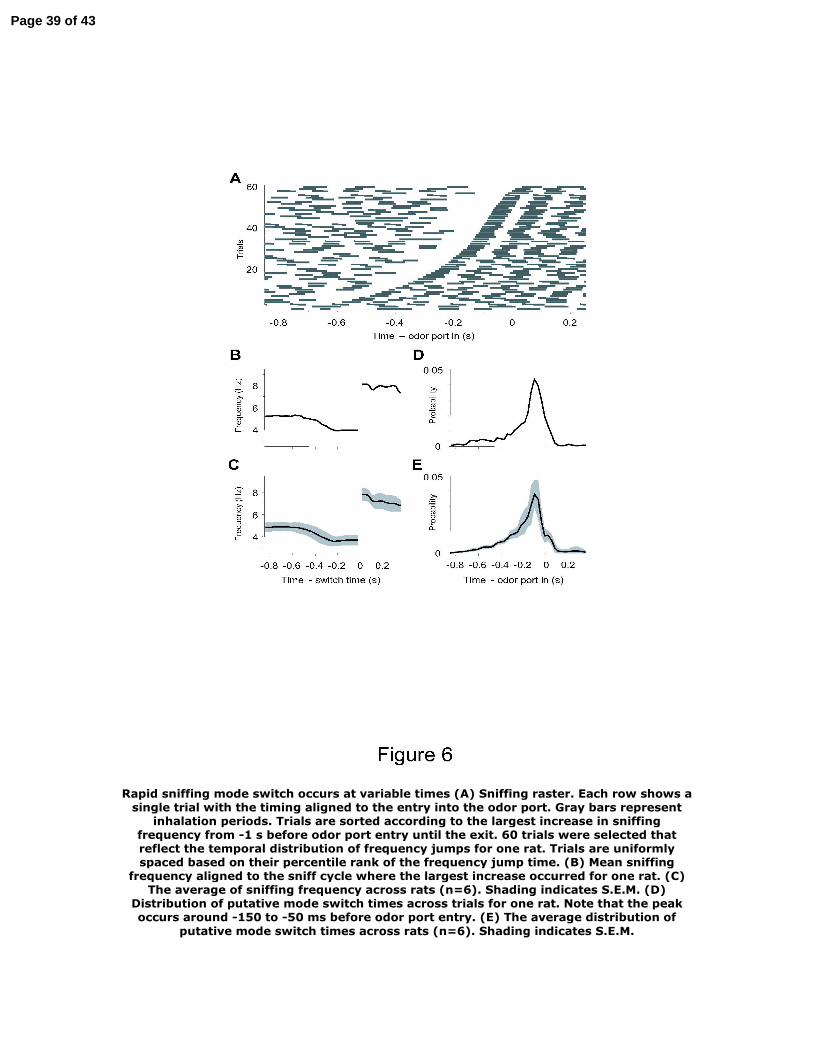
Figure 6: Rapid sniffing mode switch occurs at variable times
(A) Sniffing raster. Each row shows a single trial with the timing aligned to the entry into the
odor port. Gray bars represent inhalation periods. Trials are sorted according to the largest
increase in sniffing frequency from -1 s before odor port entry until the exit. 60 trials were
Page 29 of 43

30
selected that reflect the temporal distribution of frequency jumps for one rat. Trials are
uniformly spaced based on their percentile rank of the frequency jump time.
(B) Mean sniffing frequency aligned to the sniff cycle where the largest increase occurred for
one rat.
(C) The average of sniffing frequency across rats (n=6). Shading indicates S.E.M.
(D) Distribution of putative mode switch times across trials for one rat. Note that the peak occurs
around -150 to -50 ms before odor port entry.
(E) The average distribution of putative mode switch times across rats (n=6). Shading indicates
S.E.M.
Figure 7: Sniffing frequency and behavioral performance
Choice accuracy is plotted as a function of sniffing frequency. Solid lines show easy
discriminations, stimuli with 100/0 and 80/20 mixture ratios pooled. Dashed lines are difficult
discriminations with 68/32 and 56/44 mixture ratios. Error bars represent S.E.M across rats
(n=6). Asterisks marks significant differences in performance at the population level (P < 0.05,
Kruskal Wallis test across means). The frequency/duration distributions pooled across rats are
plotted in gray. To take into account the variations in absolute frequencies between rats the
analysis was done by first normalizing the data for each rat. Therefore frequency and duration
are shown in units of standard deviation. The corresponding across rat median values are shown
on the top. (A) Mean frequency during the odor sampling period. (B) Instantaneous frequency of
the last completed sniff during odor sampling. (C) Duration of inhalation for the last completed
sniff.
Page 30 of 43

31
Figure 8: Rapid anticipatory sniffing mode switch before reward
(A) Example thermocouple recordings aligned to entry into a water port (dashed line). Same time
scale as (B). Rising phases correspond to cooling, which reflect inhalation.
(B) Sniffing raster. Each row shows a single trial with the timing aligned to the entry into the
goal port. Gray bars represent inhalation periods, intervening exhalations are not marked. A
random selection of 60 trials in one behavioral session is shown. Note the long exhalation
following odor sampling. For correct trials water is available approx. 0.1-0.2 s after entry
into the goal port.
(C) The mean frequency of respiration (instantaneous frequency averaged across trials) locked to
the time of entry into the goal port.
(D) Snapshots of sniffing frequency distributions in different 50 ms time periods. The colors
reflect the time intervals indicated in (B). Top: -0.35 to -0.3 s; Middle:-0.15 to -0.1 s;
Bottom: 0.0 to 0.05 s. Time of goal port entry is 0.
(E) Time-frequency representation of respiration locked to goal port entry. Note the difference
between the sniffing frequency during odor sampling period (left) and the pre-reward period
(right).
Figure 9: Two distinct sniffing modes occur in different behavioral epochs
(A) Sniffing frequency distributions during the odor-sampling and pre-reward periods are largely
distinct. Data are from one rat.
(B) 2D histogram of the odor-sampling and pre-reward period sniffing frequencies shows very
little correlation (r = 0.08 for this rat) and the pre-reward frequency is almost always higher.
Same rat as in (A).
Page 31 of 43

32
(C) Average of normalized 2D histogram across 6 rats. Due to quantitative differences in sniffing
frequencies between rats the distribution is wider and exhibits an artifactual correlation
between frequency modes that is not present in individual rats.
Page 32 of 43

Nature of the thermocouple signal (A) Concurrent recordings of two thermocouples in the left and right nostrils and a chest plethysmograph (a piezoelectric belt) measuring respiration in a behaving rat. Lines are placed at the inhalation onsets for the left
thermocouple. The different measurements mostly agree on a cycle-by-cycle basis with small phase offsets even for high frequency >6Hz sniffing. Sometimes, however, the
plethysmograph signal transiently exhibited dissimilar patterns. (B) Spectral coherence between the two thermocouple signals (green) and between one thermocouple and the plethysmograph (purple). (C) Auto (blue) and cross-correlation between the different
respiration signals. Note the small (<30 ms) timing differences between different nostrils and chest expansion are comparable. While the thermocouples were implanted at the same A-P position bilaterally, small differences could also impact the exact timing of
respiration signals.
Page 33 of 43

Respiration frequency has a wide range during behavior (A) Diagram of the thermocouple placement into the nasal cavity. Sagittal section through the nose is shown with the
olfactory epithelium (OE) and the olfactory bulb (OB). (B) Example trace of the thermocouple signal. The rising phase corresponds to cooling, which reflects inhalations. Triangles below and above the trace point to inhalation onsets and offsets respectively.
Bars above mark the inhalation durations. (C) Typical thermocouple signal during anesthesia illustrates the slow and regular breathing pattern <1Hz. Scale bar below. (D)
Example traces show the rapid and variable respiratory patterns typical in the freely behaving rat. Scale bar above. (E) Histogram of instantaneous respiration frequency
(inverse of the respiration cycle duration) across an entire behavioral session shows the wide range of respiratory cycles.
Page 34 of 43

Page 35 of 43

Page 36 of 43

Page 37 of 43

Sniffing frequency increase reflects shortening of exhalations (A) Time course of inhalation duration (median) for one rat. (B) Mean time course of inhalation duration across 6 rats. (C) Time course of exhalation duration (median) for one rat. Shading
represents S.E.M across trials. (D) Mean time course of exhalation duration across 6 rats. Shading represents S.E.M. across rats.
Page 38 of 43
Rapid sniffing mode switch occurs at variable times (A) Sniffing raster. Each row shows a single trial with the timing aligned to the entry into the odor port. Gray bars represent
inhalation periods. Trials are sorted according to the largest increase in sniffing frequency from -1 s before odor port entry until the exit. 60 trials were selected that reflect the temporal distribution of frequency jumps for one rat. Trials are uniformly spaced based on their percentile rank of the frequency jump time. (B) Mean sniffing
frequency aligned to the sniff cycle where the largest increase occurred for one rat. (C) The average of sniffing frequency across rats (n=6). Shading indicates S.E.M. (D)
Distribution of putative mode switch times across trials for one rat. Note that the peak occurs around -150 to -50 ms before odor port entry. (E) The average distribution of
putative mode switch times across rats (n=6). Shading indicates S.E.M.
Page 39 of 43

Page 40 of 43

Page 41 of 43

Page 42 of 43

Two distinct sniffing modes occur in different behavioral epochs (A) Sniffing frequency distributions during the odor-sampling and pre-reward periods are largely distinct. Data are from one rat. (B) 2D histogram of the odor-sampling and pre-reward period sniffing
frequencies shows very little correlation (r = 0.08 for this rat) and the pre-reward frequency is almost always higher. Same rat as in (A).
Page 43 of 43