Embed Size (px)
Citation preview

Rapid and Robust B Cell Depletion in Preliminary Results of a Phase 2 Study of Ublituximab, Novel Glycoengineered Anti-CD20 Mab, RMS Patients
Amy Lovett-Racke, PhDMay 26, 2017
2

Slide 1
2 Go to slide master view and add unique titles to all slides. They will not be visible, but will be used by screen readertOSU uCOM, 12/28/2015

This clinical trial and immune profile study was funded by TG Therapeutics, New York.
Grants from these agencies support additional research in my lab.• National Institutes of Health• National Multiple Sclerosis Society• Strategic Pharmaceutical Academic Research Consortium
Disclosures

Background
Ublituximab (TG-1101) is a novel, chimeric monoclonalantibody (mAb) targeting a unique epitope on the CD20antigen, and glycoengineered to enhance affinity for allvariants of FcγRIIIa receptors, thereby demonstratinggreater antibody-dependent cellular cytotoxicity (ADCC)activity than rituximab and ofatumumab
CD20 Antibody Epitopes

Background
Ublituximab (TG-1101) is a novel, chimeric monoclonalantibody (mAb) targeting a unique epitope on the CD20antigen, and glycoengineered to enhance affinity for allvariants of FcγRIIIa receptors, thereby demonstratinggreater antibody-dependent cellular cytotoxicity (ADCC)activity than rituximab and ofatumumab
Ublituximab
B Cell
CD20
B Cell B Cell B Cell

Background
Ublituximab (TG-1101) is a novel, chimeric monoclonalantibody (mAb) targeting a unique epitope on the CD20antigen, and glycoengineered to enhance affinity for allvariants of FcγRIIIa receptors, thereby demonstratinggreater antibody-dependent cellular cytotoxicity (ADCC)activity than rituximab and ofatumumab
Ublituximab was originally developed for B celllymphomas, in response to the need for enhancedpotency to deplete malignant B-cells with reducedexpression of CD20, that are able to evade depletion viastandard anti-CD20 therapies
To date, over 500 oncology patients have been treatedwith ublituximab, alone and in combination with otheragents, and two large Phase III trials (UNITY andGENUINE) for B cell lymphomas are currently underway.Completed studies have demonstrated robust effects onall endpoints and excellent safety and tolerability
Evidence for the role of B cells in the pathogenesis ofMultiple Sclerosis and the marked efficacy of anti-CD20stested thus far prompted us to conduct TG1101 RMS201,a Phase IIa proof of concept study in relapsing MS
CD20 Antibody Epitopes

Objective
TG1101 RMS201 (clinicaltrials.gov NCT02738775) is a randomized, placebocontrolled, multi-center study to test the safety and efficacy of ublituximab,at doses markedly less than used in ongoing Phase 3 oncology studies, andat a range of infusion times, with a goal of rapid infusions
Primary endpoint is the Responders Rate, defined as percent of subjectswith ≥95% reduction in peripheral CD19+ B-cells within 2 weeks after thesecond infusion (day 15)
The TG1101 RMS201 study in ongoing and will incorporate additionalclinical and MRI measures (see Study Design). We report preliminaryresults of B cell depletion after the second infusion

Study Design

Study Design
Placebo Phase

Study Design

Study Design
Three additional cohorts have been added to further reduce infusion times to 1 hr.

Patient Demographics
Baseline Demographics Cohort Subjects and
Treatment Age
(Years)1 Gender
(% Female) Disease
Duration (Years)1,2 1 Placebo (n=2) 39±14 50% 15.5±20.4 UTX (n=6) 43±12 67% 7.1±7.3 2 Placebo (n=2) 44±1 0% 0.9±1.2 UTX (n=6) 33±10 100% 5.3±6.4 3 Placebo (n=2) 38±7 50% 11.5±7.5 UTX (n=6) 40±11 67% 13.4±10.0
Total n=24 40±11 67% 8.8±9.0 1 Mean ± Standard Deviation 2 Distribution of times from diagnosis: 11 subjects (45.8%) were less than 5 years, 7 (29.2%) were 5-10 years, and 6 (25%) were greater than 10 years.

Immune Profiling
Blood is collected in heparinized tubes and shipped to OSU.
Blood
Ficoll
Plasma
Lymphocytes Monocytes
Erythrocytes
B Cell
CD19 CD27 CD5
T Cell
T Cell
MonocyteB Cell
B Cell
NK CellB Cell
T Cell
Monocyte
T Cell

Immune Profiling
Blood is collected in heparinized tubes and shipped to OSU.
Blood
Ficoll
Plasma
Lymphocytes Monocytes
Erythrocytes
B Cell
CD19 CD27 CD5
T Cell
T Cell
MonocyteB Cell
B Cell
NK CellB Cell
T Cell
Monocyte
T Cell

Immune Profiling
B/NK Cell PanelCD3CD19CD5CD1dCD27CD56CD16
T Cell PanelCD3CD4CD8CD45RACD27
Treg Cell PanelCD3CD4CD25FoxP3
Activated/Reg B Cell Panel (PMA/Ion/CpG)CD3CD19CD5CD1dCD27IL-10IL-27/35
Helper T Cell Panel (PMA/Ion)CD3CD4CD45RAIL-10IFNγGM-CSFIL-17

B Cell Analysis
B Cells
T Cells

Screen
Day 0
Day 1
Week 2
Week 3
Week 4SSC
SSC
SSC
SSC
SSC
SSC
CD19
CD19
CD19
CD19
CD19
CD19
FSC CD3
FSC CD3
FSC CD3
FSC CD3
FSC CD3
FSC CD3
7.0%
6.5%
10.3%
10.2%
5.3%
9.4%
B Cell AnalysisPlacebo Phase

Screen
Day 0
Day 1
Week 2
Week 3
Week 4SSC
SSC
SSC
SSC
SSC
SSC
CD19
CD19
CD19
CD19
CD19
CD19
FSC CD3
FSC CD3
FSC CD3
FSC CD3
FSC CD3
FSC CD3
7.0%
6.5%
10.3%
10.2%
5.3%
9.4%
B Cell AnalysisPlacebo Phase
SSC
SSC
SSC
SSC
SSC
SSC
CD19
CD19
CD19
CD19
CD19
CD19
FSC CD3
FSC CD3
FSC CD3
FSC CD3
FSC CD3
FSC CD3
8.9%
9.9%
0%
0%
0%
0%
Treatment Phase

B Cell Analysis
B Cell Analysis in Placebo and Treatment Phase
Screen
Day 0P - D
ay 1P - W
eek 2
P - Week
3P - W
eek 4
Screen
Day 0
T - Day 1
T - Wee
k 2T - W
eek 3
T - Wee
k 4
0
5
10
15
20Cohort 1 - FCohort 2 - CCohort 2 - GCohort 3 - CCohort 3 - D
% B
Cel
ls

B Cell Analysis
Change in % B Cells with Ublituximab
Screen WK1 Day1 WK1 Day2 Week 2 Week 3 Week 40
5
10
15
20
25
30
35
*** *** *** ***
***p<0.001 Bonferroni's Multiple Comparison Test compared to Screening and Day 0Time of Analysis
% B
Cel
ls

B Cell Analysis
Screen WK1 Day1 WK1 Day2 Week 2 Week 3 Week 40
5
10
15 Cohort 1Cohort 2Cohort 3
*No statistical difference (ANOVA) between cohorts at each time point.Error bars are meanSEM.
Time of Analysis
% B
Cel
ls
All patients received the same total dose of 600 mg, only infusion times differed.
B Cell Analysis
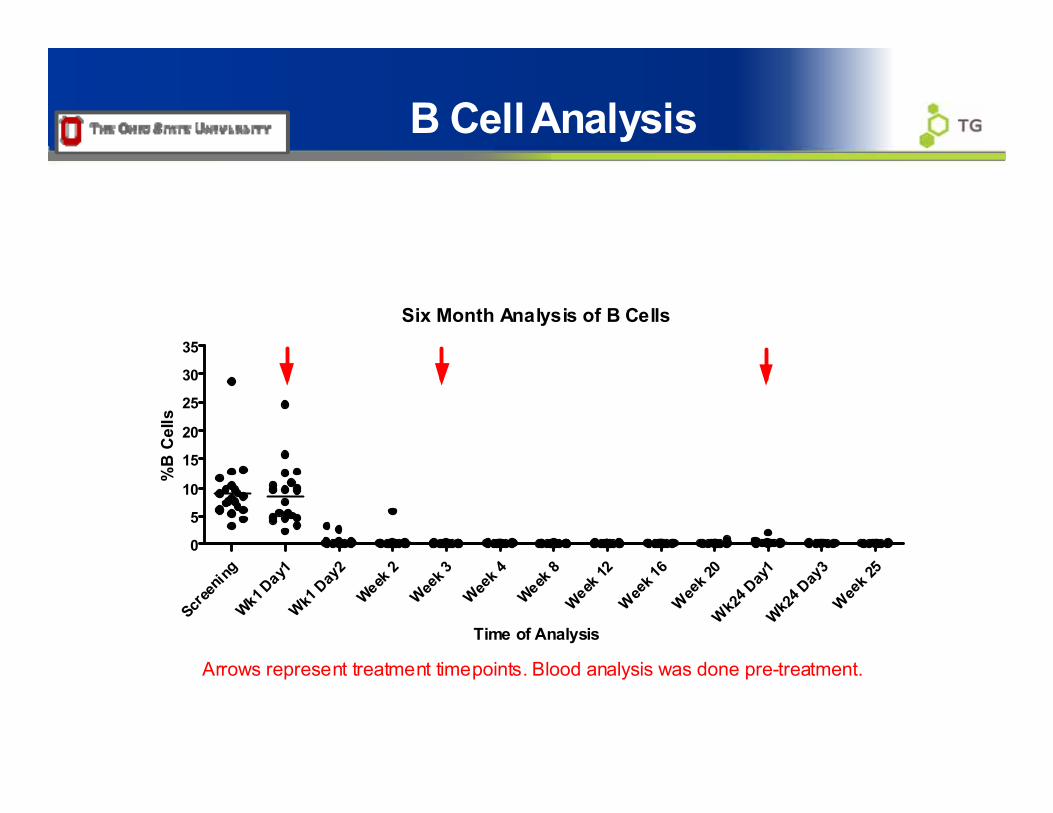
Six Month Analysis of B Cells
Screen
ingWk1 D
ay1Wk1
Day2
Week 2
Week 3
Week 4
Week 8
Week 12Wee
k 16
Week 2
0Wk24
Day1
Wk24 Day
3Wee
k 25
0
5
10
15
20
25
30
35
Arrows represent treatment timepoints. Blood analysis was done pre-treatment.
Time of Analysis
%B
Cel
ls

B Cell Analysis
Six Month Analysis of B Cells
Screen
ingWk1
Day1
Wk1 Day2
Week 2
Week 3
Week 4
Week 8
Week 1
2Week 16Wee
k 20
Wk24 D
ay1Wk24
Day3
Week 2
5
0
1
2
33
152739
Arrows represent treatment timepoints. Blood analysis was done pre-treatment.
Time of Analysis
% B
Cel
ls

Screen
Day 0
Day 1
Week 2
Week 3
Week 4
T Cell AnalysisPlacebo Phase
SSC
SSC
SSC
SSC
SSC
SSC
CD19
CD19
CD19
CD19
CD19
CD19
FSC CD3
FSC CD3
FSC CD3
FSC CD3
FSC CD3
FSC CD3
57%
36%
44%
60%
32%
58%
7.0%
6.5%
10.3%
10.2%
5.3%
9.4%

Screen
Day 0
Day 1
Week 2
Week 3
Week 4
T Cell AnalysisPlacebo Phase Treatment Phase
SSC
SSC
SSC
SSC
SSC
SSC
CD19
CD19
CD19
CD19
CD19
CD19
FSC CD3
FSC CD3
FSC CD3
FSC CD3
FSC CD3
FSC CD3
57%
36%
44%
60%
32%
58%
7.0%
6.5%
10.3%
10.2%
5.3%
9.4%
SSC
SSC
SSC
SSC
SSC
SSC
CD19
CD19
CD19
CD19
CD19
CD19
FSC CD3
FSC CD3
FSC CD3
FSC CD3
FSC CD3
FSC CD3
70%
52%
27%
59%
60%
48%
8.9%
9.9%
0%
0%
0%
0%

T Cell Analysis
Screen
Day 0
P - Day
1P - W
eek 2
P - Wee
k 3P - W
eek 4
Screen
Day 0
T - Day
1T - W
eek 2
T - Wee
k 3T - W
eek 4
0
25
50
75Cohort 1 - F Cohort 2 - C Cohort 2 - G
Cohort 3 - C Cohort 3 - D
Time of Analysis
% T
Cel
ls

T Cell Analysis
Analysis of % T Cells with Ublituximab Therapy
Screen WK1 Day1 WK1 Day2 Week 2 Week 3 Week 40
102030405060708090
100
p<0.05p<0.001
Statistical analysis with Bonferroni's Multiple Comparison Test
Time of Analysis
% T
Cel
ls

B Cell Subset AnalysisScreen
Day 0
Day 1
Week 2
Week 3
Week 4
SSC
SS
CSS
CSS
CSS
CSS
C
FSC CD3
FSC CD3
FSC CD3FSC CD3
FSC CD3
FSC CD3
FSC CD3
CD19
CD19
CD19
CD19
CD19
CD19

B Cell Subset AnalysisScreen
Day 0
Day 1
Week 2
Week 3
Week 4
SSC
SS
CSS
CSS
CSS
CSS
C
FSC CD3
FSC CD3
FSC CD3FSC CD3
FSC CD3
FSC CD3
FSC CD3
CD19
CD19
CD19
CD19
CD19
CD19
B Cells

B Cell Subset AnalysisScreen
Day 0
Day 1
Week 2
Week 3
Week 4
SSC
SS
CSS
CSS
CSS
CSS
C
FSC CD3
FSC CD3
FSC CD3FSC CD3
FSC CD3
FSC CD3
FSC CD3
CD19
CD19
CD19
CD19
CD19
CD19
CD19
CD19
CD19
CD19
CD19
CD19
CD27
CD27
CD27
CD27
CD27
CD27
MemoryNaive
B Cells
MemoryNaive
MemoryNaive
MemoryNaive
MemoryNaive
MemoryNaive

B Cell Subset Analysis

Naive versus Memory % B Cells
0
10
20
30
40
50
60
70
80
90
100
Naive Memory Naive Memory Naive Memory Naive Memory--Screen/Day0-- ------Day 1------ ------Week 2------ ------Week 4-----
% B
Cel
ls
B Cell Subset Analysis

Summary
Ublituximab is well-tolerated, with only mild infusion reactions (Grade 1-2) being observed, even with infusion times reduced to 1 hour.
Ublituximab efficiently depletes B cells (98.9%), meeting the endpoint of >95% depletion within two weeks of second dose, comparable to ocrelizumab.
Although there is a transient decrease in T cells after the initial dose of ublituximab, T cell numbers are fairly stable over time.
Memory B cells seem slightly more resistant to depletion, but are efficiently depleted in all patients.
A comprehensive analysis of B and T cell profiles is being performed to understand how B cell depletion influences T cell profiles, and to characterize the B cell repletion.
This one year study of ublituximab in RMS patients is ongoing and clinical and MRI measures will be reported at future congresses.

AcknowledgementsOhio State University, Columbus, OHMichael K. Racke, MDStephanie Scarberry, RNYue Liu, MSMatthew GormleyAmy Lovett-Racke, PhD
Hope Neurology Multiple Sclerosis Center, Knoxville, TNSibyl Wray, MDKelsey Lenihan, NPBrenda Albertson, CCRP
SC3 Research Group, Pasadena, CARichard Shubin, MDNgoc Kim NguyenCassie Tran
Associates in Neurology PSC, Lexington, KYCary L. Twyman, MDLaura Sanders, CCRC
Central Texas Neurology Consultants, Round Rock, TXEdward J. Fox, MDLori Mayer, DNPKoni Lopez
TG Therapeutics, New York, NY Wendy Su, PhDJames Eubanks, PhD