Embed Size (px)
Citation preview
1
Rapid characterization of fatty acyl composition of complex lipids by collision-induced
dissociation time-of-flight mass spectrometry
Steven Wynn Esch*, Pamela Tamura*, Alexis A. Sparks*, Mary R. Roth*, Shivakumar P.
Devaiah†, Ernst Heinz§, Xuemin Wang†, Todd D. Williams**, and Ruth Welti*1
*Kansas Lipidomics Research Center, Division of Biology, Kansas State University, Manhattan,
KS 66506; †Department of Biology, University of Missouri-St. Louis and Danforth Plant
Science Center, St. Louis, MO 63121; § Biozentrum Klein Flottbeck, University of Hamburg, D-
22609, Hamburg, Germany; and †University of Kansas Mass Spectrometry Laboratory,
University of Kansas, Lawrence, KS 66045
1To whom correspondence should be addressed.
email: [email protected]
Running title: Fatty acyl analysis by CID-TOF MS
Corresponding author:
Ruth Welti
Division of Biology
Ackert Hall
Kansas State University
Manhattan, KS 66506-4901
FAX: 785-532-6653
Phone: 785-532-6241
Email: [email protected]
by guest, on May 20, 2018
ww
w.jlr.org
Dow
nloaded from
2
Abbreviations: CID-TOF MS, collision-induced dissociation-time of flight mass spectrometry;
ESI, electrospray ionization; FAD, fatty acid desaturase; FAME, fatty acid methyl ester; FID,
flame-ionization detector; GC, gas chromatography; HPLC, high performance liquid
chromatography; MGDG, monogalactosyldiacylglycerol; MSD, mass selective detector; Q-
TOF, quadrupole-time of flight; OPPC, 1-oleoyl (18:1),2-palmitoyl (16:0) phosphatidylcholine;
PG, phosphatidylglycerol; PI, phosphatidylinositol; POPC, 1-palmitoyl (16:0),2-oleoyl (18:1)
phosphatidylcholine; POPE, 1-palmitoyl (16:0),2-oleoyl (18:1) phosphatidylethanolamine;
SQDG, sulfoquinovosyldiacylglycerol; TLC, thin layer chromatography; UV, ultraviolet
by guest, on May 20, 2018
ww
w.jlr.org
Dow
nloaded from
3
Abstract Profiling of leaf extracts from mutants of Arabidopsis with defects in lipid
desaturation demonstrates the utility of collision-induced dissociation-time of flight (CID-
TOF) mass spectrometry (MS) for screening biological samples for fatty acid compositional
alterations. CID-TOF MS utilizes the collision cell of a quadrupole-time of flight (Q-TOF)
mass spectrometer to simultaneously fragment all the ions produced by an ionization
source. Electrospray (ESI) CID-TOF MS in the negative mode can be used to analyze fatty
acyl anions derived from complex lipids as well as free fatty acids. Although acyl anion
yield is shown to be a function of the lipid class and position on the glycerol backbone, acyl
compositional profiles can be determined, and the TOF detector provides resolution of
nominally isobaric acyl species in the profiles. Good precision is obtained when data are
acquired for approximately 1 minute per sample.
Supplementary key words phospholipid • galactolipid • oxylipins • lipidomics
by guest, on May 20, 2018
ww
w.jlr.org
Dow
nloaded from
4
Fatty acyl composition is most commonly analyzed by gas chromatography after derivatization
to fatty acid methyl esters (FAME). When flame ionization or a mass spectrometer is used as the
detector, quantitative compositional data are obtained. Liquid chromatography provides an
alternative means of separation, in which fatty acids can be detected by UV absorption after
chemical conversion to an appropriate derivative form (1). Separation and analytical techniques
include adsorption chromatography, silver nitrate chromatography, TLC, and HPLC (2). Most
gas chromatography and liquid chromatography protocols for fatty acyl species are optimized for
normal chain fatty acyl species. Other fatty acids, such as those containing heteroatoms, e.g.
oxygen, often require specialized procedures for analysis. Plant oxylipins, for example, have
been analyzed by gas chromatography-mass spectrometry (GC-MS) or liquid chromatography
following various extraction and derivatization steps designed to enable detection and minimize
degradation of these often low-level compounds (for example, 3-7).
Recently we utilized a novel negative ion mode mass spectrometric scanning method for rapid
profiling of free and ester-linked fatty acyl moieties in crude lipid extracts (8). The “CID-TOF”
experiment involved simultaneous collision-induced dissociation of all members of a complex
mixture of lipids in the collision cell of a quadrupole-TOF instrument. The TOF analyzer
provided accurate mass characterization of all intact acyl fragments in a single spectrum. Using
this method as a “discovery scan”, we identified fatty acyl groups, including several oxygenated
species that increased in response to wounding of the plant Arabidopsis thaliana (8). Here, we
describe this methodology and investigate the accuracy and precision of CID-TOF MS.
MATERIALS AND METHODS
by guest, on May 20, 2018
ww
w.jlr.org
Dow
nloaded from
5
Lipids
1-15:0,2-15:0 phosphatidylethanolamine (di15:0 PE); 1-16:0,2-18:1 phosphatidylcholine
(POPC); 1-18:1,2-16:0 phosphatidylcholine (OPPC); and 1-16:0,2-18:1
phosphatidylethanolamine (POPE) were purchased from Avanti Polar Lipids, Inc. (Alabaster,
AL). 17:0 fatty acid was purchased from NuChek Prep, Inc. (Elysian, MN). 1-18:1,2-16:1
monogalactosyldiacylglycerol (18:1,16:1 MGDG) was prepared semi-synthetically (9).
Plant extracts
Leaves from approximately 7-week-old Arabidopsis thaliana (Columbia ecotype) plants were
used for analysis. Growth conditions have been described elsewhere (8). Wounding was
performed as previously described (8, 10). Arabidopsis lipids were extracted as previously
described (11). Seeds of the act1-1, fad2-1, fad3-2, and fad7-1(gl1) mutants of Arabidopsis were
obtained from Arabidopsis Biological Resource Center at The Ohio State University (Cat. No.
CS200, CS8041, CS8034 and CD3108, respectively). Because a high-throughput analytical
approach is being developed, extracts were analyzed in crude form, without further processing,
except as noted. Crude extracts containing the lipid from approximately 2 mg leaf biomass (dry
weight) per ml chloroform were diluted 100-fold into the infusion solvent prior to mass analysis.
For purposes of analyzing collision energy effects only, a crude extract of the 7-week-old
Arabidopsis thaliana (Columbia ecotype) was further processed to reduce levels of naturally-
occurring free fatty acids. Crude extract (500 µl in chloroform) was passed through an activated
silicic acid (Unisil, Clarkson Chemical Co., Williamsport, PA) column (0.3 g suspended in
by guest, on May 20, 2018
ww
w.jlr.org
Dow
nloaded from
6
chloroform and packed into a glass Pasteur pipette), and washed with 8 ml chloroform to elute
the neutral lipids. Polar lipids were then eluted with 8 ml chloroform: methanol (2:1), the
solvent was evaporated to dryness, and the lipids were dissolved in 1 ml chloroform. This in turn
was diluted approximately 100-fold into the electrospray solvent prior to mass analysis.
CID-TOF mass spectrometry
Electrospray ionization (ESI)-CID-TOF MS spectra were acquired with a Micromass Q-TOF-2
tandem mass spectrometer (Micromass Ltd., Manchester, UK). The time of flight analyzer was
tuned for maximum resolution (10,000 resolving power) with argon in the collision cell. The
pusher frequency was set at 22 kHz for a mass range of m/z 20-1000 and 16 kHz for a mass
range of m/z 20-2000. Mass selection in the Q1 quadrupole was turned off, while the collision
cell remained at the specified voltage offset. Unselected precursor ions were subjected to CID in
the negative mode. Micromass MassLynx software was used as the operating software. All
TOF spectra were acquired with daily mass calibration. Samples were dissolved in chloroform:
methanol: 300 mM ammonium acetate in water (60:133:7, v/v/v) and infused into the ESI source
of the Q-TOF at 20-40 μl/min.
CID-TOF MS data analysis
Careful selection of background subtraction, smoothing, and centroiding parameters was
required for reproducible processing of CID-TOF raw continuum spectral data. Spectrum
manipulation software was used to attenuate chemical background noise to ~10 counts per ion by
setting a linear horizontal baseline subtraction threshold to remove the lowest 40% of signals in
the continuum spectrum. After baseline subtraction, the spectral data were subjected to two
by guest, on May 20, 2018
ww
w.jlr.org
Dow
nloaded from
7
successive smooths of ± 3 "time bin" channels (0.0625u/channel) according to the Savitzky-
Golay method (12). Smoothed peaks were centroided at a minimum peak width at half height of
4 channels (0.25u). These manipulations were adjusted by trial and error to assure one centroid
"stick" per resolvable ion in this region. Spectra were mass-corrected by locking on an
appropriate known anion in the m/z region of interest. Chemical formulas for the product ions
were determined using the Micromass MassLynx chemical formula tool limiting formula to C,
H, N, O, P, S, sensible valence, and rings plus double bonds, restrictions.
For calculation of fatty acid composition, the centroided, mass-corrected spectral data were
transferred to an Excel data template with a “lookup” function that selected mass/signal pairs
within specified m/z windows for the expected and identified acyl anions. The intensities of acyl
specific signals were summed, divided by the total signal, and multiplied by 100 to obtain mol%
of total fatty acids. It was not necessary to correct for A + 2 isotopic overlap, because in no case
did the m/z of the A + 2 peak of an examined fatty acid fall within the m/z window of the A peak
of another fatty acid isotope cluster.
Gas chromatography with FID detection (GC-FID)
The solvent was completely evaporated from samples to which an internal standard of 15:0 had
been added. One ml of 3 M methanolic hydrochloric acid was added, and the samples were
bubbled with nitrogen gas and heated at 78ºC for 30 min. Two ml of water and 2 ml of pentane
were added. Samples were shaken and the upper pentane layer was removed. This extraction was
repeated twice, the solvent was evaporated, and the sample was dissolved in 150 µl of hexane.
by guest, on May 20, 2018
ww
w.jlr.org
Dow
nloaded from
8
Samples were analyzed by gas chromatography with FID detection (GC-FID) on an Agilent
6890 GC (Agilent Technologies,Wilmington, DE) equipped with a split/splitless injector
operated in the splitless mode at 250ºC. The injection volume was 1 µl. The carrier gas was
helium (0.7 ml min–1). Compounds were separated on a Supelco 2380 (stabilized; poly(90%
biscyanopropyl/10% cyanopropylphenyl siloxane)) column (30 m x 0.25 mm ID) (Sigma-
Aldrich, St. Louis, MO). The column temperature was ramped from 50ºC to 130ºC at 20ºC/ min,
then to 250ºC at 3ºC/ min. The FID detector was at 260ºC.
RESULTS AND DISCUSSION
CID-TOF MS detects acyl anions from complex lipids
Fatty acyl compositional analysis by CID-TOF MS is performed by ionizing a solution of
complex lipids by ESI with an electrospray quadrupole-time of flight hybrid (ESI Q-TOF) mass
spectrometer in negative ion mode with ammonium acetate as carrier electrolyte, producing [M −
H]− and/or [M + OAc]− acyl anions. The quadrupole is operated in radio frequency-only mode
(no direct current voltage applied), allowing all lipid analytes supplied by the ion source entry
into the collision cell simultaneously, regardless of size (i.e., m/z value). The acyl anions are
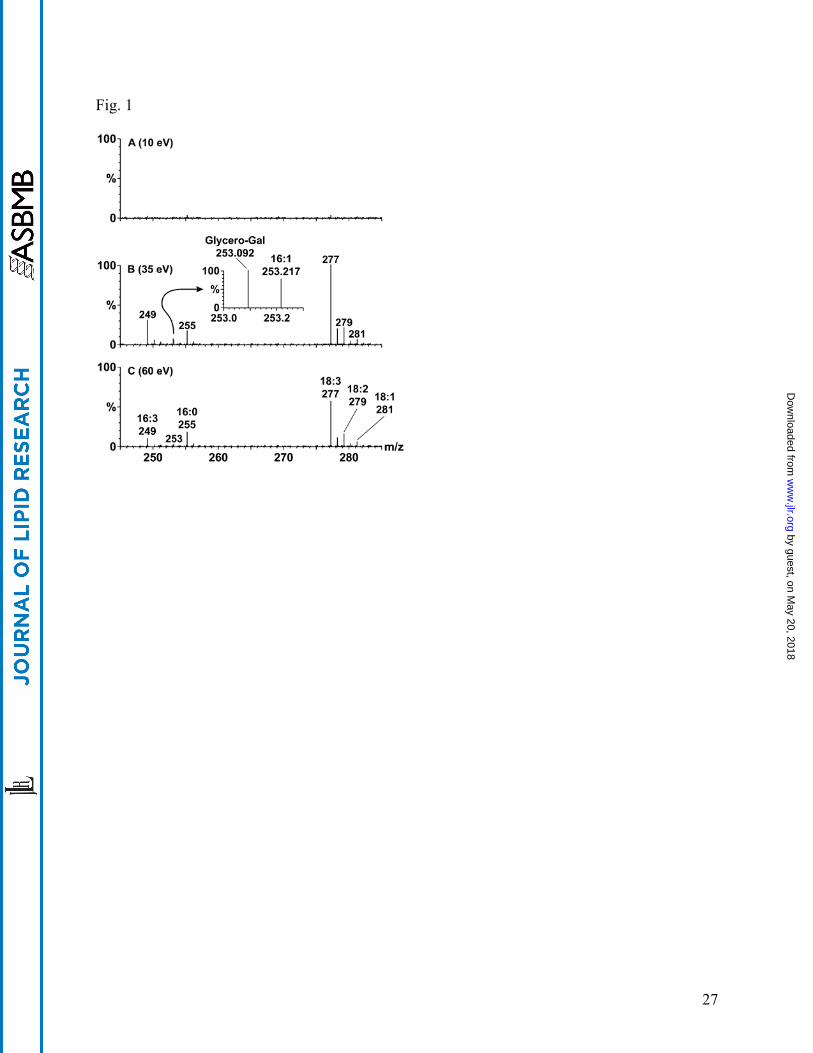
detected by a TOF analyzer. Fig. 1 shows the result of CID-TOF MS analysis performed at three
different collision energies (10 eV, 35 eV and 60 eV) on an extract of Arabidopsis leaves
following silicic acid chromatography to reduce the free fatty acid levels in the extract. These
spectra were obtained by direct infusion of the lipid extract and, as shown, are each a
combination of eleven 5-second scans of m/z 20-2000.
by guest, on May 20, 2018
ww
w.jlr.org
Dow
nloaded from
9
When the voltage offset on the collision cell was 10 eV (Fig. 1A), only very low levels of acyl
anions can be detected in this sample lacking free fatty acids. However, when higher collision
offset voltages were applied to the collision cell, negative anions were readily produced and
detected. The spectra obtained at 35 eV and 60 eV (Fig. 1B, 1C) show abundant acyl anions as
well as characteristic head group-derived fragments. These data indicate that the acyl anions
observed (Fig 1B, 1C) arise from CID of the complex lipids. The accurate mass capability of the
TOF analyzer makes it possible to differentiate between nominally isobaric species (13, 14). For
example, as shown in the inset to Fig. 1B, the spectral peak at m/z 253.092, corresponding to the
chemical formula C9H17O8, which is a glycero-galactose fragment derived from MGDG, is
resolved from the peak observed at m/z 253.217, corresponding to the chemical formula
C16H29O2, which is a 16:1 acyl anion. Compared to the 35 eV spectrum (Fig. 1B), the spectrum
obtained at 60 eV (Fig. 1C) has somewhat less total ion current (61%) in the peaks in the m/z
range of interest.
CID-TOF MS fatty acyl analysis is not rigorously quantitative
While the spectra in Fig. 1B and 1C, are similar, the relative heights of acyl anions peaks differ
in response to fragmentation at different collision energies. In Table 1, these acyl anions are
quantified and compared with the fatty acyl composition determined by fatty acid methyl ester
analysis of the same Arabidopsis lipid mixture by GC with an FID detector. By GC-FID, the
detector response varies by less than 10% among the analyzed fatty acid methyl esters (15, 16),
so GC-FID data indicate a composition close to the true composition. The spectral data produce
a composition similar to, but not exactly the same as, the fatty acyl composition determined by
by guest, on May 20, 2018
ww
w.jlr.org
Dow
nloaded from
10
GC-FID. Furthermore, the composition determined by CID-TOF depends somewhat on the
offset voltage applied to the collision cell.
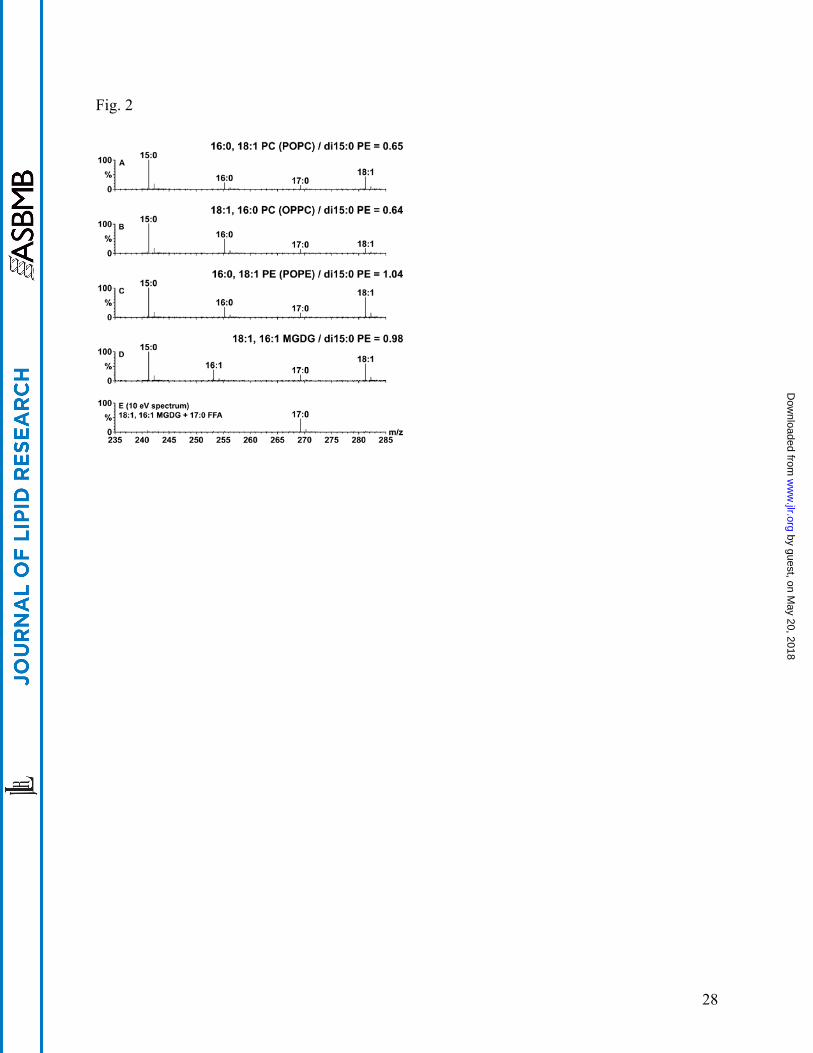
Polar lipids of known composition and concentration were used to evaluate the influence of lipid
structure on acyl anion peak yields in CID-TOF MS spectra collected at 35 eV (Fig. 2). Peak
size was influenced by both the nature of the polar head group and the acyl chain position on the
glycerol backbone. Fig. 2A shows the 35 eV CID-TOF MS spectrum derived from a 1:1:1
(molar basis) mixture of 1-16:0,2-18:1 PC (POPC), di15:0 PE, and 17:0 fatty acid. The size of
the acyl peaks derived from POPC relative to the size of the 15:0 peak from di15:0 PE was
0.65:1 ((16:0 + 18:1 peak intensities)/15:0 peak intensity), as shown in Table 2. Fig. 2B shows
the spectrum obtained under identical conditions with 1-18:1,2-16:0 PC (OPPC; same head
group and acyl composition as the PC complex lipid in Fig. 2A but with the sn1/sn2 acyl
positions reversed), di15:0 PE, and 17:0 fatty acid. The size of the peaks derived from OPPC
relative to the peak from di15:0 PE was 0.64:1, almost the same as in Fig. 2A. As might be
expected of complex lipids with the same head group, the relative sizes of the acyl anion peaks
produced from 1-16:0,2-18:1 PE (POPE) and di15:0 PE were ~1:1 (Fig. 2C). The relative sizes
of the 1-18:1,2-16:1 MGDG and di15:0 PE acyl anion peaks were also ~1:1 (Fig. 2D). Table 2
details these relative intensities and shows that at 35 eV collision energy, complex lipids
containing PE and MGDG head groups ionized and/or fragmented to approximately the same
level, and to a greater extent than lipids containing PC. The relative propensity of PE and PC
lipids to produce acyl anions was reversed at 60 eV, however, at which voltage the ratios of
POPC and OPPC to di15:0 PE were both 1.25. At 60 eV, MGDG also ionized somewhat more
efficiently than the PE species. The variability of acyl anion yield from different head groups
by guest, on May 20, 2018
ww
w.jlr.org
Dow
nloaded from
11
may have resulted from different kinds of precursor ion formation arising during ionization in
negative mode. For example, in chloroform/methanol/aqueous 300 mM NH4OAc (60:133:7,
v/v/v), ESI of PC produces primarily [M + OAc]– ions and, to a lesser extent, [M – CH3]– ions,
PE produces primarily [M – H]– ions, while MGDG produces both [M + OAc]– and [M – H]–
ions. Therefore, given the potential for variability in the type of precursors formed, it is perhaps
remarkable that at both electrospray voltages examined, the PCs, PE and MGDG produced acyl
anions with relative intensities differing by less than a factor of 1.5. Thus, acyl anions derived
from the various head group classes in a biological mixture could all be expected to contribute
similarly to the spectrum. The differences in signal produced by PC species compared to PE and
MGDG species in this experiment, however, imply that no single collision energy is optimal for
quantitative recovery of acyl groups from different lipid classes.
The data in Fig. 2 also indicate that the acyl chain position affects the CID-TOF MS spectral
signal. For example, for POPC (Fig. 2A), the ratio of the peak produced by the sn2 acyl species
as compared to the sn1 acyl species (18:1 to 16:0) was 2.0, demonstrating a higher yield from the
2-position (Table 2). Similarly, OPPC and POPE also yielded more acyl anion from the 2-
position (Fig. 2B, C; Table 2). In each of these three phospholipid cases, the more abundant acyl
yield was obtained from the sn2 position, confirming observations of product ion analysis
described by Murphy (17). The sn2:sn1 ratios were not identical, however, suggesting that acyl
chain structure could play a secondary role in the CID-TOF yield obtained. On the other hand,
the acyl yields from the 1- and 2-position of the MGDG lipid were reversed, and the fatty acyl
group in the 1-position gave a higher yield (Fig. 2D, Table 2). Guella et al. also found that
fragmentation of MGDG to produce acyl anions generally occurred more readily from the sn1
by guest, on May 20, 2018
ww
w.jlr.org
Dow
nloaded from
12
than the sn2 position (18). These results allow us to clear up ambiguity in a previous study (19)
where the acyl positions in naturally-occurring 18:3-16:3 MGDG and 18:3-16:3 DGDG were
reported provisionally as 16:3-18:3 based on the higher yield of 18:3 acyl anion and (incorrect)
assignment of this higher-yield anion to the species in the 2-position.
The 17:0 free fatty acid, included in all of the samples in Fig. 2, was the only acyl anion
recovered in substantial yield at 10 eV (Fig. 2E). This confirms the observation that MS1 spectra
or spectra obtained at very low collision energies (those minimally required to usher intact ions
through the collision cell) are useful for examining background levels of free fatty acids in tissue
extracts (20). It can be noted that the yield of the 17:0 fatty acid was somewhat lower at 35 eV
(Fig. 2A-D) than at 10 eV (all panels are on the same scale). This may reflect fragmentation by
CID of the 17:0 fatty acyl anion at 35 eV, at which voltage the ratio of 17:0 to di15:0 PE is less
than 1:1, the ratio which would be expected for the free fatty acid relative to the same molar
amount of PE (Table 2).
Taken together, the data in Figure 2 and Table 2 indicate that the non-quantitative nature of acyl
compositional analysis by CID-TOF on biological mixtures (Table 1) stems from the different
propensities of acyl chains of different lipids, and in different positions on the same lipid, to
produce acyl anions. This is true at any collision offset voltage. Therefore, it is not possible to
“correct” CID-TOF results by assignment of response factors to fatty acyl species, because, as
shown here, response varies depending on the class and positional distribution of the fatty acid in
the mixture.
Acyl species containing heteroatoms can be detected and resolved
by guest, on May 20, 2018
ww
w.jlr.org
Dow
nloaded from
13
An Arabidopsis leaf extract contains a mixture of the major plant phospholipids, PC, PE,
phosphatidylglycerol (PG), and phosphatidylinositol (PI), the major plant galactolipids, MGDG,
digalactosyldiacylglycerol (DGDG), and sulfoquinovosyldiacylglycerol (SQDG), and lesser
amounts of other complex lipids (21, 22). The fatty acyl composition of Arabidopsis leaves
differs depending on the physiological state of the plant. For example, mechanical wounding of
plant leaves has been demonstrated to result in production of a variety of oxygenated fatty acyl
species, collectively known as “oxylipins” (5, 6, 8). Oxylipins can occur both as free fatty acids
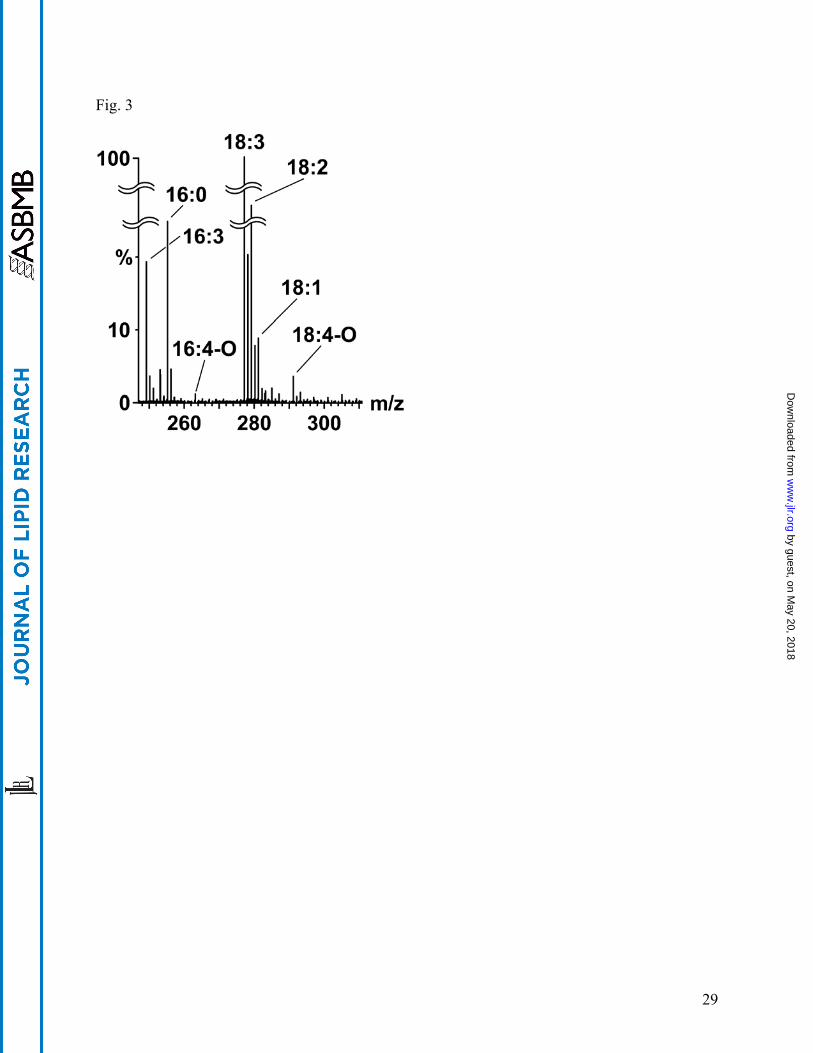
or esterified to the complex polar lipids of the plant plastid (6, 8, 23-27). CID-TOF MS of an
unfractionated extract of Arabidopsis leaves subjected to wounding shows that oxylipin species
can be detected (Fig. 3, Table 3), along with the normal chain acyl species. Although these
same acyl species should be discernable, quantifiable, and resolvable by GC-MS, especially if a
TOF analyzer were used, the advantages of CID-TOF MS for this analysis are its rapidity and the
lack of requirement for derivatization or for heating, which in some cases may lead to
decomposition.
CID-TOF MS produces precise results
To determine the precision of the analysis, 11 samples were prepared for CID-TOF MS from the
same lipid extract. The unfractionated extract was derived from the act1 mutant of Arabidopsis,
which has a mutation in an acyltransferase that results in defective formation of plastidic lipids
(28, 29). Thus, the act1 mutant produces only low levels of 16:2 and 16:3. Collision energy was
set at 35 eV because of the higher total signal obtained at this offset voltage as compared to 60
eV. Eleven CID-TOF MS scans were collected from each sample, and the results were analyzed.
The data are presented in Table 4. The species shown account for over 98% of the acyl species
by guest, on May 20, 2018
ww
w.jlr.org
Dow
nloaded from
14
detected. Except for species present in very low amounts (< 0.5 mol%), e.g. 16:2, the precision
of the analyses was excellent (Table 4).
The simplicity and rapidity of CID-TOF MS make it a useful tool for screening biological
samples
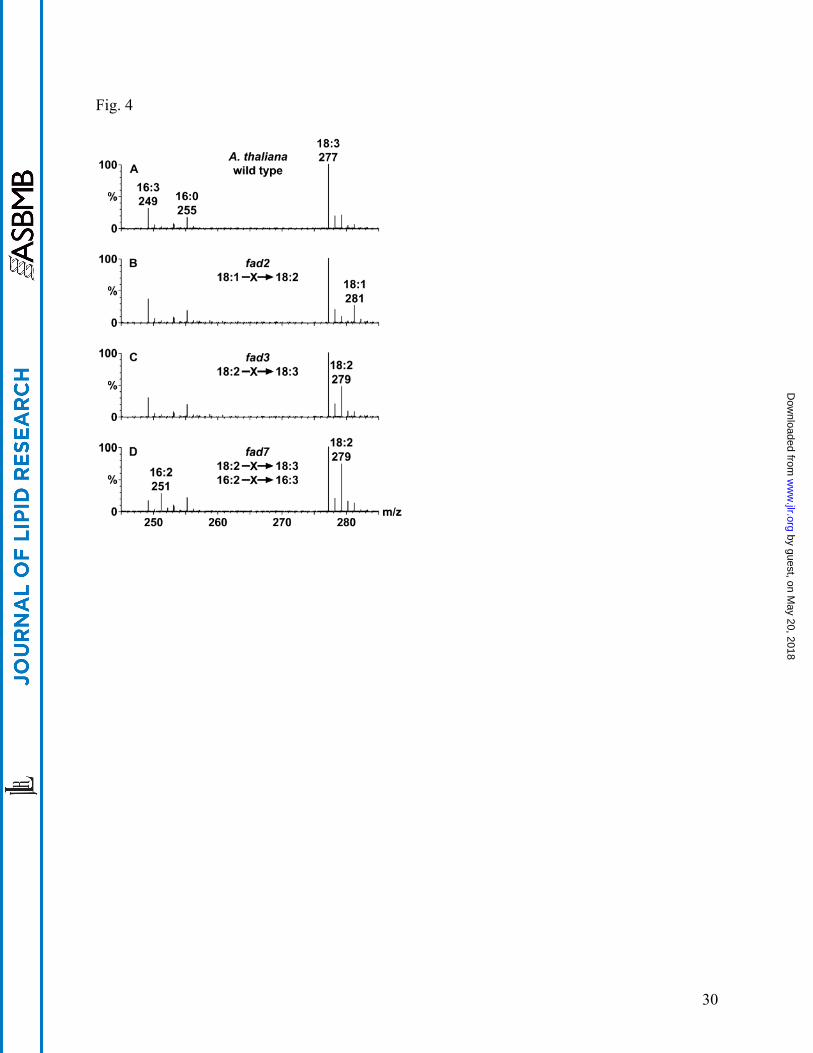
CID-TOF MS can be used to screen biological samples for alterations in fatty acid composition.
For example, mutations that affect fatty acid desaturation in Arabidopsis are easily discernable
by CID-TOF MS. Fig. 4 shows mass spectra of unfractionated extracts from wild type
Arabidopsis (Fig. 4A) and three fatty acid desaturase (fad) mutants (Fig. 4B-D). Clearly, the
fad2 mutant shows much higher levels of the 18:1 acyl chain than the wild type due to its
inability to convert 18:1 to 18:2. Likewise, fad3 shows an increased level of 18:2 and fad7
shows increased levels of 18:2 and 16:2 compared to levels in wild type Arabidopsis. The ability
of CID-TOF MS to detect and resolve normal chain fatty acyl species and acyl species
containing heteroatoms makes this technique suitable for rapid screening of biological samples to
identify both genetic alterations and physiological conditions that result in acyl species
alterations. It is anticipated that once samples are identified by CID-TOF MS screening as being
different than control or wild-type samples, a more detailed structural analysis of these samples
will be undertaken by conventional GC and/or MS methods.
In conclusion, CID-TOF MS methodology provides a rapid screening tool enabling the detection
and accurate identification of numerous acyl species from unpurified biological extracts. Time-
consuming derivatization, purification, and analysis steps are not required. Although not
absolutely quantitative, the resultant data allow quick detection of samples with alterations in
by guest, on May 20, 2018
ww
w.jlr.org
Dow
nloaded from
15
fatty acid composition which may enable elucidation of correlated genetic or physiologic
alterations.
by guest, on May 20, 2018
ww
w.jlr.org
Dow
nloaded from
16
We gratefully acknowledge the technical assistance of Bob Drake at the University of Kansas.
We also gratefully acknowledge Ashis Nandi and Kartikeya Krothapalli (working as members of
the Jyoti Shah lab at Kansas State University) for donation of the lipid extracts used for
evaluation of the Arabidopsis mutants. We thank Levi Kinderknecht and Tara Thacker for
assistance in growing plants. Work and instrument acquisition was supported by grants from
National Science Foundation (MCB 0455318 and DBI 0521587). Support of the Kansas
Lipidomics Research Center was from National Science Foundation's EPSCoR program, under
grant EPS-0236913, with matching support from the State of Kansas through Kansas
Technology Enterprise Corporation and Kansas State University, as well from NIH grant P20
RR016475 from the INBRE program of the National Center for Research Resources. The
Micromass Q-TOF2 at the University of Kansas Mass Spectrometry Laboratory was purchased
with funds from the University of Kansas, the University of Kansas Mass Spectrometry
Laboratory, and Kansas NSF EPSCoR. This is contribution 07-24-J from the Kansas
Agricultural Experiment Station.
by guest, on May 20, 2018
ww
w.jlr.org
Dow
nloaded from
17
REFERENCES 1. Kesselmeier J., and E. Heinz. 1987. Separation of molecular species of plant glycolipids and
phospholipids by high-performance liquid chromatography. Meth. Enzymol. 148: 650-661
2. Christie, W. W. 1982. Lipid Analysis. 2nd ed. Pergamon Press, Oxford, England. 73-79.
3. Mueller, M. J., L. Mène-Saffrané, C. Grun, K. Karg, and E. E. Farmer. 2006. Techniques for
molecular analysis. Oxylipin analysis methods. Plant J. 45: 472-489.
4. Schulze, B., R. Lauchli, M. M. Sonwa, A. Schmidt, and W. Boland. 2006. Profiling of
structurally labile oxylipins in plants by in situ derivatization with pentafluorobenzyl
hydroxylamine. Anal. Biochem. 348: 269-283.
5. Vollenweider, S., H. Weber, S. Stolz, A. Chételat, and E. E. Farmer. 2000. Fatty acid
ketodienes and fatty acid ketotrienes: Michael addition acceptors that accumulate in
wounded and diseased Arabidopsis leaves. Plant J. 24: 467-476.
6. Weber, H., B. A.Vick, and E. E. Farmer. 1997. Dinor-oxo-phytodienoic acid: a new
hexadecanoid signal in the jasmonate family. Proc. Natl. Acad. Sci. USA. 94: 10473-10478.
7. Hamberg, M., A. Sanz, and C. Castresana. 1999. α-Oxidation of fatty acids in higher plants.
Identification of a pathogen-inducible oxygenase (piox) as an α-dioxygenase and
biosynthesis of 2-hydroperoxylinolenic acid. J. Biol. Chem. 274: 24503-24513.
8. Buseman. C. M., P. Tamura, A. A. Sparks, E. J. Baughman, S. Maatta, J. Zhao, M. R. Roth,
S. W. Esch, J. Shah, T. D. Williams, and R. Welti. 2006. Wounding stimulates the
accumulation of glycerolipids containing oxophytodienoic acid and dinor-oxophytodienoic
acid in Arabidopsis leaves. Plant Physiol. In press.
9. Heinz, E. 1971. Semisynthetic galactolipids of plant origin. Biochim. Biophys. Acta. 231:
537-544.
by guest, on May 20, 2018
ww
w.jlr.org
Dow
nloaded from
18
10. Laudert, D., and E. W. Weiler. 1998. Allene oxide synthase: a major control point in
Arabidopsis thaliana octadecanoid signalling. Plant J. 15: 675-684.
11. Welti, R., W. Li, M. Li, Y. Sang, H. Biesiada, H. E. Zhou, C. B. Rajashekar, T. D. Williams,
and X. Wang. 2002. Profiling membrane lipids in plant stress responses. Role of
phospholipase Dα in freezing-induced lipid changes in Arabidopsis. J. Biol. Chem. 277:
31994-32002.
12. Savitzky A., M. J. E. Golay. 1964. Smoothing and differentiation of data by simplified least
squares procedures. Anal. Chem. 36: 1627-1639.
13. Morris, H. R., T. Paxton, A. Dell, J. Langhorne, M. Berg, R. S. Bordoli, J. Hoyes, and R. H.
Bateman. 1996. High sensitivity collisionally-activated decomposition tandem mass
spectrometry on a novel quadrupole/orthogonal-acceleration time-of-flight mass
spectrometer. Rapid Commun Mass Spectrom. 10: 889-896.
14. Bristow, A. W. 2006. Accurate mass measurement for the determination of elemental
formula--a tutorial. Mass Spectrom Rev. 25, 99-111.
15. Christie, W. W. 1991. Gas chromatographic analysis of fatty acid methyl ester with high
precision. Lipid Technology 3: 97-98.
16. Dodds, E. D., M. R. McCoy, L. D. Rea, and J. M. Kennish. 2005. Gas chromatographic
quantification of fatty acid methyl esters: Flame ionization detection vs. electron impact
mass spectrometry. Lipids 40: 419-428.
17. Murphy, R. C. 1993. Mass Spectrometry of Lipids. Handbook of Lipid Research, Vol. 7.
Plenum Press, New York, NY. pp. 223-226.
18. Guella, G., R. Frassanito, and I. Mancini. 2003. A new solution for an old problem: The
regiochemical distribution of the acyl chains in galactolipids can be established by
by guest, on May 20, 2018
ww
w.jlr.org
Dow
nloaded from
19
electrospray ionization tandem mass spectrometry. Rapid Communications in Mass
Spectrometry 17: 1982-1994.
19. Welti, R., W. Li, M. Li, Y. Sang, H. Biesiada, H. Zhou, C. B. Rajashekar, T. D. Williams,
and X. Wang. 2002. Profiling membrane lipids in plant stress responses. Role of
phospholipase D alpha in freezing-induced lipid changes in Arabidopsis. J. Biol. Chem. 277:
31994-32002.
20. Han, X., and R. W. Gross. 2003. Global analyses of cellular lipidomes directly from crude
extracts of biological samples by ESI mass spectrometry: a bridge to lipidomics.
J. Lipid Res. 44: 1071-1079.
21. Zien, C. A., C. Wang, X. Wang, and R. Welti. 2001. In vivo substrates and the contribution
of the common phospholipase D, PLDα, to wound-induced metabolism of lipids in
Arabidopsis. Biochim. Biophys. Acta. 1530: 236-248.
22. Devaiah, S. P., M. R. Roth, E. Baughman, M. Li, P. Tamura, R. Jeannotte, R. Welti, and X.
Wang. 2006. Quantitative profiling of polar glycerolipid species from organs of wild-type
Arabidopsis and a PHOSPHOLIPASE Dα1 knockout mutant. Phytochemistry. In press.
23. Stelmach, B. A., A. Müller, P. Hennig, S. Gebhardt, M. Schubert-Zsilavecz, and E. W.
Weiler. 2001. A novel class of oxylipins, sn1-O-(12-oxophytodienoyl)-sn2-O-
(hexadecatrienoyl)-monogalactosyl diglyceride, from Arabidopsis thaliana. J. Biol. Chem.
276: 12832-12838. Correction published, J. Biol. Chem. 276: 28628.
24. Hisamatsu, Y., N. Goto, K. Hasegawa, and H. Shigemori. 2003. Arabidopsides A and B, two
new oxylipins from Arabidopsis thaliana. Tetrahedron Lett. 44: 5553-5556.
25. Hisamatsu, Y., N. Goto, M. Sekiguchi, K. Hasegawa, and H. Shigemori. 2005. Oxylipins
arabidopsides C and D from Arabidopsis thaliana. J. Nat. Prod. 68: 600-603.
by guest, on May 20, 2018
ww
w.jlr.org
Dow
nloaded from
20
26. Creelman, R. A., and J. E. Mullet. 1997. Biosynthesis and action of jasmonates in plants.
Annu. Rev. Plant Physiol. Plant Mol. Biol. 48: 355-381.
27. Shah, J. 2005. Lipids, lipases, and lipid-modifying enzymes in plant disease resistance.
Annu. Rev. Phytopathol. 43: 229-260.
28. Kunst, L., J. Browse, and C. Somerville. 1988. Altered regulation of lipid biosynthesis in a
mutant of Arabidopsis deficient in chloroplast glycerol-3-phosphate acyltransferase activity.
Proc. Natl. Acad. Sci. USA. 85: 4143-4147.
29. Kunst, L., J. Browse, and C. Somerville. 1989. Altered chloroplast structure and function in
a mutant of Arabidopsis deficient in plastid glycerol-3-phosphate acyltransferase activity.
Plant Physiol. 90: 846-853.
by guest, on May 20, 2018
ww
w.jlr.org
Dow
nloaded from
21
FIGURE LEGENDS
Fig. 1. Effect of collision energy on acyl yield in CID-TOF of plant lipids. Centroided CID-
TOF analysis of column-purified polar lipids from wild-type Arabidopsis thaliana at collision
energies of 10 eV, 35 eV, and 60 eV (spectra A, B, and C, respectively) show that total and
relative anion yields change as a complex function of collision energy. All measured intensities
are plotted relative to the base peak intensity for the 18:3 acyl anion at 35 eV (m/z 277). The
most abundant acyl anions are labeled in (C). A mass resolution slightly better than 6000 is
more than sufficient to achieve baseline separation of peaks for the glycero-galactose fragment
of the MGDG head group (m/z 253.0923) and the nominally isobaric 16:1 acyl anion (m/z
253.2168) as shown in the inset for spectrum B (centroided data). Tiny acyl anion peaks in the
10 eV data may have been due to autolysis of the sample after column purification, because no
expected lipid head group fragments appeared above limits of detection to indicate fragmentation
had occurred in the collision cell at 10 eV. The acyl anion for 18:3 was chosen as the lock mass
for all spectra, and each spectrum is the sum of eleven 5-second scans.
Fig. 2. Effect of polar head group and position on the glycerol backbone on acyl yield via CID-
TOF. Each spectrum represents 11 scans of 5 seconds duration each, and all spectra were
acquired at 35 eV except for E, which was acquired at 10 eV. Each panel depicts a centroided
CID-TOF spectrum of an equimolar mixture of 15:0, 15:0 phosphatidylethanolamine (di15:0
PE), 17:0 free fatty acid, and an additional synthetic lipid. The additional lipid in spectrum A is
1-16:0,2-18:1 phosphatidylcholine (POPC); spectrum B, 1-18:1,2-16:0 phosphatidylcholine
(OPPC); spectrum C, 1-16:0,2-18:1 phosphatidylethanolamine (POPE); spectra D & E, 1-
by guest, on May 20, 2018
ww
w.jlr.org
Dow
nloaded from
22
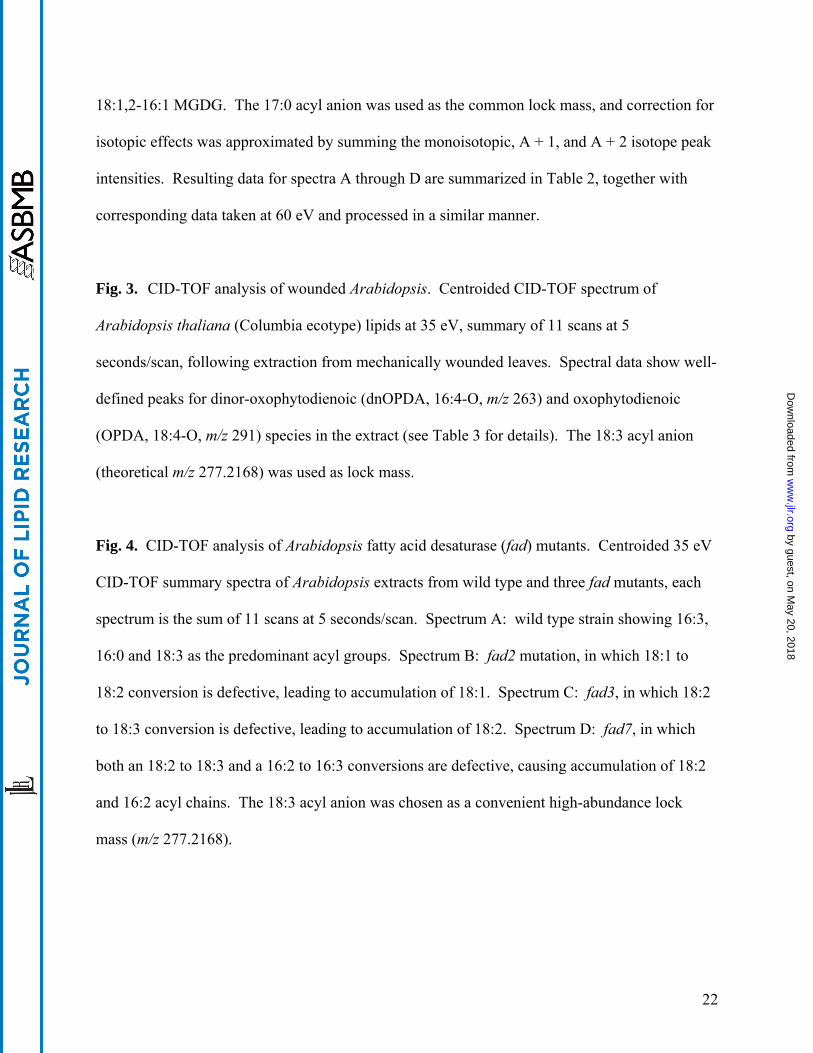
18:1,2-16:1 MGDG. The 17:0 acyl anion was used as the common lock mass, and correction for
isotopic effects was approximated by summing the monoisotopic, A + 1, and A + 2 isotope peak
intensities. Resulting data for spectra A through D are summarized in Table 2, together with
corresponding data taken at 60 eV and processed in a similar manner.
Fig. 3. CID-TOF analysis of wounded Arabidopsis. Centroided CID-TOF spectrum of
Arabidopsis thaliana (Columbia ecotype) lipids at 35 eV, summary of 11 scans at 5
seconds/scan, following extraction from mechanically wounded leaves. Spectral data show well-
defined peaks for dinor-oxophytodienoic (dnOPDA, 16:4-O, m/z 263) and oxophytodienoic
(OPDA, 18:4-O, m/z 291) species in the extract (see Table 3 for details). The 18:3 acyl anion
(theoretical m/z 277.2168) was used as lock mass.
Fig. 4. CID-TOF analysis of Arabidopsis fatty acid desaturase (fad) mutants. Centroided 35 eV
CID-TOF summary spectra of Arabidopsis extracts from wild type and three fad mutants, each
spectrum is the sum of 11 scans at 5 seconds/scan. Spectrum A: wild type strain showing 16:3,
16:0 and 18:3 as the predominant acyl groups. Spectrum B: fad2 mutation, in which 18:1 to
18:2 conversion is defective, leading to accumulation of 18:1. Spectrum C: fad3, in which 18:2
to 18:3 conversion is defective, leading to accumulation of 18:2. Spectrum D: fad7, in which
both an 18:2 to 18:3 and a 16:2 to 16:3 conversions are defective, causing accumulation of 18:2
and 16:2 acyl chains. The 18:3 acyl anion was chosen as a convenient high-abundance lock
mass (m/z 277.2168).
by guest, on May 20, 2018
ww
w.jlr.org
Dow
nloaded from
23
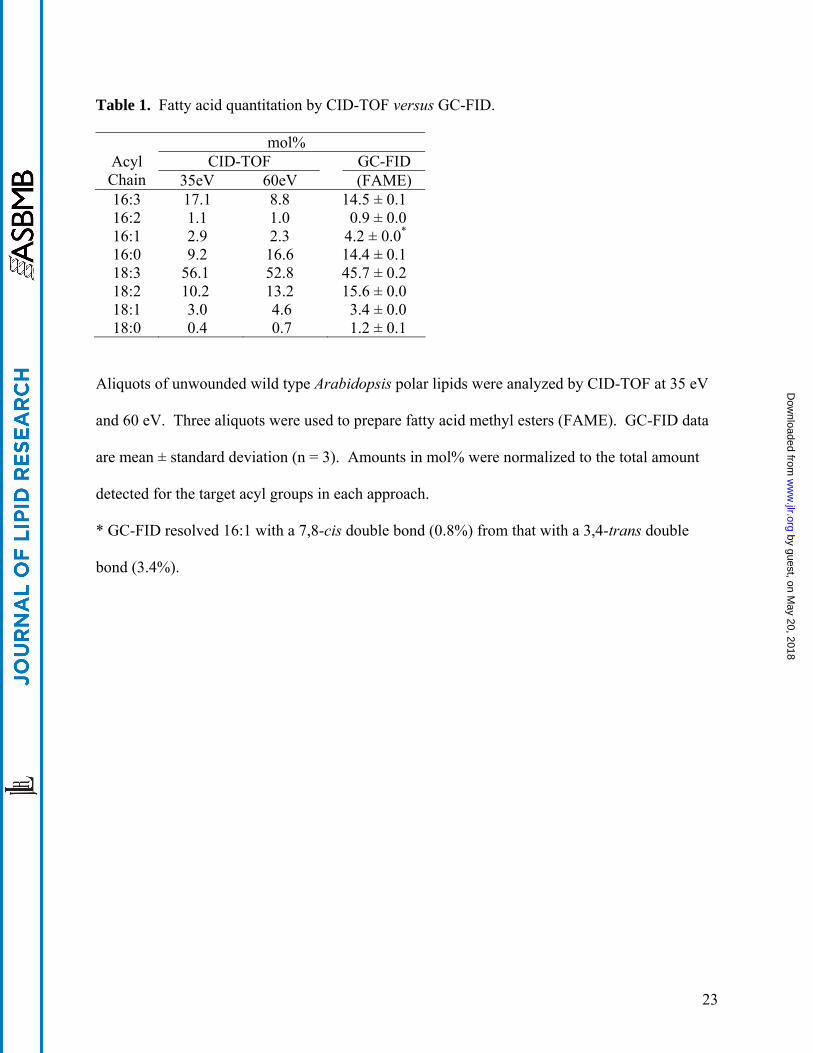
Table 1. Fatty acid quantitation by CID-TOF versus GC-FID.
mol% CID-TOF GC-FID Acyl
Chain 35eV 60eV (FAME) 16:3 17.1 8.8 14.5 ± 0.1 16:2 1.1 1.0 0.9 ± 0.0 16:1 2.9 2.3 4.2 ± 0.0* 16:0 9.2 16.6 14.4 ± 0.1 18:3 56.1 52.8 45.7 ± 0.2 18:2 10.2 13.2 15.6 ± 0.0 18:1 3.0 4.6 3.4 ± 0.0 18:0 0.4 0.7 1.2 ± 0.1
Aliquots of unwounded wild type Arabidopsis polar lipids were analyzed by CID-TOF at 35 eV
and 60 eV. Three aliquots were used to prepare fatty acid methyl esters (FAME). GC-FID data
are mean ± standard deviation (n = 3). Amounts in mol% were normalized to the total amount
detected for the target acyl groups in each approach.
* GC-FID resolved 16:1 with a 7,8-cis double bond (0.8%) from that with a 3,4-trans double
bond (3.4%).
by guest, on May 20, 2018
ww
w.jlr.org
Dow
nloaded from
24
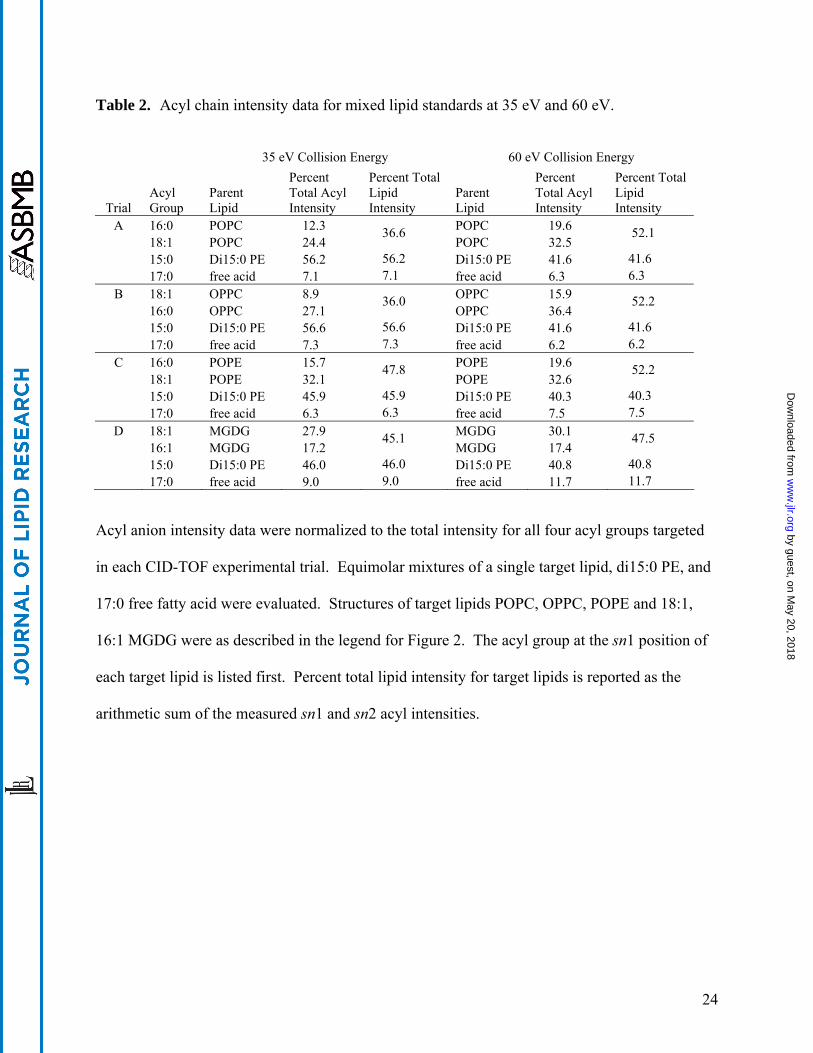
Table 2. Acyl chain intensity data for mixed lipid standards at 35 eV and 60 eV.
35 eV Collision Energy 60 eV Collision Energy
Trial Acyl Group
Parent Lipid
Percent Total Acyl Intensity
Percent Total Lipid Intensity
Parent Lipid
Percent Total Acyl Intensity
Percent Total Lipid Intensity
A 16:0 POPC 12.3 POPC 19.6 18:1 POPC 24.4
36.6 POPC 32.5
52.1
15:0 Di15:0 PE 56.2 56.2 Di15:0 PE 41.6 41.6 17:0 free acid 7.1 7.1 free acid 6.3 6.3
B 18:1 OPPC 8.9 OPPC 15.9 16:0 OPPC 27.1
36.0 OPPC 36.4
52.2
15:0 Di15:0 PE 56.6 56.6 Di15:0 PE 41.6 41.6 17:0 free acid 7.3 7.3 free acid 6.2 6.2
C 16:0 POPE 15.7 POPE 19.6 18:1 POPE 32.1
47.8 POPE 32.6
52.2
15:0 Di15:0 PE 45.9 45.9 Di15:0 PE 40.3 40.3 17:0 free acid 6.3 6.3 free acid 7.5 7.5
D 18:1 MGDG 27.9 MGDG 30.1 16:1 MGDG 17.2
45.1 MGDG 17.4
47.5
15:0 Di15:0 PE 46.0 46.0 Di15:0 PE 40.8 40.8 17:0 free acid 9.0 9.0 free acid 11.7 11.7
Acyl anion intensity data were normalized to the total intensity for all four acyl groups targeted
in each CID-TOF experimental trial. Equimolar mixtures of a single target lipid, di15:0 PE, and
17:0 free fatty acid were evaluated. Structures of target lipids POPC, OPPC, POPE and 18:1,
16:1 MGDG were as described in the legend for Figure 2. The acyl group at the sn1 position of
each target lipid is listed first. Percent total lipid intensity for target lipids is reported as the
arithmetic sum of the measured sn1 and sn2 acyl intensities.
by guest, on May 20, 2018
ww
w.jlr.org
Dow
nloaded from
25
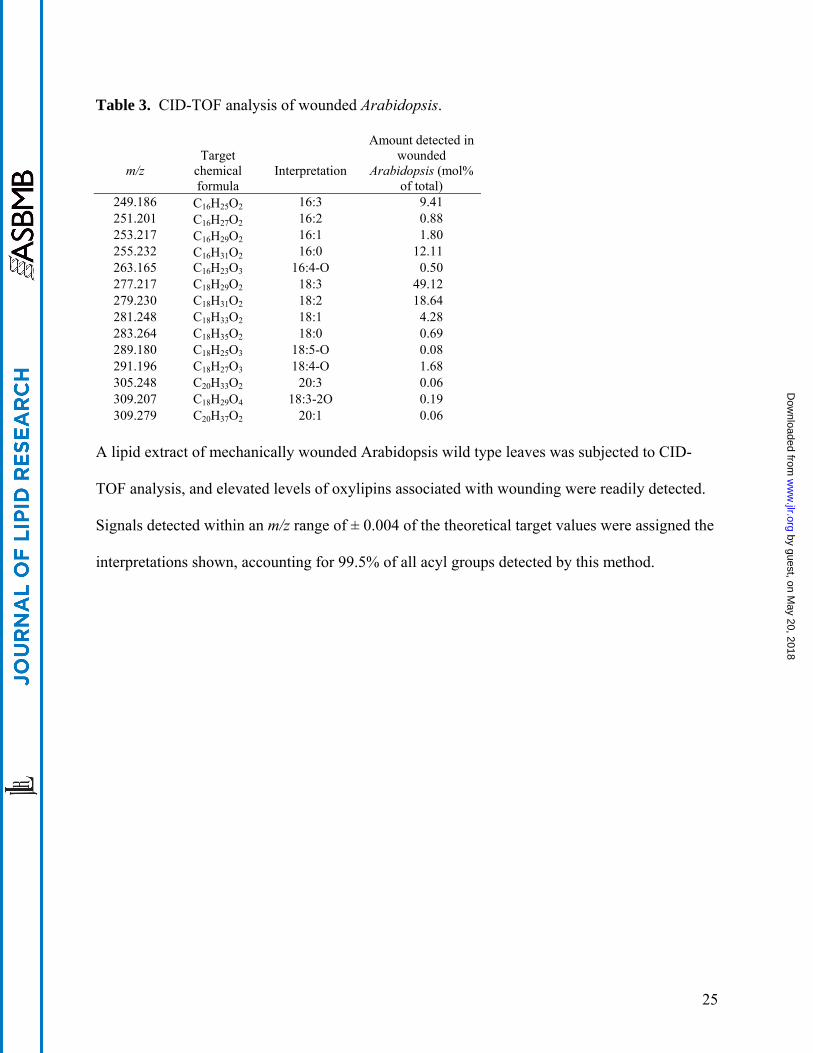
Table 3. CID-TOF analysis of wounded Arabidopsis.
m/z
Target
chemical formula
Interpretation
Amount detected in wounded
Arabidopsis (mol% of total)
249.186 C16H25O2 16:3 9.41 251.201 C16H27O2 16:2 0.88 253.217 C16H29O2 16:1 1.80 255.232 C16H31O2 16:0 12.11 263.165 C16H23O3 16:4-O 0.50 277.217 C18H29O2 18:3 49.12 279.230 C18H31O2 18:2 18.64 281.248 C18H33O2 18:1 4.28 283.264 C18H35O2 18:0 0.69 289.180 C18H25O3 18:5-O 0.08 291.196 C18H27O3 18:4-O 1.68 305.248 C20H33O2 20:3 0.06 309.207 C18H29O4 18:3-2O 0.19 309.279 C20H37O2 20:1 0.06
A lipid extract of mechanically wounded Arabidopsis wild type leaves was subjected to CID-
TOF analysis, and elevated levels of oxylipins associated with wounding were readily detected.
Signals detected within an m/z range of ± 0.004 of the theoretical target values were assigned the
interpretations shown, accounting for 99.5% of all acyl groups detected by this method.
by guest, on May 20, 2018
ww
w.jlr.org
Dow
nloaded from
26
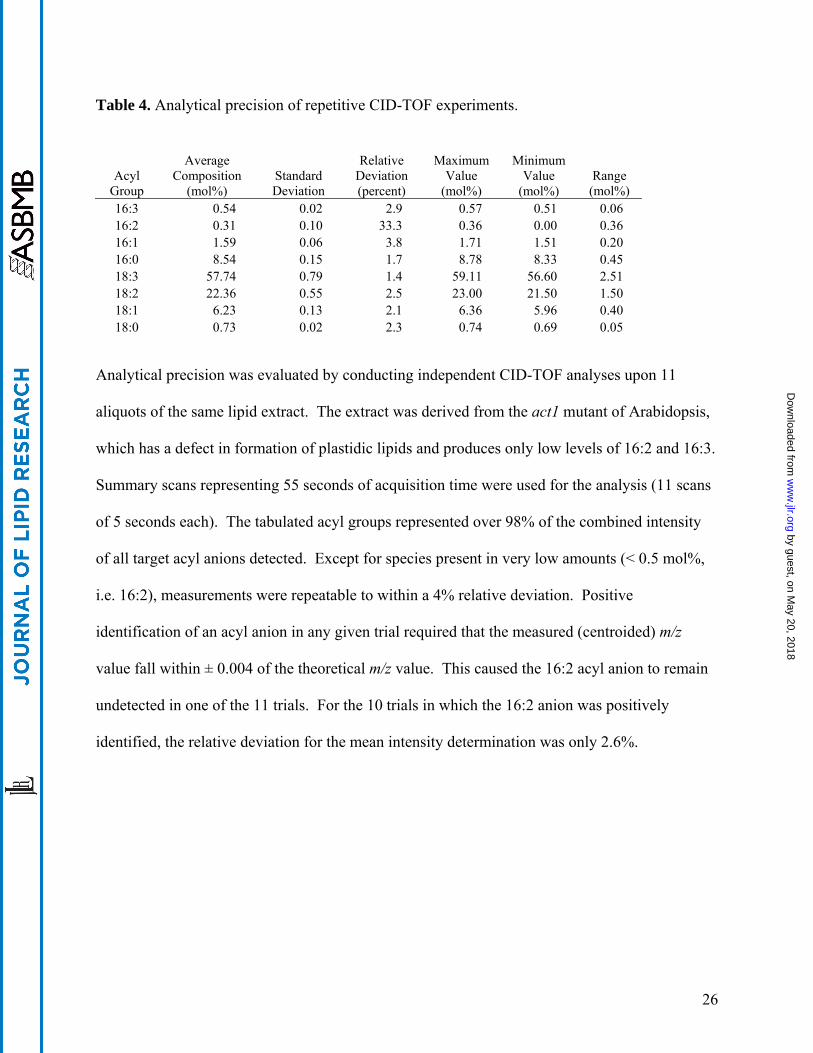
Table 4. Analytical precision of repetitive CID-TOF experiments.
Acyl Group
Average Composition
(mol%) Standard Deviation
Relative Deviation (percent)
Maximum Value
(mol%)
Minimum Value
(mol%) Range
(mol%) 16:3 0.54 0.02 2.9 0.57 0.51 0.06 16:2 0.31 0.10 33.3 0.36 0.00 0.36 16:1 1.59 0.06 3.8 1.71 1.51 0.20 16:0 8.54 0.15 1.7 8.78 8.33 0.45 18:3 57.74 0.79 1.4 59.11 56.60 2.51 18:2 22.36 0.55 2.5 23.00 21.50 1.50 18:1 6.23 0.13 2.1 6.36 5.96 0.40 18:0 0.73 0.02 2.3 0.74 0.69 0.05
Analytical precision was evaluated by conducting independent CID-TOF analyses upon 11
aliquots of the same lipid extract. The extract was derived from the act1 mutant of Arabidopsis,
which has a defect in formation of plastidic lipids and produces only low levels of 16:2 and 16:3.
Summary scans representing 55 seconds of acquisition time were used for the analysis (11 scans
of 5 seconds each). The tabulated acyl groups represented over 98% of the combined intensity
of all target acyl anions detected. Except for species present in very low amounts (< 0.5 mol%,
i.e. 16:2), measurements were repeatable to within a 4% relative deviation. Positive
identification of an acyl anion in any given trial required that the measured (centroided) m/z
value fall within ± 0.004 of the theoretical m/z value. This caused the 16:2 acyl anion to remain
undetected in one of the 11 trials. For the 10 trials in which the 16:2 anion was positively
identified, the relative deviation for the mean intensity determination was only 2.6%.
by guest, on May 20, 2018
ww
w.jlr.org
Dow
nloaded from