Embed Size (px)
Citation preview

RESEARCH ARTICLE
Rapid detection of Escherichia coli using
bacteriophage-induced lysis and image
analysis
Xu Yang1¤, Nicharee Wisuthiphaet1, Glenn M. Young1, Nitin Nitin1,2*
1 Department of Food Science and Technology, University of California, Davis, Davis, California, United
States of America, 2 Department of Biological and Agricultural Engineering, University of California, Davis,
Davis, California, United States of America
¤ Current address: Nutrition and Food Science Department, California State Polytechnic University Pomona,
Pomona, CA, United States of America
Abstract
Rapid detection of bacterial pathogens is a critical unmet need for both food and environ-
mental samples such as irrigation water. As a part of the Food safety Modernization Act
(FSMA), The Produce Safety rule has established several requirements for testing for the
presence of generic Escherichia coli in water, but the current method available for testing
(EPA M1603) demands specified multiple colony verification and highly trained personnel to
perform these tests. The purpose of the study was to assess a phage induced bacterial lysis
using quantitative image analysis to achieve rapid detection of E. coli at low concentrations
within 8 hours. This study aimed to develop a simple yet highly sensitive and specific
approach to detect target bacteria in complex matrices. In the study, E. coli cells were first
enriched in tryptic soy broth (TSB), followed by T7 phage induced lysis, concentration, stain-
ing and fluorescent imaging. Image analysis was conducted including image pre-process-
ing, image segmentation and quantitatively analysis of cellular morphological features
(area, eccentricity and full width at half maximum). Challenge experiments using realistic
matrices, including simulated fresh produce wash water, coconut water and spinach wash
water, demonstrated the method can be applied for use in situations that occur in food pro-
cessing facilities. The results indicated E. coli cells that are lysed by T7 phages demon-
strated significantly (P < 0.05) higher extracellular DNA release, altered cellular shape (from
rod to circular) and diffused fluorescent signal intensity. Using this biosensing strategy, a
sensitivity to detect Escherichia coli at 10 CFU/ml within 8 hours was achieved, both in labo-
ratory medium and in complex matrices. The proposed phage based biosensing strategy
enables rapid detection of bacteria and is applicable to analysis of food systems. Further-
more, the steps involved in this assay can be automated to enable detection of target bacte-
ria in food facilities without extensive resources.
PLOS ONE
PLOS ONE | https://doi.org/10.1371/journal.pone.0233853 June 5, 2020 1 / 19
a1111111111
a1111111111
a1111111111
a1111111111
a1111111111
OPEN ACCESS
Citation: Yang X, Wisuthiphaet N, Young GM, Nitin
N (2020) Rapid detection of Escherichia coli using
bacteriophage-induced lysis and image analysis.
PLoS ONE 15(6): e0233853. https://doi.org/
10.1371/journal.pone.0233853
Editor: Chitrita DebRoy, The Pennsylvania State
University, UNITED STATES
Received: February 1, 2020
Accepted: May 13, 2020
Published: June 5, 2020
Copyright: © 2020 Yang et al. This is an open
access article distributed under the terms of the
Creative Commons Attribution License, which
permits unrestricted use, distribution, and
reproduction in any medium, provided the original
author and source are credited.
Data Availability Statement: All relevant data are
within the paper and its Supporting Information
files.
Funding: This project was funded by USDA-NIFA
Program Enhancing Food Safety through Improved
Processing Technologies (A4131) with grant no.
2015-68003-23411. The funders had no role in
study design, data collection and analysis, decision
to publish, or preparation of the manuscript.
Competing interests: The authors have declared
that no competing interests exist.

Introduction
As part of the Food Safety Modernization Act (FSMA), The Produce Safety rule has established
several standards for testing for the presence of generic Escherichia coli in water. For instance,
no E. coli shall be detected in water that is directly used to contact any fresh produce after har-
vest or food-contact surfaces. In addition, agricultural water that is applied for irrigation pro-
duce crops should contain equal or less than 126 colony forming unit (CFU) per 100 ml of
tested water [1]. To comply with The Produce Safety rule, sensitive, cost-effective and rapid
methods for E. coli detection are desired. Ideally, a method for E. coli detection should be com-
pleted within 8-hours to match the typical work-shift schedule of most fresh produce packag-
ing operations with a product that has a relatively short shelf-life [2]. The current method for
generic E. coli detection in agricultural water is based on the U.S. Environmental Protection
Agency Method 1603 (EPA M1603). This method requires specified multiple colony verifica-
tion and highly trained personnel to perform a test. Furthermore, there is significant subjectiv-
ity in evaluating the false positive results [3].
Complementary to conventional detection approaches, lytic bacteriophages (phages) have
also been evaluated as a bio-sensing element for the detection of bacteria. The extraordinary
host specificity of phages for their host provides a naturally occurring event that can be co-
opted into a method for bacterial pathogen detection [4]. In addition, the rapidity of phage
multiplication provides a "built-in" amplification step that can be detected within a time-frame
of hours [5]. Based on these advantages, a variety of phage-based biosensing technologies have
been developed. Phage typing is a classical phage-based culture method for detecting specific
bacterial pathogens. The formation of a visually observed clear plaque indicates the presence
of a bacterial host specific to the phages supplemented [6]. The optical approach of detection
involves monitoring the decrease of turbidity by using a spectrophotometer [7]. However,
both visual and optical methods need relatively high number of host cells, which could be time
consuming. Detection of phage-bacteria complex formation is another phage-based biosensing
strategy. The phage-bacteria complex forms upon infection with high specificity and stability.
One approach to detect the complex is to fluorescently label phages, followed by absorption
phages onto bacteria. Then, by using flow cytometry or fluorescent microscopy, phage-bacteria
complex can be detected [8–10]. The assay is simple and straightforward, but the fluorescent
signal from only phages has a low signal-to-noise ratio [11]. Another phage-based biosensing
technique is through utilization of reporter phages, which carry genetically modified reporter
genes to manipulate host bacteria metabolic process [5]. Several studies have exploited this
concept to develop genetically modified reporter phages to overexpress β-galactosidase or alka-
line phosphatase [12–14]. However, the current approaches based on reporter phages may add
more complexity and capital cost to the detection process.
As described above, a variety of phage-based biosensing approaches have been developed,
but each method has some limitations. The current study was aimed at developing a novel,
rapid and sensitive detection for E. coli through microscopy and image analysis. Imaging using
fluorescence microscopy combined with automated image analysis is a promising alternative
approach that allows improved sensitivity and reduced complexity of bacteria detection
method protocols.
Microscopic imaging is able to focus on the fluorescence signal from an individual bacterial
cell; therefore, it provides a single-cell level of detection sensitivity [15]. Implementing imaging
and image analysis for bacteria detection has a potential to develop detection methods that
require simple instrumental setup such as fluorescence microscope or even the miniaturized
versions of microscope for field detection. The imaging procedure and image analysis can be
PLOS ONE Escherichia coli detection by bacteriophage lysis and image analysis
PLOS ONE | https://doi.org/10.1371/journal.pone.0233853 June 5, 2020 2 / 19
automated which allow simple and user-friendly detection protocol with no specialized trained
personnel required, and the simplified protocol results in more time-effective detection.
Moreover, imaging and image analysis process can be performed in the field since the asep-
tic technique environment is not required, unlike nucleic acid-based detection approaches
which need to be conducted in a molecular laboratory. In the food industry, imaging and
image analysis may not be commonly employed in food safety and quality control assay, but
this approach has been widely used for medical diagnostic purposes. Currently, imaging proce-
dures have been applied to detect that malaria parasite, Plasmodium, infection of red blood
cells, based on cellular morphology using a simple cellphone-based microscopy which applica-
ble to low-cost in-the-field optical diagnostics of malaria [16].
The biosensing strategy in this study focuses on detection of E. coli through phage-induced
lysis in authentic food samples and artificial wash water supplemented with organic chemicals
simulating a chemical oxygen demand (COD) of wash water. Phages are well characterized for
producing endolysin which could induce explosive host cell lysis [17]. As shown in Fig 1, the
life cycle of lytic T7 phages starts when the specialized adsorption structures, called T7 tail
fibers, bind to receptor molecules on E. coli BL21 (Step 1). Injection of phage DNA occurs
when the phage tail tube punctures the membrane layers of E. coli, which is followed by injec-
tion of the viral genome into the cytoplasm of the host cell (step 2) [18,19]. Immediately after
injection of the T7 phage genome, replication of the phage genome occurs; a process that
involved co-opting of host cellular machinery. During this stage numerous copies of the phage
genomic DNA are synthesized (step 3). Subsequently, protein subunits of the phage particle
are synthesized and assemble into procapsids. During the final step a copy of the phage geno-
mic DNA is packaged procapsids (step 4). Mature phages are then liberated by host cell lysis
with the aid of two specific enzymes, holin and lysin. Bacterial host cells that undergo phage-
induced lysis in Fig 1 illustrate a significant change in their cellular morphology, proposed as
“rod-to-round” transition [20], followed by intracellular to extracellular DNA release, defined
as environmental DNA (eDNA). Cellular morphology changes and eDNA release from host
bacteria can be visualized under a microscope, coupled with a simple DNA stains and further
fluorescence image analysis using BacFormatics v0.7 developed in MATLAB [20]. The key
advantage of fluorescence image analysis is the higher signal-to-noise ratio and increased
detection sensitivity, which hypothetically allows low detection limit at low concentrations of
E. coli in a variety of different food matrices.
Materials and methods
Chemical reagents
SYBR Green I nucleic acid stain, 10,000× concentrate was purchased from Invitrogen, USA,
and a working solution of 10× SYBR Green I was prepared in Milli-Q water. p-Phenylenedia-
mine and chloroform were obtained from Acros Organic (Fair Lawn, NJ, USA) and a 10%
(wt/vol) stock solution of p-phenylenediamine was prepared in Milli-Q water. Whatman1
anodisc inorganic filter membrane (13 mm, 0.02 μm pore size) was obtained from GE Health-
care (Buckinghamshire, UK). Microscopic slide was obtained from VWR international (Rad-
nor, PA, USA). Tryptic soy broth (TSB) and tryptic soy agar (TSA) were obtained from Sigma-
Aldrich (St. Louis, MO, USA). Filtration system, cover glass and Luria Bertani (LB) broth were
obtained from Fisher Scientific (Pittsburgh, PA, USA). Phosphate buffered saline (PBS) was
purchased from Fisher Bioreagents (Fair Lawn, NJ, USA). Polycarbonate filter (20 um pore
size, 47 mm diameter) was purchased from Maine Manufacturing (ME, USA). Milli-Q water
was produced by QPAK1 2 purification system (EMD Millipore, Billerica, MA, USA).
PLOS ONE Escherichia coli detection by bacteriophage lysis and image analysis
PLOS ONE | https://doi.org/10.1371/journal.pone.0233853 June 5, 2020 3 / 19

PLOS ONE Escherichia coli detection by bacteriophage lysis and image analysis
PLOS ONE | https://doi.org/10.1371/journal.pone.0233853 June 5, 2020 4 / 19

Bacterial cultures and phage preparation
Both E. coli BL21 (ATCC BAA-1025) and bacteriophage T7 (ATCC BAA-1025-B2) were
obtained from American type culture collection. E. coli BL21 was cultured in TSB broth at
37˚C for 16 hours before use.
Bacteriophages were propagated as the following procedure. Bacteriophages were first inoc-
ulated into log-phase E. coli BL21 culture at the ratio of 1:100 (phage:bacteria). The mixture
was then incubated at 37˚C for 15 min for initial infection and then centrifuged at 16100 × gfor 10 min. Supernatant was discarded and the same volume of TSB was added to resuspend
the pellet, followed by incubating at 37˚C with 200 rpm shaking until no visible turbidity was
observed. Chloroform was then added to the final concentration at 20% (vol/vol) and incu-
bated at 4˚C overnight. Then, chloroform added mixture was centrifuged at 5,000 × g for 10
min and water phase was collected. The water phase which contained free phages, TSB
medium and bacterial host lysis debris was then centrifuged again at 16100 × g for 10 min. Pel-
let was washed for one time and resuspended in PBS at the population of 109 PFU/ml phage
concentration.
T7 phage induced E. coli cell lysis
T7 phage induced E. coli cell lysis was conducted in two modes: low titer co-incubation lysis
(LTCL) and high titer two-step lysis (HTTL). LTCL refers to co-incubation of low initial phage
concentration (102 PFU/ml) with E. coli in TSB. LTCL allows for initial growth of E. coli with
delayed lysis. HTTL refers to enriching E. coli first in TSB, followed by inoculation of high titer
phage concentration (107 PFU/ml) to induce lysis for 20 min.
E. coli cellular morphological change and eDNA release during LTCL
The dynamic morphological change of E. coli and release of eDNA were analyzed through
LTCL during extended lysis period as reported earlier [7,21]. Briefly, overnight E. coli BL21
cultures were precipitated, washed and resuspended in PBS. A 50-ml falcon tube containing 10
ml TSB pre-warmed at 37˚C was prepared and inoculated with 103 CFU/ml E. coli BL21 and
102 PFU/ml T7 phage. The inoculated tube was then incubated at 37˚C in shaking incubator
for 2, 3 and 4 hours and 2 ml of the aliquot was taken at each time point, respectively. Then,
aliquots from each time point were filtered through anodiscs and subsequently stained with
SYBR Green I. The filtration and staining process were conducted according to published pro-
tocol [22]. Briefly, the filtration system was made up of a filtering flask, a fritted glass base and
a polycarbonate filter. The anodisc filter was directly located on top of the polycarbonate filter,
with the glass base and filtering flask attached underneath. Aliquot from each tube was gently
pipetted onto their respective anodisc for filtration. After filtration, anodisc was carefully
removed from the polycarbonate filter onto a microscopic slide pre-spotted with 20 μl of
SYBR Green I stock solution. The anodisc was then transferred directly onto the SYBR Green I
drop with backside down since the stain can easily pass through the anodisc to stain the micro-
organisms on the topside. The anodisc was later stained in a dark laboratory bench drawer for
20 min before the dye was removed by gently rubbing the backside anodisc filter against a
Kimwipe. In the meanwhile, 1% of p-phenylenediamine was prepared from the 10% stock
solution as anti-fading reagent. After staining and removal of excess dyes, the anodisc was
Fig 1. Life cycle of lytic T7 phages. Step 1, attachment of T7 phage on host; step 2, phage DNA injection into bacterial host; step 3,
phage hijack bacteria metabolism and multiplication of phage DNA; step 4, production of new capsids and assembly of phages;
step 5, host cell lysis and eDNA release.
https://doi.org/10.1371/journal.pone.0233853.g001
PLOS ONE Escherichia coli detection by bacteriophage lysis and image analysis
PLOS ONE | https://doi.org/10.1371/journal.pone.0233853 June 5, 2020 5 / 19

transferred directly onto a new microscopic slide with 20 μl anti-fading reagent drop. The ano-
disc was eventually covered with a cover glass and observed under an Olympus IX-71 inverted
research fluorescence microscope with a ×100 (1.25 NA) objective lens, a CCD (charge cou-
pled device) camera (Model C4742-80-12AG, Hamamatsu, Tokyo, Japan) and Metamorph
imaging software (version 7.7.2.0, Universal Imaging Corporation). An average of 10–12
images were taken for each anodisc sample. The fluorescence excitation/emission wavelength
of SYBR Green I stain was 480 ± 30 and 535 ± 40 nm, respectively. Negative controls were per-
formed at the same condition except for adding phages. All conditions including negative con-
trols were performed in triplicates.
Characterization of E. coli morphological change and eDNA release
through LTCL
Similar experimental procedure was followed as described in the previous section. Three 50 ml
falcon tubes (A, B, and C) containing 10 ml TSB were prepared and inoculated with 102 PFU/
ml T7 phages in each tube. Tube A received E. coli inoculation at 102 CFU/ml, tube B received
E. coli inoculation at 103 CFU/ml while tube C received E. coli inoculation at 104 CFU/ml. All
tubes were then incubated at 37˚C with 200 rpm shaking for 2, 3 and 4 hours, respectively.
After incubation, contents from each tube were filtered onto their respective anodisc, and sub-
sequently stained and observed under fluorescence microscope as described earlier. Negative
controls were conducted at the same condition without phage inoculation. Both phage supple-
mented groups and negative controls were performed in triplicates.
Characterization of E. coli morphological change and eDNA release
through HTTL
To start with, three 50 ml falcon tubes (A, B, and C) each containing 5 ml of TSB were pre-
pared and pre-warmed in 37˚C water bath before inoculation. Overnight E. coli BL21 cultures
were precipitated, washed and resuspended in PBS, followed by inoculation in tube A, B and C
at 101, 102 and 103 CFU/ml, respectively. All tubes were then incubated at 37˚C with 200 rpm
shaking for 5, 4 and 2 hours, respectively. After incubation, T7 phages were inoculated in all
tubes at 107 PFU/ml, followed by lysis at the same condition for 20 min. Then, aliquots from
each tube were filtered through anodiscs, and were subsequently stained with SYBR Green and
observed under the microscope as described earlier. Negative controls were performed at the
same condition without phage addition. All conditions including negative controls were per-
formed in triplicates.
Validation of the biosensing approach in realistic food items
HTTL was chosen to be a more robust, consistent and sensitive approach for analyzing mor-
phological change and eDNA release of E. coli in realistic food matrices, including artificial
wash water, coconut water and spinach wash water. Coconut water was selected as a challeng-
ing matrix as it contains sugars, amino acids, vitamins and phytohormones [23]. Artificial
wash water was created by adding LB broth to sterile water to achieve a final COD at
1,000 ppm, which is comparable to fresh-cut produce wash water in industry [24]. Both coco-
nut water and artificial wash water were inoculated with E. coli at 10 CFU/ml, followed by mix-
ing with double strength TSB at 1:1 (vol/vol) ratio for pre-enrichment. The mixture was then
shaking incubated at 37˚C for 5 hours and subsequently lysed with 107 PFU/ml T7 phages for
20 min. Content after lysis was filtered onto anodisc, stained and visualized under a micro-
scope. Negative control without phage lysis was also conducted and both conditions were
PLOS ONE Escherichia coli detection by bacteriophage lysis and image analysis
PLOS ONE | https://doi.org/10.1371/journal.pone.0233853 June 5, 2020 6 / 19

performed in triplicates. For spinach wash water, detailed sample preparation is described in
the supporting information.
Image analysis—preprocessing
All images were subjected to analysis by MatlabTM 2017a software (Mathworks, Natick, Mass.,
USA) to generate binary images, followed by quantification of morphological features. Before
binary images conversion, a series of image pre-processing functions were applied to enhance
image visual experience, remove uneven background illumination and adjust for fluctuation
in data acquisition. Specifically, to best represent the visual appearance of images, strel func-
tion was applied to create a disk-shaped structuring element, at the radius of 30 pixels [25].
Then, imtophat function was applied to remove uneven background illumination from an
image with a dark background [26]. Images were then processed by median filtering (medfilt2function) in two dimensions: each output pixel equals to the average of the median value in a
3 × 3 adjacent corresponding pixels in the input image. By applying the median filtering, the
fluctuations of signal during acquisition process can be removed, without compromising the
sharpness of the image [27]. To enhance the contrast of the grayscale images, adapthisteq func-
tion was then used to adjust images, followed by smoothing the images using low-pass Wiener
filter. The Wiener filter removes the constant additive noise (Gaussian white noise) to preserve
edges or other high-frequency parts of an image [27].
Image analysis–image segmentation and quantification of morphological
features
The overall goal of image segmentation was to identify boundaries of each E. coli cell and mea-
sure changes of cellular areas and shapes. Segmented images were then converted to binary
images based on a global threshold. Binarization of images was a key step toward quantitative
interpretation of image data from computer-aided machine vision, as opposed to human
vision. To be more specific, graythresh function was applied to produce a global threshold. The
graythresh function was based on Otsu’s method which minimizes the intraclass variance
between black and white pixels [28]. Then, the binary images were created based on the thresh-
old generated from graythresh function. Basically, any point (x, y) in the input image which
has the function of f (x, y)�T is going to be designated as a white pixel (object) while other
point which has f (x, y)< T is going to be served as a black pixel (background). Generation of
binary image was created by imbinarize function [27]. To further ease the process of image
analysis, imfill function was applied to fill holes in the input binary image. The holes are
defined as background pixels (black) that are surrounded by the object pixels (white) [27]. In
several cases, some small particles may show up as SYBR green I can occasionally stain non-
specifically on anodisc. The function bwareaopen was then applied to remove any particles
that are less than 300 pixels [29].
After binary images were created, modified and cleaned, quantification of morphological
features was achieved using regionprops function. Bacteria did not undergo phage induced
lysis has a rod shape, with confined DNA region. In comparison, bacteria that underwent
phage lysis appeared as round shape, with diffuse distribution of released eDNA stained by
SYBR Green I. To statistically and objectively compare the cellular morphology change and
release of eDNA, “area” and “eccentricity” were chosen as two parameters representing the rel-
ative cellular morphology change. The property ‘area’ refers to the actual number of pixels in
an object region which can be correlated with eDNA release (bigger area, more eDNA release)
and the property “eccentricity” refers to the shape of an ellipse, and it measures the distance
ratio between the foci of the ellipse and the length of its major axis. The ratio value of
PLOS ONE Escherichia coli detection by bacteriophage lysis and image analysis
PLOS ONE | https://doi.org/10.1371/journal.pone.0233853 June 5, 2020 7 / 19

“eccentricity” is between 0 to 1 where 0 refers to a circle and 1 refers to a line segment. “Eccen-
tricity” parameter is associated with the shape of bacteria where the rod shape bacteria have
eccentricity closer to 1 while lysed round bacteria shape has eccentricity closer to 0.
The fluorescence intensity distribution was another morphological property chosen to
detect the cellular shape change due to the release of the internal DNA which was represented
by the full width at half maximum (FWHM) of the intensity distribution curve. For image
analysis, all fluorescence images were analyzed by the ImageJ. The FWHM_Line plug-in was
used to generate two-dimensional graph of the intensities of pixels along a 100-pixel line that
was drawn across the cross-section of individual cells. The intensity distribution data was fitted
to the Gaussian distribution and the full width at half maximum was measured.
Statistical analysis
All conditions that were subjected to area, eccentricity, and intensity distribution analysis were
conducted in triplicate and from each replicate, 5–8 images per replicate were selected for
analysis. The total number of 15–20 images were analyzed, containing total objects equal or
larger than 100 (N�100). Area, eccentricity, and FWHM value were generated from each
image and averaged. Mean value of area, eccentricity, and FWHM were statistically compared
between phage-lysed images and their corresponding negative controls, using SAS 9.4 (SAS
Institute Inc., Cary, NC) by Tukey’s honest significant difference (HSD) test to compare the
means.
Results
E. coli cellular morphological change and eDNA release during LTCL
The overall goal of this set of experiments was to develop imaging-based framework for char-
acterizing changes in cellular morphology and release of eDNA following the lysis of E. colicells with phages during LTCL incubation conditions. As represented in Fig 2, the initial
phage concentration was 102 PFU/ml and E. coli BL21 was at 103 CFU/ml in TSB. The phage-
E. coli mixture was then incubated for 2 and 3 hours at 37˚C and images were captured as
shown in Fig 2A and 2C, respectively. In comparison, the negative control without adding
phages were also performed under the same conditions, as shown in Fig 2B and 2D, respec-
tively. As illustrated in Fig 2A and 2B, co-incubating phage and bacteria for 2 hours did result
in observed cellular morphology change or eDNA release. After 3 hours, cell lysis was
observed, as shown in Fig 2C, with the transition from rod-shaped cells to round-shaped cells.
The release of eDNA, as seen in Fig 2C, was also noticeable; appearing as enlarged cellular
areas of fluorescent signal with a fuzzy boundary which increased the intensity distribution of
the cell particles. Neither cell morphological changes nor the appearance of any eDNA signal
was evident for the negative controls (Fig 2D).
Limit of detection of E. coli based on morphological change and eDNA
release through LTCL
In this approach, E. coli were co-incubated with low phage titer to allow initial propagation of
bacteria, followed by phage lysis. Area, eccentricity and the FWHM parameter, taken together,
were evaluated to distinguish “intact” E. coli cells from E. coli that are “lysed by phages”. As
indicated in Fig 3, E. coli at 103 CFU/ml can be detected based on changes in the selected mor-
phological particles following incubation with 102 PFU/ml of T7 phages. Fig 3A and 3B illus-
trate the microscopic image and binary image of negative control (only E. coli was incubated
for 3 hours). In comparison, Fig 3C and 3D illustrate microscopic image and binary picture of
PLOS ONE Escherichia coli detection by bacteriophage lysis and image analysis
PLOS ONE | https://doi.org/10.1371/journal.pone.0233853 June 5, 2020 8 / 19

E. coli-T7 phage for LTCL incubation condition. Based on image analysis methods as
described in the previous section, area and eccentricity values for E. coli lysed by T7 phages
demonstrate significant differences compared to the control (P< 0.05). In summary, E. colilysed by T7 phages revealed significant eDNA release and changes from a rod to circular
morphology.
Detection of E. coli at initial concentration of 102 and 104 CFU/ml were also conducted sim-
ilarly using the LTCL incubation conditions. Resultant images were shown, analyzed and com-
pared in S1 and S2 Figs, respectively. As shown in S1 Fig, no significant difference (P> 0.05)
was observed for all parameters (area, eccentricity and FWHM) between images from samples
of E. coli incubated with the T7 phage and negative controls, indicating E. coli at initial concen-
tration of 102 CFU/ml cannot be detected using LTCL incubation conditions and image analy-
sis, due to lack of significant cell lysis. In comparison, E. coli at initial concentration of 104
Fig 2. Bacteria morphology change during phage-induced lysis while co-incubating E. coli and T7 phages for 2 and 3 hours. a) cell morphology when co-incubating
E. coli and T7 phages for 2 hours. b) cell morphology when incubating just E. coli for 2 hours. c) cell morphology when co-incubating E. coli and T7 phages for 3 hours.
d) cell morphology when incubating just E. coli for 3 hours.
https://doi.org/10.1371/journal.pone.0233853.g002
PLOS ONE Escherichia coli detection by bacteriophage lysis and image analysis
PLOS ONE | https://doi.org/10.1371/journal.pone.0233853 June 5, 2020 9 / 19

Fig 3. Detection of 103 CFU/ml E. coli through LTCL with 102 PFU/ml T7 phage. a) negative control which
contains only E. coli growing for 3 hours. b) binary image of a). c) phage induced lysis while co-incubating with E. coli.d) binary image of c). e) comparison of area values extracted from b) and d). f) comparison of eccentricity values
extracted from b) and d). g) comparison of the full width at half maximum extracted from a) and c). �indicated
significant difference (P< 0.05).
https://doi.org/10.1371/journal.pone.0233853.g003
PLOS ONE Escherichia coli detection by bacteriophage lysis and image analysis
PLOS ONE | https://doi.org/10.1371/journal.pone.0233853 June 5, 2020 10 / 19
CFU/ml can be detected through LTCL, image analysis and comparison of area, eccentricity
and FWHM parameters (S2 Fig).
Characterization of E. coli morphological change and eDNA release
through HTTL
E. coli at 10 CFU/ml can be detected by HTTL as shown in Fig 4. Fig 4A and 4B indicate
microscopic image and binary picture of negative control where E. coli was incubated for 5
hours. In comparison, Fig 4C and 4D represents microscopic image and binary picture of E.
coli lysed by T7 phage through HTTL. Quantitative image analysis comparisons between Fig
4B and 4D are presented in Fig 4E–4G. To be specific, area difference was compared and sum-
marized in Fig 4E where E. coli cells lysed by T7 phage demonstrated larger stained area due to
DNA leakage. Shape changes were also observed in Fig 4F where more circular morphology of
E. coli were generated after T7 phage induced lysis. In addition, diffused fluorescent signal
intensity from T7 phage lysed E. coli cells were observed in Fig 4G based on quantification of
FWHM parameters compared to control. In summary, all area, eccentricity and FWHM
parameters indicated statistical difference between HTTL and negative controls (P< 0.05),
indicating E. coli at initial concentration of 10 CFU/ml can be detected through HTTL and
image analysis.
Detection of E. coli at initial concentration 102 and 103 CFU/ml were also achieved through
HTTL, image analysis and comparison of area, eccentricity and FWHM was presented in S3
and S4 Figs, respectively.
Detection of E. coli at 10 CFU/ml in artificial wash water and coconut water
HTTL was selected as a preferred lysis approach for rapid detection of E. coli in realistic food
samples, as HTTL demonstrates lower detection limit (10 CFU/ml) comparing to LTCL (103
CFU/ml) as previously described based on area, eccentricity and FWHM parameters.
As shown in Fig 5, E. coli at 10 CFU/ml can be detected through HTTL coupled with image
acquisition and analysis. Fig 5A and 5B indicate microscopic image and binary picture of neg-
ative control where E. coli was enriched in artificial wash water-TSB for 5 hours. In compari-
son, Fig 5C and 5D represents microscopic image and binary picture of E. coli lysed by T7
phage through HTTL after enrichment. Area, eccentricity and FWHM parameters were
extracted and statistically compared in Fig 5E, 5F and 5G. As mentioned in the previous sec-
tion, larger staining area, smaller eccentricity (more circular morphology) and larger FWHM
(diffuse fluorescence signal) values indicated the lysis of E. coli cells upon incubation with T7
phages. In summary, based on significant differences in quantitative image analysis parame-
ters, results indicated E. coli at 10 CFU/ml can be detected through HTTL and image analysis
in simulated wash water samples.
Similar experiments were conducted in coconut water and the resultant images, binary pic-
tures and parameter analysis are shown in Fig 6. E. coli at 10 CFU/ml can be detected through
HTTL and image analysis in coconut water. The proposed novel detection method is also vali-
dated in the spinach wash water, detailed data analysis and results are included in the support-
ing information.
Discussion
The study illustrates a straightforward, rapid and cost-effective biosensing strategy to detect E.
coli in simulated wash water, coconut water and spinach wash water. This concept can be
potentially expanded to detect other bacteria of interest of food safety using host-specific lytic
phages. The principle of the proposed biosensing strategy is rather straightforward: it focuses
PLOS ONE Escherichia coli detection by bacteriophage lysis and image analysis
PLOS ONE | https://doi.org/10.1371/journal.pone.0233853 June 5, 2020 11 / 19

on morphological changes of host cells and the release of eDNA upon host cell lysis. As far as
we are aware, this is the first study to describe combining morphological changes, eDNA
Fig 4. Detection of 10 CFU/ml E. coli through enrichment and HTTL. a) negative control which contains only E.
coli growing for 5 hours. b) binary image of a). c) phage induced lysis after E. coli enrichment. d) binary image of c). e)
comparison of area values extracted from b) and d). f) comparison of eccentricity values extracted from b) and d). g)
comparison of the full width at half maximum extracted from a) and c). �indicated significant difference (P < 0.05).
https://doi.org/10.1371/journal.pone.0233853.g004
PLOS ONE Escherichia coli detection by bacteriophage lysis and image analysis
PLOS ONE | https://doi.org/10.1371/journal.pone.0233853 June 5, 2020 12 / 19
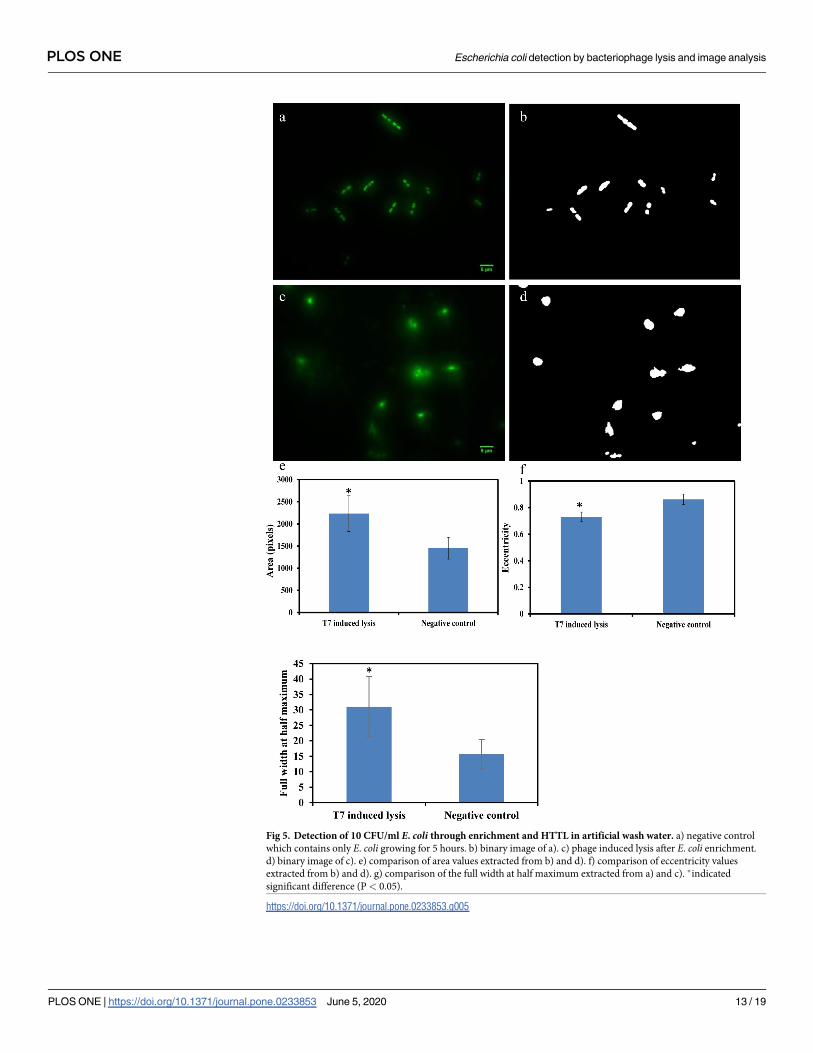
Fig 5. Detection of 10 CFU/ml E. coli through enrichment and HTTL in artificial wash water. a) negative control
which contains only E. coli growing for 5 hours. b) binary image of a). c) phage induced lysis after E. coli enrichment.
d) binary image of c). e) comparison of area values extracted from b) and d). f) comparison of eccentricity values
extracted from b) and d). g) comparison of the full width at half maximum extracted from a) and c). �indicated
significant difference (P< 0.05).
https://doi.org/10.1371/journal.pone.0233853.g005
PLOS ONE Escherichia coli detection by bacteriophage lysis and image analysis
PLOS ONE | https://doi.org/10.1371/journal.pone.0233853 June 5, 2020 13 / 19

Fig 6. Detection of 10 CFU/ml E. coli through enrichment and HTTL in coconut water. a) negative control which
contains only E. coli growing for 5 hours. b) binary image of a). c) phage induced lysis after E. coli enrichment. d)
binary image of c). e) comparison of area values extracted from b) and d). f) comparison of eccentricity values
extracted from b) and d). g) comparison of the full width at half maximum extracted from a) and c). �indicated
significant difference (P< 0.05).
https://doi.org/10.1371/journal.pone.0233853.g006
PLOS ONE Escherichia coli detection by bacteriophage lysis and image analysis
PLOS ONE | https://doi.org/10.1371/journal.pone.0233853 June 5, 2020 14 / 19

release and image analysis to achieve rapid detection of E. coli in realistic food matrices. The
application of imaging and image analysis as a detection approach has also been applied in
BARDOT–a bacterial rapid detection using optical scattering technology. In BARDOT, a laser
beam would usually pass through the bacterial colony to analyze 3D morphological and optical
characteristics to generate optical “fingerprint”. Our proposed biosensing strategy using a sim-
ilar optical imaging and image analysis approach enables significantly rapid detection com-
pared with colony forming assays used for BARDOT. For instance, it took at least 6–8 hours or
24–36 hours to achieve detectable Bacillus and Listeria colonies, respectively [30–32]. In com-
parison, the rapidity of our proposed biosensing strategy is indicated in Table 1 and as shown
in Table 1, the total amount of time for this proposed biosensing strategy is less than 8 hours.
This is a time frame that fits within a typical industrial shift packaging perishable produce
products. It could be argued that this approach has not eliminated the initial enrichment pro-
cess as it adds significant time to the overall procedure but using the current imaging analysis
approach was not possible without compromising the detection limit. Several other rapid
detection methods based on PCR, phage and immunoassay still use enrichment as a pre-detec-
tion step to enhance the performance of the methods [14,33–37]. There is another acceptable
reason to consider enrichment. It has been noted that bacterial cells that are naturally in the
food/environment display an injured phenotype due to various stresses, which may reduce
sensitivity of bacteria to phages during both infection and propagation step. The enrichment
step could resuscitate injured cells thereby making them susceptible to phage infection and
therefore, detectable by the proposed method.
The biosensing strategy developed in this study is also cost-effective. Table 1 summarizes
the cost of the detection method, which is around $5.50 per sample. The major expense of the
biosensing strategy is anodisc ($4.40), which could potentially be replaced by another lower-
cost material that yields similar performance with low fluorescence background upon staining
with SYBR Green I.
Some of the potential challenges in translating the results of this study to field application
may include: precise control on phage activity and presence of other bacteria with circular
morphology in a food matrix. Based on our observations, phage activity needs to be controlled
precisely to achieve timely detection as older batch of phage due to reduced phage titer or
weaker infectious potency, may take longer time for lysis. To partially resolve the phage activity
inconsistence, new batch of phages were prepared every two weeks. Another potential limita-
tion of the biosensing strategy lies in the background microflora. Presence of coccoid bacteria,
such as a Staphylococcus spp., may influence the eccentricity value during image analysis. The
presence of bacteria that are significantly larger than E. coli, such as some of Pseudomonasspp., could also influence the calculation of area. The potential challenge from background
microflora was partially addressed in the manuscript by simultaneously investigating changes
Table 1. Total time and cost analysis for liquid food matrix (25 ml) using proposed biosensing strategy to detect
E. coli. All prices were quoted from the suppliers listed in the material and method section.
Steps Time Supplies Used Cost
Enrichment 5 hours Food Sample, TSB broth $0.20
Lysis 30 min Phage N/A
Filtration 30 min Anodisc $4.83
Staining 20 min SYBR green $0.03
Imaging 30 min Microscopic slide, antifading reagent, cover slip $0.44
Image Analysis 10 min Matlab Software N/A
Total 7 hours $5.50
https://doi.org/10.1371/journal.pone.0233853.t001
PLOS ONE Escherichia coli detection by bacteriophage lysis and image analysis
PLOS ONE | https://doi.org/10.1371/journal.pone.0233853 June 5, 2020 15 / 19

in both area and eccentricity parameters, and validation in realistic spinach wash water sam-
ples to conclude the presence/absence of E. coli. ‘Intensity distribution’ which is the fluores-
cence intensity as a function of distance of the line cross-sectioned through the centroid of a
bacterium cell is another parameter that is able to detect bacterial cell lysis. The lysis of cell
membrane results in diffused distribution of the DNA. This diffuse distribution increases the
width at half maximum while un-lysed cell showed focused DNA staining and reduced full
width at half maximum.
The manuscript also describes two modes of lysis, LTCL and HTTL. Both lysis pathways
have advantages and disadvantages. LTCL provides easier sample preparation as phages and E.
coli were co-incubated together, without additional step before filtration. This mode of sample
preparation for the detection of target bacteria using phages has also been documented in sev-
eral studies [7,21]. However, major drawbacks for LTCL were noticed as the relative insensi-
tive detection limit at103 CFU/ml. In comparison, HTTL provides better detection limit in our
current study at 10 CFU/ml, even though sample preparation requires both enrichment and
phage addition at two different steps. To conclude, HTTL lysis mode is a better approach in
our biosensing strategy.
Conclusion
In conclusion, this study demonstrates a straightforward, rapid and cost-effective biosensing
strategy to be developed which focuses on host cell morphology change and eDNA release, fol-
lowed by automated imaging acquisition and analysis. The proposed method has been tested
to rapidly detect E. coli at 10 CFU/ml within 8 hours of entire process. The method has also
been validated in three different realistic matrices—artificial fresh produce wash water, coco-
nut water and spinach wash water. Future research may be conducted to include a variety of
background microflora and to test the robustness of the proposed biosensing strategy in a
greater variety of food matrices.
Supporting information
S1 Fig. Detection of 102 CFU/ml E. coli through LTCL with 102 PFU/ml T7 phage for 4
hours. a) negative control which contains only E. coli growing for 4 hours. b) binary image of
a). c) phage induced lysis while co-incubating with E. coli. d) binary image of c). e) comparison
of area values extracted from b) and d). f) comparison of eccentricity values extracted from b)
and d). g) comparison of the full width at half maximum extracted from a) and c).
(DOCX)
S2 Fig. Detection of 104 CFU/ml E. coli through LTCL with 102 PFU/ml T7 phage for 2
hours. a) negative control which contains only E. coli growing for 2 hours. b) binary image of
a). c) phage induced lysis while co-incubating with E. coli. d) binary image of c). e) comparison
of area values extracted from b) and d). f) comparison of eccentricity values extracted from b)
and d). g) comparison of the full width at half maximum extracted from a) and c). �indicated
significant difference (P < 0.05).
(DOCX)
S3 Fig. Detection of 102 CFU/ml E. coli through 4 hours enrichment and HTTL. a) negative
control which contains only E. coli growing for 4 hours. b) binary image of a). c) phage
induced lysis after E. coli enrichment. d) binary image of c). e) comparison of area values
extracted from b) and d). f) comparison of eccentricity values extracted from b) and d). g)
comparison of the full width at half maximum extracted from a) and c). �indicated significant
PLOS ONE Escherichia coli detection by bacteriophage lysis and image analysis
PLOS ONE | https://doi.org/10.1371/journal.pone.0233853 June 5, 2020 16 / 19

difference (P < 0.05).
(DOCX)
S4 Fig. Detection of 103 CFU/ml E. coli through 2 hours enrichment and HTTL. a) negative
control which contains only E. coli growing for 2 hours a) negative control which contains
only E. coli growing for 2 hours. b) binary image of a). c) phage induced lysis after E. colienrichment. d) binary image of c). e) comparison of area values extracted from b) and d). f)
comparison of eccentricity values extracted from b) and d). g) comparison of the full width at
half maximum extracted from a) and c). �indicated significant difference (P< 0.05).
(DOCX)
S5 Fig. Detection of 103 CFU/ml E. coli through 3 hours enrichment and HTTL in spinach
wash water. a) negative control image which contains only E. coli growing for 3 hours. b)
phage induced lysis after E. coli enrichment. c) comparison of area, d) comparison of eccen-
tricity and e) comparison of full width at half maximum values between E. coli cells with or
without T7 induced lysis. �indicated significant difference (P< 0.05).
(DOCX)
S6 Fig. Fluorescence images of various non-E. coli bacterial cells with and without T7
phage infection. a) Bacillus subtilis without infection, b) Bacillus subtilis with infection, c) Lac-tobacillus casei without infection, d) Lactobacillus casei with infection, e) Listeria innocua with-
out infection, f) Listeria innocua with infection, g) Pseudomonas fluorescens without infection
and h) Pseudomonas fluorescens with infection.
(DOCX)
S1 Data.
(DOCX)
Author Contributions
Conceptualization: Xu Yang, Glenn M. Young, Nitin Nitin.
Data curation: Xu Yang, Nicharee Wisuthiphaet.
Formal analysis: Xu Yang, Nicharee Wisuthiphaet.
Funding acquisition: Nitin Nitin.
Investigation: Xu Yang, Nitin Nitin.
Methodology: Xu Yang, Nicharee Wisuthiphaet, Glenn M. Young, Nitin Nitin.
Supervision: Xu Yang.
Validation: Xu Yang.
Writing – original draft: Xu Yang.
Writing – review & editing: Xu Yang, Nicharee Wisuthiphaet, Glenn M. Young, Nitin Nitin.
References
1. FDA. Final environmental impact statement (EIS) for the proposed rule: standards for growing, harvest-
ing, packing, and holding of produce for human consumption. Food Drug Adm. 2015.
2. NRDC. Wasted: How America is losing up to 40 percent of its food from farm to fork to landfill—Second
Edition. NRDC Issue Pap. 2017; 1–58. doi: 12-06-B
PLOS ONE Escherichia coli detection by bacteriophage lysis and image analysis
PLOS ONE | https://doi.org/10.1371/journal.pone.0233853 June 5, 2020 17 / 19

3. EPA/US EPA (US Environmental Protection Agency). Method 7473. Mercury in solids and solutions by
thermal decomposition, amalgamation, and atomic absorption spectrophometry. SW-846, Test Meth-
ods Eval Solid Waste, Phys Methods. 2007.
4. BerghØ, Børsheim KY, Bratbak G, Heldal M. High abundance of viruses found in aquatic environments.
Nature. 1989. https://doi.org/10.1038/340467a0 PMID: 2755508
5. Brovko LY, Anany H, Griffiths MW. Bacteriophages for Detection and Control of Bacterial Pathogens in
Food and Food-Processing Environment. Advances in Food and Nutrition Research. 2012. https://doi.
org/10.1016/B978-0-12-394598-3.00006-X PMID: 23034118
6. Baggesen DL, Sørensen G, Nielsen EM, Wegener HC. Phage typing of Salmonella Typhimurium—is it
still a useful tool for surveillance and outbreak investigation? Eurosurveillance. 2010. https://doi.org/10.
2807/ese.15.04.19471-en
7. Anany H, Brovko L, El Dougdoug NK, Sohar J, Fenn H, Alasiri N, et al. Print to detect: a rapid and ultra-
sensitive phage-based dipstick assay for foodborne pathogens. Anal Bioanal Chem. 2018. https://doi.
org/10.1007/s00216-017-0597-y PMID: 28940009
8. Parish ME, Goodrich RM. Recovery of presumptive Alicyclobacillus strains from orange fruit surfaces. J
Food Prot. 2005; 68: 2196–2200. Available: http://www.scopus.com/inward/record.url?eid=2-s2.0-
26644460420&partnerID=40&md5=55c142840f2b5e9cb54333c1c8fd1d0c https://doi.org/10.4315/
0362-028x-68.10.2196 PMID: 16245729
9. Hermes KP, Suttle CA. Direct counts of viruses in natural waters and laboratory cultures by epifluores-
cence microscopy. Limnol Oceanogr. 1995. https://doi.org/10.4319/lo.1995.40.6.1050
10. Lee SH, Onuki M, Satoh H, Mino T. Isolation, characterization of bacteriophages specific to Microluna-
tus phosphovorus and their application for rapid host detection. Lett Appl Microbiol. 2006. https://doi.
org/10.1111/j.1472-765X.2006.01840.x PMID: 16478514
11. Edgar R, McKinstry M, Hwang J, Oppenheim AB, Fekete RA, Giulian G, et al. High-sensitivity bacterial
detection using biotin-tagged phage and quantum-dot nanocomplexes. Proc Natl Acad Sci U S A. 2006.
https://doi.org/10.1073/pnas.0601211103 PMID: 16549760
12. Jackson AA, Hinkley TC, Talbert JN, Nugen SR, Sela DA. Genetic optimization of a bacteriophage-
delivered alkaline phosphatase reporter to detect: Escherichia coli. Analyst. 2016. https://doi.org/10.
1039/c6an00479b PMID: 27412402
13. Chen J, Alcaine SD, Jackson AA, Rotello VM, Nugen SR. Development of Engineered Bacteriophages
for Escherichia coli Detection and High-Throughput Antibiotic Resistance Determination. ACS Sensors.
2017. https://doi.org/10.1021/acssensors.7b00021 PMID: 28723178
14. Wisuthiphaet N, Yang X, Young GM, Nitin N. Rapid detection of Escherichia coli in beverages using
genetically engineered bacteriophage T7. AMB Express. 2019. https://doi.org/10.1186/s13568-019-
0776-7 PMID: 31004244
15. Cortesi M, Bandiera L, Pasini A, Bevilacqua A, Gherardi A, Furini S, et al. Reliable measurement of E.
coli single cell fluorescence distribution using a standard microscope set-up. J Biol Eng. 2017. https://
doi.org/10.1186/s13036-017-0050-y PMID: 28239411
16. Agbana TE, Diehl JC, Van Pul F, Khan SM, Patlan V, Verhaegen M, et al. Imaging & identification of
malaria parasites using cellphone microscope with a ball lens. PLoS One. 2018. https://doi.org/10.
1371/journal.pone.0205020 PMID: 30286150
17. Loessner MJ. Bacteriophage endolysins—Current state of research and applications. Current Opinion
in Microbiology. 2005. https://doi.org/10.1016/j.mib.2005.06.002 PMID: 15979390
18. Kostyuchenko VA, Chipman PR, Leiman PG, Arisaka F, Mesyanzhinov V V., Rossmann MG. The tail
structure of bacteriophage T4 and its mechanism of contraction. Nat Struct Mol Biol. 2005. https://doi.
org/10.1038/nsmb975 PMID: 16116440
19. Kostyuchenko VA, Leiman PG, Chipman PR, Kanamaru S, Van Raaij MJ, Arisaka F, et al. Three-
dimensional structure of bacteriophage T4 baseplate. Nat Struct Biol. 2003. https://doi.org/10.1038/
nsb970 PMID: 12923574
20. Turnbull L, Toyofuku M, Hynen AL, Kurosawa M, Pessi G, Petty NK, et al. Explosive cell lysis as a
mechanism for the biogenesis of bacterial membrane vesicles and biofilms. Nat Commun. 2016. https://
doi.org/10.1038/ncomms11220 PMID: 27075392
21. Tilton L, Das G, Yang X, Wisuthiphaet N, Kennedy IM, Nitin N. Nanophotonic Device in Combination
with Bacteriophages for Enhancing Detection Sensitivity of Escherichia coli in Simulated Wash Water.
Anal Lett. 2019. https://doi.org/10.1080/00032719.2019.1655648
22. Patel A, Noble RT, Steele JA, Schwalbach MS, Hewson I, Fuhrman JA. Virus and prokaryote enumera-
tion from planktonic aquatic environments by epifluorescence microscopy with SYBR Green I. Nat Pro-
toc. 2007. https://doi.org/10.1038/nprot.2007.6 PMID: 17406585
PLOS ONE Escherichia coli detection by bacteriophage lysis and image analysis
PLOS ONE | https://doi.org/10.1371/journal.pone.0233853 June 5, 2020 18 / 19

23. Yong JWH, Ge L, Ng YF, Tan SN. The chemical composition and biological properties of coconut
(Cocos Nucifera L.) water. Molecules. 2009. https://doi.org/10.3390/molecules14125144 PMID:
20032881
24. Elizaquıvel P, Sanchez G, Selma M V., Aznar R. Application of propidium monoazide-qPCR to evaluate
the ultrasonic inactivation of Escherichia coli O157:H7 in fresh-cut vegetable wash water. Food Micro-
biol. 2012. https://doi.org/10.1016/j.fm.2011.10.008 PMID: 22265318
25. Blahuta J, Soukup T,Čermak P. Image processing of medical diagnostic neurosonographical images in
MATLAB. Recent Researches in Computer Science—Proceedings of the 15th WSEAS International
Conference on Computers, Part of the 15th WSEAS CSCC Multiconference. 2011.
26. Ravindran PB. A study of Winston–Lutz test on two different electronic portal imaging devices and with
low energy imaging. Australas Phys Eng Sci Med. 2016. https://doi.org/10.1007/s13246-016-0463-9
PMID: 27435984
27. Altan A, McCarthy KL, Tikekar R, McCarthy MJ, Nitin N. Image Analysis of Microstructural Changes in
Almond Cotyledon as a Result of Processing. J Food Sci. 2011. https://doi.org/10.1111/j.1750-3841.
2010.01994.x PMID: 21535761
28. Otsu N. Threshold Selection Method from Gray-Level Histograms. IEEE Trans Syst Man Cybern. 1979.
https://doi.org/10.1109/tsmc.1979.4310068
29. Nanduri JR, Pino-Romainville FA, Celik I. CFD mesh generation for biological flows: Geometry recon-
struction using diagnostic images. Comput Fluids. 2009. https://doi.org/10.1016/j.compfluid.2008.01.
027
30. Banada PP, Guo S, Bayraktar B, Bae E, Rajwa B, Robinson JP, et al. Optical forward-scattering for
detection of Listeria monocytogenes and other Listeria species. Biosens Bioelectron. 2007. https://doi.
org/10.1016/j.bios.2006.07.028 PMID: 16949268
31. Kim H, Singh AK, Bhunia AK, Bae E. Laser-induced speckle scatter patterns in Bacillus colonies. Front
Microbiol. 2014. https://doi.org/10.3389/fmicb.2014.00537 PMID: 25352840
32. Bae E, Banada PP, Huff K, Bhunia AK, Robinson JP, Hirleman ED. Biophysical modeling of forward
scattering from bacterial colonies using scalar diffraction theory. Appl Opt. 2007. https://doi.org/10.
1364/AO.46.003639 PMID: 17514326
33. Mukhopadhyay A K. Mukhopadhyay U. Novel multiplex PCR approaches for the simultaneous detec-
tion of human pathogens: Escherichia coli O157:H7 and Listeria monocytogenes. J Microbiol Methods.
2007. https://doi.org/10.1016/j.mimet.2006.07.009 PMID: 16963139
34. Sharp NJ, Vandamm JP, Molineux IJ, Schofield DA. Rapid detection of Bacillus anthracis in complex
food matrices using phage-mediated bioluminescence. J Food Prot. 2015. https://doi.org/10.4315/
0362-028X.JFP-14-534 PMID: 25951391
35. Chen S, Wang F, Beaulieu JC, Stein RE, Ge B. Rapid detection of viable Salmonellae in produce by
coupling propidium monoazide with loop-mediated isothermal amplification. Appl Environ Microbiol.
2011. https://doi.org/10.1128/AEM.00354-11 PMID: 21498750
36. Li J, Liu Q, Wan Y, Wu X, Yang Y, Zhao R, et al. Rapid detection of trace Salmonella in milk and chicken
by immunomagnetic separation in combination with a chemiluminescence microparticle immunoassay.
Anal Bioanal Chem. 2019. https://doi.org/10.1007/s00216-019-01991-z PMID: 31273413
37. Laube T, Cortes P, Llagostera M, Alegret S, Pividori MI. Phagomagnetic immunoassay for the rapid
detection of Salmonella. Appl Microbiol Biotechnol. 2014. https://doi.org/10.1007/s00253-013-5434-4
PMID: 24362855
PLOS ONE Escherichia coli detection by bacteriophage lysis and image analysis
PLOS ONE | https://doi.org/10.1371/journal.pone.0233853 June 5, 2020 19 / 19