Embed Size (px)
Citation preview
Research Article
Rapid determination of superoxide freeradical in hepatocellular carcinoma cells byMCE with LIF
A method for determination of superoxide free radical (O��2 ) based on MCE with LIF was
developed. Fluorescent reagent 2-chloro-1, 3-dibenzothiazolinecyclohexene, which was
synthesized in our laboratory, was employed as the labeling reagent, the highest deri-
vatization efficiency was obtained in 20 mM HEPES buffer (pH 7.4) for 10 min at 371C.
Optimal determination of O��2 was achieved on a glass microchip, using 50 mM HEPES
buffer (pH 7.4). Under the optimized conditions, linearity of response was obtained in
the range of 4.0� 10�7–1.0� 10�5 M, the detection limit (S/N 5 3) was 0.15 mM, the
RSDs of migration time and peak area were 2.6 and 3.8%, respectively. Interference
experiment was investigated and the result indicates that 1000-fold molar excess of
hydrogen peroxide does not interfere with the determination of O��2 in complex system.
Finally, the method has been successfully applied to determine O��2 in hepatocellular
carcinoma cells as well as phorbol 12-myristate 13-acetate stimulated RAW264.7
macrophages. The average recoveries were 97.3 and 98.6%, respectively.
Keywords:
Hepatocellular carcinoma cells / Macrophages RAW264.7 / MCE with LIF /Superoxide free radical / 2-Chloro-1,3-dibenzolinecyclohexene
DOI 10.1002/elps.200800421
1 Introduction
Superoxide anion radical (O��2 ) is a short-lived and highly
reactive free radical in biological system. In a normal
cellular environment, it mediates signal transduction and
defenses against viral or bacterial attack [1]. In the case of
overproduction, O��2 can lead to oxidative damage of
proteins, DNA, and lipid peroxidation [2]. It has been
reported that O��2 inhibits enzymes including glutathione
peroxidase, catalase, and creatine kinase [3]. O��2 also serves
as a precursor to other reactive oxygen species (ROS). For
example, O��2 converts to hydrogen peroxide (H2O2)
spontaneously or under action of superoxide dismutase;
O��2 reacts with nitric oxide to form the powerful oxidant
peroxynitrite, which can cause many diseases related to
inflammatory processes and autoimmune diabetes [4, 5].
Therefore, rapid, sensitive detection and quantification of
intracellular O��2 is critically important in understanding its
physiological functions and pathogenesis of various diseases
associated with ROS.
Although several methods to detect O��2 such as electron
spin resonance [6], electrochemistry [7], fluorescence spec-
trometry [8], and HPLC [9] have been developed, there were
some drawbacks for the above-mentioned methods, includ-
ing the large sample volume, the long analyzing time,
inconvenience to operate, or cost. CE also has obtained
some achievements in analyzing total ROS [10] or single
ROS [11, 12]. CE combined with LIF has been introduced to
detect O��2 in rat skeletal muscle mitochondria, after deri-
vatization with fluorescence reagent hydroethidine (HE)
[12]. Unfortunately, HE has low selectivity to O��2 , mmol level
of H2O2 may interfere with the determination of O��2 , while
the content of H2O2 in biological system is far higher than
mmol level due to accumulation in the biological system, and
the long analysis time is unsuitable for rapid trapping of
O��2 . Meanwhile, the injection and separation procedures in
CE analysis were quite tedious and inconvenient using one-
dimensional structure.
Since 1990s, microfluidic chip or lab-on-a-chip provides
a new technology platform for the research in chemistry,
Xin LiuQingling LiXiaocong GongHongmin LiZhenzhen ChenLili TongBo Tang
College of Chemistry, ChemicalEngineering and MaterialsScience, Engineering ResearchCenter of Pesticide and MedicineIntermediate Clean Production,Key Laboratory of Molecular andNano Probes, Ministry ofEducation, Shandong NormalUniversity, Jinan, P. R. China
Received June 30, 2008Revised August 19, 2008Accepted September 4, 2008
Abbreviations: DBZTC, 2-chloro-1, 3-dibenzothiazoline-cyclohexene; HE, hydroethidine; HepG2 cells,
hepatocellular carcinoma cells; H2O2, hydrogen peroxide;
O��2 , superoxide radical; PMA, phorbol 12-myristate13-acetate; ROS, reactive oxygen species; Tiron, 4,5-Dihydroxy-1,3-benzenedisulfonic acid disodium salt; XA,
xanthine; XO, xanthine oxidase
Correspondence: Professor Bo Tang, College of Chemistry,Chemical Engineering and Materials Science, EngineeringResearch Center of Pesticide and Medicine Intermediate CleanProduction, Key Laboratory of Molecular and Nano Probes,Ministry of Education, Shandong Normal University, Jinan,250014, P. R. ChinaE-mail: [email protected]: 186-531-86180017
& 2009 WILEY-VCH Verlag GmbH & Co. KGaA, Weinheim www.electrophoresis-journal.com
Electrophoresis 2009, 30, 1077–1083 1077
biology, microengineering, and other related microsystem
fields [13, 14]. MCE offers many attractive benefits such as
reducing sample requirements and reagent volumes, which
can reduce overall cost and shorter analyzing time. Different
functions could be integrated on a single microchip, which is
an important step toward maintaining a completely closed
system, thereby reducing contamination and eliminating
human intervention and error [15, 16]. Among the several
detection techniques employed in microchip analysis, LIF
detection method is most easily adapted to the dimensions of
microchips [17]. The coherence and low divergence of a laser
beam make it easy to focus on very small analyte volumes and
obtain much high irradiation, resulting in one of the most
sensitive and powerful means of any detection systems
[17, 18]. However, much attention has been focused on
detection of total ROS using MCE coupled with LIF [19–22].
As different reactive species always coexist in the reactive
environment and single ROS has its own unique physiolo-
gical activity [23, 24], detection of single ROS is far more
significant for further insight on its action mechanisms in
biological processes. Currently, only Zhu et al. [25] employed
HE as the labeling reagent and achieved O��2 determination
on microchip using LIF detector. Despite the contribution, it
is still urgent to develop an MCE-LIF method with better
selectivity for O��2 determination. In our group, a new
fluorescence reagent 2-chloro-1, 3-dibenzothiazolinecyclo-
hexene (DBZTC) has been synthesized, which is highly
sensitive and selective toward determination of O��2 with no
interference from a 500-fold molar excess of H2O2 [26].
In this work, using fluorescence reagent DBZTC, a
simple, rapid and sensitive O��2 determination was devel-
oped by MCE with LIF detection technique. Interference
experiment was investigated with MCE-LIF to test the
feasibility of the method. After optimizing the derivatization
conditions and electrophoresis parameters, the method was
applied to determine O��2 in hepatocellular carcinoma
(HepG2) cells and RAW264.7 macrophages. Finally, it
reached simple, rapid, and sensitive O��2 detection on
microchip.
2 Materials and methods
2.1 Chemicals and reagents
All the chemicals were of analytical reagent grade or HPLC
reagent grade. All aqueous solutions were prepared with
doubly distilled water (18.2 O cm); DBZTC was synthesized
in-house, and DBZTC oxide was synthesized and purified
according to the literature procedure [26]; HEPES, H2O2
(30% aqueous solution), Xanthine oxidase (XO), and
phorbol 12-myristate 13-acetate (PMA) were obtained from
Sigma (St. Louis, MO, USA); 4,5-Dihydroxy-1,3-benzenedi-
sulfonic acid disodium salt (Tiron) and Xanthine (XA) was
purchased from Shanghai Reagent.
The stock solution (1.00 mM) of DBZTC and DBZTC
oxide were prepared with dimethylsulfoxide and stored at
41C in darkness. These stock solutions were diluted to
5.0� 10�4 M before use. The XA solution (1.00 mM) was
prepared with 1.0� 10�2 M NaOH; The XO solution of
(1.00 U/mL) was prepared in 2.30 mM (NH4)2SO4,
1.0� 10�2 M sodium salicylate biology buffer, stored at
2–81C; PMA was prepared in DMSO at a concentration of
1.0 mg/mL and stored at �201C before use; The stock
solution (100 mL) of H2O2 (0.30 M) was freshly prepared by
diluting H2O2 (30%, 3.4 mL) with water; HEPES, phos-
phate, and borate buffer were prepared with doubly distilled
water, and pH of the solutions were adjusted by the addition
of appropriate amounts of hydrochloric acid or sodium
hydroxide to a desired pH; Before use, all solutions were
filtered through a 0.22 mm polypropylene filter film. All
experiments were performed at room temperature
(25721C).
2.2 Fluorescence spectra
Fluorimetric spectra were measured with an Edinburgh FLS
920 spectrofluorimeter (Edinburgh Instruments, UK), fitted
with a xenon lamp, in a quartz cuvette (1.0 cm optical path)
as the container. Spectrometer slits were set for 3.5 nm
band-pass. For recording the emission spectra, the excitation
wavelength was set at 473 nm, with spectral bandwidth
(10 nm), while the emission wavelength was scanned at a
specified scan rate from 495 to 680 nm. A solution of 10 mM
of DBZTC and 10 mM of DBZTC with 20 mM XA/20 mU
XO, was prepared, respectively, for the fluorescence
analysis.
2.3 Cell culture and sample preparation
HepG2 cells and RAW264.7 macrophages (purchased
from the American Type Culture Collection, Manassas,
USA), were cultured in DMEM containing 10% fetal
bovine serum, 1% penicillin, and 1% streptomycin at
371C in a 5% CO295% air incubator MCO-15AC (SANYO).
Cell viability was determined by the trypan-blue exclusion
assay.
When cells were in a logarithmic growth phase, a
proportion of HepG2 cells were incubated with O��2
scavenger Tiron (100 mM) for 1 h at 37711C, another
proportion of HepG2 cells were not incubated with Tiron.
Similarly, a proportion of the macrophage cells were incu-
bated with Tiron (100 mM) for 1 h prior to probe loading,
another portion of macrophage cells were stimulated with
PMA (2.0 ng/mL) at 37711C for 12 h. Then, each group of
cells were incubated with DBZTC (10 mM) for 10 min at
37711C. After that, all of the cells harvested with the
concentration of 1.0� 106 cells/mL by centrifugation in the
cold were washed twice with 0.9% NaCl solution. Finally,
these cells were resuspended again in a volume of HEPES
(20 mM, pH 7.4) equal to that in DMEM, and were then
disrupted for 10 min in a VC 130 PB ultrasonic disintegrator
Electrophoresis 2009, 30, 1077–10831078 X. Liu et al.
& 2009 WILEY-VCH Verlag GmbH & Co. KGaA, Weinheim www.electrophoresis-journal.com
(Sonics & Materials). During sonic disruption, the
temperature was maintained below 41C with circulating ice
water. The broken cell suspensions were centrifuged at
12 000g for 5 min and the suspensions were immediately
analyzed or kept at �201C for up to 2 days.
2.4 Microchip and LIF detector
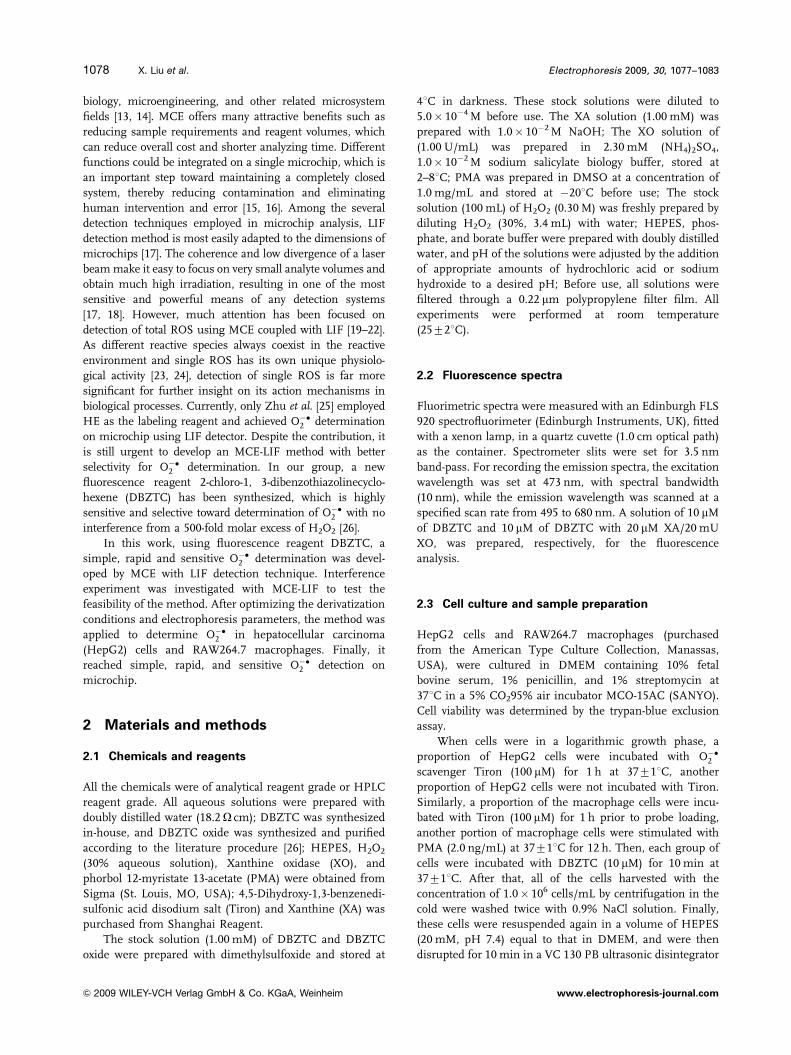
A schematic diagram of the microfluidic chip
channels design is shown in Fig. 1. The glass microchip
was provided by Dalian Institute of Chemical Physics,
Chinese Academy of Sciences (China). The double-T
channels were 65 mm wide and 15 mm deep, and the
detection occurred 12 mm downstream from the injection
cross in the separation channels. The reservoir positions are
depicted in Fig. 1.
A home-made intelligent eight-path-high-voltage elec-
tric device [27] and MCE-LIF detector were employed. Optics
collection system was confocal optics mode structure [28]. A
473 nm semiconductor double-pumped solid-state laser
(20 mW) was used as the excitation source. The confocal
detection module employed an objective to focus the beam
to the center of the microchannel. The emitted fluorescence
was filtered by a 520710 nm narrow band filter, and
detected by a PMT. The data were collected at 20 Hz using a
CT-22 data acquisition card.
2.5 MCE
Prior to electrophoresis, the channels of microchip were
rinsed with 1.0 M NaOH and doubly distilled water,
respectively, for 15 min and equilibrated with running
buffer for 15 min. Then, 10 mL of running buffer solutions
was filled into the reservoirs of B, BW, and SW respectively,
and 10 mL sample solution was filled into the sample
reservoir, S. After that, the chip was placed on the LIF-
detector worktable. By regulating the three dimensions
manipulator, the laser beam was focused at the detection
point. Sample injection was carried out using a pinch
injection mode [29]. Four electrodes, randomly chosen from
the intelligent eight-path-high-voltage electric device, were
inserted into the reservoirs to apply voltages for electro-
phoresis. Two sets of voltages were applied for sample
loading and electrophoresis separation according to Table 1.
3 Results and discussion
3.1 Fluorescent derivatization reagent and back-
ground experiments
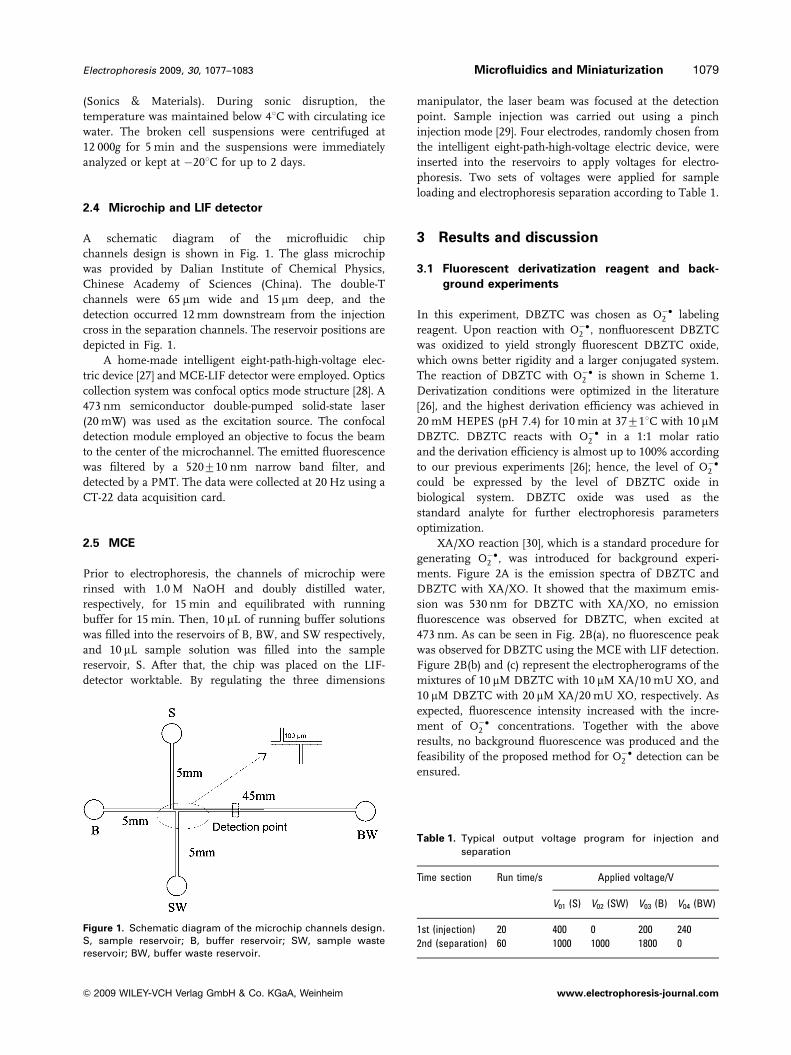
In this experiment, DBZTC was chosen as O��2 labeling
reagent. Upon reaction with O��2 , nonfluorescent DBZTC
was oxidized to yield strongly fluorescent DBZTC oxide,
which owns better rigidity and a larger conjugated system.
The reaction of DBZTC with O��2 is shown in Scheme 1.
Derivatization conditions were optimized in the literature
[26], and the highest derivation efficiency was achieved in
20 mM HEPES (pH 7.4) for 10 min at 37711C with 10 mM
DBZTC. DBZTC reacts with O��2 in a 1:1 molar ratio
and the derivation efficiency is almost up to 100% according
to our previous experiments [26]; hence, the level of O��2
could be expressed by the level of DBZTC oxide in
biological system. DBZTC oxide was used as the
standard analyte for further electrophoresis parameters
optimization.
XA/XO reaction [30], which is a standard procedure for
generating O��2 , was introduced for background experi-
ments. Figure 2A is the emission spectra of DBZTC and
DBZTC with XA/XO. It showed that the maximum emis-
sion was 530 nm for DBZTC with XA/XO, no emission
fluorescence was observed for DBZTC, when excited at
473 nm. As can be seen in Fig. 2B(a), no fluorescence peak
was observed for DBZTC using the MCE with LIF detection.
Figure 2B(b) and (c) represent the electropherograms of the
mixtures of 10 mM DBZTC with 10 mM XA/10 mU XO, and
10 mM DBZTC with 20 mM XA/20 mU XO, respectively. As
expected, fluorescence intensity increased with the incre-
ment of O��2 concentrations. Together with the above
results, no background fluorescence was produced and the
feasibility of the proposed method for O��2 detection can be
ensured.
Figure 1. Schematic diagram of the microchip channels design.S, sample reservoir; B, buffer reservoir; SW, sample wastereservoir; BW, buffer waste reservoir.
Table 1. Typical output voltage program for injection and
separation
Time section Run time/s Applied voltage/V
V01 (S) V02 (SW) V03 (B) V04 (BW)
1st (injection) 20 400 0 200 240
2nd (separation) 60 1000 1000 1800 0
Electrophoresis 2009, 30, 1077–1083 Microfluidics and Miniaturization 1079
& 2009 WILEY-VCH Verlag GmbH & Co. KGaA, Weinheim www.electrophoresis-journal.com
3.2 Optimization of the microchip CE conditions
For the optimized determination of DBZTC oxide, three
kinds of buffers (HEPES, phosphate, and borate buffer)
were tested. The DBZTC oxide was determined using one of
the three buffers at pH 7.2–8.6, when other electrophoresis
conditions were the same. Derivatization in HEPES buffer
had higher signal responses and smoother baseline. There-
fore, HEPES buffer was selected as the running buffer
solution. The buffer pH, concentration, and separation
electric field, which are the main factors affecting the
peak shape, have been optimized and the results were as
follows:Buffer pH mainly affects surface characteristics of the
chip channels, thereby affecting the EOF and mobilities of
derivatives. pH also has a large effect on fluorescence
intensity of analyte. According to the previous report [26],
when pH was in range of 7.0–8.6, DBZTC oxide exhibits
relatively strong fluorescence, and thus the effects of pH on
peak height were tested in the range of 7.0–8.6. As shown in
Fig. 3A, peak height reached the maximum at pH 7.4 and at
the same pH, an excellent peak shape and smoother base-
line were also observed. Therefore, pH 7.4 was adopted for
further testing.
The effect of the buffer concentration on the peak
height was studied at pH 7.4, in the range of 10–70 mM. As
shown in Fig. 3B, the peak height increased with buffer
concentration ranging from 10 to 50 mM. As buffer
concentration was above 50 mM, the peak height remained
unchangeable. The optimal concentration was selected as
50 mM, since it renders an excellent peak shape and low
current (12 mA).
The effects of separation electric field on the peak height
and the separation column efficiency over the range of
240–440 V/cm were investigated. In Fig. 3C and D, when
the electric field was 360 V/cm, the peak height and theo-
retical plates were both at the maximum. As a result, the
optimal electric field was selected as 360 V/cm.
Under the above optimized separation conditions, MCE
analysis of 10 mM DBZTC oxide was performed, the repre-
sentative microchip electropherogram for five repetitive
injections is shown in Fig. 4.
3.3 Reproducibilities, linearity, and detection limit
A standard solution of 10 mM DBZTC oxide was used to
investigate the reproducibilities. The electropherogram of
five repetitive injections of DBZTC oxide is shown in Fig. 4,
the RSDs of migration time and peak areas are 2.6 and
3.8%, respectively.
Figure 2. (A) Emission spectra of DBZTC and the mixture ofDBZTC with XA/XO in 20 mM HEPES (pH 7.4); lex 5 473 nm.(B) Electropherograms of (a) 10 mM DBZTC; (b) 10 mM DBZTC,10 mM XA, and 10 mU XO; (c) 10 mM DBZTC, 20 mM XA, and20 mU XO. XA/XO reaction is a standard procedure for generat-ing O��2 . Experimental conditions: injection time, 20 s; injectionelectric field, 400 V/cm; separation electric field, 360 V/cm;effective separation distance, 12 mm; running buffer, 40 mMHEPES (pH 7.4).
Scheme 1. The reaction ofDBZTC with O��2
Electrophoresis 2009, 30, 1077–10831080 X. Liu et al.
& 2009 WILEY-VCH Verlag GmbH & Co. KGaA, Weinheim www.electrophoresis-journal.com
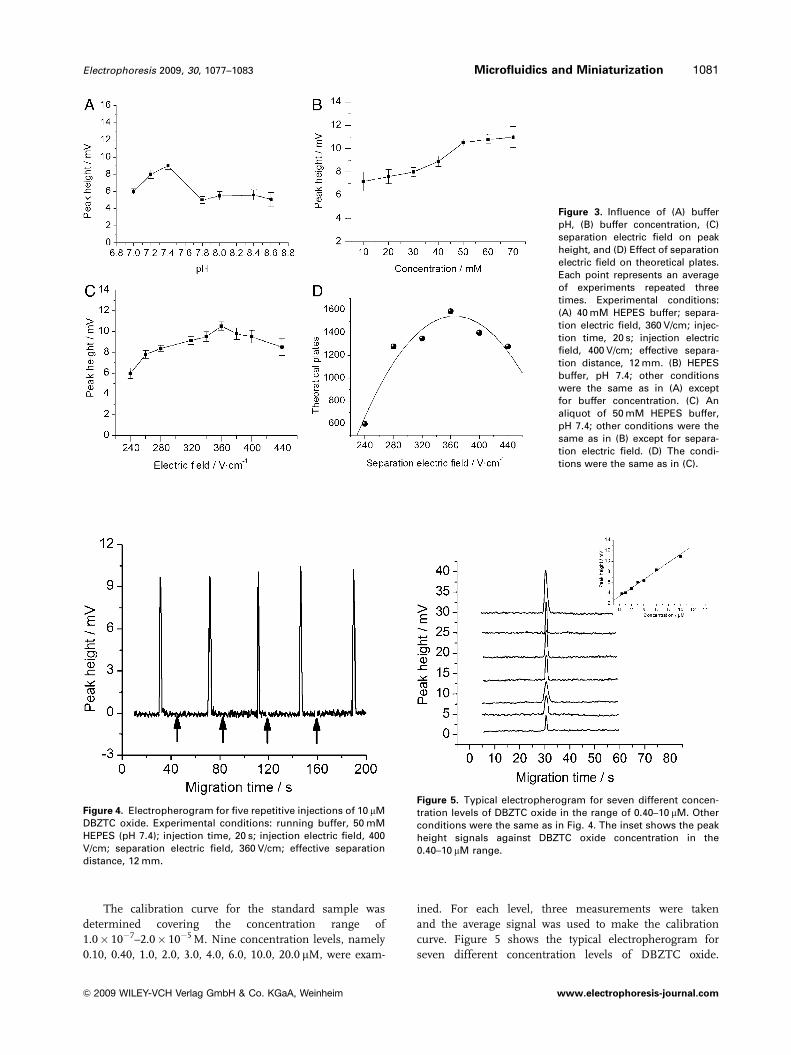
The calibration curve for the standard sample was
determined covering the concentration range of
1.0� 10�7–2.0� 10�5 M. Nine concentration levels, namely
0.10, 0.40, 1.0, 2.0, 3.0, 4.0, 6.0, 10.0, 20.0 mM, were exam-
ined. For each level, three measurements were taken
and the average signal was used to make the calibration
curve. Figure 5 shows the typical electropherogram for
seven different concentration levels of DBZTC oxide.
Figure 3. Influence of (A) bufferpH, (B) buffer concentration, (C)separation electric field on peakheight, and (D) Effect of separationelectric field on theoretical plates.Each point represents an averageof experiments repeated threetimes. Experimental conditions:(A) 40 mM HEPES buffer; separa-tion electric field, 360 V/cm; injec-tion time, 20 s; injection electricfield, 400 V/cm; effective separa-tion distance, 12 mm. (B) HEPESbuffer, pH 7.4; other conditionswere the same as in (A) exceptfor buffer concentration. (C) Analiquot of 50 mM HEPES buffer,pH 7.4; other conditions were thesame as in (B) except for separa-tion electric field. (D) The condi-tions were the same as in (C).
Figure 4. Electropherogram for five repetitive injections of 10 mMDBZTC oxide. Experimental conditions: running buffer, 50 mMHEPES (pH 7.4); injection time, 20 s; injection electric field, 400V/cm; separation electric field, 360 V/cm; effective separationdistance, 12 mm.
Figure 5. Typical electropherogram for seven different concen-tration levels of DBZTC oxide in the range of 0.40–10 mM. Otherconditions were the same as in Fig. 4. The inset shows the peakheight signals against DBZTC oxide concentration in the0.40–10 mM range.
Electrophoresis 2009, 30, 1077–1083 Microfluidics and Miniaturization 1081
& 2009 WILEY-VCH Verlag GmbH & Co. KGaA, Weinheim www.electrophoresis-journal.com
The standard curve was linear in the range of
4.0� 10�7–1.0� 10�5 M. The calibration equation and
regression coefficient were: y 5 0.7970x13.4440 and
R 5 0.9988 (n 5 7) in terms of peak height enhancement as
a function of DBZTC oxide concentration.
The concentration LOD was calculated on the basis of
an S/N of 3 and was 1.5� 10�7 M. Considering a repeatable
injection volume of 200 pL with double-T design, the
calculated mass LOD was 0.03 fmol (n 5 3).
3.4 Selectivity of the method
In biological samples, O��2 is present in low concentrations,
and other RS and biological compounds may interfere
with the determination of O��2 . To assess the selectivity of
the method toward determination of 10.0 mM O��2 , a
mixture of 10 mM DBZTC with 10.0 mM H2O2 was
analyzed under the optimized electrophoresis conditions,
and no H2O2 peak was observed. Other biological
compounds such as Vc and glutathione were also
investigated and did not make interferences with the
determination of O��2 . These observations revealed that the
present derivatization and separation method provided
relatively high selectivity toward O��2 , especially without
interference from a 1000-fold molar excess of H2O2,
and allowed its quantitative determination in biological
samples.
3.5 Determination of O��2 in HepG2 cells and
RAW264.7 macrophage extracts
The proposed method was applied to the analysis of HepG2
cells and RAW264.7 macrophages. Before electrophoresis
experiments, to exclude the native interference of these
samples, the fluorescence of cell samples without DBZTC
labeling were examined with Edinburgh FLS 920 spectro-
fluorimeter, and no native fluorescence was detected at lex/
lem 5 473/525 nm.
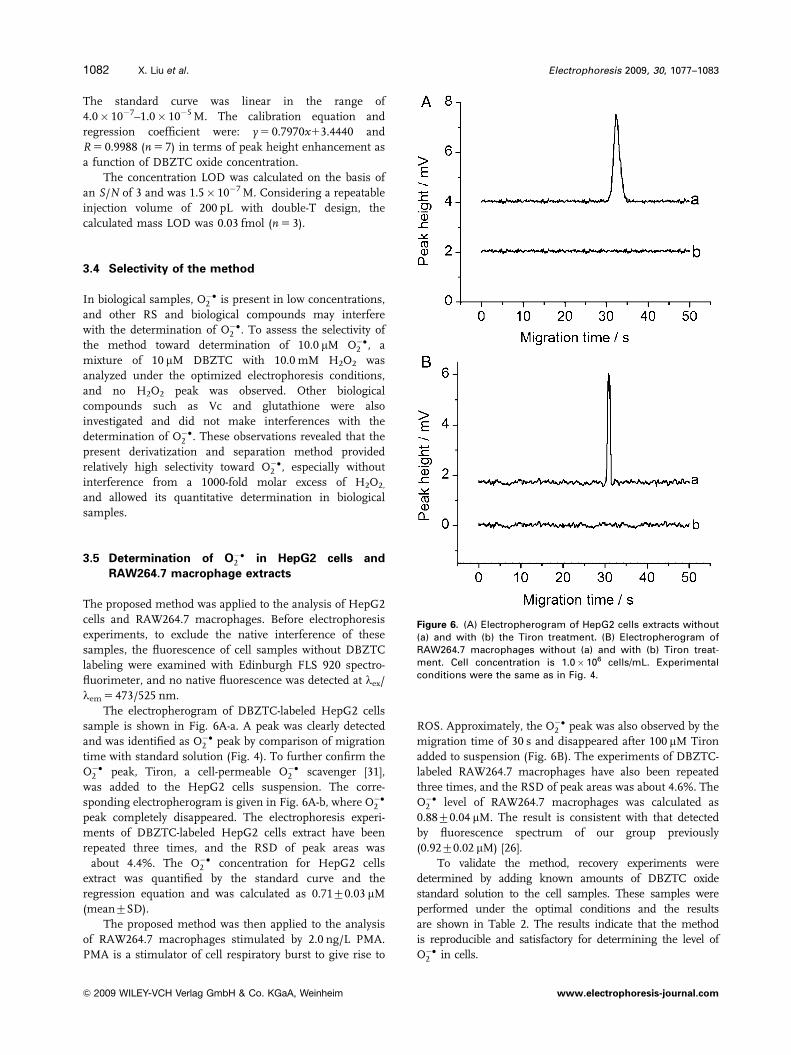
The electropherogram of DBZTC-labeled HepG2 cells
sample is shown in Fig. 6A-a. A peak was clearly detected
and was identified as O��2 peak by comparison of migration
time with standard solution (Fig. 4). To further confirm the
O��2 peak, Tiron, a cell-permeable O��2 scavenger [31],
was added to the HepG2 cells suspension. The corre-
sponding electropherogram is given in Fig. 6A-b, where O��2
peak completely disappeared. The electrophoresis experi-
ments of DBZTC-labeled HepG2 cells extract have been
repeated three times, and the RSD of peak areas was
about 4.4%. The O��2 concentration for HepG2 cells
extract was quantified by the standard curve and the
regression equation and was calculated as 0.7170.03 mM
(mean7SD).
The proposed method was then applied to the analysis
of RAW264.7 macrophages stimulated by 2.0 ng/L PMA.
PMA is a stimulator of cell respiratory burst to give rise to
ROS. Approximately, the O��2 peak was also observed by the
migration time of 30 s and disappeared after 100 mM Tiron
added to suspension (Fig. 6B). The experiments of DBZTC-
labeled RAW264.7 macrophages have also been repeated
three times, and the RSD of peak areas was about 4.6%. The
O��2 level of RAW264.7 macrophages was calculated as
0.8870.04 mM. The result is consistent with that detected
by fluorescence spectrum of our group previously
(0.9270.02 mM) [26].
To validate the method, recovery experiments were
determined by adding known amounts of DBZTC oxide
standard solution to the cell samples. These samples were
performed under the optimal conditions and the results
are shown in Table 2. The results indicate that the method
is reproducible and satisfactory for determining the level of
O��2 in cells.
Figure 6. (A) Electropherogram of HepG2 cells extracts without(a) and with (b) the Tiron treatment. (B) Electropherogram ofRAW264.7 macrophages without (a) and with (b) Tiron treat-ment. Cell concentration is 1.0� 106 cells/mL. Experimentalconditions were the same as in Fig. 4.
Electrophoresis 2009, 30, 1077–10831082 X. Liu et al.
& 2009 WILEY-VCH Verlag GmbH & Co. KGaA, Weinheim www.electrophoresis-journal.com
4 Concluding remarks
In this study, an MCE with LIF method was developed for
determination of O��2 using DBZTC as the fluorescent
reagent. With the optimized derivatization conditions and
electrophoresis parameters, rapid, sensitive detection and
quantification of O��2 was obtained within 30 s. A mass
detection limit of 0.03 fmol was achieved owing to the
minute sample volume. The method was applied for the
determination of O��2 in HepG2 cells and PMA-stimulated
RAW264.7 macrophages. Experimental results showed that
the developed method was simple, rapid, and sensitive, and
could be applied for determination of O��2 without
interference from a 1000-fold molar excess of H2O2 in
various biological systems. MCE offers favorable potentials
for facilitating investigation of the cellular homeostasis and
the pathogenesis of various diseases associated with O��2 at
the molecular level. Moreover, the method also provides a
new strategy for determination of other ROS in complex
biological matrix.
This work was supported by National Basic Research Programof China (973 Program, 2007CB936000), National NaturalScience Funds for Distinguished Young Scholar (No.20725518),Major Program of National Natural Science Foundation ofChina (No.90713019), National Natural Science Foundationof China (No.20875058), The Science and Technology Develop-ment Programs of Shandong Province of China (No. 2008GG30003012), and Natural Science Foundation of ShandongProvince in China (No.Y2008B15).
The authors have declared no conflict of interest.
5 References
[1] Aguirre, J., Rios, M. M., Hewitt, D., Hansberg, W.,Trends Microbiol. 2005, 13, 111–118.
[2] Kaori, I., Keizo, T., Miho, A., Nobuko, K. et al., Science2008, 320, 661–664.
[3] Halliwell, B., Gutteridge, J. M., Biochem. J. 1984, 219, 1–14.
[4] Huang, J., Li, D. J., Diao, J. C., Hou, J., Zou, G. L.,Talanta 2007, 72, 1283–1287.
[5] Wang, H. M., Cai, R. X., Lin, Z. X., Talanta 2006, 69,509–514.
[6] Nilsson, U. A., Haraldsson, G., Bratell, S., Sorensen, V.,Akerlund, S., Acta Physiol. Scand. 1993, 147, 263–270.
[7] Zielonka, J., Vasquez, V. J., Kalyanaraman, B., FreeRadic. Biol. Med. 2006, 34, 1050–1057.
[8] Munzel, T., Afanasev, I. B., Klescchyov, A. L., Harrison, D.G., Arterioscler. Thromb. Vasc. Biol. 2002, 22, 1761–1768.
[9] Zhao, H. T., Joseph, J., Fales, H. M., Sokoloski, E. A.,Levine, R. L., Proc. Natl. Acad. Sci. USA 2005, 102,5727–5732.
[10] Parmentier, C., Wellman, M., Siest, G., Leroy, P., Elec-trophoresis 1999, 20, 2938–2944.
[11] Shihabi, Z. K., Electrophoresis 2006, 27, 4215–4218.
[12] Meany, D. L., Thompson, L. D., Arriaga, E. A., Anal.Chem. 2007, 79, 4588–4594.
[13] Dittrich, P. S., Tachikawa, K., Manz, A., Anal. Chem.2006, 78, 3887–3908.
[14] Reyes, D. R., Iossifidis, D., Auroux, P. A., Manz, A., Anal.Chem. 2002, 74, 2623–2636.
[15] Auroux, P. A., Iossifidis, D., Reyes, D. R., Manz, A., Anal.Chem. 2002, 74, 2637–2652.
[16] Vilkner, T., Janasek, D., Manz, A., Anal. Chem. 2004, 76,3373–3386.
[17] Gotz, S., Karst, U., Anal. Bioanal. Chem. 2007, 387,183–192.
[18] Uchiyama, K., Nakajima, H., Hobo, T., Anal. Bioanal.Chem. 2004, 379, 375–382.
[19] Ling, Y. Y., Yin, X. F., Fang, Z. L., Electrophoresis 2005,26, 4759–4766.
[20] Sun, Y., Yin, X. F., J. Chromatogr. A 2006, 1117, 228–233.
[21] Sun, Y., Yin, X. F., Ling, Y. Y., Fang, Z. L., Anal. Bioanal.Chem. 2005, 382, 1472–1476.
[22] Qin, J. H., Ye, N. N., Lin, B. C., Electrophoresis 2005, 26,1155–1162.
[23] Wulf, D., Physiol. Rev. 2002, 82, 47–95.
[24] Setsukinai, K., Urano, Y., Kakinuma, K., Majima, H. J.,Nagano, T., J. Biol. Chem. 2003, 278, 3170–3175.
[25] Zhu, L. L., Lu, M., Yin, X. F., Talanta 2008, 75, 1227–1233.
[26] Gao, J. J., Xu, K. H., Tang, B., FEBS J. 2007, 274,1725–1733.
[27] Li, Q. L., Tang, B., Tian, H. X., Chinese PatentNo.200510104343.3.
[28] Zhou, X. M., Liu, D. Y., Zhong, R. T., Dai, Z. P. et al.,Electrophoresis 2004, 25, 3032–3039.
[29] Fu, L. M., Yang, R. J., Lee, G. B., Anal. Chem. 2003, 75,1905–1910.
[30] Benov, L., Sztejnberg, L., Fridovich, I., Free Radic. Biol.Med. 1998, 25, 826–831.
[31] Reynolds, G. A., Drexhage, K. H., J. Org. Chem. 1977, 42,885–888.
Table 2. Recoveries of O��2 in HepG2 cells and RAW264.7 macrophages samples (n 5 3)
Sample O��2 concentration (ıM) Added (mM) Found (mM) Mean (mM) Average recovery (%) RSD (%)
HepG2 0.7170.03 1.00 1.68, 1.62, 1.75 1.6870.07 97.3 4.8
Macrophages 0.8870.04 1.00 1.80, 1.96, 1.84 1.8670.08 98.6 4.5
Electrophoresis 2009, 30, 1077–1083 Microfluidics and Miniaturization 1083
& 2009 WILEY-VCH Verlag GmbH & Co. KGaA, Weinheim www.electrophoresis-journal.com


![[XLS]pulse.sgcib.com · Web viewRX LIF REXAM RY LIF ROYAL & SU RZ LIF RANDGOLD LIF STNDRD LIF LIF SMTH & NPH LIF SMITHS GRP S3 LIF STND CHRTD S4](https://img.pdfslide.net/doc/110x75/5aadecb77f8b9a59478b658c/xlspulsesgcibcom-viewrx-lif-rexam-ry-lif-royal-su-rz-lif-randgold-lif-stndrd.jpg)