Embed Size (px)
Citation preview

RAPID EBITDA
March 2020
CONFIDENTIALITYOur clients’ industries are extremely competitive, and the maintenance of confidentiality with respect to our clients’ plans and data is critical. Oliver Wyman rigorously applies internal confidentiality practices to protect the confidentiality of all client information.
Similarly, our industry is very competitive. We view our approaches and insights as proprietary and therefore look to our clients to protect our interests in our proposals, presentations, methodologies and analytical techniques. Under no circumstances should this material be shared with any third party without the prior written consent of Oliver Wyman.
© Oliver Wyman

RAPID EBITDA INTRO
1
4© Oliver Wyman
1
RAPIDEBITDAPLATFORM
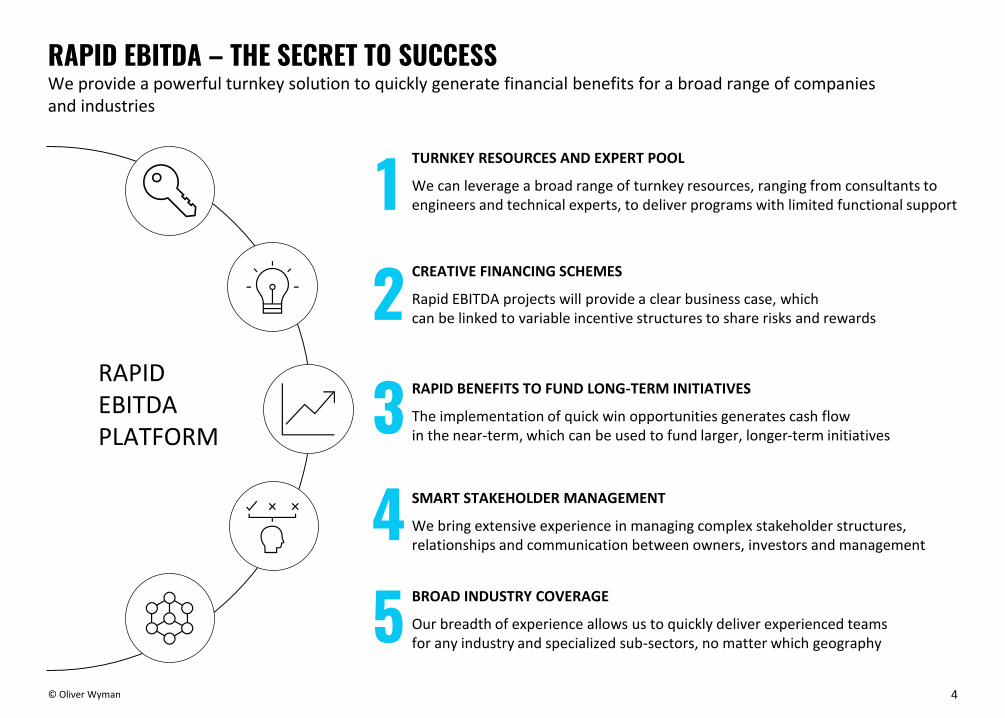
TURNKEY RESOURCES AND EXPERT POOL
We can leverage a broad range of turnkey resources, ranging from consultants to engineers and technical experts, to deliver programs with limited functional support
CREATIVE FINANCING SCHEMES
Rapid EBITDA projects will provide a clear business case, which can be linked to variable incentive structures to share risks and rewards2345
RAPID BENEFITS TO FUND LONG-TERM INITIATIVES
The implementation of quick win opportunities generates cash flowin the near-term, which can be used to fund larger, longer-term initiatives
SMART STAKEHOLDER MANAGEMENT
We bring extensive experience in managing complex stakeholder structures, relationships and communication between owners, investors and management
BROAD INDUSTRY COVERAGE
Our breadth of experience allows us to quickly deliver experienced teams for any industry and specialized sub-sectors, no matter which geography
RAPID EBITDA – THE SECRET TO SUCCESSWe provide a powerful turnkey solution to quickly generate financial benefits for a broad range of companies and industries
5© Oliver Wyman
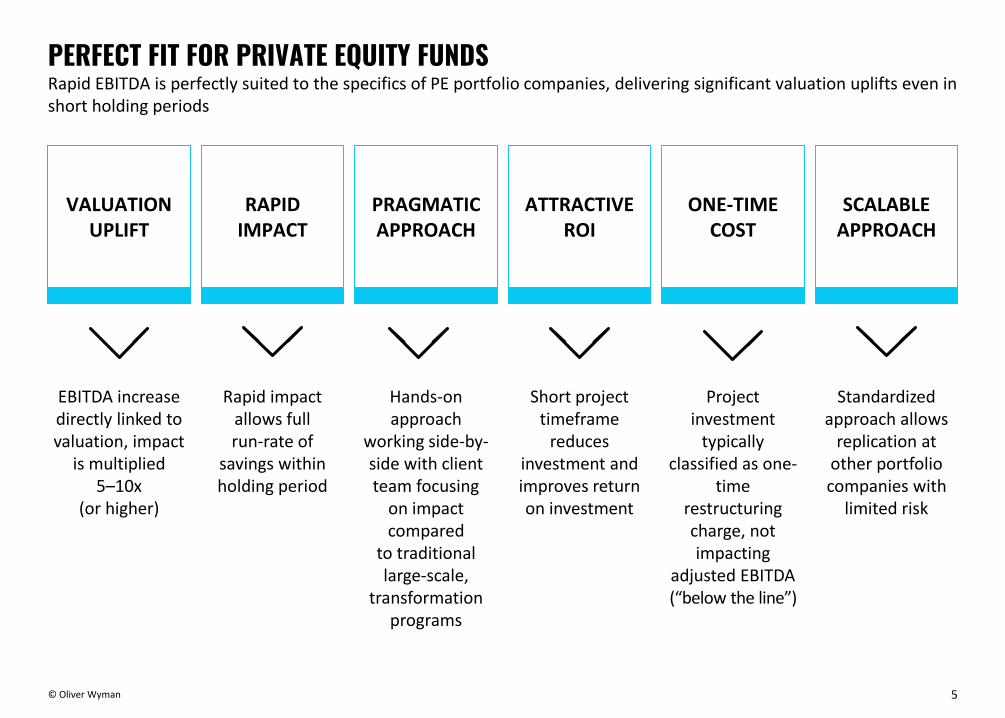
1 RAPID IMPACT
ATTRACTIVE ROI
PRAGMATIC APPROACH
ONE-TIME COST
SCALABLE APPROACH
VALUATION UPLIFT
EBITDA increase directly linked to valuation, impact
is multiplied 5–10x
(or higher)
Rapid impact allows full run-rate of
savings within holding period
Hands-on approach
working side-by-side with client team focusing
on impact compared
to traditional large-scale,
transformation programs
Short project timeframe
reduces investment and improves return on investment
Project investment
typically classified as one-
time restructuring charge, not impacting
adjusted EBITDA (“below the line”)
Standardized approach allows
replication at other portfolio companies with
limited risk
PERFECT FIT FOR PRIVATE EQUITY FUNDS Rapid EBITDA is perfectly suited to the specifics of PE portfolio companies, delivering significant valuation uplifts even in short holding periods
6© Oliver Wyman
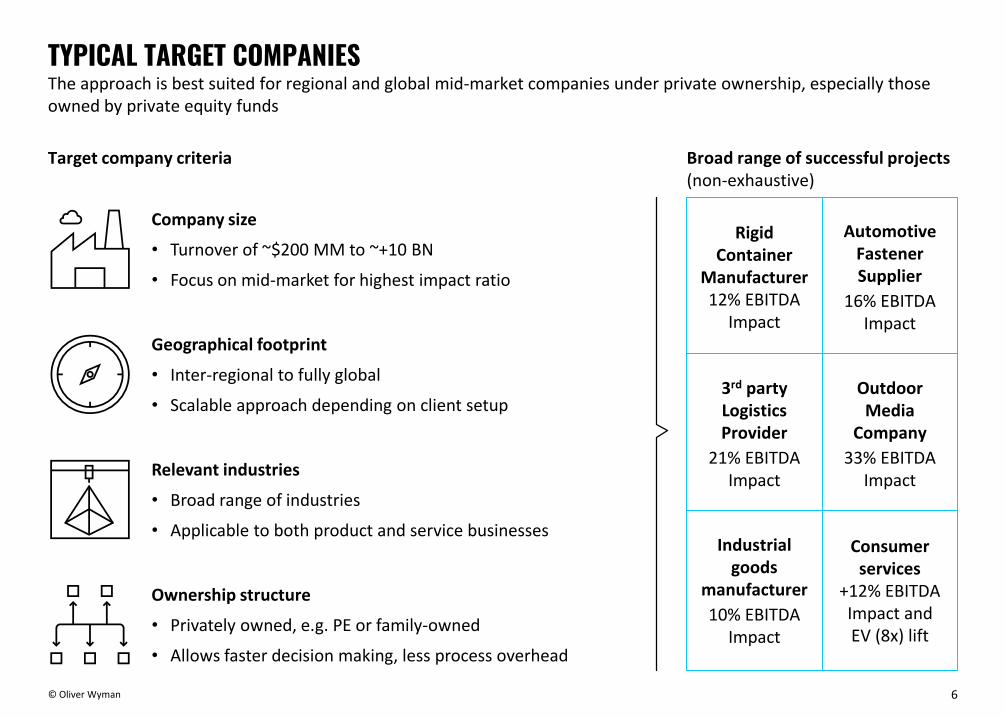
TYPICAL TARGET COMPANIESThe approach is best suited for regional and global mid-market companies under private ownership, especially those owned by private equity funds
Target company criteria Broad range of successful projects(non-exhaustive)
Geographical footprint
• Inter-regional to fully global
• Scalable approach depending on client setup
Relevant industries
• Broad range of industries
• Applicable to both product and service businesses
Company size
• Turnover of ~$200 MM to ~+10 BN
• Focus on mid-market for highest impact ratio
Ownership structure
• Privately owned, e.g. PE or family-owned
• Allows faster decision making, less process overhead
Rigid Container
Manufacturer12% EBITDA
Impact
AutomotiveFastenerSupplier
16% EBITDA Impact
3rd partyLogisticsProvider
21% EBITDA Impact
OutdoorMedia
Company
33% EBITDA Impact
Industrial goods
manufacturer
10% EBITDA Impact
Consumer services
+12% EBITDA Impact and EV (8x) lift
7© Oliver Wyman
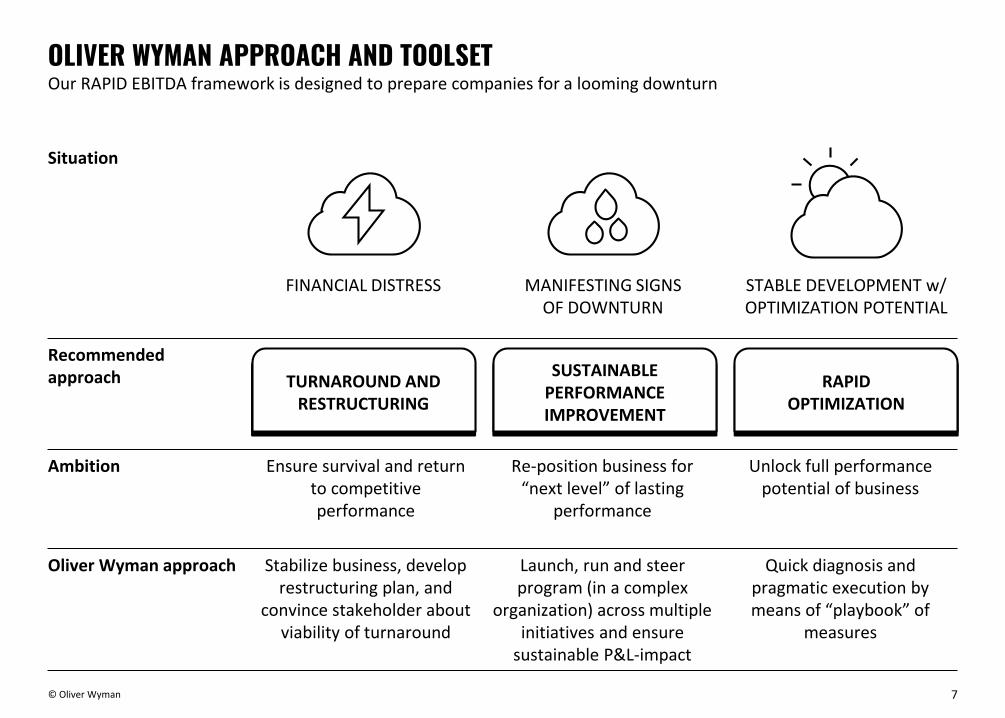
Ambition Ensure survival and return to competitive performance
Re-position business for “next level” of lasting
performance
Unlock full performance potential of business
Oliver Wyman approach Stabilize business, develop restructuring plan, and
convince stakeholder about viability of turnaround
Launch, run and steer program (in a complex
organization) across multiple initiatives and ensure
sustainable P&L-impact
Quick diagnosis and pragmatic execution by means of “playbook” of
measures
OLIVER WYMAN APPROACH AND TOOLSETOur RAPID EBITDA framework is designed to prepare companies for a looming downturn
Situation
TURNAROUND AND RESTRUCTURING
SUSTAINABLE PERFORMANCE IMPROVEMENT
Recommendedapproach
FINANCIAL DISTRESS MANIFESTING SIGNS OF DOWNTURN
STABLE DEVELOPMENT w/ OPTIMIZATION POTENTIAL
RAPIDOPTIMIZATION

RAPID EBITDA FRAMEWORK
2
9© Oliver Wyman
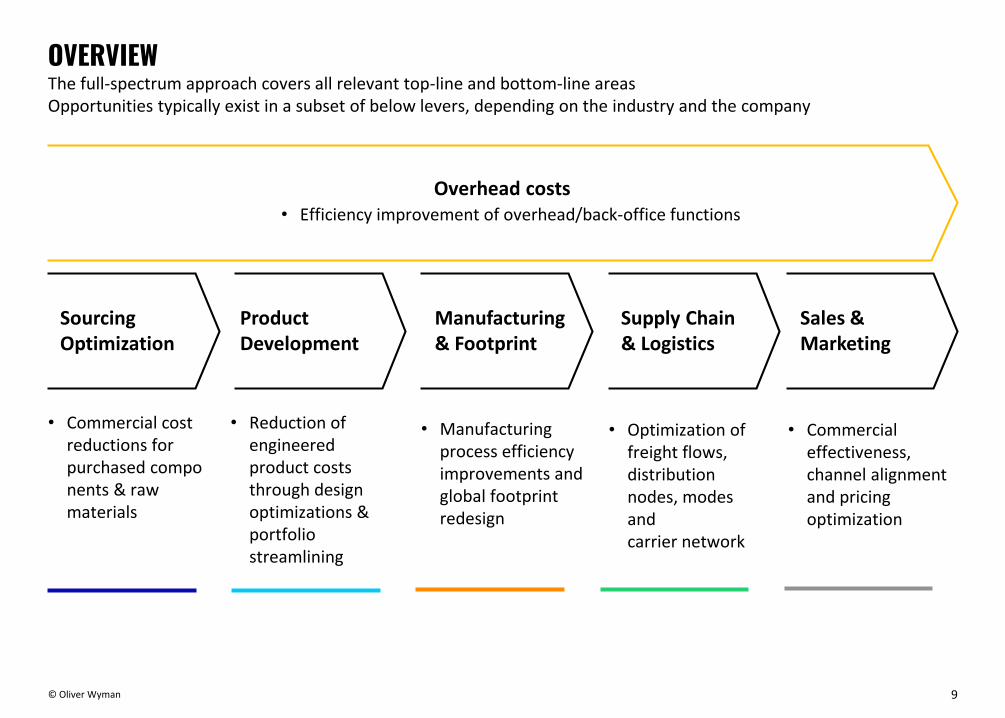
OVERVIEWThe full-spectrum approach covers all relevant top-line and bottom-line areas Opportunities typically exist in a subset of below levers, depending on the industry and the company
• Commercial cost reductions for purchased components & raw materials
• Reduction of engineered product costs through design optimizations & portfolio streamlining
• Manufacturing process efficiency improvements and global footprint redesign
• Optimization of freight flows, distribution nodes, modes and carrier network
• Commercial effectiveness, channel alignment and pricing optimization
Sourcing Optimization
Product Development
Manufacturing & Footprint
Supply Chain & Logistics
Sales & Marketing
Overhead costs• Efficiency improvement of overhead/back-office functions
10© Oliver Wyman
Direct material sourcing
Tier 2/3 sourcingIndirect spend optimization01 02 03
Headcount effectiveness
Zero-based budgeting20 21
Product cost-downProduct portfolio streamlining04 05
Sales force effectiveness Channel optimization
Pricing/customer profitability
Marketing effectiveness
16 17 18
19
Footprint optimization
Mfg. operations improvement
MRO optimization
Make/buy Digital manufacturing
06 07 08
09 10
Logistics network redesign
Warehouse process optimiz.
Demand planning/forecasting
Inventory optimization
Carrier/mode selection
11 12 13
14 15
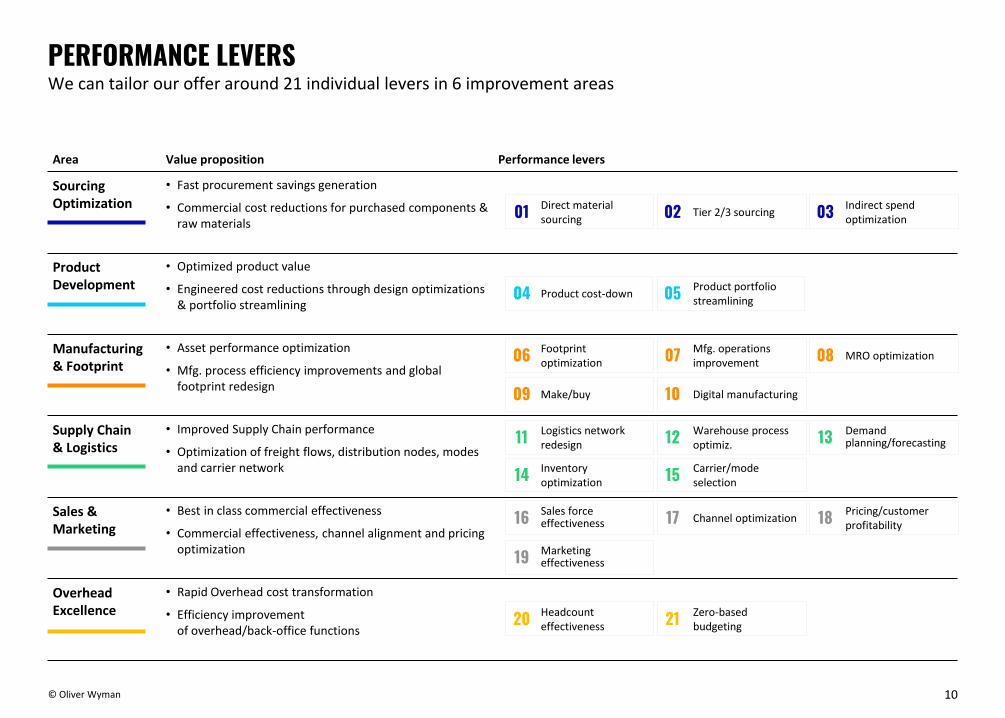
PERFORMANCE LEVERSWe can tailor our offer around 21 individual levers in 6 improvement areas
Area Value proposition Performance levers
Sourcing Optimization
• Fast procurement savings generation
• Commercial cost reductions for purchased components & raw materials
Product Development
• Optimized product value
• Engineered cost reductions through design optimizations & portfolio streamlining
Manufacturing & Footprint
• Asset performance optimization
• Mfg. process efficiency improvements and global footprint redesign
Supply Chain & Logistics
• Improved Supply Chain performance
• Optimization of freight flows, distribution nodes, modes and carrier network
Sales & Marketing
• Best in class commercial effectiveness
• Commercial effectiveness, channel alignment and pricing optimization
Overhead Excellence
• Rapid Overhead cost transformation
• Efficiency improvementof overhead/back-office functions
11© Oliver Wyman
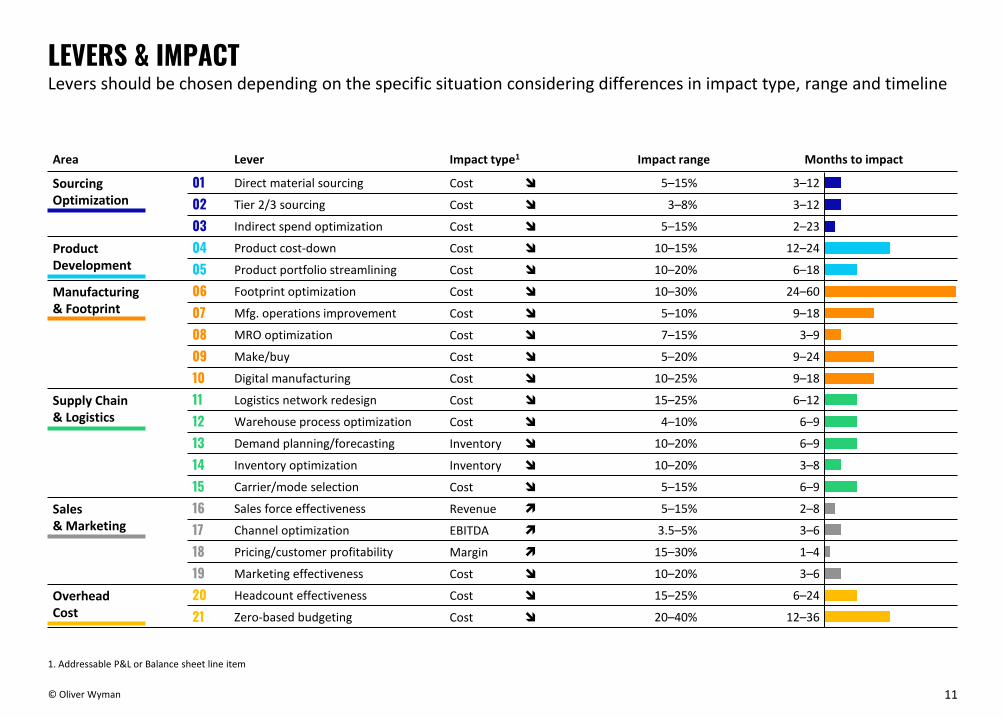
LEVERS & IMPACTLevers should be chosen depending on the specific situation considering differences in impact type, range and timeline
Area Lever Impact type1 Impact range Months to impact
Sourcing Optimization
01 Direct material sourcing Cost 5–15% 3–12
02 Tier 2/3 sourcing Cost 3–8% 3–12
03 Indirect spend optimization Cost 5–15% 2–23
Product Development
04 Product cost-down Cost 10–15% 12–24
05 Product portfolio streamlining Cost 10–20% 6–18
Manufacturing & Footprint
06 Footprint optimization Cost 10–30% 24–60
07 Mfg. operations improvement Cost 5–10% 9–18
08 MRO optimization Cost 7–15% 3–9
09 Make/buy Cost 5–20% 9–24
10 Digital manufacturing Cost 10–25% 9–18
Supply Chain & Logistics
11 Logistics network redesign Cost 15–25% 6–12
12 Warehouse process optimization Cost 4–10% 6–9
13 Demand planning/forecasting Inventory 10–20% 6–9
14 Inventory optimization Inventory 10–20% 3–8
15 Carrier/mode selection Cost 5–15% 6–9
Sales & Marketing
16 Sales force effectiveness Revenue 5–15% 2–8
17 Channel optimization EBITDA 3.5–5% 3–6
18 Pricing/customer profitability Margin 15–30% 1–4
19 Marketing effectiveness Cost 10–20% 3–6
Overhead Cost
20 Headcount effectiveness Cost 15–25% 6–24
21 Zero-based budgeting Cost 20–40% 12–36
1. Addressable P&L or Balance sheet line item
12© Oliver Wyman
WAVE 1~3–6 months
WAVE 2~3–6 months
WAVE …~3–6 months
A
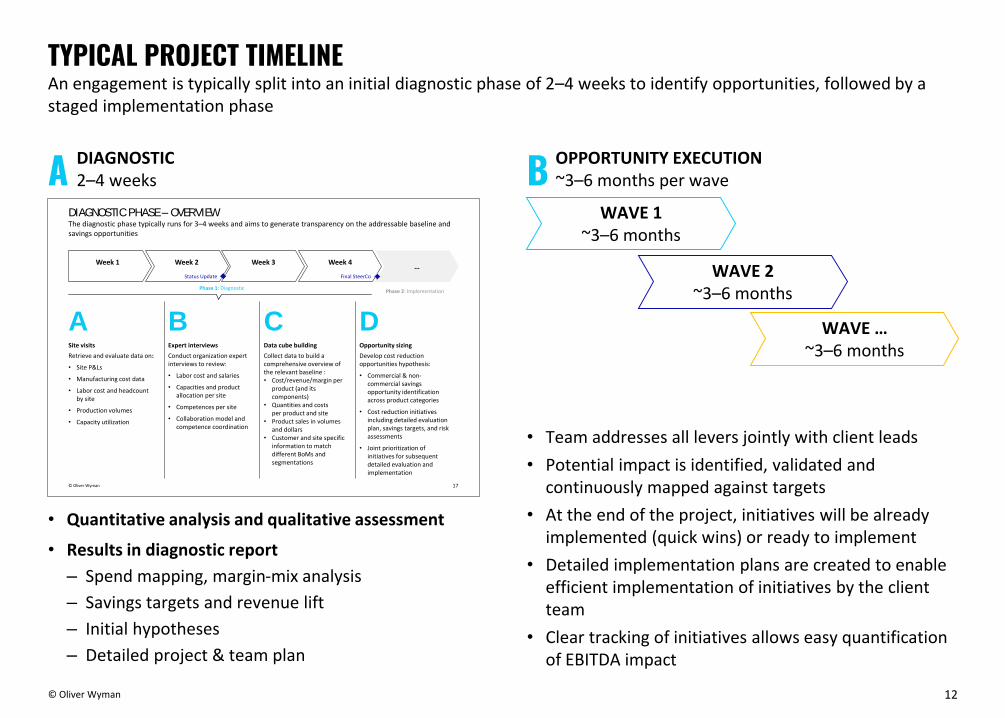
TYPICAL PROJECT TIMELINEAn engagement is typically split into an initial diagnostic phase of 2–4 weeks to identify opportunities, followed by a staged implementation phase
DIAGNOSTIC2–4 weeks
• Quantitative analysis and qualitative assessment
• Results in diagnostic report
– Spend mapping, margin-mix analysis
– Savings targets and revenue lift
– Initial hypotheses
– Detailed project & team plan
OPPORTUNITY EXECUTION~3–6 months per wave
• Team addresses all levers jointly with client leads
• Potential impact is identified, validated and continuously mapped against targets
• At the end of the project, initiatives will be already implemented (quick wins) or ready to implement
• Detailed implementation plans are created to enable efficient implementation of initiatives by the client team
• Clear tracking of initiatives allows easy quantification of EBITDA impact
B
17© Oliver Wyman
A B C DSite visits
Retrieve and evaluate data on:
• Site P&Ls
• Manufacturing cost data
• Labor cost and headcount by site
• Production volumes
• Capacity utilization
Expert interviews
Conduct organization expert interviews to review:
• Labor cost and salaries
• Capacities and product allocation per site
• Competences per site
• Collaboration model and competence coordination
Data cube building
Collect data to build a comprehensive overview of the relevant baseline : • Cost/revenue/margin per
product (and its components)
• Quantities and costs per product and site
• Product sales in volumes and dollars
• Customer and site specific information to match different BoMs and segmentations
Opportunity sizing
Develop cost reduction opportunities hypothesis:
• Commercial & non-commercial savings opportunity identification across product categories
• Cost reduction initiatives including detailed evaluation plan, savings targets, and risk assessments
• Joint prioritization of initiatives for subsequent detailed evaluation and implementation
Week 1 Week 2 Week 3…
Week 4
DIAGNOSTIC PHASE –OVERVIEWThe diagnostic phase typically runs for 3–4 weeks and aims to generate transparency on the addressable baseline and savings opportunities
Phase 1: DiagnosticPhase 2: Implementation
Status Update Final SteerCo
13© Oliver Wyman
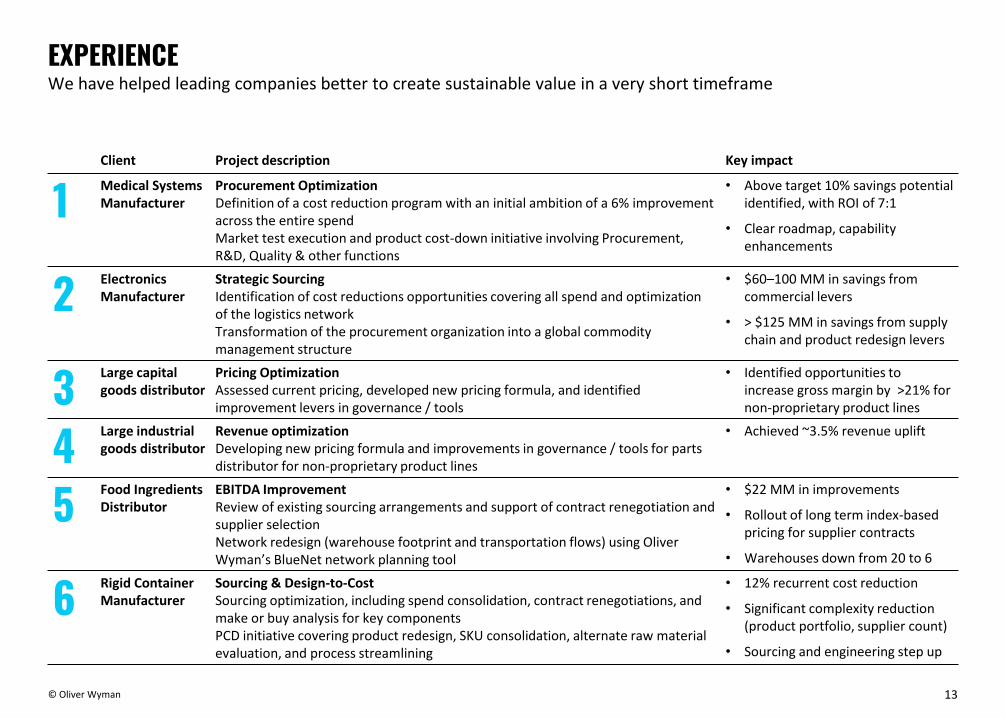
EXPERIENCEWe have helped leading companies better to create sustainable value in a very short timeframe
Client Project description Key impact
1 Medical Systems Manufacturer
Procurement OptimizationDefinition of a cost reduction program with an initial ambition of a 6% improvement across the entire spendMarket test execution and product cost-down initiative involving Procurement, R&D, Quality & other functions
• Above target 10% savings potential identified, with ROI of 7:1
• Clear roadmap, capability enhancements
2 Electronics Manufacturer
Strategic SourcingIdentification of cost reductions opportunities covering all spend and optimization of the logistics networkTransformation of the procurement organization into a global commodity management structure
• $60–100 MM in savings from commercial levers
• > $125 MM in savings from supply chain and product redesign levers
3 Large capital goods distributor
Pricing OptimizationAssessed current pricing, developed new pricing formula, and identified improvement levers in governance / tools
• Identified opportunities to increase gross margin by >21% for non-proprietary product lines
4 Large industrial goods distributor
Revenue optimizationDeveloping new pricing formula and improvements in governance / tools for parts distributor for non-proprietary product lines
• Achieved ~3.5% revenue uplift
5 Food Ingredients Distributor
EBITDA ImprovementReview of existing sourcing arrangements and support of contract renegotiation and supplier selectionNetwork redesign (warehouse footprint and transportation flows) using Oliver Wyman’s BlueNet network planning tool
• $22 MM in improvements
• Rollout of long term index-based pricing for supplier contracts
• Warehouses down from 20 to 6
6 Rigid Container Manufacturer
Sourcing & Design-to-CostSourcing optimization, including spend consolidation, contract renegotiations, and make or buy analysis for key componentsPCD initiative covering product redesign, SKU consolidation, alternate raw material evaluation, and process streamlining
• 12% recurrent cost reduction
• Significant complexity reduction (product portfolio, supplier count)
• Sourcing and engineering step up

RAPID EBITDA BIOS
3
15© Oliver Wyman
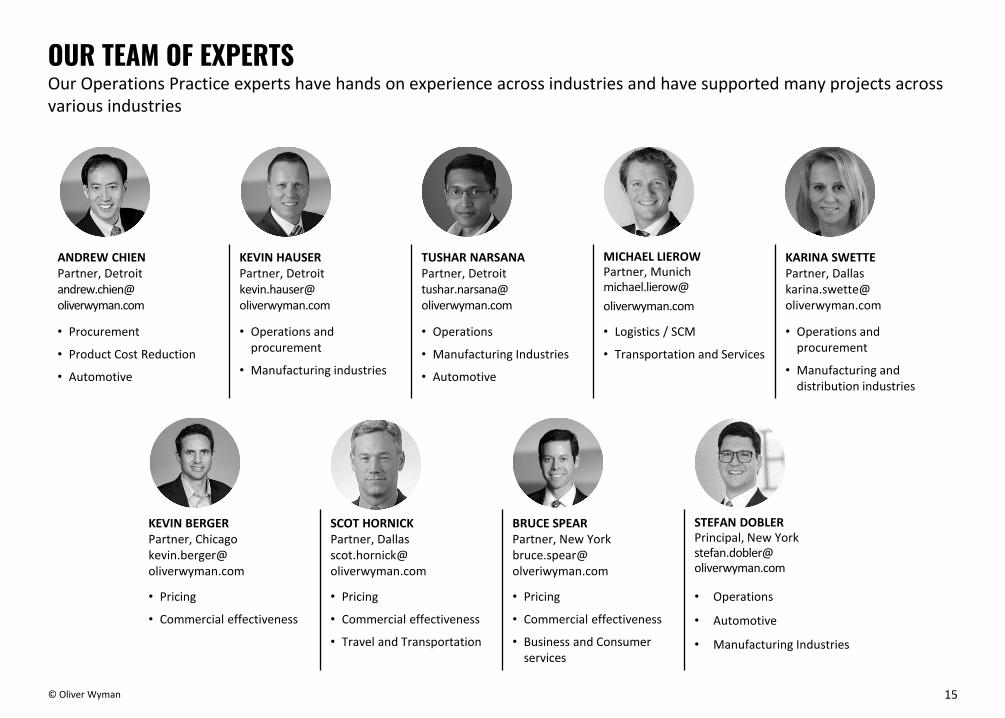
OUR TEAM OF EXPERTSOur Operations Practice experts have hands on experience across industries and have supported many projects across various industries
ANDREW CHIENPartner, [email protected]
KEVIN HAUSERPartner, [email protected]
TUSHAR NARSANAPartner, Detroittushar.narsana@ oliverwyman.com
MICHAEL LIEROWPartner, Munichmichael.lierow@
oliverwyman.com
KARINA SWETTEPartner, [email protected]
• Procurement
• Product Cost Reduction
• Automotive
• Operations and procurement
• Manufacturing industries
• Operations
• Manufacturing Industries
• Automotive
• Logistics / SCM
• Transportation and Services
• Operations and procurement
• Manufacturing and distribution industries
KEVIN BERGERPartner, [email protected]
SCOT HORNICKPartner, [email protected]
BRUCE SPEARPartner, New [email protected]
STEFAN DOBLERPrincipal, New [email protected]
• Pricing
• Commercial effectiveness
• Pricing
• Commercial effectiveness
• Travel and Transportation
• Pricing
• Commercial effectiveness
• Business and Consumer services
• Operations
• Automotive
• Manufacturing Industries
QUALIFICATIONS, ASSUMPTIONS AND LIMITING CONDITIONSThis report is for the exclusive use of the Oliver Wyman client named herein. This report is not intended for general circulation or publication, nor is it to be reproduced, quoted or distributed for any purpose without the prior written permission of Oliver Wyman. There are no third party beneficiaries with respect to this report, and Oliver Wyman does not accept any liability to any third party.
Information furnished by others, upon which all or portions of this report are based, is believed to be reliable but has not been independently verified, unless otherwise expressly indicated. Public information and industry and statistical data are from sources we deem to be reliable; however, we make no representation as to the accuracy or completeness of such information. The findings contained in this report may contain predictions based on current data and historical trends. Any such predictions are subject to inherent risks and uncertainties. Oliver Wyman accepts no responsibility for actual results or future events.
The opinions expressed in this report are valid only for the purpose stated herein and as of the date of this report. No obligation is assumed to revise this report to reflect changes, events or conditions, which occur subsequent to the date hereof.
All decisions in connection with the implementation or use of advice or recommendations contained in this report are the sole responsibility of the client. This report does not represent investment advice nor does it provide an opinion regarding the fairness of any transaction to any and all parties.