Embed Size (px)
Citation preview
Rapid point-of-care assessment (of coagulation) -
A guide to the Obstetric Anaesthetists’ laboratory of the future
Dr John LoughreyThe Rotunda Hospital, Dublin.

Point-of-Care (POC) testing
• What is it?
• Do we need it in Maternity units?
• Maternal Haemorrhage
• Anticoagulants/Bleeding Diatheses
• Where is it heading?
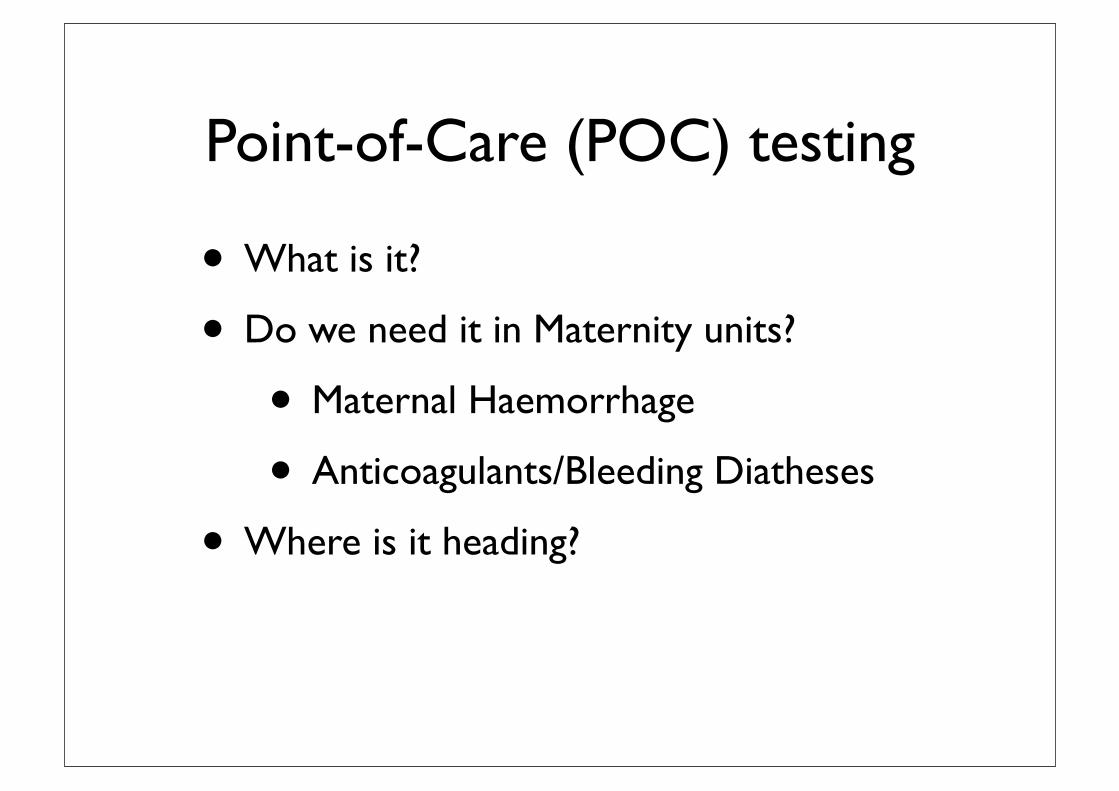
Scottish Confidential Audit of Severe Maternal Morbidity: 6th Annual Report
!"#$$%&'()#*+%,-*$%./(01,%$(#+(!-2-3-(4.$-3*./(4#35%,%$67(8$'(0**1./(9-:#3$(;<<=(!
!!!
! "#
!"#$%&'()'*$+,&%'-.'/-+&0'/"12'+34-%'-,51&1%"6'23&+-%%23#&'307'-12&%'+-%,"7"1"&5'(889':'(88;'
!
"!!
#!!
$!!
%!!
#!!$ #!!% #!!& #!!' #!!( #!!)
!"#$
%&'
("$)*
+)'
",-./01"2"$"
3)$(.4./5 *+, -./0+11-.2/
3.4+1 +567/7189 -./0+11-.2/
'!!"#$%&'9)'<31&5'-.'/-+&0'/"12'+34-%'-,51&1%"6'23&+-%%23#&'307'-12&%'+-%,"7"1"&5'(889':'(88;'
!
#
%
'
)
#!!$ #!!% #!!& #!!' #!!( #!!)
!"#$
6#/"
7"$8999
:.2"(.$/0;
*+, -./0+11.2/
3.4+1 +567/7189 -./0+11.2/
'(>'-(&.?-(@3#1:%*@A(%*$#(4BC(.*,(*#*D4BCA(".*(1&-+1//6(5-(1&-,(E'-*(-F.?%*%*@(:-3%*.$./(?#3$./%$6G(H*+#3?.$%#*(#*($'-(#1$"#?-(+#3($'-(5.56(#+(?#$'-3&(&1++-3%*@(&-2-3-(?#35%,%$6(E.&(*#$("#//-"$-,(5-+#3-(;<<I(.*,(%*(&15&-J1-*$(6-.3&($'-(%*+#3?.$%#*('.&(*#$(5--*("#*&%&$-*$/6(3-"#3,-,A(./$'#1@'($'%&(%?:3#2-,(%*(;<<=(.&(%$(E.&(3-"#3,-,(+#3(=<K(#+(?#$'-3&(-F:-3%-*"%*@(&-2-3-(?.$-3*./(?#35%,%$6G(L#*-$'-/-&&A($'-('%@'(:-3%*.$./(?#3$./%$6(.?#*@($'-&-(E#?-*(".*(5-(&--*(56("./"1/.$%*@($'-(3.$-(+#3($'#&-(E#?-*(+#3(E'#?($'-(%*+#3?.$%#*(E.&(3-"#3,-,(M>.5/-(8NG(>'-(:-3%*.$./(?#3$./%$6(3.$-(+#3(.//(5%3$'&(%*(!"#$/.*,(%*(;<<=(E.&(OGP(:-3(Q<<<(5%3$'&Q;G('

What happens in Obstetric Haemorrhage ?
• Delay in Diagnosis
• Delay in Senior Clinician involvement
• Lab delays
• Transfusion practice varies
• Coagulation results ‘historical’


SpHb

Society for Technology in Anesthesia
Section Editor: Dwayne Westenskow
The Accuracy of Noninvasive and Continuous TotalHemoglobin Measurement by Pulse CO-Oximetry inHuman Subjects Undergoing HemodilutionMark R. Macknet, MD, Martin Allard, MBChB, FRCA, Richard L. Applegate, II, MD,and James Rook, DO
BACKGROUND: Total hemoglobin (tHb) is one the most frequently ordered laboratory measure-ments. Pulse CO-Oximetry™ (Masimo Corp., Irvine, CA) is a multi-wavelength spectrophotometricmethod for noninvasive and continuous hemoglobin monitoring (SpHb). In this study, weevaluated the accuracy of SpHb compared with laboratory CO-Oximeter measurement of tHb fromarterial blood samples in 20 healthy volunteer subjects undergoing hemodilution.METHODS: After enrollment, approximately 500 mL of blood was drawn from subjects through anarterial or venous catheter. Each subject then rapidly received crystalloid IV fluid to compensatefor the decrease in intravascular volume and reduce the hemoglobin concentration. Subjectsreceived a maximum of 30 mL/kg IV fluid. SpHb was continuously monitored and recorded, andserial arterial blood samples were taken during the procedure. SpHb accuracy was analyzed bypairing SpHb and tHb measurements after the arterial blood draw with the resulting tHb testresult. Bias, precision, and the average root-mean-square error were calculated.RESULTS: One hundred sixty-five tHb measurements were collected. The average decrease intHb during the blood removal and hemodilution procedure was 2.4 ! 0.8 g/dL (mean ! SD). Theaverage difference between 335 paired measurements of SpHb and tHb was "0.15 g/dL, 1 SDof the difference was 0.92 g/dL, and the average root-mean-square difference was 0.94 g/dL.The difference between SpHb and tHb was #2.0 g/dL for 97% of the measurements. Thedifference was #1.5 g/dL for 97% of the measurements when tHb was #10 g/dL.CONCLUSIONS: Pulse CO-Oximetry–based SpHb measurement is accurate within 1.0 g/dL(1 SD) compared with laboratory CO-Oximeter tHb measurement in subjects undergoinghemodilution. (Anesth Analg 2010;111:1424–6)
Total hemoglobin (tHb) is one the most frequentlyordered laboratory measurements in both acute andoutpatient settings.1 Current laboratory methods are
invasive, time consuming, and provide only intermittenthemoglobin measurements. Noninvasive and continuoushemoglobin measurement would offer many advantages inthe assessment of both acute and chronic anemic status in avariety of clinical settings. Pulse CO-Oximetry™ (MasimoCorp., Irvine, CA) is a multi-wavelength spectrophotomet-ric method that has recently received Food and DrugAdministration 510(k) clearance for noninvasive, immedi-ate, and continuous hemoglobin monitoring (SpHb).a The
purpose of this study was to compare simultaneous mea-surements of hemoglobin using noninvasive pulse CO-Oximetry and invasive laboratory CO-Oximetry (tHb) innormal subjects undergoing hemodilution.
METHODSEligibilityEnglish-speaking male and nonpregnant female volunteersubjects between 18 and 30 years of age were eligible for thestudy if they were categorized as ASA physical status I(normal, healthy subject without organic, physiologic, orpsychiatric disturbances) or II (subject with controlled medicalconditions without significant systemic effects). Subjects wereexcluded if they had hemoglobin #12 g/dL, known drug oralcohol abuse, skin abnormalities affecting the digits, experi-enced a head injury in the previous year, known neurologicand psychiatric disorders, known chronic usage of psychoac-tive or anticonvulsive drugs within 90 days or any use withinthe previous 7 days, hypertension, baseline heart rate #50bpm, or any medical condition which, in the judgment of theinvestigator, rendered them inappropriate for participation inthe study. The study was approved by an independent IRB,which adheres to the Declaration of Helsinki and UnitedStates Code of Federal Regulations. All patients providedwritten, informed consent to the study procedures as outlinedin the protocol.
From the Department of Anesthesiology, Loma Linda University, LomaLinda, California.Accepted for publication July 15, 2010.Supported by Masimo Corp., Irvine, CA (to the Department of Anesthesi-ology, Loma Linda University).Disclosure: MRM and MA have received honoraria from Masimo Corp. Theother authors report no conflicts of interest.Address correspondence and reprint requests to Mark R. Macknet, MD,11234 Anderson St., Suite 2532, Loma Linda, CA 92354. Address e-mail [email protected] and Drug Administration. 510(k) K080238 Masimo Radical 7/Rad87/Rad 57t-SpHb. May 12, 2008. Available at: http://www.accessdata.fda.gov/cdrh_docs/pdf8/K080238.pdf. Accessed June 5, 2009.Copyright © 2010 International Anesthesia Research SocietyDOI: 10.1213/ANE.0b013e3181fc74b9
1424 www.anesthesia-analgesia.org December 2010 • Volume 111 • Number 6
When evaluating any new method for measuring hemo-globin, the reference method contains inherent variability.Of all the methods available to measure tHb, CO-Oximetersare considered the most accurate and have the highestdegree of interdevice reliability.3 In an intradevice compari-son of 5 different CO-Oximeters, there was a range of 0.1 to1.3 g/dL difference and an average standard deviation of0.5 g/dL when measuring the same blood sample on 2separate devices of the same model type.4 In an interdevicecomparison of 31 different CO-Oximeters, there was a 0.4 to
0.9 g/dL range of difference depending on what range oftHb was being analyzed.5
The tHb measurement is performed !400 million timesper year in the United States, either by itself or as part of apanel of other laboratory tests.1 This makes tHb measure-ment more frequent than any other laboratory variable, andindicates a large potential benefit if a validated noninvasivemethod were available.6 Some of the potential benefits ofcontinuous noninvasive hemoglobin monitoring includehastening the detection of postoperative bleeding, prevent-ing the overtransfusion of blood products during surgery,reducing phlebotomy-induced anemia in the intensive careunit, and increasing patient safety and comfort in all careareas where hemoglobin testing is done.
The limitations of this study are that the monitor wasnot evaluated in critically ill subjects, those with extremelylow perfusion, or those with known peripheral vasculardisease. No data were collected when tHb was "7 g/dL.This study in healthy subjects in a controlled procedure didnot measure the potential clinical advantages of continuousmonitoring on blood management and earlier detection ofbleeding.
CONCLUSIONThis study of the first commercialized noninvasive pulseCO-Oximetry found that its SpHb measurement is accurateto 1 g/dL (1 SD) compared with laboratory CO-OximetertHb measurement in subjects undergoing hemodilution. Fu-ture studies should examine SpHb accuracy in other popula-tions and its impact on clinical decision making.
REFERENCES1. DeFrances CJ, Lucas CA, Buie VC, Golosinskiy A. 2006 National
Hospital Discharge Survey. Natl Health Stat Report 2008;(5):1–202. Performance characteristics. In: ABL800 Reference Manual. Copen-
hagen: Denmark Radiometer Medical ApS, 2004:5.28–5.303. Shapiro BA, Peruzzi WT, Templin R. Clinical Application of
Blood Gases. 5th ed. Chicago: CV Mosby, 1994:334–64. Gehring H, Duembgen L, Peterlein M, Hagelberg S, Dibbelt L.
Hemoximetry as the “gold standard”? Error assessment basedon differences among identical blood gas analyzer devices offive manufacturers. Anesth Analg 2007;105:S24–30
5. RNA Medical. CVC 223 CO-Oximeter Calibration VerificationControls. Devens, MA: RNA Medical, Division of Bionostics
6. Rosen S. Hematology. In: Carlson B, ed. The Worldwide Marketfor In Vitro Diagnostic Tests. 5th ed. New York: KaloramaInformation, 2006:235–44
Figure 1. A scatterplot of 165 reference hemoglobin values asdetermined by laboratory CO-Oximetry (tHb) and 335 simultaneousnoninvasive hemoglobin values (SpHb) collected from 20 subjectsundergoing hemodilution. The average difference (bias) betweenSpHb and tHb was #0.15 g/dL, 1 SD of the difference (precision)was 0.92 g/dL, and the average root-mean-square difference was0.94 g/dL.
Figure 2. A Bland-Altman plot of 165 hemoglobin values as deter-mined by CO-Oximetry (tHb) versus 335 simultaneous noninvasivehemoglobin values (SpHb) collected from 20 subjects undergoinghemodilution. Bland-Altman plot with mean hemoglobin difference(SpHb # tHb) and standard deviation shown by dashed (1 SD) andsolid (2 SDs) lines.
Table 1. SpHb Accuracy by tHb Range
tHb range All values
No. of samples (% of samples) withdifference between SpHb and tHba
< ! 1.0g/dL
< ! 1.5g/dL
< ! 2.0g/dL
"10 g/dL 79 (24%) 64 (81%) 78 (99%) 79 (100%)10–11.9 g/dL 160 (48%) 115 (72%) 141 (88%) 153 (96%)12–15 g/dL 96 (29%) 69 (72%) 83 (86%) 91 (95%)7.5–15 g/dL 335 (100%) 248 (74%) 302 (90%) 324 (97%)
SpHb $ spectrophotometric method for noninvasive and continuous hemo-globin monitoring; tHb $ total hemoglobin.a The differences between SpHb and tHb as a function of tHb. An accuracyanalysis grouping the hemoglobin values in 3 subgroups ("10 g/dL, 10–11.9g/dL, and 12–15 g/dL) and the percentage of those values that are within 3defined accuracy limits (! % 1.0 g/dL, ! % 1.5 g/dL, and ! %2.0 g/dL). Thisanalysis and the results from the Bland-Altman plot demonstrate the in-creased accuracy of the device at lower hemoglobin concentrations.
Accuracy of Noninvasive Hemoglobin
1426 www.anesthesia-analgesia.org ANESTHESIA & ANALGESIA
Point-of-Care Coagulation Devices
• Viscoelastic Coagulation Monitors
• TEG
• ROTEM
• Modifications
• Other Devices
• PFA-100
• Instant INR

Viscoelastic Coagulation AssessmentMechanics of Sample Measurement

Viscoelastic Coagulation Assesment
their ability to monitor different pharmacological sub-stances interacting with hemostasis in the periopera-tive setting. Viscoelastic POC devices have also beenused for coagulation testing of certain hemostaticdisorders or syndromes in the hemostasis laboratory,but will not be discussed in this review.
Thrombelastography, ThrombelastometryThrombelastography was first described by Hartert
in 1948 as a method to assess the global hemostaticfunction from a single blood sample.5 In the earlierliterature, the terms “thrombelastography,” “throm-belastograph,” and “TEG!” have been used generi-cally. However, in 1996 thrombelastograph! andTEG! became registered trademarks of the Hemo-scope Corporation (Niles, IL) and from that time onthese terms have been used to describe the assayperformed using Hemoscope instrumentation only.Alternatively, Pentapharm GmbH (Munich, Germany)markets a modified instrumentation using the termi-nology rotation thrombelastometry, ROTEM!.3
The TEG/ROTEM! assess the viscoelastic proper-ties of blood samples under low shear conditions. TheTEG! (Fig. 1A) measures the clot’s physical propertyby using a stationary cylindrical cup that holds theblood sample and oscillates through an angle of 4°45!.Each rotation cycle lasts 10 s. A pin is suspended in theblood by a torsion wire and is monitored for motion(Fig. 2A). The torque of the rotation cup is transmittedto the immersed pin only after fibrin-platelet bonding
has linked the cup and pin together. The strength ofthese fibrin-platelet bonds affects the magnitude of thepin motion. Thus, the output is directly related to thestrength of the formed clot. As the clot retracts orlyses, these bonds are broken and the transfer of cupmotion is again diminished. The rotation movement ofthe pin is converted by a mechanical-electrical trans-ducer to an electrical signal, finally being displayed asthe typical TEG! tracing (Fig. 3A). The ROTEM! instru-ment (Fig. 1B) uses a modified technology: the signal ofthe pin suspended in the blood sample is transmitted viaan optical detector system, not a torsion wire, and themovement is initiated from the pin, not the cup (Fig.2B).6 Furthermore, the instrument is equipped with anelectronic pipette.
TEG/ROTEM! both measure and graphically displaythe changes in viscoelasticity at all stages of the developingand resolving clot, i.e., the time until initial fibrin formation(TEG! reaction time; ROTEM! clotting time [CT]), thekinetics of fibrin formation and clot development (TEG!kinetics, ! angle [!]; ROTEM! clot formation time, ! angle[!]), the ultimate strength and stability of the fibrin clot(TEG! maximum amplitude [MA]; ROTEM! maximumclot firmness [MCF]), and clot lysis (fibrinolysis) (Table 2).7,8
TEG/ROTEM! are fibrinolysis-sensitive assays and allowfor diagnosis of hyperfibrinolysis in bleeding patients.3,9 Inour review, the variables from the TEG/ROTEM! will bereferred to as they respectively relate to each instrument,for example, R/CT or MA/MCF.
Figure 1. Viscoelastic point-of-care co-agulation devices. A, Thrombelasto-graph, TEG (Hemoscope Corp., Niles,IL). B, Rotation Thrombelastometry,ROTEM (Pentapharm GmbH, Munich,Germany). C, Sonoclot Analyzer (SiencoInc., Arvada, CO).
Figure 2. Working principles of viscoelastic point-of-care coagulation devices. A, Thrombelastograph (TEG"): rotating cup with blood sample(1), coagulation activator (2), pin and torsion wire (3), electromechanical transducer (4), data processing (5). B, Rotation Thrombelastography(ROTEM"): Cuvette with blood (1), activator added by pipetting (2), pin and rotating axis (3), electromechanical signal detection via light sourceand mirror mounted on axis (4), data processing (5). C, Sonoclot: Blood sample in cuvette (1) containing activator (2), disposable plastic probe(3) oscillating in blood sample mounted on electromechanical transducer head (4), data processing (5).
Vol. 106, No. 5, May 2008 © 2008 International Anesthesia Research Society 1367

14
Normal Hemostasis
Initiation
Platelet activation Fibrin strands form
Clot grows
Maximum clot strength
Clot degradation
Clot dissolvedDamage healed
Time
║
║
23
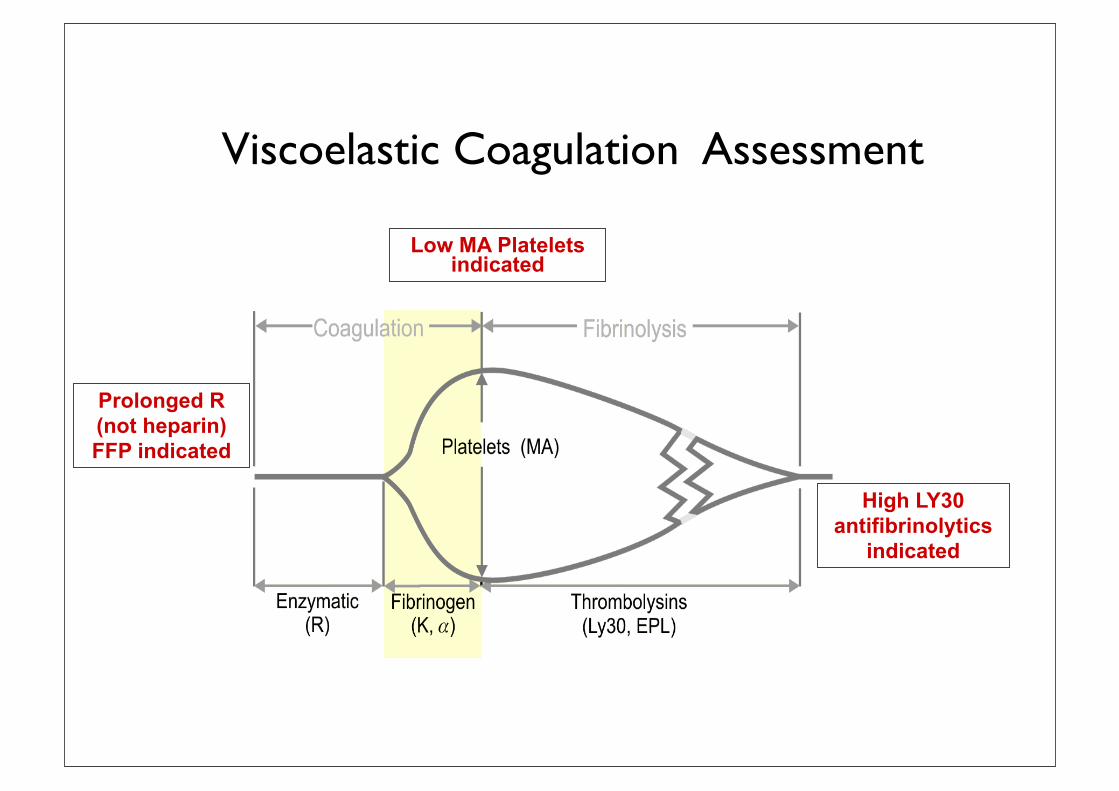
Viscoelastic Coagulation Assessment Low MA Platelets
indicated
Prolonged R (not heparin) FFP indicated
High LY30 antifibrinolytics
indicated
Viscoelastic Point-of-Care Coagulation Devices - reagents
activated platelet count to the non-activated platelet countis a function of reactivity of the platelets. Early investi-gation indicates that this assay correlates well with stan-dard platelet aggregometry and is capable of measuringthe platelet dysfunction induced by GPIIb/IIIa receptorinhibitors and clopidogrel.8 40 Although the disadvantageof Platelet Works is that it is not well studied, investi-gations show that it is capable of measuring the plateletdysfunction that accompanies CPB.49
The real value in testing the platelet response to aspecific agonist is derived from the measure of specificplatelet defects that accompany anti-thrombotic drugtherapy. Many of these tests utilize small doses of agoniststhat are sensitive to drug therapy but are not sufficient tochallenge platelet function that is more severely compro-mised. When platelet function is overtly deranged, such asafter CPB, a potent agonist is necessary to determinewhether the platelet can respond. This potent agonist isusually thrombin and is the ‘natural’ platelet agonist that isused in the visco-elastic tests of clot formation. Thus, thevisco-elastic tests, thromboelastography and thromboelas-tometry, have been most frequently used in transfusionalgorithms for bleeding patients as described below.
Visco-elastic tests of clot formation
Sonoclot
The Sonoclot Analyzer (Sienco Inc., Wheat Ridge, CO,USA) is a test of the visco-elastic properties of blood thatprovides accurate information on the entire haemostasisprocess including coagulation factors, fibrin gel formation,clot retraction (platelet function), and fibrinolysis. Thisdevice consists of a tubular probe that oscillates up anddown within a blood sample. The viscous force of the bloodcreates impedance to the ultrasonic vibrating probe as itclots, which is converted to an output signal. This electronicsignal is processed by a microcomputer and is reported asthe Clot Signal. The Sonoclot Analyzer reports these proper-ties by graphically recording the dynamics of clot formationas a Sonoclot Signature and also yields quantitative results.The Sonoclot Signature is the plotted values of the ClotSignal value vs time. The quantitative results include a lagperiod (SonACT) that corresponds to activated clotting time(ACT) and a wave that occurs as a result of cross-linkage offibrin (Clot RATE). Other parameters in the tracing indicateplatelet–fibrin binding, fibrin formation, and clot retraction.Clot retraction is a measure of platelet activity and its quan-titative parameter is the time to peak. Haemostasis abnorm-alities including platelet dysfunction, factor deficiencies,anticoagulant effects, hyperfibrinolysis, and hypercoagul-able states can be detected using the Sonoclot. In addition,Sonoclot analysis has been successfully used for diagnosingand treating platelet dysfunction and bleeding disordersafter CPB.20 46 51
Thromboelastograph
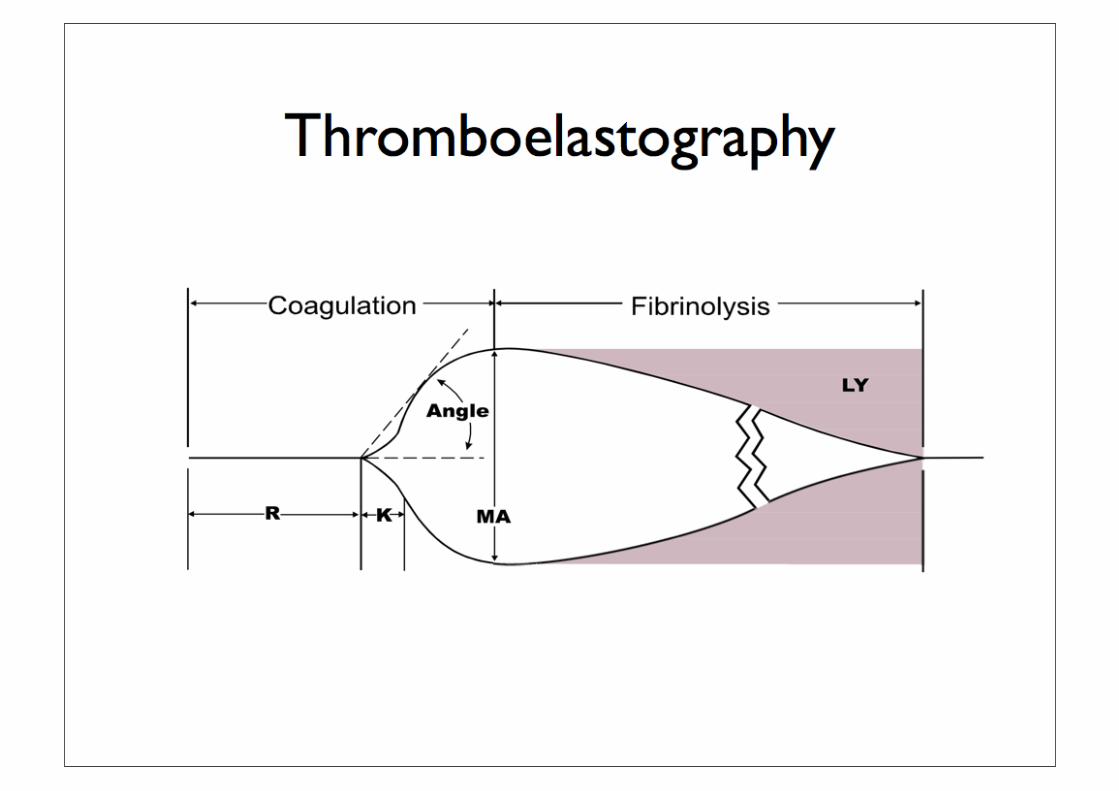
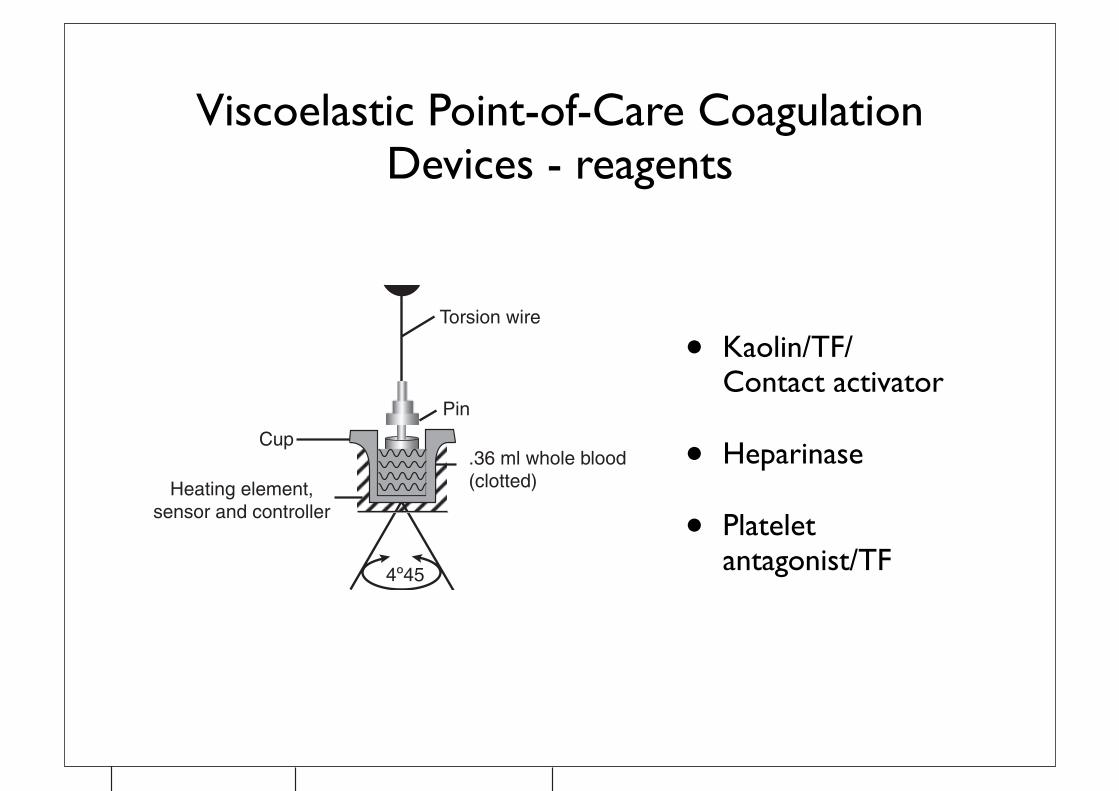
The thromboelastograph (TEG), invented in 1948, isanother test of the visco-elastic properties of blood thatexamines the time of initiation through acceleration,control, and eventual lysis. Initially used for coagulationmonitoring during liver transplantation, the TEG hasfound applications in cardiovascular surgery, obstetricanaesthesia, and trauma anaesthesia.5 22 34 35 77 A smallamount of blood (0.36 ml) is placed in an oscillatingcuvette and a piston is lowered into the blood sample. Thecuvette oscillates at an arc angle of 48 45 min. As theblood begins to clot, the elastic force exerted on the pistonis translated to a signature tracing (thromboelastogram;Fig. 1) that reveals information about fibrin formation,platelet–fibrin interactions, platelet clot strength, and fibri-nolysis. With the current disposables, an activator isneeded because the onset to coagulation varies, and thetime to clot formation can conveniently be accelerated sothat the test is useful in POC settings. Celite, kaolin, ortissue factor have all been used to activate the TEG.30 72
There are five parameters to the TEG tracing thatmeasure different stages of clot development: R, K, aangle, maximum amplitude (MA), and MA60 (Fig. 2). Inaddition, clot lysis indices are measured at 30 and 60 minafter MA (LY30 and LY60). Normal values vary depend-ing on the type of activator used. The R value is a
Torsion wire
Pin
.36 ml whole blood(clotted)
Cup
Heating element,sensor and controller
4º45
Fig 1 The thromboelastograph uses whole blood in an oscillating cuvette
into which a piston is lowered. The movement of the cuvette is translatedto an oscillograph tracing as the blood thickens and exerts a force on thepiston. This generates the signature thromboelastographic tracing.
MAK
TMA CLT
R
30 min
A30
Fig 2 The signature thromboelastograph tracing is shown here with
parameters labelled. See text for further details.
Enriquez and Shore-Lesserson
i16
by guest on October 24, 2011
http://bja.oxfordjournals.org/D
ownloaded from
• Kaolin/TF/ Contact activator
• Heparinase
• Platelet antagonist/TF

You want me to
scrub in?
Can you do something about the bleeding?
Blood Transfusion and the Anaesthetist
Management of Massive Haemorrhage
Published byThe Association of Anaesthetists of Great Britain and Ireland21 Portland Place, London, W1B 1PYTelephone 020 7631 1650 Fax 020 7631 [email protected] November 2010
AAGBI SAFETY GUIDELINE

“... if available, undertake near-patient testing eg TEG or ROTEM “
“baseline bloods - FBC, PT, APTT, Clauss Fibrinogen and crossmatch”
“a protocol for blood product usage based on TEG should be agreed in
advance”
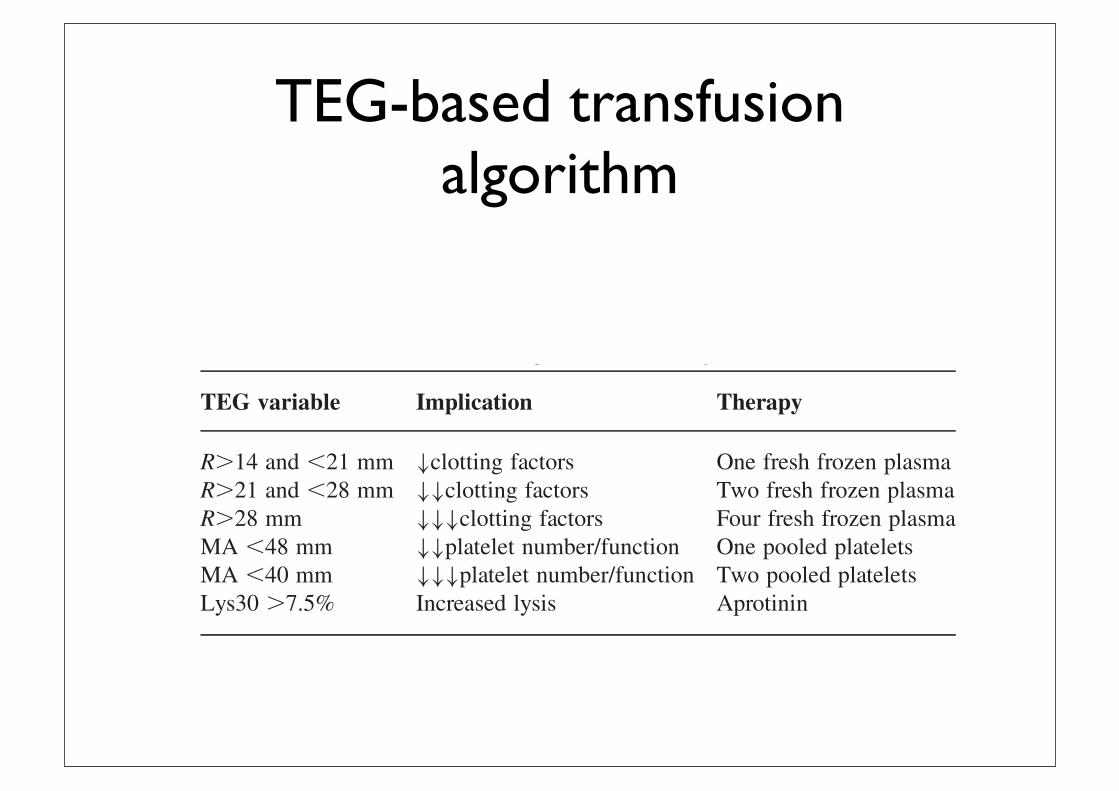
TEG-based transfusion algorithm
measure of clotting time (CT) which is the period of timefrom the start of the test to the initial fibrin formation. TheK value is the clot kinetics measurement of the speed toreach a specific level of clot strength: the time from begin-ning of clot formation (the end of R time) until the ampli-tude reaches 20 mm. The a angle is the angle between thehorizontal line in the middle of the TEG tracing and theline tangential to the developing ‘body’ of the TEGtracing at 2 mm amplitude. The a angle represents theacceleration (kinetics) of fibrin build up and cross-linking(clot strengthening). The MA reflects the ultimate strengthof the clot which depends on the number and function ofplatelets and their interaction with fibrin. The MA is theparameter most frequently measured because it correlateswith platelet dysfunction in cardiac surgery. The MA isused as a marker for platelet function and has thus beenincorporated into transfusion algorithms used to reduceplatelet and other transfusions given to patients after CPB.LY30, or the lysis index at 30 min after MA, is increasedwith fibrinolysis.A limitation of the TEG is its inability to detect impair-
ment in platelet function induced by anti-platelet agents.The development of the Platelet Mapping Assayw hasovercome this shortfall.TEG can be used to predict bleeding in cardiac
surgery.12 14 37 71 In large retrospective and prospectivestudies, incorporation of the TEG into clinical decision-making has resulted in decreased blood loss and transfu-sions.3 58 61 68 Spiess and colleagues analysed 1079patients before and after the introduction of TEG as partof an overall transfusion management strategy. They foundsignificantly less use of all blood and blood componentsexcept cryoprecipitate. There was also a significantdecrease in the re-exploration rate. However, this studymay have been biased by the Hawthorne effect (animprovement in results that may be found just by monitor-ing a process).66 In a prospective randomized controlledstudy, Shore-Lesserson and colleagues61 compared transfu-sion requirements with ‘TEG-based’ and ‘traditional’ pro-tocols in the management of postoperative bleeding.Patients in both groups received the antifibrinolytic epsilonaminocaproic acid (EACA). Although the study showed nosignificant difference in mediastinal tube drainage betweenthe groups, blood and blood component therapy were sig-nificantly less in the ‘TEG’ than in the ‘traditional group’.Royston and von Kier58 studied 60 patients who hadundergone complex surgery comparing their actual bloodand blood product use to predicted usage derived from aTEG-based algorithm. They utilized the TEG R value todetermine the quantity of fresh frozen plasma needed toreverse the coagulation defect in the post-cardiac surgicalpatient (Table 1). Though TEG is the best-studied POCdevice for use in cardiac surgery, further studies arerequired to recommend TEG as the standard of care forpostoperative transfusion management.13 32
TEG modifications
Platelet Mapping Assayw
The development of the Platelet Mapping Assay over-comes some of the shortcomings of the TEG, in that itallows for the thromboelastographic measurement of plate-let function in patients on anti-platelet medication. Plateletmapping uses three cuvettes. One incorporates thrombin toactivate platelets and overrides the inhibition of other acti-vation pathways such as arachidonic acid, ADP, andGPIIb/IIIa. A second cuvette contains reptilase plus factorXIII to create a fibrinogen clot or a ‘thrombin-less’ clot.This clot strength will be smaller and will not have thecontribution of thrombin-activated platelets. The thirdcuvette incorporates the fibrinogen clot and adds backADP or arachidonic acid to stimulate the platelets. Theability of the MA to increase in response to ADP (clopido-grel) or arachidonic acid (aspirin) is a measure ofdrug-induced platelet inhibition via that particularpathway.7 This POC test correlates well with the gold stan-dard optical aggregometry.8
Rotational thromboelastometry
Rotational thromboelastometry (ROTEM) (Pentapharm,Munich, Germany) provides a visco-elastic measurement ofclot strength in whole blood. A small amount of wholeblood (0.3 ml) and coagulation activators are added to adisposable cuvette that is placed in a heated holder. A dis-posable pin (sensor) fixed on the tip of a rotating shaft islowered into the blood sample. The loss of elasticity uponclotting affects rotation of the shaft that is detected by thereflection of light on a small mirror attached to the shaft. Adetector records the axis rotation over time and this rotationis translated into a graph or thromboelastogram.64 73
The main descriptive parameters derived by ROTEM are:CT, corresponding to the time (s) from the beginning of thereaction to a 2 mm increase in amplitude. This representsthe initiation of clotting, thrombin formation, and the startof clot polymerization. Clot formation time, the time (s)between an increase in amplitude from 2 to 20 mm. Thisidentifies the fibrin polymerization and stabilization of theclot with platelets and factor XIII. Maximum clot firmness(MCF), the MA (mm) reached in the tracing, which corre-lates with platelet count, platelet function, and the
Table 1 TEG-based transfusion algorithm (from Royston and von Kier58)
TEG variable Implication Therapy
R.14 and ,21 mm #clotting factors One fresh frozen plasmaR.21 and ,28 mm ##clotting factors Two fresh frozen plasmaR.28 mm ###clotting factors Four fresh frozen plasmaMA ,48 mm ##platelet number/function One pooled plateletsMA ,40 mm ###platelet number/function Two pooled plateletsLys30 .7.5% Increased lysis Aprotinin
POC coagulation testing and transfusion algorithms
i17
by guest on October 24, 2011
http://bja.oxfordjournals.org/D
ownloaded from
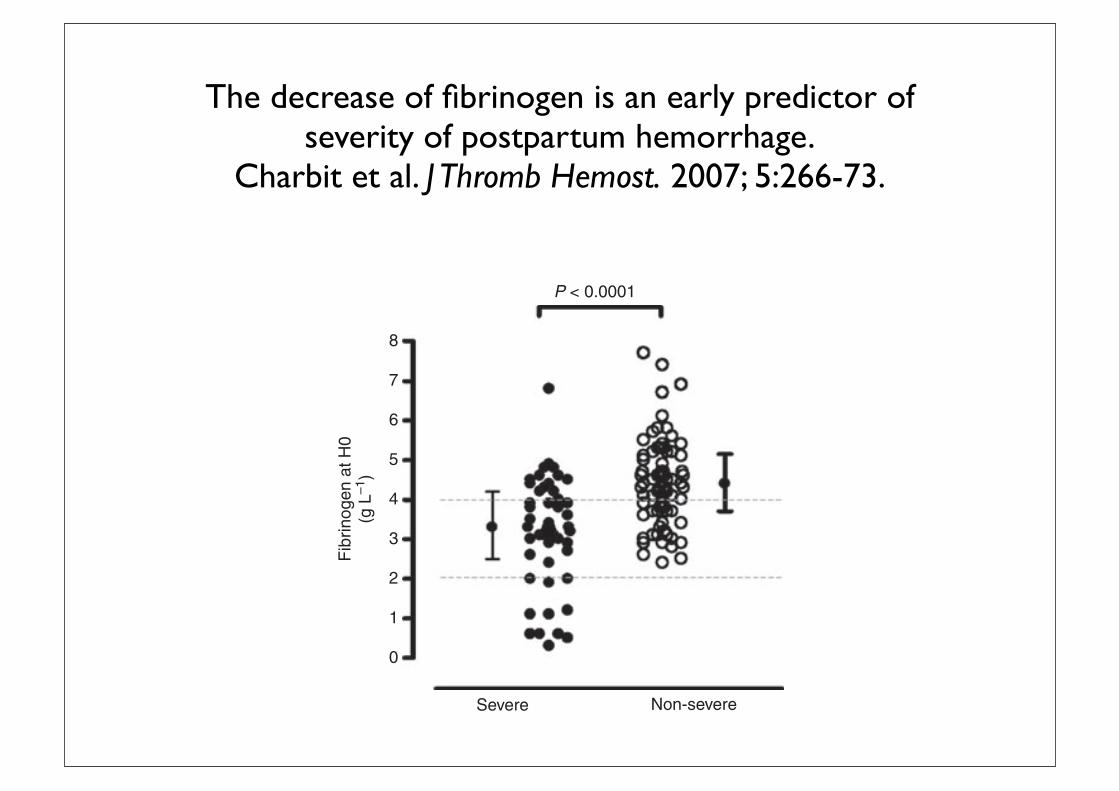
The decrease of fibrinogen is an early predictor of severity of postpartum hemorrhage.
Charbit et al. J Thromb Hemost. 2007; 5:266-73.
point of 4.0 g L)1 had the highest discriminatory power, with asensitivity of 74% and a specificity of 65%. By contrast,PT and APTT were of little help to predict the severity ofbleeding.
Multivariate analysis In the logistic regression model,fibrinogen concentration at H0 was the only parameterindependently associated with progress toward severebleeding. For each 1 g L)1 decrease in fibrinogen, thecalculated odds ratio and 95% confidence interval were equalto 2.63 (1.66–4.16; P < 0.0001; Table 3). Importantly, at H0,while fibrinogen> 4g L)1 had a reassuring negative predictivevalue of 79% (68–89%), fibrinogen £ 2 g L)1 had a positivepredictive value of 100% (71–100%). Among the 11 womenwith fibrinogen below 2g L)1 at H0, eight (73%) weretransfused, uterine artery ligation was performed in two, and
one underwent angiographic embolization. Finally, of the fivepatients requiring massive transfusion (more than 6 RBCunits), four had an H0 fibrinogen level < 2g L)1.
Changes in coagulation parameters over the first 24 h
The changes in the laboratory parameters in the two groupsfrom H0 to H24 are shown in Figs 4 and 5. The changes overtime of INR, APTT, fibrinogen, FII and FV, D-dimer, proteinC, antithrombin and TAT complexes differed significantlybetween the groups.Moreover, for platelet count, INR, APTT,fibrinogen, FV and antithrombin, a significant interaction overtime was found, indicating a different time course between thetwo groups. However, because the H24 point in both groupsdiffered substantially from the H0–H4 period, this analysis wasredone excludingH24. The interaction over time then remainedsignificant only for platelets (P ! 0.003), D-dimers(P < 0.001) and TAT complexes (P < 0.001).
Fig. 3. ROC curve of fibrinogen plasma concentration at H0 for thediagnosis of severe postpartum hemorrhage.
Fig. 2. Individual fibrinogen plasma concentrations at H0 in women withsevere (d) or non-severe (s) postpartum hemorrhage. Mean ± SD val-ues are reported for both groups.
Table 3 Multivariate logistic regression of laboratory parameters associ-ated with severe PPH
TimeLaboratoryparameter
Number ofpatients OR [95% CI] P-value
H0* fibrinogen (g L)1) 113 2.63 [1.66–4.16] < 0.0001H1* fibrinogen (g L)1) 114 2.70 [1.75–4.16] < 0.0001H2! fibrinogen (g L)1) 114 3.70 [2.17–6.25] < 0.0001H4" fibrinogen (g L)1) 115 5.00 [2.63–9.09] < 0.0001
For fibrinogen, odds ratios (OR) were calculated for each 1 g L)1
decrease in its plasma concentration. *data introduced in the model:INR, APTT, fibrinogen, factor II, factor V, D-dimer, antithrombin,protein C and TAT. !data introduced in the model: INR, APTT,fibrinogen, factor II, factor V, D-dimer, antithrombin and protein C."data introduced in the model: platelets, INR, APTT, fibrinogen,factor II, factor V, D-dimer and protein C.
Fig. 4. Serial coagulation parameters from H0 to H24 in the severe andnon-severe postpartum hemorrhage (PPH) groups. Data are presented asmedian and interquartile range. The respective P-values refer to the dif-ference between the two groups evaluated by repeated measurementanalysis. Open circles, non-severe PPH; full circles, severe PPH.
270 B. Charbit et al
! 2006 International Society on Thrombosis and Haemostasis
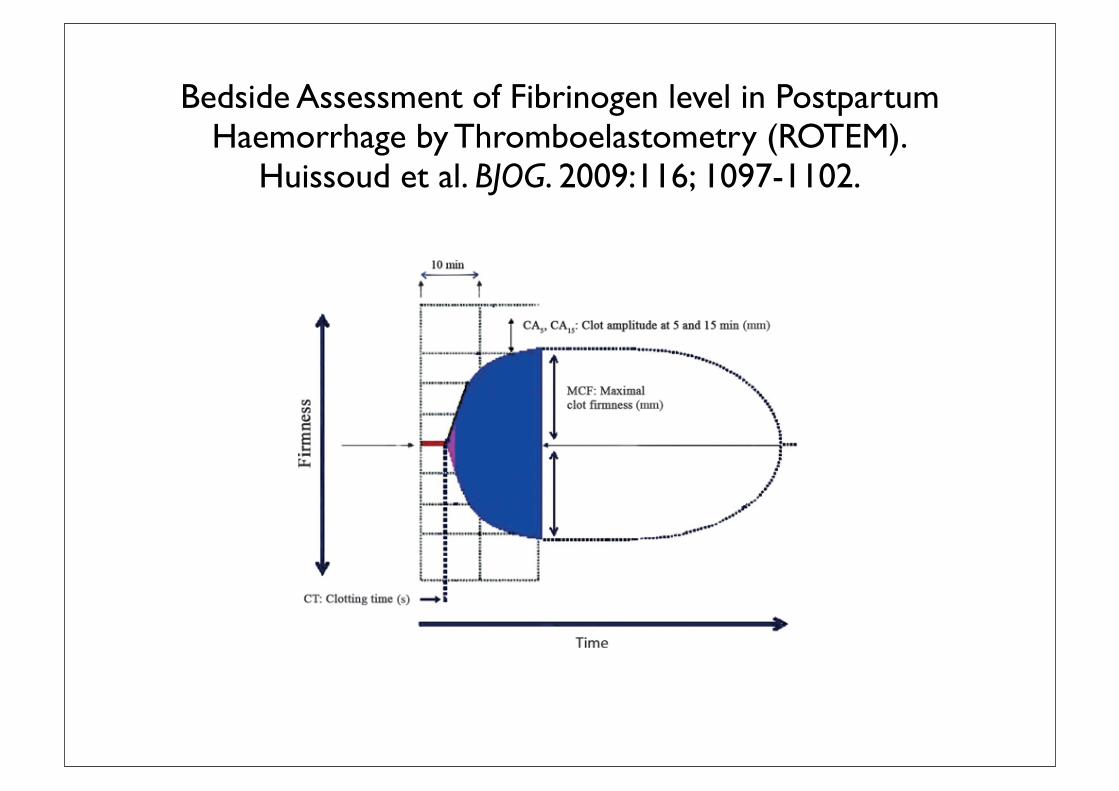
Bedside Assessment of Fibrinogen level in Postpartum Haemorrhage by Thromboelastometry (ROTEM).
Huissoud et al. BJOG. 2009:116; 1097-1102.
that the ROTEM system allows the detection of hypercoag-ulation linked to pregnancy. We also showed that ROTEMgives a reliable and rapid assessment of coagulation duringnormal pregnancy.10
It is currently unknown whether ROTEM measurementsare sensitive to systemic changes of fibrinogen in cases ofPPH. The aim of this study was to evaluate the ability ofthe ROTEM to early detect decrease in fibrinogen levels inPPH in the labour ward.
Methods
Study designThis prospective observational study received approvalfrom the ethical committee of the Hospices Civils de Lyon.Informed consent was obtained from all participants. Thestudy group (PPH group) included all consecutive womenwho developed a PPH between May 2005 and October2006, some having been referred specifically for manage-ment in our tertiary referral centre. A PPH was defined byan estimated blood loss >1000 ml during a caesareansection or >500 ml after a vaginal birth. The control groupincluded women from a preliminary study without abnor-mal bleeding.10
Standard laboratory testsBlood for fibrinogen assays was collected in 5-ml tubes(Vacutainer!, Becton-Dickinson, Oakville, ON, Canada)containing 0.5 ml sodium citrate (0.109 mol/l) and centri-
fuged in the lab at 3000 · g for 20 min. Fibrinogen wasassayed within 5 minutes after sampling with a STAR!
automated coagulation analyser (Diagnostica Stago Inc.,Franconville, France) according to standard procedures.11
Platelets and haemoglobin were determined using a SysmexXE2100 cell counter (Sysmex corporation, Kobe, Japan)with blood collected in 5-ml tubes (Vacutainer) containingEDTA.
The modified rotation thrombelastometryWe used the modified rotation thrombelastogram analyser(ROTEM) in the delivery room. This system overcomessome of the limitations of classic thrombelastography: aball-bearing system, renders it less susceptible to vibrationsand coagulation activators 12 speed up the analysis andallows a specific exploration of the related pathways ofcoagulation (i.e. intrinsic–extrinsic pathways). The newROTEM system also provides an intuitive graphical inter-face and an automatic pipetting system to facilitate use byclinicians.
In this study, we used the FIBTEM! test of the ROTEMto assess the fibrinogen level. The FIBTEM evaluates thefibrinogen component (concentration and contribution tothe clot formation) by using a platelet inhibitor (cytochala-sine D).13 The methods used and parameters for thrombe-lastography have been previously described in detail.13,14 Inbrief, thrombelastography measures the firmness of a bloodclot during clot formation and subsequent fibrinolysis.The ROTEM generates a reaction curve in real time
Figure 1. Main FIBTEM results.
Huissoud et al.
1098 ª 2009 The Authors Journal compilation ª RCOG 2009 BJOG An International Journal of Obstetrics and Gynaecology

Bedside Assessment of Fibrinogen level in Postpartum Haemorrhage by Thromboelastometry (ROTEM).
Huissoud et al. BJOG. 2009:116; 1097-1102.
tion and (iii) the consumption of fibrinogen linked to nor-mal or disseminated intravascular coagulation.
The concentration of fibrinogen significantly increasesduring pregnancy from 3.3 g/l [3.1–3.6] in nonpregnantwomen to 5 g/l [4.4–5.8] in the third trimester of preg-nancy.10 This increase in fibrinogen is consistent with theincrease in clot amplitude observed with the FIBTEM testduring normal pregnancy.10 But, it was unknown whetherFIBTEM could accurately assess the fibrinogen level inpatients with PPH.
In our series, the median CT was higher and the medianclot amplitudes (CA5, CA15 and MCF) were significantlylower in PPH than in controls. There were also strongcorrelations with the FIBTEM values and the fibrinogenlevels in both groups. This result suggests that the differ-ence of the haemoglobin level between the groups did notsignificantly impact on the reliability of the test as previ-ously reported.8
Recent findings show that CA10-FIBTEM (amplitude ofthe clot at 10 minutes) in traumatised patients correlateswell with the level of fibrinogen with a threshold value of
5 mm for fibrinogen <1 g/l (91% sensitivity and 85%specificity).8 Our results are consistent with these previousfindings despite the changes in fibrinogen level observedduring pregnancy. Indeed, we found that the optimal CA5-FIBTEM threshold for fibrinogen <1 g/l was 4 mm (100%sensitivity and 86% specificity) and 5 mm for CA15-FIB-TEM (100% sensitivity and 88% specificity).
The value of ROTEM has also been reported for cardiacsurgery and liver transplantations6,7,17, where it is particu-larly important to be able to monitor the coagulation inreal time. Unfortunately, such real-time monitoring is notfeasible with standard laboratory coagulation tests. In casesof PPH, the use of ROTEM could allow early and objectivescreening of coagulation disorders and rapid identificationof cases that are likely to have a severe outcome. A fibrino-gen level <2 g/l at the start of PPH treatment has a predic-tive value of serious PPH of 100%.5 In our study, thethreshold of 2 g/l of fibrinogen corresponds to a CA5-FIBTEM of 6 mm (100% sensitivity and 87% specificity)and to a CA15-FIBTEM of 8 mm (100% sensitivity and84% specificity).
Figure 3. Linear regression depicting the relation between CA5-FIBTEM and fibrinogen in controls and postpartum haemorrhage.
Table 3. Cut-off values for CA5-FIBTEM in postpartum haemorrhage
Fibrinogen
levels (g/l)
FIBTEM cut-off
values (mm)
Sensitivity %
(95% CI)
Specificity
% (95% CI)
PPV %
(95% CI)
NPV %
(95% CI)
AUC
Fibrinogen < 2 CA5 = 6 100 (100–100) 87 (77–96) 50 (36–64) 100 (100–100) 0.97
Fibrinogen < 1.5 CA5 = 5 100 (100–100) 85 (76–95) 30 (17–43) 100 (100–100) 0.96
Fibrinogen < 1 CA5 = 4 100 (100–100) 86 (76–96) 13 (3–22) 100 (100–100) 0.96
Fibrinogen < 2 CA15 = 8 100 (100–100) 84 (75–94) 46 (32–60) 100 (100–100) 0.96
Fibrinogen < 1.5 CA15 = 6 100 (100–100) 88 (78–97) 33 (20–46) 100 (100–100) 0.97
Fibrinogen < 1 CA15 = 5 100 (100–100) 88 (79–97) 14 (5–24) 100 (100–100) 0.97
AUC, area under curve; CI, confidence interval; NPV, negative predictive value; PPV, positive predictive value.
Fibrinogen assessment in postpartum haemorrhage
ª 2009 The Authors Journal compilation ª RCOG 2009 BJOG An International Journal of Obstetrics and Gynaecology 1101

24
Interventions in Coagulopathies
§Red blood cells
§Platelets
§Fresh Frozen Plasma
§Cryoprecipitate, Fibrinogen Concentrate, Prothrombin Complex Concentrates
§rFVIIa (Novo7)
§Tranexamic Acid, Aprotinin.
“Get me some blood and plasma”
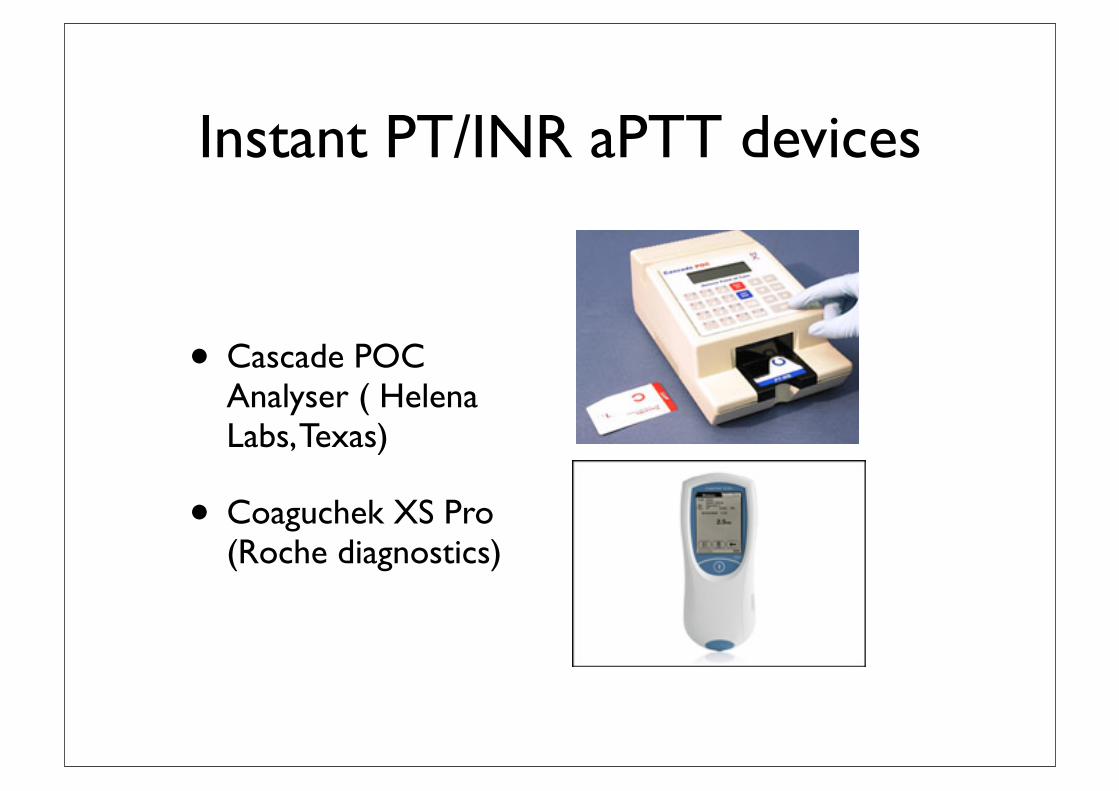
Instant PT/INR aPTT devices
• Cascade POC Analyser ( Helena Labs, Texas)
• Coaguchek XS Pro (Roche diagnostics)

What else can POC Coagulation assessment be used foron the Maternity Unit?

Assessment of changes in coagulation in parturients with preeclampsia using thromboelastography
Sharma et al. Anesth. Feb.1999

PFA -100 (Platelet function analyser)
• Blood drawn through tube
• Activators ADP/epinephrine
• Expressed as closure time

Hemostatic function on healthy pregnant and preeclamptic women: An assessment using the PFA-100
and TEG.Davies JR, Fernando R, Hallworth S.
Anesth Analg. Feb. 2007.
management of the condition. Routine hematologicaltest results (Table 3) show significantly reduced meanplatelet counts in the severe PET women comparedwith the controls: 6 of the 93 controls (6.4%), 3 of the 23mild PET women (13%), and 10 of the 27 severe PETwomen (37%) had platelet counts !150,000/mm3.APTT and fibrinogen values in the severe PET subjectsremained within the reference ranges for our institu-tion (28–38 s for APTT; 1.5–4.0 g/L for fibrinogen). Inall groups, values for von Willebrand Factor activityand antigen exceeded the normal ranges establishedby our laboratories (50–150 IU) and indeed were morethan double the upper limit of the normal referencerange. There were higher values in the PET groups,but the differences were only statistically significantfor antigen.
Of the four TEG variables, no significant differenceswere observed between the control and mild PETgroups (Table 4). MA did not differ among the groups,and indeed, was hypercoagulable in relation to thenonpregnant normal range supplied by the TEGmanufacturers (59–68 mm). The mean CT of thePFA-100 (Table 4), the time taken to form an effectiveplatelet plug, was significantly prolonged in severePET compared with both the controls and mild PETwomen, and exceeded the 95% CI for the upper limitof the normal range. In six severe PET women, the CTwas at least double the mean value for pregnancy. Insummary, severe preeclampsia was associated withCT values exceeding the normal range for pregnancy,but with MA values normal for pregnancy.
With three severe PET women, but no mild PETwomen or controls, the CT values exceeded the PFA-100 test time limit of 300 s (registered as "300 by themachine). For the purposes of data analysis, they have
been ascribed values of 300 s. Their corresponding MAvalues were 40, 61.5, and 70 mm. Two of these threepreeclamptic women admitted to the delivery suitewith a clinical diagnosis of preeclampsia went on todevelop HELLP syndrome and recorded the lowestplatelet counts (46,000 and 51,000/mm3) of all subjectsin the study. One HELLP patient had impaired clot-ting (APTT [40.8 s] and MA [40 mm]; and relativelyreduced fibrinogen [2.5 g ! L#1]), but these variablesreturned to within normal ranges after administrationof 15 mL ! kg#1 fresh frozen plasma (FFP). No plateletswere transfused. The CT, however, did not return tonormal after the FFP, and continued to exceed 300 s.
The relationship between CT and platelet count inthe three study groups is presented graphically inFigure 1. This demonstrates that in the control andmild PET groups CT was not a function of plateletcount (control group R2 $ 0.004, P $ 0.55; mild PETgroup R2 $ 0.015, P $ 0.57), and that there was atendency to higher CT values in the severe PET groupat normal as well as low platelet counts (R2 $ 0.37, P !0.001).
In post hoc analysis performed to determine thedegree to which the lengthening CT could be attrib-uted to low platelet counts, patients with platelet
Table 1. Ninety-five % Reference Interval and 95% ConfidenceLimits for PFA-100" Closure Time and Thromboelastograph"Maximum Amplitude in Healthy Pregnant Patients
Closuretime (s)(n $ 93)
Maximumamplitude (mm)
(n $ 93)Mean (sd) 105 (18) 73 (5)95% Reference
interval70–139 64–83
95% CI for lower;upper limits
64–76; 133–145 63–66; 81–84
Table 2. Patient Characteristics of the Control andPreeclamptic (PET) Groups
Controls(n $ 93)
MildPET
(n $ 23)
SeverePET
(n $ 27)Age (yr) 33 (4) 33 (5) 33 (5)Weight (kg) 79 (16) 80 (12) 79 (11)Height (cm) 162 (7) 162 (8) 161 (5)Gestational age (wk) 38 (2)* 37 (3) 36 (3)* P ! 0.05 versus mild and severe PET groups.All values mean (%SD).
Table 3. Hematological and Clotting Variables
Controls(n $ 93)
MildPET
(n $ 23)
SeverePET
(n $ 27)Hct (%) 35 (4) 34 (4) 33 (5)Platelet count
(&1000/mm3)257 (89) 230 (83) 177 (81)*
PT (s) 13.2 (0.9) 13.2 (0.9) 13.3 (1.2)APTT (s) 28.7 (3.0) 30.2 (4.3) 31.3 (3.4)†Fibrinogen (g/L) 4.4 (1.0) 4.1 (1.0) 4.0 (0.9)VWF activity
(IU/L)312 (97) 335 (119) 360 (93)
VWF antigen(IU/L)
349 (105) 371 (122) 409 (110)‡
Hct $ hematocrit; PT $ prothrombin time; APTT $ activated partial thromboplastin time;VWF $ von Willebrand Factor; PET$ preeclamptic.Data are mean (%SD).* P ! 0.001 (control versus severe PET).† P ! 0.01 (control versus severe PET).‡ P ! 0.05 (control versus severe PET).
Table 4. Thromboelastography and PFA-100" Results
Controls(n $ 93)
MildPET
(n $ 23)
SeverePET
(n $ 27)r (mm) 4.5 (1.8) 4.9 (1.9) 5.2 (2.5)K (mm) 1.4 (0.5) 1.4 (0.4) 2.0 (1.7)*MA (mm) 73 (5) 73 (5) 71 (8)!-angle (°) 70 (9) 71 (6) 66 (11)PFA-100# CT (s) 105 (18) 115 (22) 155 (65)†r $ reaction time; K $ clot formation time; !-angle $ clot formation rate; MA $ maximumamplitude (clot strength); CT $ closure time.All data are mean (%SD).* P ! 0.01 (control versus severe PET); P ! 0.05 (mild PET versus severe PET).† P ! 0.001 (severe PET versus both mild PET and controls).
418 PFA-100# and TEG# in Pregnancy and Preeclampsia ANESTHESIA & ANALGESIA
were analysed using Number Cruncher Statistical Sys-tem (NCSS) 2007, (NCSS Inc., Kaysville UT), andGraphPad Prism 5.02, (GraphPad Inc., San DiegoCA). Statistical significance was defined at P < 0.05.
Results
A total of 21 women were recruited. Two patients wereexcluded, one who bled more than 1000 mL during sur-gery and one who declined to continue the study afterone of her cannulae failed. Results for the remaining19 subjects are shown in Table 1.
Anti-factor Xa levels were virtually undetectable atall stages of testing (Table 2) and well below the targetpeak anti-factor Xa activity of 0.1 U/mL that indicatesclinical efficacy.16 Likewise there was no significantchange in APTT and all values were within the normalreference limits.
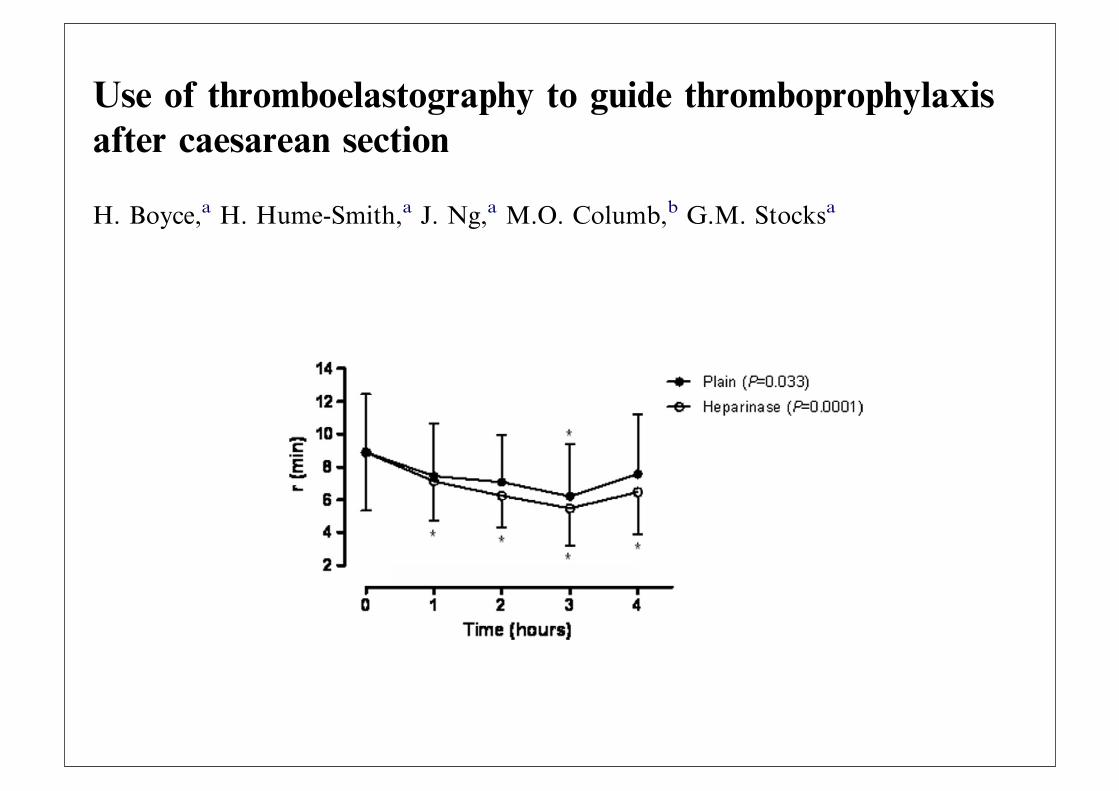
Figs. 1–4 illustrate TEG changes each hour after UHadministration for R, a angle, k time and MA parame-ters. Plain cuvette samples show how the patient’s bloodclotted, while heparinase samples show clotting as itwould have been without heparin.
There was a significant difference (!10.6%,P = 0.0072) in R times between the plain and heparinasesamples indicating that TEG could detect an effect ofUH (Fig. 1). Compared to time 0 there were significantdecreases of R times in plain (!20.4%, P = 0.033) andheparinase (!28.8%, P = 0.0001) samples. There were
Table 1 Demographic, obstetric and operative data
Age (years) 36.5 (4.8)Weight (kg) 75.3 (7.5)Height (cm) 165 (6.6)Body mass index (kg/m2) 27.8 (3.0)Gestation (weeks) 39.2 (1.1)Primiparous:multiparous 6:13Intravenous fluids (mL) 1495 (522)Estimated blood loss (mL) 553 (121)
Data are mean (SD) or number.
Table 2 Anti-factor Xa activities and APTT
2 h 4 h P value
Anti-Xa (U/mL) 0 [0.0, 0.01] 0 [0.0, 0.02] >0.20APTT (s) 26.8 (1.7) 27.6 (2.0) 0.19
Data are median [interquartiles] and mean (SD); APTT: Activatedpartial thromboplastin time (reference range for third trimester 24.7–35.0 s).
Fig. 2 Changes in a angle for plain and heparinised samples. Data are mean ± S.D.
Fig. 1 Changes in R time for plain and heparinised samples. Data are mean ± S.D.
H. Boyce et al. 215
ORIGINAL ARTICLE
Use of thromboelastography to guide thromboprophylaxisafter caesarean section
H. Boyce,a H. Hume-Smith,a J. Ng,a M.O. Columb,b G.M. Stocksaa Department of Anaesthesia, Queen Charlotte’s and Chelsea Hospital, Du Cane Road, London, UKb Department of Anaesthesia, University Hospital of South Manchester, Wythenshawe Hospital,Manchester, UK
ABSTRACTBackground: Thromboprophylaxis is commonly required following caesarean section. However the effect of thromboprophylacticdosages of subcutaneous heparin on coagulation is unknown because conventional laboratory tests are largely unaffected. The aimof this study was to determine if thromboelastography could detect and quantify the effect of unfractionated heparin on coagu-lation profile when given at the time of surgery.Methods: Nineteen women undergoing elective caesarean section were recruited. Blood samples collected before and after admin-istration of subcutaneous unfractionated heparin 7500 IU underwent thromboelastography using both plain and heparinasecuvettes. Anti-factor Xa levels were also measured.Results: There was a significant difference in R times between plain and heparinase samples (!10.6%, P = 0.0072) indicating thatthromboelastography could detect an effect of unfractionated heparin. Compared to baseline there were significant decreases of Rtimes in plain (!20.4%, P = 0.033) and heparinase (!28.8%, P = 0.0001) samples despite the administration of unfractionatedheparin. Anti-factor Xa levels were virtually undetectable (mean 0.01 U/mL).Conclusion: Thromboelastography was able to detect and quantify the effect of unfractionated heparin on blood coagulability, aneffect not detected by conventional laboratory tests. Thromboelastography demonstrated a pro-coagulant effect of surgery thatwas only partially mitigated by the use of unfractionated heparin. In this study, at a dose of 7500 IU subcutaneous unfractionatedheparin appears to have little anticoagulant effect.
"c 2011 Elsevier Ltd. All rights reserved.
Keywords: Obstetric anaesthesia; Thromboelastography; Thromboprophylaxis; Heparin; Caesarean section
Introduction
Thromboembolism continues to be a leading cause of di-rect maternal death in the UK and caesarean section(CS) is a well recognised risk factor.1–3 Thrombopro-phylaxis using a combination of mechanical methodsand heparin has become routine practice after CS.4 Dos-age requirements for heparin are known to increase dur-ing pregnancy5–9 and higher doses are recommended forthromboprophylaxis compared to the non-pregnantpopulation, although recommendations are not evi-dence-based.10 In a hypercoagulable parturient under-going CS, the effects of a thromboprophylactic dose ofheparin on the clotting profile are unknown.
Thromboelastography (TEG!) is a ward-based mon-itor of whole blood coagulation. It has been used todemonstrate the coagulation changes during pregnancythat culminate in the hypercoagulable state known toexist at term. When blood is placed in an oscillating cuv-ette and allowed to clot, it couples a pin suspended with-in it. The shear modulus and elasticity of the clot istransmitted through the pin and produces a signaturetrace of clotting activity within 20–30 min.11 Kaolincan be added as an activator to accelerate the process,while addition of a heparinase reagent abolishes heparinactivity and allows review of the coagulation profile as ifheparin were entirely absent. The tracing is character-ised by four variables. The R value (reaction time) isthe time in minutes from start to splitting of the graph-ical trace, and represents initial fibrin formation. The kvalue is the time in minutes from the end of the R timefor the trace to reach an amplitude of 20 mm, and rep-resents the speed of clot formation. The a angle is theslope of the TEG tracing from the end of R time to ktime, is closely related to the k time and represents the
Accepted March 2011
Presented in part at the Obstetric Anaesthetists’ AssociationAnnual Meeting, Jersey; May 2009.Correspondence to: H. Boyce, Department of Anaesthetics, IpswichHospital, Heath Road, Ipswich IP4 5PD, UK.E-mail address: [email protected]
International Journal of Obstetric Anesthesia (2011) 20, 213–2180959-289X/$ - see front matter "c 2011 Elsevier Ltd. All rights reserved.doi:10.1016/j.ijoa.2011.03.006
www.obstetanesthesia.com
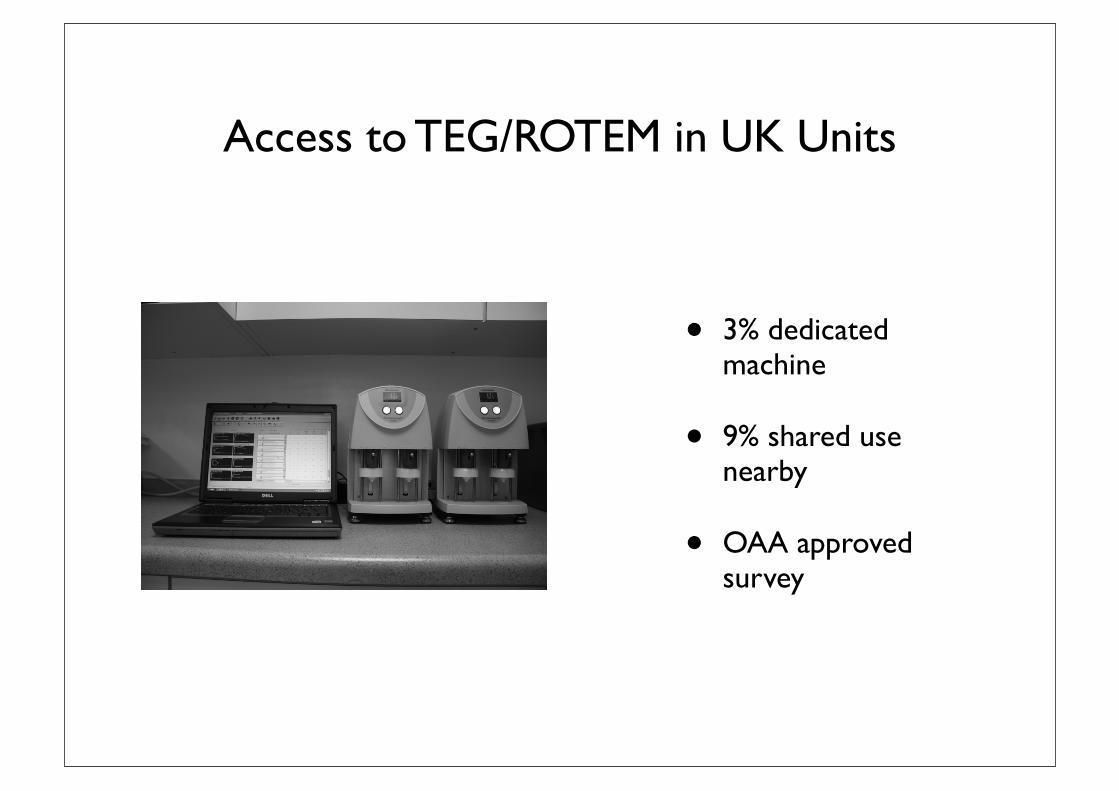
Access to TEG/ROTEM in UK Units
• 3% dedicated machine
• 9% shared use nearby
• OAA approved survey
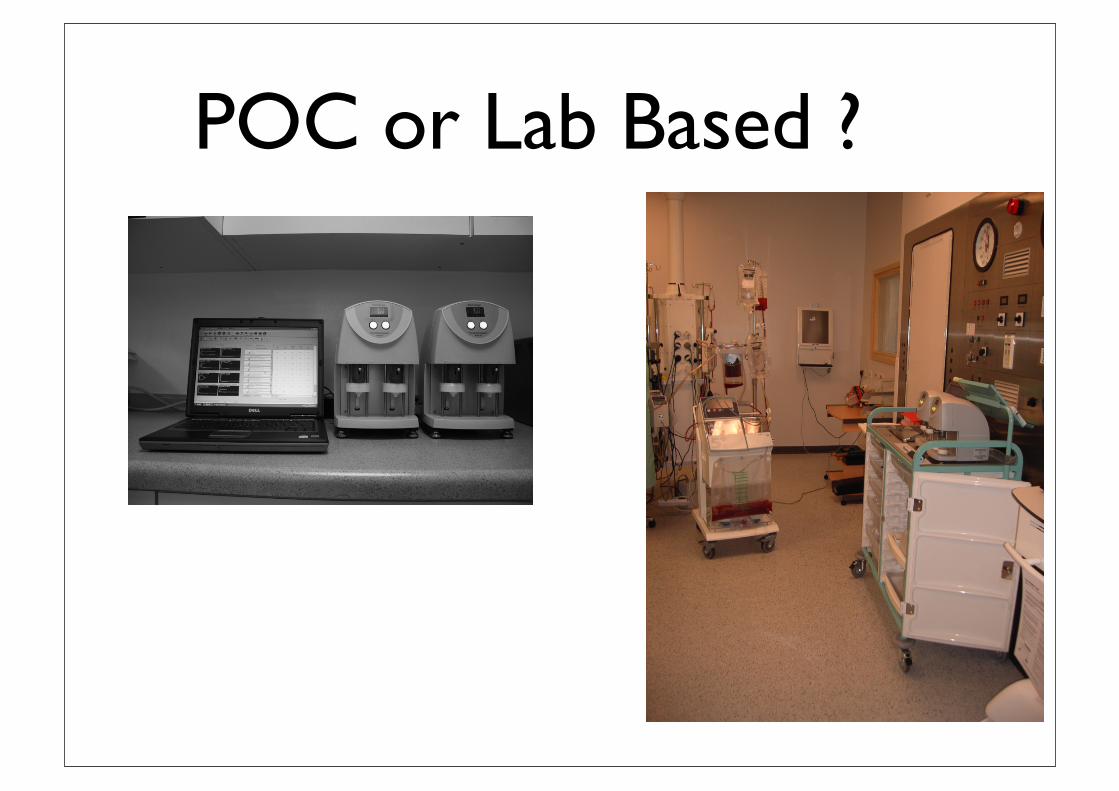
POC or Lab Based ?
Royal College of Pathologists
• Pathology labs should oversee POC
• A POC Committee should oversee development
• Responsibility for maintenance and use should be defined
• Documentation of results
• Clinical and Business case for equipment

Downsides of POC Coagulation testing ?
• Devices not adequately Maintained
• Non-lab personnel - errors.
• Moderately complex tests
• Distraction for clinical staff
• Misinterpretation of results
Future Trends
• Non-Invasive Haemoglobin devices
• Point-of-care treatment algorithms
• Less complex devices eg POC Fib
• lab-based TEG

BibliographyRapid Point-‐of –Care Assessment of Coagulation-‐ the Obstetric Anaesthetists Laboratory of the future. J Loughrey. OAA 3 day course 2011.
The accuracy of Non-‐Invasive and continuous total hemoglobin measurement by Pulse Co-‐Oximetry in Human subjects undergoing hemodilution.Macknet MR, Allard M, Applegate RL, Rook J.Anesth Analg 2010; 111:1424
Point-‐of-‐Care coagulation testing and transfusion algorithms.Enriquez, Shore-‐Lesserson L.Br J Anaesth. 2009. 103; Supp 14-‐22.
Blood Transfusion and the Anaesthetist; management of massive haemorrhage. Association of Anaesthetists of Great Britain and Ireland.Thomas D, Wee M, Clyburn P et al.Anaesthesia. 2010; 65: 1153-‐61.
Reduced hemostatic factor transfusion using heparinase-‐modi[ied thromboelastography during cardiopulmonary bypass.Royston D, von Kier S.Br J Anaesth. 2001;86: 575-‐8.
The decrease of [ibrinogen is an early predictor of severity of postpartum haemorrhage.Charbit B, Mandelbrot L, Samain E et al.J Thromb Hemost 2007;5:266-‐73.
Bedside assessment of [ibrinogen level in postpartum haemorrhage by thromboelastometry.Huissoud C, Carrabin N, Audibert F et al.BJOG. 2009; 116:1097-‐102.
Development of a point-‐of-‐care lateral [low device for measuring human plasma [ibrinogen.Dudek MM, Lindahl, T, Killard AJ.Anal Chem. 2010;82: 2029-‐35.
Assessment of Changes in coagulation in parturients with preeclampsia using thromboelastography.Sharma SK, Philip J, Wiley J.Anesthesiol. 1999;90 (2): 385-‐90.
Hemostatic function on healthy pregnant and preeclamptic women: An assessment using the PFA-‐100 and thromboelastograph.Davies JR, Fernando R, Hallworth S.Anesth Analg. 2007; 104 (2): 416-‐20.
Use of thromboelastography to guide thromboprophylaxis after caesarean section.Boyce H, Hume-‐Smith H, Ng J et al.IJOA. 2011;20: 213-‐218.


![POINT OF CARE COAGULATION TESTING - BloodFinal] Point of... · November 2014 Guidance for Australian Health Providers POINT OF CARE COAGULATION TESTING CASE STUDY The Prince Charles](https://img.pdfslide.net/doc/110x75/5c65882809d3f2b26e8cd2df/point-of-care-coagulation-testing-blood-final-point-of-november-2014-guidance.jpg)