Embed Size (px)
Citation preview
AQUACULTURE ENVIRONMENT INTERACTIONSAquacult Environ Interact
Vol. 13: 111–119, 2021https://doi.org/10.3354/aei00394
Published May 6
1. INTRODUCTION
The northern shelf of the Yellow Sea is a shallowshelf area extending approximately 200 km in thealong-shore direction and 20−50 km in the cross-shore direction, with a mean depth of approximately40 m. The currents are dominated by the tidal flow,with smaller contributions from wind-driven flowand a seasonal thermal jet (Lin et al. 2019). The watermasses are seasonally heated and cooled, creating alarge amplitude between the warmest water in sum-mer and coldest in winter, with a typical range of bot-tom water temperature from <5 to >20°C. Due tomixing energy input from the tide combined with theshallow sloping bathymetry, a thermal front in thealong-shore direction is established during thespring and summer (Simpson & Hunter 1974, Hillet al. 2008), and the water temperature difference
across this front can be several degrees (Lin et al.2019).
The northern shelf area is important for aquacul-ture, where sea ranching of the Japanese scallopPatinopecten yessoensis has been of particular eco-nomic importance (Zhou 2012). Ranching is carriedout by releasing juveniles to bottom habitats, wherethe scallops usually reach market size after 3 yr. Mor-talities of scallops in sea ranching within this regionhave been related to large bottom-water tempera-ture variations in summer (Zhao et al. 2019). Thewater masses on the shelf oscillate back and forthover many km, mainly due to the various componentsof the tidal forcing (Lin et al. 2019). In areas withlarge horizontal bottom temperature gradients, e.g.in the region of the seasonal thermal front, periodi-cally large variations of water temperature will occurand potentially expose individual scallops to water
© The authors 2021. Open Access under Creative Commons byAttribution Licence. Use, distribution and reproduction are un -restricted. Authors and original publication must be credited.
Publisher: Inter-Research · www.int-res.com
*Corresponding author: [email protected]
Rapid water temperature variations at the northernshelf of the Yellow Sea
Lars Asplin1,*, Fan Lin2,3,4, W. Paul Budgell1, Øivind Strand1
1Institute of Marine Research, PB 1870 Nordnes, 5817 Bergen, Norway2Yellow Sea Fisheries Research Institute, CAFS, 106 Nanjing Rd, 266000 Qingdao, PR China
3Laboratory for Marine Fisheries Science and Food Production Processes, Qingdao National Laboratory for Marine Science and Technology, 1 Wenhai Rd, Aoshanwei, 266237 Qingdao, PR China
4Geophysical Institute, University of Bergen, PB 7803, 5020 Bergen, Norway
ABSTRACT: During summer, there is great spatial variability in bottom water temperature on thenorthern shelf of the Yellow Sea. This variability is associated with a thermal front along the shelf.Oscillatory currents from semidiurnal and fortnightly period tides transport water masses later-ally, resulting in oscillations of bottom water temperature at fixed positions, sometimes with largeamplitudes. Temperature variations, as demonstrated in the present work, can cause damage tobottom-cultured scallops. In particular, in the scallop sea ranching area near Zhangzidao Island,such oscillations are evident in late summer. We constructed a spatial index of aggregated tem-perature variability from current model results identifying how temporal variability during thesummer period varies in space. This information can be useful both in selecting favorable ranch-ing areas and designing laboratory stress experiments on aquaculture candidate species.
KEY WORDS: Northern Yellow Sea shelf · Sea ranching · Current modelling · Yellow Sea Model ·Tidal front
OPENPEN ACCESSCCESS
Aquacult Environ Interact 13: 111–119, 2021112
temperature amplitudes of several degrees at tidaland longer frequencies (Lin et al. 2019). Previousrecords of massive mortality of cultured scallopshave mostly been related to temperature extremes,reproduction processes, overcrowding and invadersor pathogens (Strand & Brynjeldsen 2003, Xiao et al.2005, Shumway & Parsons 2016). Knowledge is lack-ing on how temperature variations at short temporalscales impact bivalves. However, recent experimen-tal studies have shown that physiology, metabolismand immune functions in P. yessoensis are affectedby acute temperature changes assumed to representthe temperature gradients on the northern shelf(Jiang et al. 2016, 2018a,b, Gao et al. 2017). Suchtemperature stress may act as a major factor in caus-ing the observed mortality of scallops, but moreinformation on spatial and temporal temperaturevariability is needed to understand its role in explain-ing the mortality.
The objective of our study was to demonstrate thathigh-resolution temporal and spatial bottom temper-ature variability based on numerical current modelresults for the Yellow Sea can be used to support riskassessment and sustainable management of scallopsea ranching on the northern shelf areas. The numer-ical model results we used have previously been val-idated for the northern shelf of the Yellow Sea andwere found to be reasonably accurate (Lin et al.2019). We identified the semidiurnaltidal current and a fortnightly oscillat-ing current as being responsible for thevariable bottom temperatures. Fromthe time series of oscillating bottomtemperatures, we created a spatiallyvarying index representing the aggre-gated temporal temperature variationat the shelf area of relevance for scal-lop sea ranching. This index can beused to identify site and area suitabil-ity for sea ranching of scallops as wellas help to explain differences in scal-lop mortality between years.
2. MATERIALS AND METHODS
2.1. The current model
We used the Regional Ocean Model-ing System (ROMS) for our study(Shchepetkin & McWilliams 2005,Haidvogel et al. 2008). ROMS is solv-ing the primitive hydrostatic equations
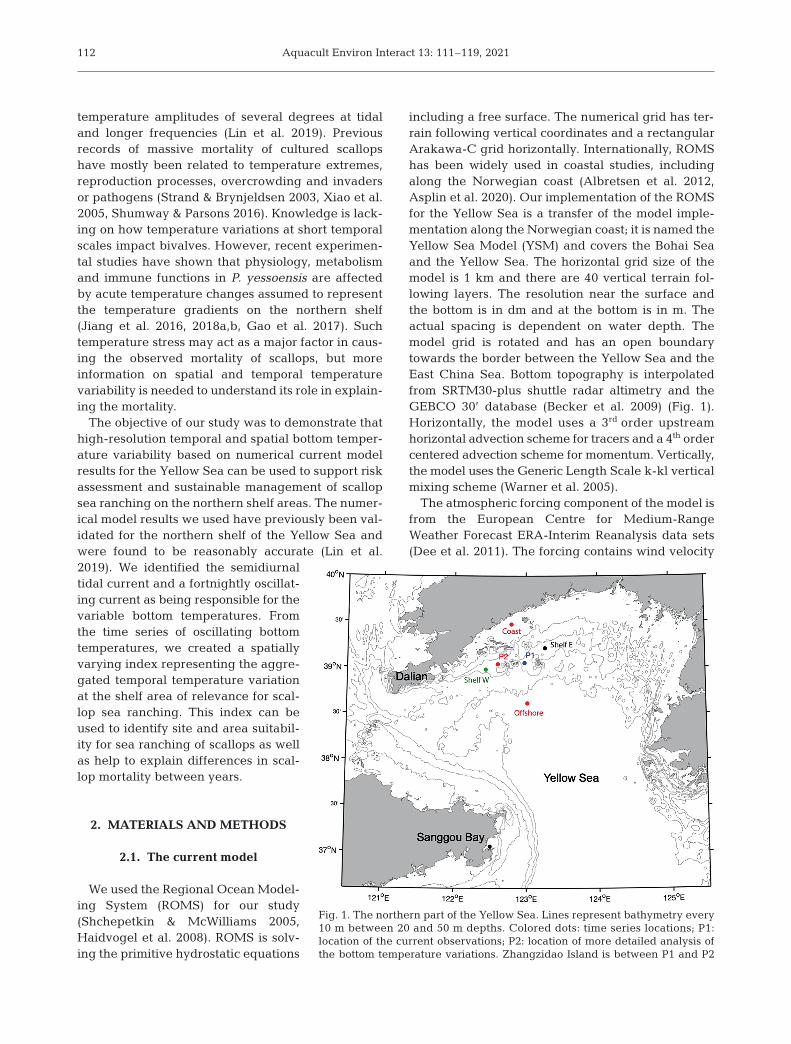
including a free surface. The numerical grid has ter-rain following vertical coordinates and a rectangularArakawa-C grid horizontally. Internationally, ROMShas been widely used in coastal studies, includingalong the Norwegian coast (Albretsen et al. 2012,Asplin et al. 2020). Our implementation of the ROMSfor the Yellow Sea is a transfer of the model imple-mentation along the Norwegian coast; it is named theYellow Sea Model (YSM) and covers the Bohai Seaand the Yellow Sea. The horizontal grid size of themodel is 1 km and there are 40 vertical terrain fol-lowing layers. The resolution near the surface andthe bottom is in dm and at the bottom is in m. Theactual spacing is dependent on water depth. Themodel grid is rotated and has an open boundarytowards the border between the Yellow Sea and theEast China Sea. Bottom topography is interpolatedfrom SRTM30-plus shuttle radar altimetry and theGEBCO 30’ database (Becker et al. 2009) (Fig. 1).Horizontally, the model uses a 3rd order upstreamhorizontal advection scheme for tracers and a 4th ordercentered advection scheme for momentum. Vertically,the model uses the Generic Length Scale k-kl verticalmixing scheme (Warner et al. 2005).
The atmospheric forcing component of the model isfrom the European Centre for Medium-RangeWeather Forecast ERA-Interim Reanalysis data sets(Dee et al. 2011). The forcing contains wind velocity
Fig. 1. The northern part of the Yellow Sea. Lines represent bathymetry every10 m between 20 and 50 m depths. Colored dots: time series locations; P1:location of the current observations; P2: location of more detailed analysis ofthe bottom temperature variations. Zhangzidao Island is between P1 and P2
Asplin et al.: Temperature variations in the Yellow Sea 113
at 10 m height, surface-specific humidity derivedfrom 2 m dew point temperature, surface air temper-ature at 2 m, downward longwave and shortwaveradiation, precipitation and mean sea level pressure.Accumulated data such as radiation and precipita-tion are specified at 12 h intervals while the rest areat 6 h intervals. The atmospheric forcing was origi-nally on a 3 km grid and is interpolated in the modelgrid. Net heat flux is computed from bulk formulaeby Fairall et al. (1996).
At the open boundary, information of the tide, thedaily mean sea surface elevation and daily values ofcurrents, temperature and salinity in the vertical arespecified. The values are taken from the HYCOMdaily global ocean reanalysis (www. hycom .org).Eleven tidal components (M2, K2, S2, N2, K1, P1, O1,Q1, MN4, M4 and MS4 constituents) were takenfrom the Oregon State University global in verse tidalmodel TPXO7.2 (Egbert & Erofeeva 2002) and werespecified at the open boundary. Open boundary dataenter the domain using a radiative-nudging scheme.A quadratic bottom drag with a friction coefficient of0.0025 is applied to the entire model domain.
The model results are based on a simulation withrealistic forcing from August 2013 to December 2015.The initial conditions were interpolated from theHYCOM reanalysis. We store the model results ashourly and daily mean values. The model was alsorun for 2017 with only the tidal forcing activated, iso-lating this current component. The reason for select-ing this period is an overlap with available currentobservations.
2.2. The observations
Current observation data are frommoored acoustic Doppler current pro-filers (ADCPs) from 2 periods. FromSeptember to December 2015, currentwas measured by a Nortek ADCP 1MHz Aquadopp Profiler (www. nortekgroup.com) with 1 m bin size and 20bins, located near Zhangzidao Islandat Site P1 (Fig. 1), measuring upwards.The accuracy of the instrument was1% measured value ±0.5 cm s−1 forcurrent profiling, ±0.1°C for the inte-grated temperature sensor and 0.5%of maximum range for the pressuresensor. In July and August 2017, an RDIADCP 300 KHz profiler (http:// www.teledynemarine. com/ adcps/ marine-
measurements/) was moored at another location nearSite P1. The accuracy of the current for the RDI instru-ment was 0.5% of the measured value ±0.5 mm s−1.The ADCP measured the whole water column with avertical bin resolution of 2 m.
3. RESULTS
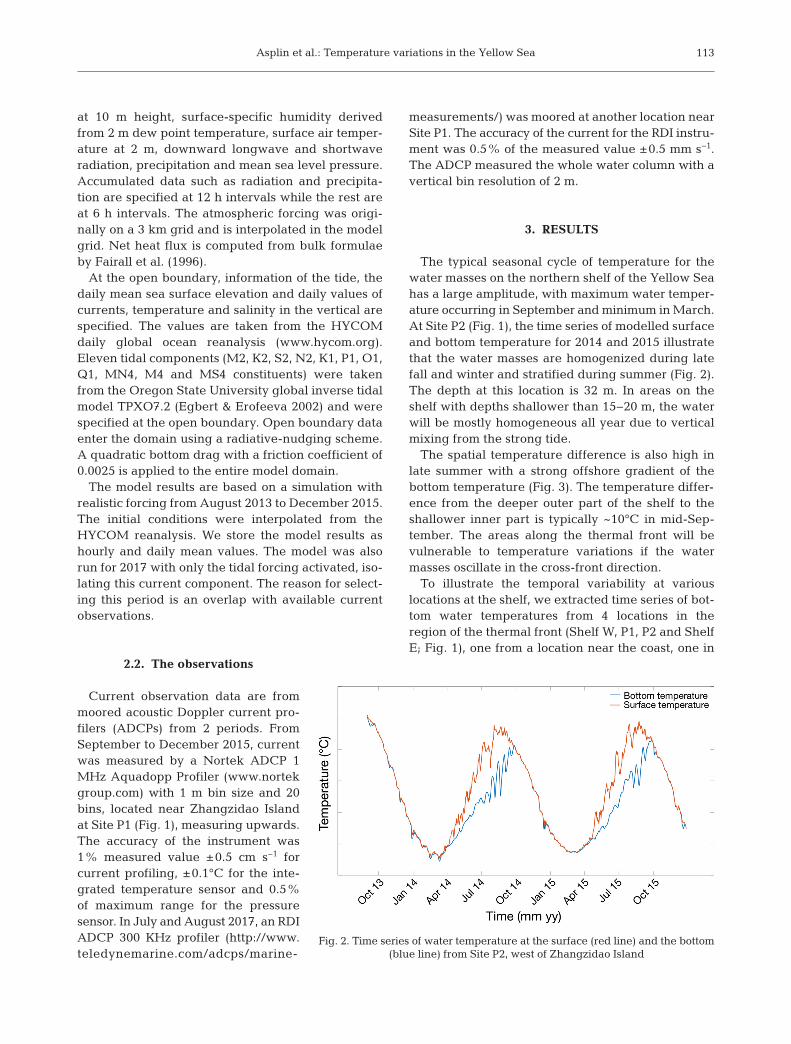
The typical seasonal cycle of temperature for thewater masses on the northern shelf of the Yellow Seahas a large amplitude, with maximum water temper-ature occurring in September and minimum in March.At Site P2 (Fig. 1), the time series of modelled surfaceand bottom temperature for 2014 and 2015 illustratethat the water masses are homogenized during latefall and winter and stratified during summer (Fig. 2).The depth at this location is 32 m. In areas on theshelf with depths shallower than 15−20 m, the waterwill be mostly homogeneous all year due to verticalmixing from the strong tide.
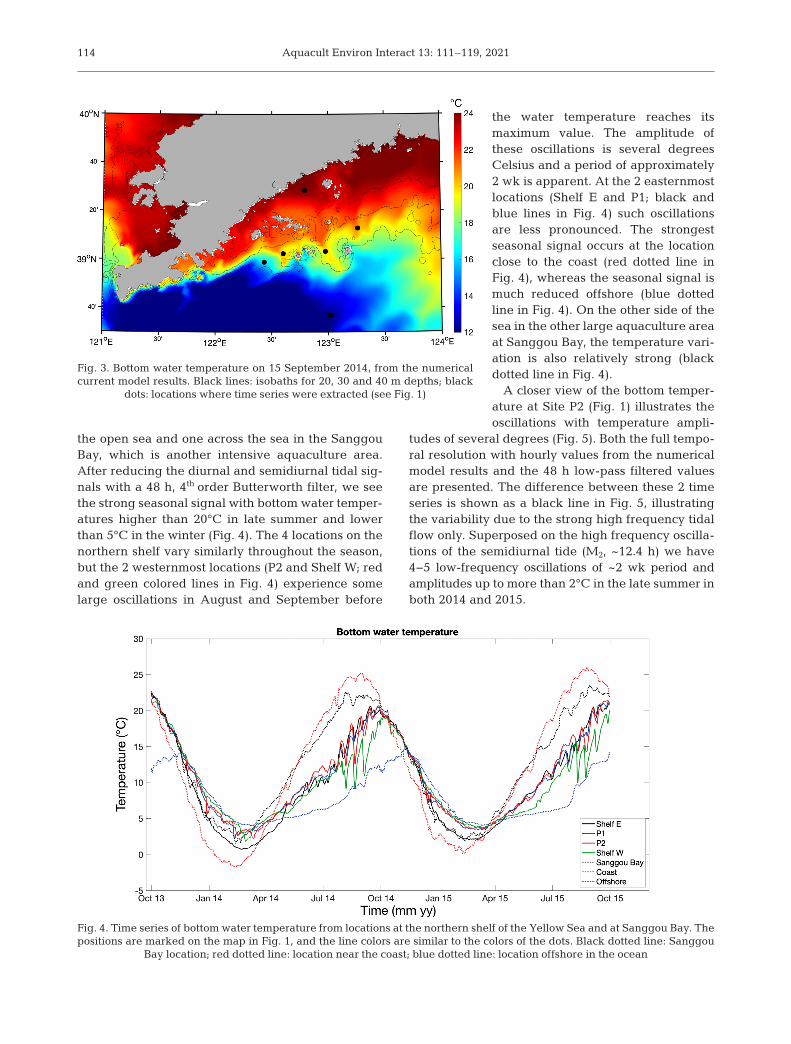
The spatial temperature difference is also high inlate summer with a strong offshore gradient of thebottom temperature (Fig. 3). The temperature differ-ence from the deeper outer part of the shelf to theshallower inner part is typically ~10°C in mid-Sep-tember. The areas along the thermal front will bevulnerable to temperature variations if the watermasses oscillate in the cross-front direction.
To illustrate the temporal variability at variouslocations at the shelf, we extracted time series of bot-tom water temperatures from 4 locations in theregion of the thermal front (Shelf W, P1, P2 and ShelfE; Fig. 1), one from a location near the coast, one in
Fig. 2. Time series of water temperature at the surface (red line) and the bottom (blue line) from Site P2, west of Zhangzidao Island
Aquacult Environ Interact 13: 111–119, 2021114
the open sea and one across the sea in the SanggouBay, which is another intensive aquaculture area.After reducing the diurnal and semidiurnal tidal sig-nals with a 48 h, 4th order Butterworth filter, we seethe strong seasonal signal with bottom water temper-atures higher than 20°C in late summer and lowerthan 5°C in the winter (Fig. 4). The 4 locations on thenorthern shelf vary similarly throughout the season,but the 2 westernmost locations (P2 and Shelf W; redand green colored lines in Fig. 4) experience somelarge oscillations in August and September before
the water temperature reaches itsmaximum value. The amplitude ofthese oscillations is several degreesCelsius and a period of approximately2 wk is apparent. At the 2 easternmostlocations (Shelf E and P1; black andblue lines in Fig. 4) such oscillationsare less pronounced. The strongestseasonal signal oc curs at the locationclose to the coast (red dotted line inFig. 4), whereas the seasonal signal ismuch reduced offshore (blue dottedline in Fig. 4). On the other side of thesea in the other large aquaculture areaat Sanggou Bay, the temperature vari-ation is also relatively strong (blackdotted line in Fig. 4).
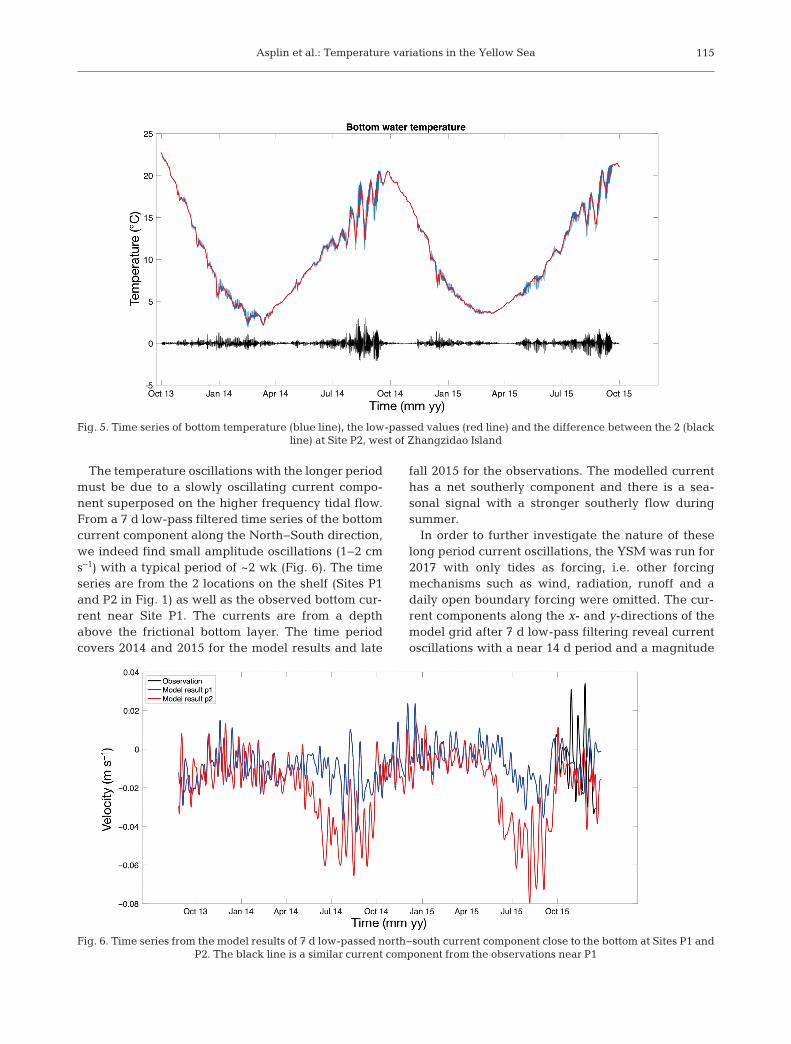
A closer view of the bottom temper-ature at Site P2 (Fig. 1) illustrates theoscillations with temperature ampli-
tudes of several degrees (Fig. 5). Both the full tempo-ral resolution with hourly values from the numericalmodel results and the 48 h low-pass filtered valuesare presented. The difference between these 2 timeseries is shown as a black line in Fig. 5, illustratingthe variability due to the strong high frequency tidalflow only. Superposed on the high frequency oscilla-tions of the semidiurnal tide (M2, ~12.4 h) we have4−5 low-frequency oscillations of ~2 wk period andamplitudes up to more than 2°C in the late summer inboth 2014 and 2015.
Fig. 3. Bottom water temperature on 15 September 2014, from the numericalcurrent model results. Black lines: isobaths for 20, 30 and 40 m depths; black
dots: locations where time series were extracted (see Fig. 1)
Fig. 4. Time series of bottom water temperature from locations at the northern shelf of the Yellow Sea and at Sanggou Bay. Thepositions are marked on the map in Fig. 1, and the line colors are similar to the colors of the dots. Black dotted line: Sanggou
Bay location; red dotted line: location near the coast; blue dotted line: location offshore in the ocean
Asplin et al.: Temperature variations in the Yellow Sea 115
The temperature oscillations with the longer periodmust be due to a slowly oscillating current compo-nent superposed on the higher frequency tidal flow.From a 7 d low-pass filtered time series of the bottomcurrent component along the North−South direction,we indeed find small amplitude oscillations (1−2 cms−1) with a typical period of ~2 wk (Fig. 6). The timeseries are from the 2 locations on the shelf (Sites P1and P2 in Fig. 1) as well as the observed bottom cur-rent near Site P1. The currents are from a depthabove the frictional bottom layer. The time periodcovers 2014 and 2015 for the model results and late
fall 2015 for the observations. The modelled currenthas a net southerly component and there is a sea-sonal signal with a stronger southerly flow duringsummer.
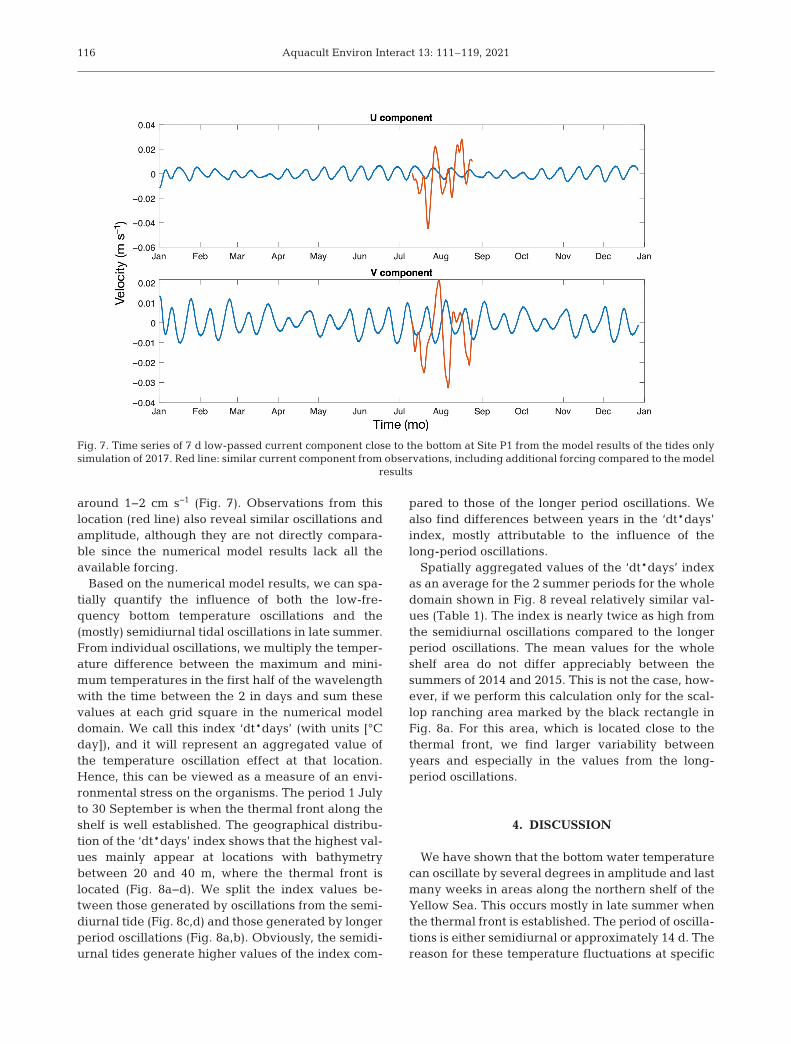
In order to further investigate the nature of theselong period current oscillations, the YSM was run for2017 with only tides as forcing, i.e. other forcingmechanisms such as wind, radiation, runoff and adaily open boundary forcing were omitted. The cur-rent components along the x- and y-directions of themodel grid after 7 d low-pass filtering reveal currentoscillations with a near 14 d period and a magnitude
Fig. 5. Time series of bottom temperature (blue line), the low-passed values (red line) and the difference between the 2 (black line) at Site P2, west of Zhangzidao Island
Fig. 6. Time series from the model results of 7 d low-passed north−south current component close to the bottom at Sites P1 and P2. The black line is a similar current component from the observations near P1
Aquacult Environ Interact 13: 111–119, 2021116
around 1−2 cm s−1 (Fig. 7). Observations from thislocation (red line) also reveal similar oscillations andamplitude, although they are not directly compara-ble since the numerical model results lack all theavailable forcing.
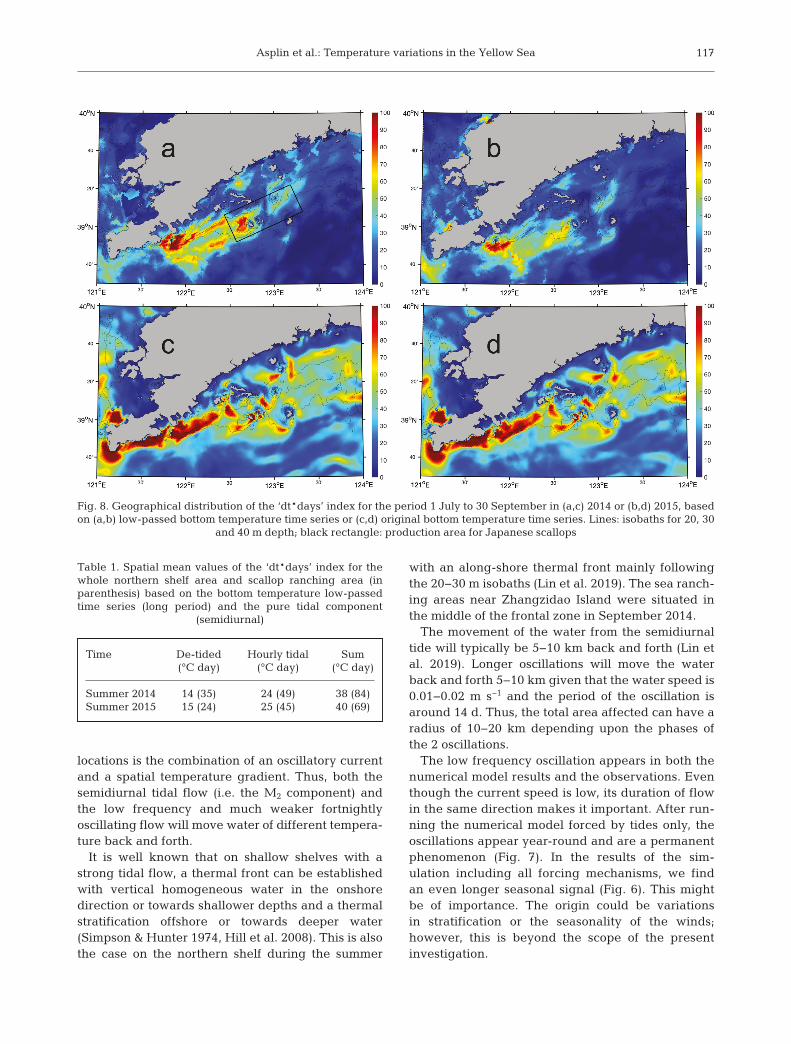
Based on the numerical model results, we can spa-tially quantify the influence of both the low-fre-quency bottom temperature oscillations and the(mostly) semidiurnal tidal oscillations in late summer.From individual oscillations, we multiply the temper-ature difference between the maximum and mini-mum temperatures in the first half of the wavelengthwith the time between the 2 in days and sum thesevalues at each grid square in the numerical modeldomain. We call this index ‘dt*days’ (with units [°Cday]), and it will represent an aggregated value ofthe temperature oscillation effect at that location.Hence, this can be viewed as a measure of an envi-ronmental stress on the organisms. The period 1 Julyto 30 September is when the thermal front along theshelf is well established. The geographical distribu-tion of the ‘dt*days’ index shows that the highest val-ues mainly appear at locations with bathymetrybetween 20 and 40 m, where the thermal front islocated (Fig. 8a−d). We split the index values be -tween those generated by oscillations from the semi-diurnal tide (Fig. 8c,d) and those generated by longerperiod oscillations (Fig. 8a,b). Obviously, the semidi-urnal tides generate higher values of the index com-
pared to those of the longer period oscillations. Wealso find differences between years in the ‘dt*days’index, mostly attributable to the influence of thelong-period oscillations.
Spatially aggregated values of the ‘dt*days’ indexas an average for the 2 summer periods for the wholedomain shown in Fig. 8 reveal relatively similar val-ues (Table 1). The index is nearly twice as high fromthe semidiurnal oscillations compared to the longerperiod oscillations. The mean values for the wholeshelf area do not differ appreciably between thesummers of 2014 and 2015. This is not the case, how-ever, if we perform this calculation only for the scal-lop ranching area marked by the black rectangle inFig. 8a. For this area, which is located close to thethermal front, we find larger variability betweenyears and especially in the values from the long-period oscillations.
4. DISCUSSION
We have shown that the bottom water temperaturecan oscillate by several degrees in amplitude and lastmany weeks in areas along the northern shelf of theYellow Sea. This occurs mostly in late summer whenthe thermal front is established. The period of oscilla-tions is either semidiurnal or approximately 14 d. Thereason for these temperature fluctuations at specific
Fig. 7. Time series of 7 d low-passed current component close to the bottom at Site P1 from the model results of the tides onlysimulation of 2017. Red line: similar current component from observations, including additional forcing compared to the model
results
Asplin et al.: Temperature variations in the Yellow Sea 117
locations is the combination of an oscillatory currentand a spatial temperature gradient. Thus, both thesemidiurnal tidal flow (i.e. the M2 component) andthe low frequency and much weaker fortnightlyoscillating flow will move water of different tempera-ture back and forth.
It is well known that on shallow shelves with astrong tidal flow, a thermal front can be establishedwith vertical homogeneous water in the onshoredirection or towards shallower depths and a thermalstratification offshore or towards deeper water(Simpson & Hunter 1974, Hill et al. 2008). This is alsothe case on the northern shelf during the summer
with an along-shore thermal front mainly followingthe 20−30 m isobaths (Lin et al. 2019). The sea ranch-ing areas near Zhangzidao Island were situated inthe middle of the frontal zone in September 2014.
The movement of the water from the semidiurnaltide will typically be 5−10 km back and forth (Lin etal. 2019). Longer oscillations will move the waterback and forth 5−10 km given that the water speed is0.01−0.02 m s−1 and the period of the oscillation isaround 14 d. Thus, the total area affected can have aradius of 10−20 km depending upon the phases ofthe 2 oscillations.
The low frequency oscillation appears in both thenumerical model results and the observations. Eventhough the current speed is low, its duration of flowin the same direction makes it important. After run-ning the numerical model forced by tides only, theoscillations appear year-round and are a permanentphenomenon (Fig. 7). In the results of the sim -ulation including all forcing mechanisms, we findan even longer seasonal signal (Fig. 6). This mightbe of importance. The origin could be variationsin stratification or the seasonality of the winds;however, this is beyond the scope of the presentinvestigation.
Fig. 8. Geographical distribution of the ‘dt*days’ index for the period 1 July to 30 September in (a,c) 2014 or (b,d) 2015, basedon (a,b) low-passed bottom temperature time series or (c,d) original bottom temperature time series. Lines: isobaths for 20, 30
and 40 m depth; black rectangle: production area for Japanese scallops
Time De-tided Hourly tidal Sum (°C day) (°C day) (°C day)
Summer 2014 14 (35) 24 (49) 38 (84)Summer 2015 15 (24) 25 (45) 40 (69)
Table 1. Spatial mean values of the ‘dt*days’ index for thewhole northern shelf area and scallop ranching area (inparenthesis) based on the bottom temperature low-passedtime series (long period) and the pure tidal component
(semidiurnal)
Aquacult Environ Interact 13: 111–119, 2021118
The 14 d signal in the current field could be pro-duced by nonlinear advection processes that gener-ate compound shallow water tidal constituents at thesum (quarter-diurnal MS4) and difference (fort-nightly MSF) of the lunar M2 and S2 tidal frequen-cies (Godin 1972). The spring−neap modulation ofthe semi-diurnal tide can produce fortnightly varia-tions in the strength of vertical mixing (Haas 1977,Budgell 1982) which can lead to fortnightly varia-tions in bottom temperature. The circulation is alsoaffected in an indirect manner on a 14 d time scale byspring−neap variations in frontal structure caused bychanges in vertical mixing (Li & Zhong 2009).
We found differences between the summers of 2014and 2015 in the ‘dt*days’ index, but mostly theseappear in space. When considering the whole north-ern shelf, the difference between 2014 and 2015 issmall (Table 1). However, inside the scallop produc-tion area (Fig. 8a) the index is more than 20% higherin 2014 compared to 2015. This difference is mostlydue to the contribution from the long period oscilla-tions. This can be interpreted as the location of theseasonal thermal front varying between years. Themechanisms behind the front are the tidal current,bottom topography, atmospheric radiation (heat ex -change) and other mixing agents like wind. Only thelast 2 will change between years; thus, the atmos-pheric conditions will probably cause the interannualdifferences of the thermal front strength and loca-tion. The difference of the ‘dt*days’ index between2014 and 2015 illustrates that there can be a tempo-ral−spatial shift in the bottom temperature patternsand magnitude. Experimental studies by Jiang et al.(2016, 2018a,b) indicate that acute temperature vari-ations are more critical to the scallops than variationsat longer periods. This factor will be affected by suchtemporal−spatial shifts and influences how the risk ofscallop mortality should be assessed.
The spatial−temporal variability of the temperaturegradients shown in our study is crucial informationfor designing experiments to better understandstress responses of Patinopecten yessoensis and ulti-mately the role of the temperature environment inexplaining their growth and mortality in sea ranch-ing (Zhao et al. 2019). In previous studies, indicestypically representing the temperature environmentintegrated over time (e.g. growing degree days) havebeen used in assessing temperature-dependentgrowth and development in several molluscan spe-cies (Broell et al. 2017, Steeves et al. 2018). To ourknowledge, none of the previous studies used indicesinvolving representation of the degree of temperatureoscillations. The variability in the ‘dt*days’ index is
an approach normalizing the temperature environ-ment assumed to detrimentally affect the scallopsover the spatial domain in the sea ranching area.However, better understanding of physiological andimmunological factors affecting the mortality of thescallops is needed to access thresholds for mortalityin sea ranching conditions (Jiang et al. 2018a,b).Therefore, more research needs to be completedbefore higher accuracy can be provided in develop-ing temperature indices for risk assessment and siteor area selection for the scallop releases. Suchindices would clearly contribute to the developmentof sustainable sea ranching and would likely providedirect economic benefit to the aquaculture industriesin the area.
The results from the YSM reproduced the ambientenvironment reasonably well. These results will beavailable for further investigations. We believe thatthis information, in combination with specificationsof the relationship between physical stress on thecultured scallops and the effects on scallop growthand survival, can be used to identify favorable searanching conditions. Temperature variations extractedfrom model results can provide crucial informationfor further physiological study of high frequency stress.
Acknowledgements. The authors sincerely appreciate thesupport from Sea Ranching Research Center of Zoneco, fortheir help in making observations. The authors also thankthe European Center for Medium-Range Weather Forecastsfor the atmospheric data, the international team of GEBCOfor bathymetry data and NOPP for HYCOM data. Thisresearch was supported by the Research Council of Norway(249056/H30), Environment and Aquaculture Governance(MFA, CHN 17/0033) and Horizon 2020 IMPAQT project(774109). This research was also supported by the Key Pro-gramme for International Cooperation on Scientific andTechnological Innovation, Ministry of Science and Technol-ogy (2017YFE0118300).
LITERATURE CITED
Albretsen J, Aure J, Sætre R, Danielssen DS (2012) Climaticvariability in the Skagerrak and coastal waters of Nor-way. ICES J Mar Sci 69: 758−763
Asplin L, Albretsen J, Johnsen IA, Sandvik AD (2020) Thehydrodynamic foundation for salmon lice dispersionalong the Norwegian coast. Ocean Dyn 70: 1151−1167
Becker JJ, Sandwell DT, Smith WHF, Braud J and others(2009) Global bathymetry and elevation data at 30 arcseconds resolution: SRTM30_PLUS. Mar Geod 32: 355−371
Broell F, McCain JSP, Taggart CT (2017) Thermal timeexplains size-at-age variation in molluscs. Mar Ecol ProgSer 573: 157−165
Budgell WP (1982) The influence of the spring−neap tidalcycle upon vertical stratification in Chesterfield Inlet,Hudson Bay. Nat Can 109: 709−718
Asplin et al.: Temperature variations in the Yellow Sea 119
Dee DP, Uppala SM, Simmons AJ, Berrisford P and others(2011) The ERA-Interim Reanalysis: configuration andperformance of the data assimilation system. Q J R Mete-orol Soc 137: 553−597
Egbert GD, Erofeeva SY (2002) Efficient inverse modeling ofbarotropic ocean tides. J Atmos Ocean Technol 19: 183−204
Fairall CW, Bradley EF, Rogers DP, Edson JB, Young GS (1996)Bulk parameterization of air−sea fluxes for tropicalocean− global atmosphere coupled−ocean atmosphere re -sponse experiment. J Geophys Res Oceans 101: 3747−3764
Gao G, Zhang J, Li M, Ma S, Guo X, Jiang W, Lv X (2017)Effects of temperature fluctuation on physiological andimmune parameters of scallop (Patinopecten yessoensis).Yuye Kexue Jinzhan 38: 148−154 (In Chinese)
Godin G (1972) The analysis of tides. University of TorontoPress, Toronto
Haas LW (1977) The effect of the spring−neap tidal cycle onthe vertical salinity structure of the James, York andRappahannock Rivers, Virginia, USA Estuar Coast MarSci 5: 485−496
Haidvogel DB, Arango H, Budgell WP, Cornuelle BD andothers (2008) Ocean forecasting in terrain-following coor-dinates: formulation and skill assessment of the RegionalOcean Modeling System. J Comput Phys 227: 3595−3624
Hill AE, Brown J, Fernand L, Holt J and others (2008) Ther-mohaline circulation of shallow tidal seas. Geophys ResLett 35: L11605
Jiang W, Li JQ, Gao YP, Mao YZ and others (2016) Effects oftemperature change on physiological and biochemical re -sponses of Yesso scallop, Patinopecten yessoensis. Aqua-culture 451: 463−472
Jiang W, Lin F, Fang J, Gao Y and others (2018a) Transcrip-tome analysis of the Yesso scallop, Patinopecten yessoen-sis gills in response to water temperature fluctuations.Fish Shellfish Immunol 80: 133−140
Jiang W, Du M, Fang J, Gao Y and others (2018b) Responseof Yesso scallop Patinopecten yessoensis to acute temper-ature challenge: physiological and biochemical parame-
ters. J Oceanol Limnol 37: 321−329 Li M, Zhong L (2009) Flood−ebb and spring−neap variations
of mixing, stratification and circulation in ChesapeakeBay. Cont Shelf Res 29: 4−14
Lin F, Asplin L, Budgell WP, Wei H, Fang J (2019) Currentson the northern shelf of the Yellow Sea. Reg Stud Mar Sci32: 100821
Shchepetkin AF, McWilliams JC (2005) The regionaloceanic modeling system (ROMS): a split-explicit, free-surface, topography-following-coordinate oceanic model.Ocean Model 9: 347−404
Shumway SE, Parsons GJ (eds) (2016) Scallops: biology,ecology, aquaculture and fisheries, 3rd edn. Elsevier Sci-ence, Oxford
Simpson JH, Hunter JR (1974) Fronts in the Irish Sea. Nature250: 404−406
Steeves LE, Filgueira R, Guyondet T, Chassé J, Comeau L(2018) Past, present, and future: performance of twobivalve species under changing environmental condi-tions. Front Mar Sci 5: 184
Strand Ø, Brynjeldsen E (2003) On the relationship betweenlow winter temperatures and mortality of juvenile scal-lops, Pecten maximus L., cultured in western Norway.Aquacult Res 34: 1417−1422
Warner JC, Sherwood CR, Arango HG, Signell RP (2005)Performance of four turbulence closure models imple-mented using a generic length scale method. OceanModel 8: 81−113
Xiao J, Ford S, Yang H, Zhang G, Zhang F, Guo X (2005)Studies on mass summer mortality of cultured zhikongscallops (Chlamys farreri Jones et Preston) in China.Aquaculture 250: 602−615
Zhao Y, Zhang J, Lin F, Ren JS and others (2019) An ecosys-tem model for estimating shellfish production carryingcapacity in bottom culture systems. Ecol Modell 393: 1−11
Zhou JH (2012) Preliminary study on structure and character-istic of Yesso scallop industry in LiaoNing. MSc disserta-tion, The Ocean University of China, Qingdao (in Chinese)
Editorial responsibility: Jonathan Grant, Halifax, Nova Scotia, Canada
Reviewed by: 3 anonymous referees
Submitted: June 12, 2020Accepted: January 18, 2021Proofs received from author(s): April 22, 2021