Embed Size (px)
Citation preview

Rare-Earth Analysis by a Rotating Platform, Silver-Spark Technique::'
Theodore R. Lyon
Phillips Petroleum Company, Atomic Energy Division, Idaho Falls, Idaho 83401~
(Received 22 December 1966)
A rotating platform, silver-spark technique has been adapted for analysis of rare-earth elements directly, either as solutions or after copreeipitation with a carrier. The platform sample electrode is compared with the rod sample electrode conventionally used, and silver is shown to provide some advantages over copper as an electrode material. Observations are reported on conditions pertaining to the preparation and excitation of samples. Three varied applications of the method are briefly described, and matrix effects are discussed. Platform electrodes are found to be more convenient and adaptable than conventional rods, and the sensitivity of the method is comparable to the copper-spark method for small samples. When larger samples are used, the sensitivity decreases; however, good sensitivity can be obtained by properly selecting conditions or equipment.
I N T R O D U C T I O N
As the supply of pure rare-earth metals and oxides has increased, both industrial and nuclear applica- tions of rare-earth materials have increased. An in- creased demand for rare-earth analysis has accom- panied the increased use of rare earths. Speetrog- r aphy has been widely applied for providing these analyses, and a great many difficulties have been encountered. As a result, many different methods have been developed, each meeting specific sensitivity requirements or separation procedures. Vickery 1 has summarized both the problems and the reported emis- sion spectrographic methods, expanding the earlier presentation of Norris and Pepper2 The method presented here is most similar in approach and sensi- t ivity to the copper-spark technique developed by Fred, Naehtrieb, and Tomkins. s H i r t and Nachtrieb * used the copper-spark technique in determining rare- earth elements in uranium compounds; Spicer and Ziegler ~ employed it to determine the amount of lan- thanum in praseodymium metal, and Faris ~ used it
Table I. Absolute spectral sensitivities--Ag vs Cu electrodes.
Limit of deteetion--Ng of rare earths
Element Ag platform Cu platform
La 10 10 Pr 25 25 Nd 50 25 Sm 50 50 Eu 5 5 Gd 20 2O Tb 50 50 Dy 50 50 t-Io 15 25 Er 5 10 Tm 15 10 Yb <i 1 Lu 10 15 Y <1 1
in determining the concentration of scandium, yt tr ium, and rare-earth elements in thorium.
The technique to be discussed here differs from other metal electrode, spark systems by using as the sample electrode a flat-surfaced, l~-in, diam, metal disk on a rotat ing platform. 7 This type of electrode eliminates many of the problems that are encountered using rods for sample electrodes. Since the surface is considerably larger, pipett ing solutions onto the electrode face is facilitated. Surface tension of the solution is not important, so the applications are less limited than is the case with rods. Pipet t ing losses are minimized by rinsing the pipet directly onto the electrode. Usually this may be done without increas- ing the time required for sample loading. Also, with the platform electrode, excitation is easily restricted to the area covered by the sample.
While other metals may be used for these sample electrodes, silver and copper were compared. Silver does show some advantages over copper. Silver shows more resistance to corrosion, is generally easier to clean and maintain, contributes less to the back - ground, and provides better sensitivity for most y t t r ium group rare earths. Table I shows a compari- son of the absolute spectral sensitivities for rare earths using silver and copper as the electrode material.
I. PREPARATION
Because this technique does provide low detection limits, care and cleanliness are of utmost importance. Used electrodes may be cleaned by boiling the elec- trode in dilute hydrochloric acid and then buffing the surface with fine steel wool. Pr ior to re-use, the electrode is again boiled in dilute hydrochloric to remove any strands of steel wool, rinsed well with distilled water, and dried between two fresh, acid- washed filter papers. This provides a clean, bright surface for sample preparation.
558 Volume 22, Number 5, 1968 APPLIED SPECTROSCOPY
Samples can be loaded onto the electrode either as solids t rapped on a filter to be ashed on the electrode or as solutions. In order to cover a uniform area of each electrode with solution, it was found best to rinse the pipet with enough distilled water so that the volume placed on each electrode was nearly equal. Solutions are best evaporated to dryness on the sample electrode by using a hotplate set to maintain a temperature of 80°C. Many samples dried under a heat lamp tend to spatter. Drying in a vacuum desic- cator is slow, but this method may prove desirable either where there is danger of airborne contamina- tion or where there is excessive electrode corrosion when heat is applied. I f this form of drying is com- bined with coating the electrode with a thin film of Apiezon-N grease, dilute nitric or aqua regia solu- tions may be deposited on the silver platform elec- trode.
I I . E X P E R I M E N T A L M E T H O D
1Viany factors were investigated in establishing the conditions for the excitation and the recording of spectra. The equipment and the conditions used are summarized in Table II . Increased inductance re- quired longer exposure t imes to obtain a complete sample burn. Increased capacitance had little effect. Exposure time is determined by the number of revo- lutions required to obtain a complete sample burn. Minimum exposures result when the entire sample is consumed in one revolution; however, since the dried salts tend to form a ring around the edge of the sample spot, it seems advisable to use two revo- lutions as the minimum. This exposure time was found adequate for samples up to 100 ~g in weight. Larger samples require longer exposure time, i.e., a 500-t~g sample requires at least four revolutions.
Situations where the rare earths are present in nearly equal concentration in the mixture may be very unlikely. Still, it seemed advisable to s tudy this possibility as a means of evaluating any matrix effects which might result when rare-earth impurities are sought in an essentially pure rare-earth matrix. In evaluating these effects, two studies were made.
Table II. Apparatus and spectrographic conditions.
Electrodes Sample High purity Ag disks, l~-in, diam, ~ in. thick, mounted on Jarrell- Ash rotating platform electrode assembly making 5 rpm
Counter High purity Ag rod, ~ - in. diam, 2-in. length with flat ends
Analytical gap 2 mm Excitation unit Jarrell-Ash Varisource-
high voltage spark Spark power switch Position No. 5 Powerstat setting 60 Inductance 40 t~H Capacitance 0.005 ~F Resistance Residual Current, rf A 6.5 Discharges per 8
half-cycle Prespark None
Exposure, sec Depends on sample size Spectrograph Jarrell-Ash Ebert, 3.4-
meter 15000 lines/in. grating
Wavelength range, Varied with specific prob- A lem
Slitwidth 30 Slit height 4 mm Filter Neutral, 2-step, 100%
and 50% T. Photographic Eastman S.A. No. 1 or
emulsion 103a0 Developer Eastman D-t9, time de-
pendent upon emulsion used
Plate calibra- 2-step method, Fe arc tion exposure
Prel iminary tests showed that mixtures of rare earths could be done if samples less than 25 tug were used. This was necessary to lower background and lessen line interferences. The first study compared two independent sets of standards in the range of 0.1 t~g to 1.0 ~g. One set of four standards was prepared by combining dilute solutions of twelve rare-earth
5 . 0
4 . 0
o 3 . 0
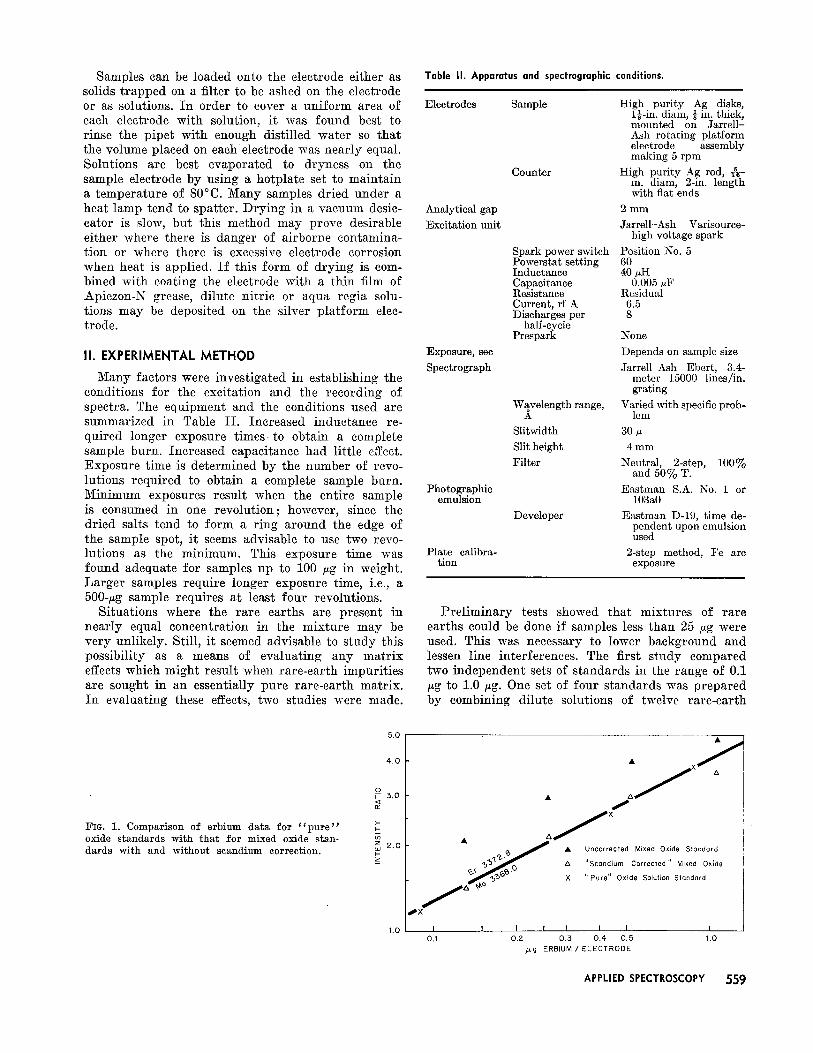
Fro. 1. Comparison of erbium data for "pure" ~- oxide standards with that for mixed oxide stun- ~ 2.0 dards with and without scandium correction.
z
1.0
• ~ ~Jx . 5 . 5 1 ~ . ~ ' r ~ . . • Uncorrected Mixed Oxide Slondard
"Scandium Corrected" Mixed Oxide
j : , ~ ' ~ X " Pure" Oxide Solution Standard
, X
I I I I t I I I O.t 0.2 0.3 0.4 0.5 1.0
~g ERBIUM / ELECTRODE
APPLIED SPECTROSCOPY 559

Lo Ce Nd Srn Eu Gd Tb Dy HO Er T ~ Lu Y
Lu 2911.5 - - - - ~ " ~ ~ , - ~ ~ I ,~, m=.79
Tm 2911,8 s =.135 Gd 3461.9ck
Tm
~ S = A 4 9
Er m=3.04
Ho m=.58 3398.9 "~'~.~.~,~,.,."-~- s :.124
Dy" • m =.29 3 4 0 ' 7 . 8 - ~ - / s : .074
Y 3407 .7
Tb ~ __ - - ~ rn:.43 3561.8 ~-'..-.,,..--.o--...o.--- - - - - s =.046
Gd A ~ ~ rn= .40 3768.4 . . . . s =.258 ~39~ Eo ~ "kX..... v m=,OI
3930.5 ~ s :.315
:3592.6 ~ s =.0'78
La m =1.17 3949.1 ~ " " ~ ~ s =.424
~IG. 2. Influence of predominant rare-earth elements on the intensity ratios of rare-earth impurities.
oxides in groups of three. The second set of s tandards was made by dilut ing a solution of a commercial rare- ear th elements plus y t t r i um and scandium. Two mi- crograms of molybdenum were added as an internal s tandard. Data was taken for Dy, Er, Eu, Gd, Ho, La, Lu, Sin, Tb, and Tin.
No significant differences were found between the two sets of s tandards when the data points were plot ted with the exception of erbium. The exception was found to be owing to the interference of the scandium line at 3362.2 4 . F igure 1 shows the com- parison of the data with and without the background correction used to remove the effect of the scandium interference.
Fo r the second study, approx imate ly 25 t~g of each of the rare-ear th elements Ce, Dy, Er , Eu, Gd, Ho, La, Lu, Nd, Sin, Tb, Tin, and ¥ were placed on sepa- ra te p l a t fo rm electrodes. F ive micrograms of the commercial rare-ear th mix ture and 2 ~g of molyb- denum internal s tandard were added to each elec- trode. The samples were sparked using first-order dispersion and recorded on Eas tman S. A. No. 1 plates.
In tens i ty ratios, calculated f rom these plates, were compared with the expected value derived f rom standardizat ion data taken af ter the first study. Fig- ure 2 shows the intensi ty ratios compared to the expected value for Dy, Er , Eu, Gd, Ho, La, Lu, Sin, Tb, and Tin.
I n this si tuation line interference became a major problem although second-order dispersion would have lessened the number of line interferences shown. However, not all of the deviations in this data can be explained as line interference. I f deviations greater than three s tandard deviation units are con- sidered significant, the data shows tha t the intensi ty ratios are enhanced for Lu in Ho, for E r in La, for Dy in Sin, for T h i n La and Lu, and for Eu in Gd. In tens i ty ratios are significantly lowered for E r in
Nd, Dy, Tm, and Lu, for Ho in Tin, and for Tb in Nd, Sm, and Eu.
The results of these matrix-effect studies showed that rare-ear th element concentrations could be de- te rmined in a complex rare-ear th ma t r ix if the size of the sample was kept small to reduce background and lessen line interference. Second-order dispersion seemed advisable to help accomplish these same ends. I f one rare ear th is p redominant in the matr ix , inter- elemental effects might arise which would require special standards. In tens i ty rat io enhancement indi- cated tha t there might be impuri t ies in some of the rare-ear th oxides, and blank corrections might be called for whenever these oxides were used as a basis of standardization.
III. APPLICATIONS
Applicat ion of spec t rography to rare-ear th analy- sis may be classified according to the element sought and the mat r ix in which it is found. Whenever rare- ear th minors or traces are sought in a nonrare-ear th matr ix , a p re l iminary chemical separat ion is usual ly performed. These separat ions may be either by car- r ier or by nonearr ier methods. Rare earths may also be sought in a mixed or " p u r e " rare-ear th matr ix . Occasionally an analysis for a nonrare-ear th element in a rare-ear th mat r ix is required. In order to dem- onstrate the adaptabi l i ty of the ro ta t ing-p la t form technique, three var ied applications are discussed.
Samples of a luminum alloyed with either holmium or thul l ium were submit ted for analysis of the par- t icular rare-earth ' element. One hundred mil l igrams of the alloy were dissolved, and the rare-ear th com- ponent was separated f rom the a luminum by precipi- tat ion in the presence of an indium carr ier with so- dium hydroxide. The precipi ta te was collected on a polystyrene filter disk. The filter was placed on a p la t fo rm electrode, y t t r i um was added as an internal s tandard and the filter was ashed. As a check on the procedure, a solution of a commercial mix ture of rare-ear th oxides was prepared. Two aliquots of this solution were t rea ted as samples. S tandard solutions of spectroscopically pure rare-ear th oxides were also prepared. Samples and s tandards were sparked, and the results obtained on the solution aliquots showed a mean relative deviation f rom the expected values of 12%.
Da ta on the precision obtained in these determina- tions is summarized in Table I I I . A str ict comparison of the coefficients of var ia t ion shown here with values given in the l i tera ture is difficult. Far i s 6 estimates the accuracy of the copper-spark technique to be
Table III. Precision data for the determination of He and Tm in AI.
Deter- No. in Standard Coeff. of mination sample Mean deviation variation
t to in A1 3 0.095 0.0083 8.7% Tm in A1 4 0.088 0.0126 14.3%
560 Volume 22, Number 5, 1968

2 .0
1.8
1.6
h 4
1 .2
i~iG. 3. Working curve for the determination of ,.o Ce in Nd208.
0 8
0.6
0 .4
I.Z
0 o
/ c2
, I , I , I I I J I I 2 4 6 8 I 0 . 12
/~g Ce
~ 5 % of the amount present on the average of two exposures. Spicer and Ziegler ~ calculate the coefficient of variat ion to be 4.6% for the means of five ex- posures. The values shown in Table I [ I , however, per ta in to single determinations, and values based on mult iple exposures would be reduced to a level com- parable to those given for the copper-spark tech- nique.
A second application required the determinat ion of the amount of cerium impur i ty in a sample of Nd203. Synthetic s tandards were made by adding cerium to a solution of spectroscopically pure Nde03. Standards and the sample were sparked and the spectra were recorded, using a proper filter and second-order dispersion, on Eas tman 103a0 plates. Neodymium was used as the internal s tandard. Sam- ple and s tandard data were corrected for back- ground and the working curve was corrected for residual cerium impur i ty by the method of Pierce and Nachtrieb. s The l imit of detection was calculated to be 0.4 tug of cerium. F igure 3 shows the working curve obtained f rom the data.
The first two applications given dealt with deter- mining the concentration of rare-ear th elements in
either a nonrare-ear th ma t r ix or a rare-ear th matr ix . The method was also applied to est imating the amount of bar ium contained as an impur i ty in a cerium spike solution. As little as 10 ng of bar ium could be seen in 1 t~g of cerium when the bar ium line at 6141.7 A was recorded on Eas tman 103af plates.
IV. CONCLUSIONS
The rota t ing pla t form, si lver-spark technique has proved adaptable to most types of problems requir- ing spectrochemical analysis of rare-ear th materials. While the absolute spectral sensitivities for rare- ear th elements using this technique may be equalled by conventional techniques, the use of larger samples may sometimes provide bet ter relative sensitivities. Although the size of the sample placed on the plat- fo rm may be l imited by factors such as background intensity, line interferences, and mat r ix effects, tech- niques using rods are l imited to small samples only. These techniques are also l imited by the composition or concentration of the sample solution. Sample ap- plication is easier and less l imited with p la t fo rm electrodes than with rods because of the larger sur- face area. Sample solutions seldom run off the plat- form electrode face, and this technique is adaptable to either solids or solutions.
*This work was performed under contract AT(10-1)-205 to the Atomic Energy Commission.
~Present Address: Idaho Nuclear Corporation, Post Office Box 1845, Idaho Falls, Idaho 83401.
1. R. C. Vickery, Analy$ica~ Che~nisSry of the l~are J~arths, (Pergamon Press, Inc., New York, 1961).
2. J. A. Norris and C. E. Pepper, Anal. Chem. 24, 1399 (1952).
3. M. Fred, N. H. Nachtrieb, and F. Tomkins, J. Opt. Soc. Am. 37, 279 (1947).
4. R. C. t I i r t and N. H. Nachtrieb, Anal. Chem. 20, 1077 (1948).
5. W. M. Spicer and W. T. Ziegler, Anal. Chem. 21, 1422 (1949).
6. J. P. Faris, Appl. 8pectry. 12, 157 (1958). 7. G. Y. Wheeler, W. A. Ryder, and K. 1% Arnold, Appl.
Spectry. 16, 17 (1962). 8. W. C. Pierce and N. It. Nachtrieb, Indust. Eng. Chem.,
Anal. Ed. 13, 774 (1941).
APPLIED SPECTROSCOPY .561