Embed Size (px)
Citation preview

Rastrac User Certification
Training
1 System Overview
1.1 Hardware
1.1.1 PocketRASTRAC
1.2 Employers
1.3 Parents
1.4 Rastrac/IOP/Database
1.5 Live Tracking
1.6 Plugins
1.6.1 Map Marker Plugin
1.6.2 Enterprise Plugin
1.6.2.1 Last State Table
1.6.2.2 Last Position State Table
1.6.2.3 Last Event State Table
1.6.3 RTSMTP
1.6.4 Maintenance
2 LiveTracking
2.1 Help
2.2 Overview

2.2.1 User Accounts
2.2.2 Sub Accounts (Optional)
2.2.3 Vehicles/Locations
Context Menus
2.2.4 Notifications/Geofences
2.2.5 Messaging
2.2.6 Search
2.2.7 Route
2.2.8 Map
2.2.9 Updates
2.3 Alerts
2.4 Track History
2.4.1 Time Interval Selector
2.4.2 Dashboard
2.5 Messaging
2.6 Locations
2.7 Reports
2.7.1 After Hours
2.7.2 Alerts
2.7.3 Compact
2.7.4 Complete
2.7.5 Congregation
2.7.6 Consolidated
2.7.7 Driver Performance
2.7.8 Engine Hours

2.7.9 Event
2.7.10 Field Trip
2.7.11 Fleet
2.7.12 Fuel Ticket
2.7.13 Fuel Usage
2.7.14 Geofence
2.7.15 Idle Time
2.7.16 Last Position
2.7.17 Last Update
2.7.18 Location
2.7.19 Maintenance
2.7.20 Message
2.7.21 Regulatory Forms
2.7.22 Shift
2.7.23 Speed
2.7.24 Stop
2.7.25 Summary
2.7.26 Timecard
2.7.27 Track
2.7.28 Trip
2.8 Settings
2.8.1 Profile
2.8.2 Display
2.8.3 Labels
2.8.4 Notifications

2.8.5 Maintenance
2.8.6 Vehicles
Custom Icons
2.8.7 Locations
2.8.8 Contacts
2.8.9 Drivers
2.8.10 Assets
3 Mobile
3.1 Current position
3.2 Device
3.3 Settings
1 System Overview
1.1 Hardware
RASTRAC is device-independent (“device-agnostic”) and works with more than 80 different hardware
devices. We can supply the best hardware to meet your needs, or you can provide your own.
Communication Type
● TCP/IP Network - Generally NOT RECOMMENDED (will use a lot of server resources)
● UDP Network - Used by MOST cellular devices
● Radio - Direct to COM Port connectivity for Radio-Based Systems
● E-Mail - Used by most satellite networks
● HTTP/HTTPS - Used when retrieving data from web-based applications
● SMPP - Used to connect to SMS Gateways
Reporting Type
● High Frequency Updates
● Moving Vehicles - Turn Detect (Distance, Time, Course Change - Whichever occurs first, but not
more often than “X” seconds)
● Time Based Updates - Vehicle reports “X” while moving and “Y” while stopped.
● Mid Frequency Updates
● Heavy Equipment - Once an hour with Engine On and Off (For Engine Hours)
● Low Frequency Updates (Exception Tracking)
● Time based updates from 4 to 24 Hours. (i.e., Stationary Assets, Trailers, etc...)
● Updates based on inputs or other triggers.
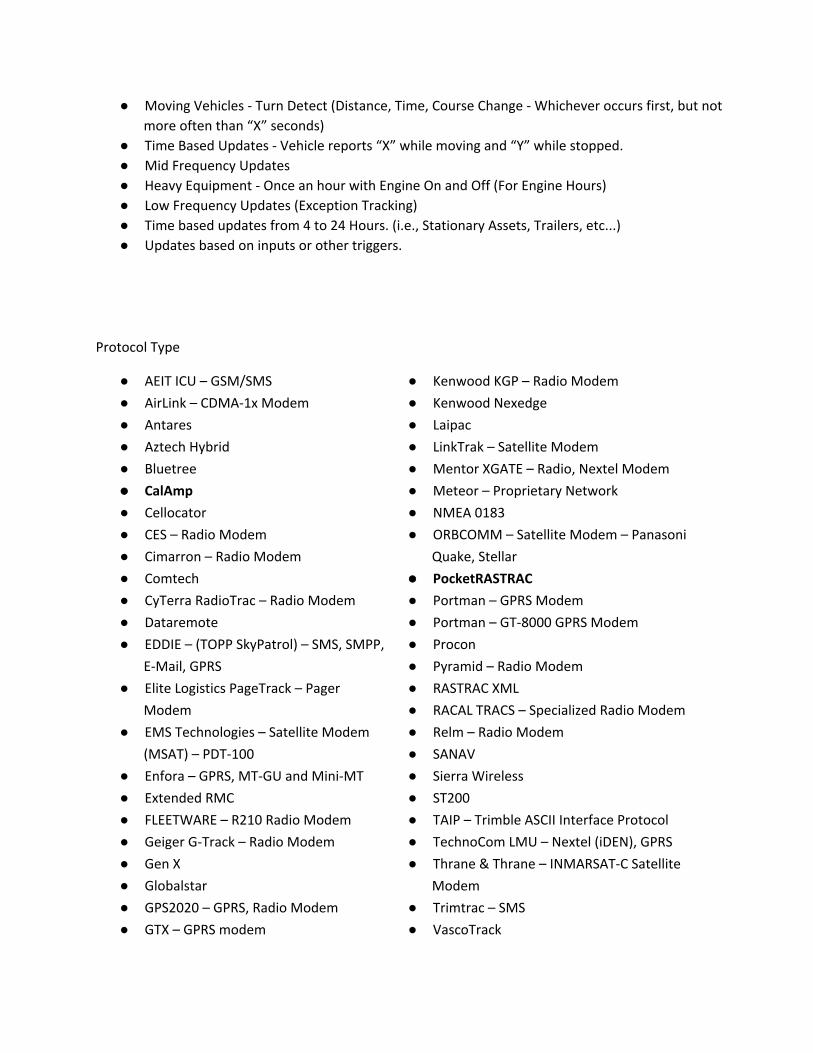
Protocol Type
● AEIT ICU – GSM/SMS
● AirLink – CDMA-1x Modem
● Antares
● Aztech Hybrid
● Bluetree
● CalAmp
● Cellocator
● CES – Radio Modem
● Cimarron – Radio Modem
● Comtech
● CyTerra RadioTrac – Radio Modem
● Dataremote
● EDDIE – (TOPP SkyPatrol) – SMS, SMPP,
E-Mail, GPRS
● Elite Logistics PageTrack – Pager
Modem
● EMS Technologies – Satellite Modem
(MSAT) – PDT-100
● Enfora – GPRS, MT-GU and Mini-MT
● Extended RMC
● FLEETWARE – R210 Radio Modem
● Geiger G-Track – Radio Modem
● Gen X
● Globalstar
● GPS2020 – GPRS, Radio Modem
● GTX – GPRS modem
● Kenwood KGP – Radio Modem
● Kenwood Nexedge
● Laipac
● LinkTrak – Satellite Modem
● Mentor XGATE – Radio, Nextel Modem
● Meteor – Proprietary Network
● NMEA 0183
● ORBCOMM – Satellite Modem – Panasonic,
Quake, Stellar
● PocketRASTRAC
● Portman – GPRS Modem
● Portman – GT-8000 GPRS Modem
● Procon
● Pyramid – Radio Modem
● RASTRAC XML
● RACAL TRACS – Specialized Radio Modem
● Relm – Radio Modem
● SANAV
● Sierra Wireless
● ST200
● TAIP – Trimble ASCII Interface Protocol
● TechnoCom LMU – Nextel (iDEN), GPRS
● Thrane & Thrane – INMARSAT-C Satellite
Modem
● Trimtrac – SMS
● VascoTrack

● Hunter Pro – GPRS Modem
● Icom – Radio modem
● Independent Witness
● Inmarsat-D+ – Satellite Modem –
SkyWave
● Insider – GPRS Modem
● IntelliTrac
● IntraGlobis – Cellular Phone
● Kenwood FleetSync – Radio Interface
● Kenwood FleetSync & KGP – Radio
Interface
● VehicleTrack – GPRS Modem
● V-TRACK
● WebTech – GPRS Modem
● Where-Tech – Short range radio modem
(data processed from downloaded files)
● Wireless Links Acknowledger
● Xirgo
● Z-Com VG300
1.1.1 PocketRASTRAC
Turn your iPhone or Android phone/tablet into a GPS tracker, complete with secure, 2-way messaging.
Our PocketRASTRAC app allows you to track your employees, family members, team members, or assets
without having to purchase costly hardware. All you need is an Android device or iPhone.
PocketRASTRAC transforms your device into an advanced tracking platform, complete with reporting
based on time, distance, speed, and turn detection.
1.2 Employers Want to communicate with your employees in the field while tracking their positions? PocketRASTRAC
and Live Tracking make the perfect solution. Employees can send statuses (e.g. ‘Clocking In’) and form
messages, as well as plain text messages to keep you connected with what is going on in the field.
1.3 Parents Want to know where your kids are when you aren’t with them? PocketRASTRAC or PocketRASTRAC Lite
and Live Tracking will provide peace of mind, allowing you to always keep an eye on those you care
about.

1.4 Rastrac/IOP/Database
Rastrac is a full-featured, windows based vehicle tracking application.
The Input/Output Processor or IOP is a tracking device communication application. It converts all incoming
data from the supported device protocol to a normalized state-vector based structure.
Database holds all the active and functional data. ODBC drivers are used for Rastrac connections. Rastrac
however has been integrated almost exclusively with Microsoft SQL Server (MS SQL). Note: the Rastrac
website using Microsoft’s default security setting that require MS SQL. (Javier: I’m confused by this note)
1.5 Live Tracking Live Tracking is the most advanced vehicle tracking solution available. This platform allows for tracking in
real-time. When logged in to the system, you can manage your fleet using a map or information view, set
up automatic notifications, and schedule periodic reports so that you may address important occurrences
in your fleet in real time.
1.6 Plugins
1.6.1 Map Marker Plugin The Map Marker plugin is used to add a visual layer to the map to indicate the last time a point, street, or
region has been “visited” by an AVL device. Visited can mean reported near the location or reported

near the location with an input on or off. How this is defined depends on application and the AVL device
that is in use. One popular use of this plugin is to track snow plow progress.
The Map Marker Plugin requires one additional install, the Mapping Service website. This service creates
and caches the image tiles used to create the color coded layer seen above. The color coding is
completely adjustable. The plugin works best in small areas; for example, color coding the full US street
layer is not recommended.
1.6.2 Enterprise Plugin The Enterprise Plugin creates and updates the cache tables in the Rastrac State Database. This plugin is
optional for smaller systems. It main purpose is to speed up access to critical data when the Vehicle State
Table is large and queries take a long time. Currently the Enterprise Plugin support three tables.
1.6.2.1 Last State Table
This table has the last update from each device.
1.6.2.2 Last Position State Table
This table has the last update that contained a valid Latitude and Longitude.
1.6.2.3 Last Event State Table
This table has all the last events for each device.

1.6.3 RTSMTP The RTSMTP plugin enables RASTRAC to send e-mails as well as receive e-mails. Emails sent to RTSMTP
contain an "on-demand" location report request for one of your vehicles via a properly formatted
message.
Outgoing email will be sent when a specified geofence or event is triggered. Once the specified
geofence or event is triggered the e-mail will be made as soon as the RTSMTP Plugin is available.
1.6.4 Maintenance The Maintenance plugin allows you to ensure your vehicles are well-maintained by keeping track of
required maintenance. This might include oil changes, tire rotations, etc. This is accomplished by creating
maintenance intervals and assigning them to the appropriate vehicles.
2 LiveTracking
2.1 Help
Live Tracking is the most advanced vehicle tracking solution available. As such, it can be difficult to grasp
all of the many features and how to best utilize them for your unique application. The aim of this section
is two-fold:
1) To identify the tools at your disposal
2) To provide basic instruction on how they are used

2.2 Overview
Your instructor will briefly describe the main sections of the Live Track Interface
2.2.1 User Accounts User accounts organize system resources such as vehicles, locations, and notifications so that customized
selections can be viewed and edited without affecting the system as a whole.
2.2.2 Sub Accounts (Optional) You are allowed to add existing user accounts into another account. This will allow you to access the devices and data contained in the subaccount. It is an easy way to separate the devices into logical areas. Below is an example of how a city could organize a their snow accounts.
2.2.3 Vehicles/Locations The Vehicles/Locations tab provides an alphabetical listing of your vehicles and
locations.

Context Menus
In several areas right clicking will bring up a context menu which will allow you toquickly perform a variety of actions. Some examples: Find Vehicle – Center map on selected vehicle by right-clicking vehicle name in vehicle list and choosing “find” in contextual menu.
Follow Vehicle – Map follows selected vehicle. Enable by right-clicking vehicle name and choosing “find” in contextual menu.
Run Vehicle Track – Show historical vehicle track for selected date range. Enable by right-clicking vehicle name and choosing “track” in contextual menu and choose track period to view. Control-Click or Shift-Click on vehicle names allows viewing of multiple vehicle tracks simultaneously. When multiple tracks are viewed, breadcrumbs are not visible.

2.2.4 Notifications/Geofences
The Notifications tab allows you to schedule notifications by email or phone to send when one or more of
your vehicles report under specific circumstances. These notifications may be scheduled to be sent for
many reasons, including entering/exiting a geofence or triggering an event. A notification is created by
choosing the notification method (email or phone voice message) and typing what the message should
contain. The Insert Column Values... link allows you to insert column values into the message. For
example, if your notification is created to notify when a vehicle enters a geofence called "COVE", you
might choose the message to be '{{ALIAS}} has entered COVE', where {{ALIAS}} is inserted by clicking
Insert Column Values..., choosing 'Vehicle', and clicking 'Insert'. If a vehicle named 'Vehicle1' enters the
COVE geofence, the notification's message will be 'Vehicle1 has entered COVE'.

In addition to entering/exiting a geofence, a notification may be triggered by a vehicle sending a
certain event. This may be a pre-defined event or a new event, and the notification may be set to
be sent always or only if a vehicle is inside/outside a geofence when the event is sent.

When all of the notification parameters have been set, the user clicks Add to save it. The user's
existing notifications are listed at the bottom of the page.
Under Geofences, the user may check whether or not to show geofences on the map.
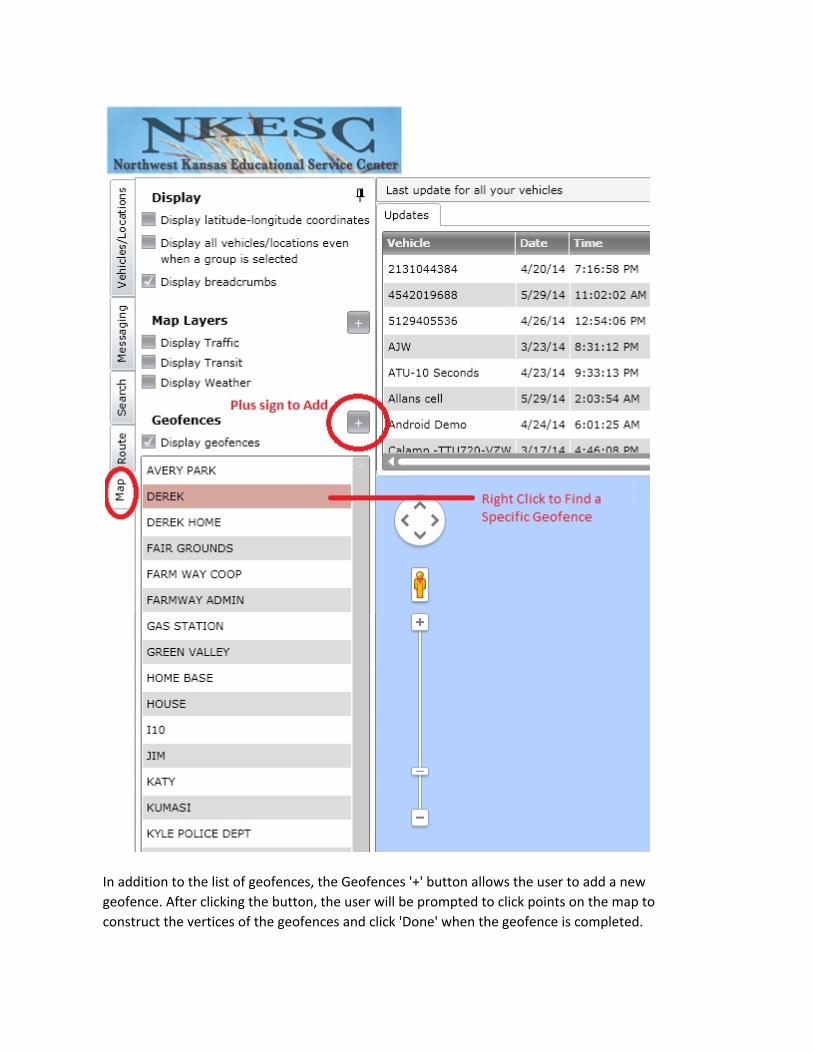
In addition to the list of geofences, the Geofences '+' button allows the user to add a new
geofence. After clicking the button, the user will be prompted to click points on the map to
construct the vertices of the geofences and click 'Done' when the geofence is completed.

(When creating a Geofence, We recommend setting the map to the appropriate Zoom level for
easier drawing.)
Type of Geofences:
Polygon - Up to 500 vertices. For simple to complex regions of interest.
Circular - Simple, Point based. Width in Miles
Corridor - Line based for Route Adherence.
All Geofences can be edited after the fact and set to their own unique color.
2.2.5 Messaging
The Messaging tab allows you to directly communicate with your vehicles. Once in the messaging
tab, select a vehicle from the list at the bottom and type your message.
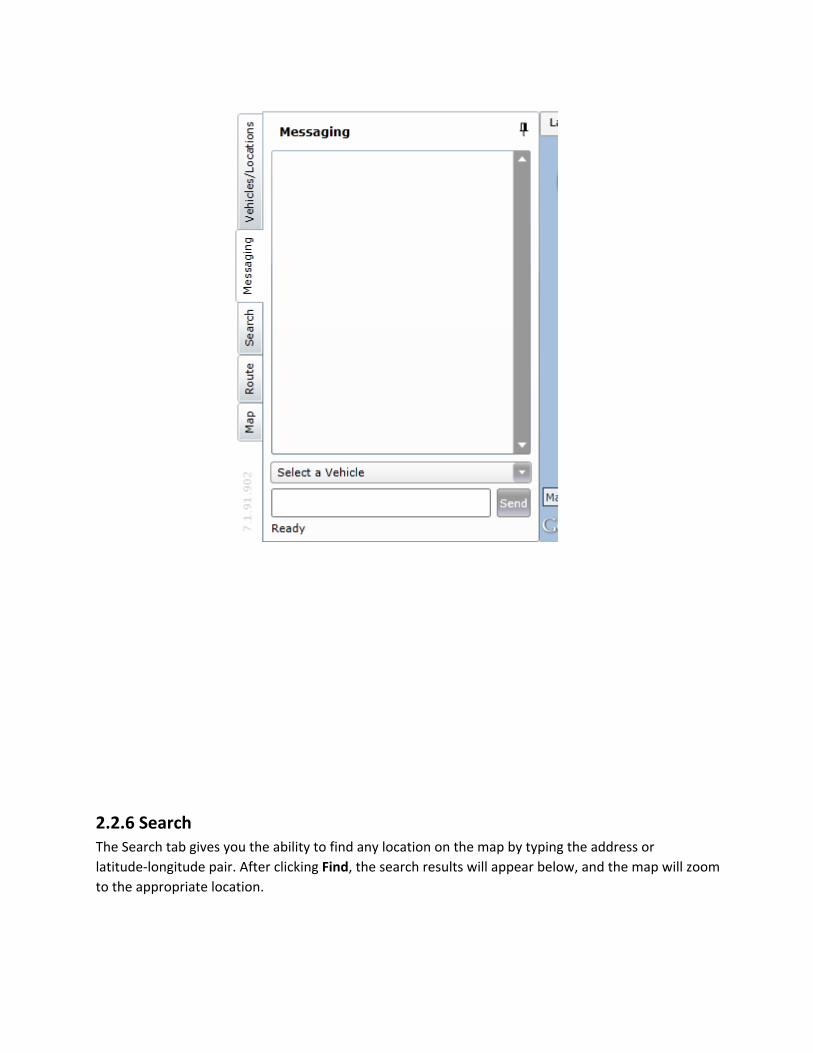
2.2.6 Search The Search tab gives you the ability to find any location on the map by typing the address or
latitude-longitude pair. After clicking Find, the search results will appear below, and the map will zoom
to the appropriate location.

2.2.7 Route
The Route tab allows you to find the quickest, most efficient path between two locations. Just type
the origin into the first textbox and the destination into the second, then click Route. You may type
addresses or even vehicle/location names to find the quickest route between two
vehicles/locations.

2.2.8 Map The Map tab allows you to configure your display settings for the map. Under Display, you may set
whether or not to show latitude-longitude coordinates based on mouse position on the map and
display all vehicles/locations regardless of whether a group is selected. Also Display
breadcrumbs determines whether or not to show markers for updates when looking at a vehicle's
track.

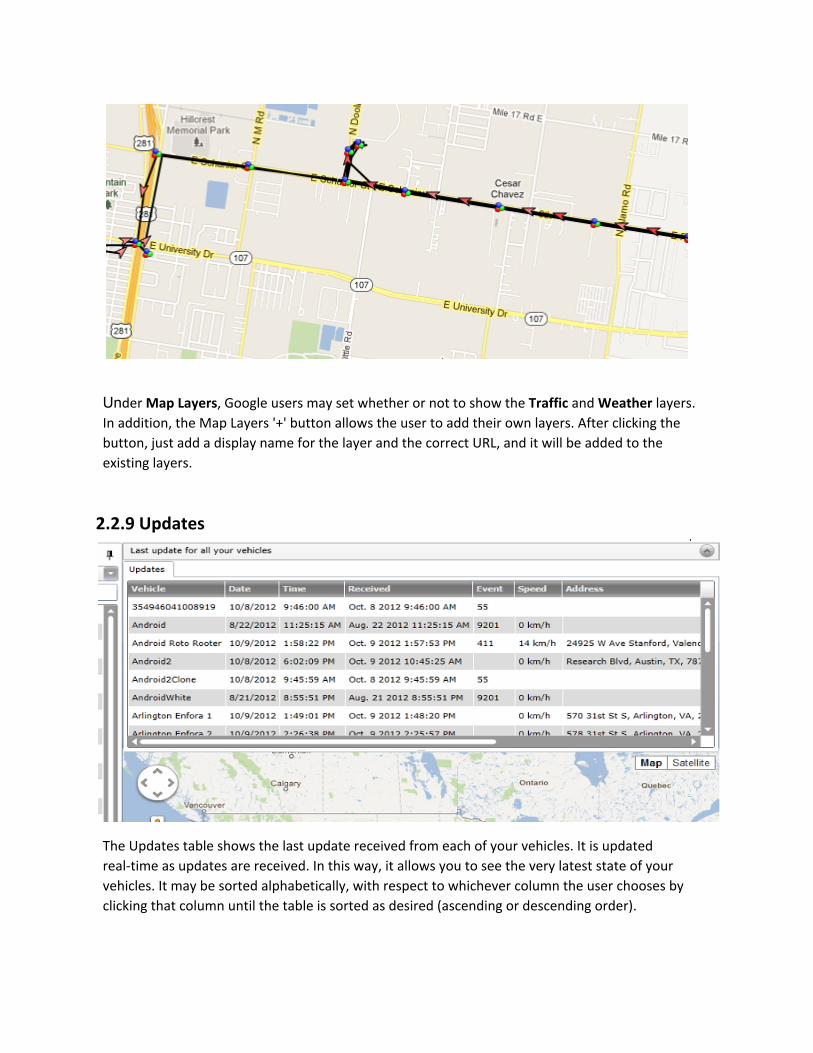
Under Map Layers, Google users may set whether or not to show the Traffic and Weather layers.
In addition, the Map Layers '+' button allows the user to add their own layers. After clicking the
button, just add a display name for the layer and the correct URL, and it will be added to the
existing layers.
2.2.9 Updates
The Updates table shows the last update received from each of your vehicles. It is updated
real-time as updates are received. In this way, it allows you to see the very latest state of your
vehicles. It may be sorted alphabetically, with respect to whichever column the user chooses by
clicking that column until the table is sorted as desired (ascending or descending order).

2.3 Alerts Alerts Control Panel is used to show notifications triggered, maintenance intervals’ statuses, and
vehicles that have not reported; viewable by clicking ‘Alerts’ link in top-right corner or by checking
‘Display alerts control panel upon login’ on the ‘Display’ tab of the Settings page


2.4 Track History
2.4.1 Time Interval Selector
The Time Interval Selector determines which period of time is reflected in the Dashboard and on
the map. It consists of a start time and end time control. For example, to view a track for the day of
June 6, 2012, the user would select '6/6/2012', using the start time date picker and '12:00 AM',
using the start time timepicker. He/she would similarly select '6/7/2012' and '12:00 AM' using the
end time control. Alternatively, the user may slide the start and end markers on the timeline to the
correct positions.
The user may wish to run detailed reports for the time period he/she is viewing. With this purpose
in mind, the Apply to Reports link at the center of the Time Interval Selector may be clicked to
forward the user to the Reports page with that time period already selected.

2.4.2 Dashboard
The Dashboard shows detailed information for the track currently in view.
The Updates tab simply shows all of the updates that make up the track for the currently selected
vehicle and time period.
The Summary tab shows a summary of the vehicle's activity for the selected time period.

The Stops tab shows all stops and information about the total stops for the selected time period.
The Chronology tab shows a color-coded timeline and quantitative summary of the vehicle's
activity for the selected time period, including times that the vehicle was traveling, idling, or
ignition was off.
The Mileage tab shows the distances driven with respect to vehicle, driver, county, state, and
geofence.
The Events, Messages, Analogs, and Sensors tabs show all updates that contained the
corresponding state element. For example, the Events column will show all events received in the
chosen timeframe.
The Speed tab allows the user to see all updates during the selected timeframe that include a
speed higher than a user-specified speed - an absolute speed limit or the posted speed limit.
The Geofences tab allows the user to see all updates during the selected timeframe that occurred
inside a selected geofence.
The Analysis tab includes a detailed plotting tool to graph quantities with respect to time including
speed and odometer reading - anything with a quantifiable value.

2.5 Messaging
2.6 Locations
Locations are points of interests. Examples of Locations are “Office, Job Site 1, Home, etc..”.
2.7 Reports
Reports allow for your data to be sorted, calculated, and compiled in many different ways. For
example, if you are worried that your drivers have been speeding, you can run the Speed report

to see who has been speeding and when/where did it occur. Similarly, you may be concerned
about driver behavior in general. In this case, the Driver Performance report is what you're looking
for.
The reports page functions as the user interface for running/scheduling reports. To run/schedule a
report, first select whether you would like to run the report for drivers or for vehicles. Then, select
the vehicle(s) or driver(s) that you want to run/schedule the report for. Then, choose the type of
report you wish to run/schedule with the Report Type combobox at the top of the page. Also,
select how you would like the report to be formatted (as an HTML, Microsoft Excel, tab-delimited,
or PDF document) with the File Format combobox. If you would like to run a one-time report,
choose the Run Report Now option. Alternatively, if you would like to schedule a report to be
sent to be sent via email at a specified time, periodically, select Schedule a Report. Once you have
entered the desired parameters, click Run Report Now or Schedule Report at the bottom of the
page.
2.7.1 After Hours
The After Hours report allows you to monitor driver/vehicle activity that occurs outside the normal
work day.
User Inputs
The user enters the start and end time of a normal work day and selects whether they would like
to include updates that occur during the weekend. Additionally, the user can elect to only show
moving updates and ignore all other updates.
Results

The report shows all updates that occurred outside of the defined work day for each
driver/vehicle. The summary table shows the total number of updates and mileage traveled by
each driver/vehicle. The map shows the last update for each driver/vehicle. The chart shows the
total mileage per driver/vehicle.
2.7.2 Alerts
The Alerts report allows you to see which vehicles have not reported an update/position lately.
User Inputs
The user chooses the timeframe for which to show alerts. For example, choosing 'the last 3 days'
will show which vehicles have not reported in the last 3 days.
Results
The reports shows two tables - one shows the last update for each vehicle that has not reported
an update at all in the last _ days; the other shows the last position for each vehicle that has not
reported a position in the last _ days.
2.7.3 Compact
The Compact report shows all driver/vehicle updates of note; that is, the report will not show
consecutive non-moving updates. In this way, the report removes updates that are of lesser
consequence to driver/vehicle activity monitoring.
User Inputs

The user chooses whether to show updates on a per-driver/vehicle basis or to combine all updates into a
single table.
Results
All updates that satisfy the above criteria are shown, either combined or on a per-vehicle basis. The
summary table shows the total number of updates that satisfy the above criteria and mileage traveled
per driver/vehicle. The map shows the last update received for each driver/vehicle within the time
range, and the chart shows the mileage traveled per driver/vehicle.
2.7.4 Complete
The Complete report shows all updates for the specified time range.
User Inputs
The user chooses whether to show updates on a per-driver/vehicle basis or to combine all updates
into a single table.
Results
All updates are shown, either combined or on a per-driver/vehicle basis. The summary table shows
the total number of updates and mileage traveled per driver/vehicle. The map shows the last
update received for each driver/vehicle within the time range, and the chart shows the mileage
traveled per driver/vehicle.
2.7.5 Congregation

The Congregation report shows any congregations of drivers/vehicles; that is, when one or more
drivers/vehicles come together within a defined distance, stopped for a defined amount of time.
User Inputs
The user enters a stop distance and stop time, which defines a stop; that is, if the user selects 300
feet and 60 seconds, respectively, a driver/vehicle will be considered stopped if it does not move
at least 300 feet within 60 seconds.
Results
The report shows all driver/vehicle congregations - when each driver/vehicle joins the
congregation and when each driver/vehicle leaves the congregation; it shows the beginning and
end times of the congregations. The congregation ends when the first driver/vehicle in the
congregation leaves the congregation or when all other drivers/vehicles have left the
congregation and do not return before the selected end time for the report.
2.7.6 Consolidated
The Consolidated report shows a summary of each driver/vehicle's activity, including mileage and
maximum speed and optionally may include info about stops, idle time, and location visits.
User Inputs
The user selects whether or not they would like to see info about stops, idle time, location visits,
and events sent. The user enters the relevant parameters (stop distance and time, distance that a
vehicle must be from a location to be considered visiting that location, and events to consider,

respectively). NOTE: Ignition on/off events must be set in vehicle settings page to calculate idle
time.
Results
The report shows total mileage driven, maximum speed reported, and optionally, stop count and
duration, count of idle time occurrences and total idle time duration, count of location visits, and
event counts.
2.7.7 Driver Performance
The Driver Performance report allows you to monitor overall driver behavior with respect to
multiple grading parameters. The report awards grades, on a 0-100% scale, for each parameter as
well as an overall grade according to the weights given to each grading parameter.
User Inputs
The user selects how he/she would like the grade calculated by selecting the percentage of the
total grade that each parameter accounts for. The percentages must add up to 100. Grading
parameters include speed, abrupt acceleration, abrupt deceleration, RPM, and idle time.
Additionally, the user must select the settings for each parameter. For speed, the user must input
the speed limit, with respect to either an absolute speed or the posted speed limit. For abrupt
acceleration and deceleration, the user must input the event numbers associated with those
events. For RPM, the user must input a RPM limit. For idle time, the user must input what time
duration without moving defines idle time in seconds. NOTE: Ignition on/off events must be set in
vehicle settings page to calculate idle time.
Results

The report shows grades with respect to each grading parameter and the total grade for each
driver/vehicle. If run by vehicle, any drivers are shown for each vehicle as well as the total distance
traveled. By clicking a driver/vehicle's grade for a grading parameter, the user may view the
details of how that grade was calculated. For example, clicking a driver/vehicle's Speed grade will
show a list of all speeding occurrences.
2.7.8 Engine Hours
The Engine Hours report shows information on engine run-times for each driver/vehicle.
User Inputs
None. NOTE: Ignition on/off events must be set in vehicle settings page to calculate idle
time.
Results
The report shows total engine hours for each driver/vehicle as well as mileage driven, time
driven, etc.
2.7.9 Event
The Event report shows all updates received that contain the specified event.
User Inputs
The user specifies the event by selecting it or by selecting 'Other' and typing the event number.
The user also chooses whether to combine all drivers/vehicles or show the data on a
per-driver/vehicle basis.
Results
The report shows all updates that contain the specified event. The summary table shows how
many times that event occurred for each driver/vehicle. The map show the last update for each
driver/vehicle in the timeframe. The chart shows the number of event occurrences per
driver/vehicle.
2.7.10 Field Trip
The Field Trip report shows information on trips for each driver/vehicle.
User Inputs
The user must supply the ignition on and off event numbers. They may be entered manually for all
drivers/vehicles or on a per-driver/vehicle basis by using what is specified in vehicle settings.
Results

The report shows each trip taken and summary information on the trips for each driver/vehicle.
The summary table shows the engine hours and mileage for each driver/vehicle according to the
period of the day they occurred in.
2.7.11 Fleet The Fleet report shows information about the time drivers/vehicles spent within geofences.
User Inputs
None
Results
The report shows the amount of time each driver/vehicle spent in each geofence and the mileage and
maximum/average speeds within geofences. It also shows driver info.
2.7.12 Fuel Ticket
The Fuel Ticket report allows the user to keep track of the cost of fuel - how much is being consumed,
what it is costing him/her, how it is being used, where is it being obtained, and who is using it. The Fuel
Ticket report is used in conjunction with the Fuel Receipt tool on the 'Maintenance' tab of the Settings
page. Fuel receipts are entered through this tool, and the data is processed and analyzed by the Fuel
Ticket report.
User Inputs
None
Results
The report shows each fuel receipt for each driver/vehicle. The summary table shows the total amount
and cost of fuel purchased and the total distance traveled for each driver/vehicle as well as the

vehicle/driver and the location of fillup. The chart shows the total amount of fuel purchased for each
driver/vehicle.
2.7.13 Fuel Usage
The Fuel Usage report uses user-entered information on fuel efficiency and fuel cost per fuel unit
to show the user the fuel usage and cost for all drivers/vehicles.
User Inputs
The user selects the fuel units and enters the price per fuel unit.
Results
The report shows the fuel efficiency, mileage, amount of fuel used, and cost on both a per-day
basis and overall for all drivers/vehicles.
2.7.14 Geofence
The Geofence report shows information relating to driver/vehicles' time spent within geofences.
User Inputs
The user must select which geofences to include in the report.
Results

The report shows detailed information about geofence visits for each driver/vehicle, including arrival,
departure, duration, and mileage within geofence. In addition, the user can click the 'Details' link to see
each update reported from within the geofence. The summary table shows the total time spent in each
geofence for each driver/vehicle.
2.7.15 Idle Time
The Idle Time report allows you to see all idle time instances for each driver/vehicle.
User Inputs
The user can choose to ignore any idle time instances of less than a specified amount of time. NOTE:
Ignition on/off events must be set in vehicle settings page to calculate idle time.
Results
The report shows each instance of idle time that meets the specified conditions. The summary table
shows the number of idle time instances as well as the total time spent idling. The map shows the last
update within the timeframe, and the chart shows the total time spent idling per driver/vehicle.
2.7.16 Last Position
The Last Position report shows the last position for each of your drivers/vehicles.
User Inputs
None
Results

The report simply shows the last position received for each driver/vehicle. If a driver/vehicle has
not reported a position, this will be noted in the table.
2.7.17 Last Update
The Last Update report shows the last update for each of your vehicles.
User Inputs
None
Results
The report simply shows the last update received for each vehicle. If a vehicle has not reported an
update, this will be noted in the table.
2.7.18 Location
The Location report shows detailed info about driver/vehicles' visits to locations.
User Inputs
The user may elect to only consider select locations or to only show stops. The user may also combine all
drivers/vehicles. In addition, the user may elect to show locations NOT visited in the global summary
table of the report.

Results
The report shows the arrival, departure, duration, and address for each location visit. Also, the 'Details'
link may be clicked to see all updates from the driver/vehicle while it was at the location. The global
summary table at the top of the report shows either the total numbers of times drivers/vehicles visited
the locations or the locations that were not visited, depending on the option selected when the report
was run/scheduled.
2.7.19 Maintenance
The Maintenance report shows maintenance interval info for each vehicle. It is used in conjunction
with the 'Maintenance' tab on the Settings page to keep track of periodic maintenance for your
vehicles.
User Inputs
None
Results
The report shows how near each vehicle is to completing a maintenance interval.
2.7.20 Message
The Messages report shows all messages received for each driver/vehicle within the time range
supplied.

User Inputs
None
Results
The report shows each update that contains a message for each driver/vehicle. The summary table
shows the numbers of messages per driver/vehicle, the map shows the locations where messages
were sent from, and the chart shows the number of messages per driver/vehicle.
2.7.21 Regulatory Forms
The Regulatory Forms report automatically completes regulatory forms, using
vehicle data.
User Inputs
The user selects which form to complete.
Results
The report returns the completed regulatory form.

2.7.22 Shift
The Shift report shows information for each driver/vehicle's 'shifts'.
User Inputs
None. NOTE: Ignition on/off events must be set in vehicle settings page.
Results
The report defines shifts as the time between the first ignition on event and the last ignition off
event for each day. It shows details for each shift, including time, total idle time, maximum speed,
number of trips, and total trip time. The summary table shows total shift time per driver/vehicle.
The map shows the last updates within the time range for the drivers/vehicles.
2.7.23 Speed
The Speed report allows you to monitor the speeding behavior of your drivers/vehicles, with respect to
either a user-defined absolute speed limit or the posted speed limit.
User Inputs
The user selects whether to use an absolute speed limit or the posted speed limit. If absolute, the user
inputs the speed limit. If the user chooses to use the posted speed limit, the user must input how far
over the posted speed limit is to be considered speeding.
Results
The speed report shows all speeding violations (according to the user's definition of speeding). The
summary table shows the number of speeding updates and the 'Over Speed Percentage' which is
derived from the number of speeding updates divided by the number of moving updates.
2.7.24 Stop
The Speed report allows you to monitor the speeding behavior of your drivers/vehicles, with respect to
either a user-defined absolute speed limit or the posted speed limit.
User Inputs
The user selects whether to use an absolute speed limit or the posted speed limit. If absolute, the user
inputs the speed limit. If the user chooses to use the posted speed limit, the user must input how far
over the posted speed limit is to be considered speeding.
Results
The speed report shows all speeding violations (according to the user's definition of speeding). The
summary table shows the number of speeding updates and the 'Over Speed Percentage' which is
derived from the number of speeding updates divided by the number of moving updates.
2.7.25 Summary
The Summary report provides you a high-level picture of each driver/vehicle's activity.
User Inputs
The user must enter an ignition on and off event number. Also, the user must enter a stop distance
and time. For example, if the user enters 300 feet for the distance and 60 seconds for the time,

then a stop will be defined as any instance when a vehicle does not move more than 300 feet in 60
seconds.
Results
The report shows information for each stop made by each driver/vehicle. The summary table
shows daily statistics for each driver/vehicle. The map shows the last update from each
driver/vehicle.
2.7.26 Timecard
The Timecard report provides a means to keep track of the hours your employees are working and
what they are doing when they are on the job. When an employee arrives at work, he/she sends
the event for clocking in; when the employee leaves, he/she clocks out by sending in the clock-out
event. You can even include events for lunch and breaks. In this way, the report is ideal for payroll
purposes or just to keep an eye on your employees.
User Inputs
The user must enter events for clocking in and out and has the option to also enter events for
break start/end and lunch start/end. In addition, the user can select whether or not he/she wants
to count breaks and/or lunch in the calculation of total time worked.
Results
The report shows the total number of hours per vehicle/driver as well as each relevant event that
was sent (clock-in/out, break start/end, lunch start/end).
2.7.27 Track
The Track report shows you the tracks of your drivers/vehicles on a map.
User Inputs
None
Results
The report simply shows your driver/vehicles' tracks on a map.
2.7.28 Trip
The Trip report provides statistics for trips taken by your drivers/vehicles. Trips are defined using
ignition on/off events or between geofences.
User Inputs
The user must choose the trip basis - ignition on/off events or geofences. If the user elects to
define trips as being between geofences, he/she must select which geofences to consider as trip
origins/destinations. NOTE: Ignition on/off events must be set in vehicle settings page to calculate
trips by ignition on/off events.
Results

The report shows statistics for each trip made by each driver/vehicle and total trip info for each
driver/vehicle. Additionally, the summary table shows total trip time for each driver/vehicle. The
map shows the track of each trip.
2.8 Settings
The Settings page enables you to configure your settings and manage your vehicles, locations,
assets, and drivers as needed. In addition, notifications and maintenance intervals allow you to stay
on top of what is happening with your vehicles at all times.

The Profile tab allows you to configure your account as you wish.
The Display tab allows you to choose which vehicle information to display and whether or not you
would like to be alerted when vehicle messages or notifications are received.
The Labels tab allows you to choose how to label events, inputs, and outputs received from
vehicles.
The Notifications tab allows you to schedule notifications by email or phone when a vehicle
satisfies the specified condition.
The Maintenance tab allows you to keep track of periodic maintenance requirements for your
vehicles.
The Vehicles and Locations tabs allow you to configure the settings for your vehicles and
locations, respectively.
The Assets tab allows you to manage your assets to keep track of expensive equipment.
The Drivers tab allows you to manage your drivers, so you always know who is responsible for
your vehicles.
2.8.1 Profile
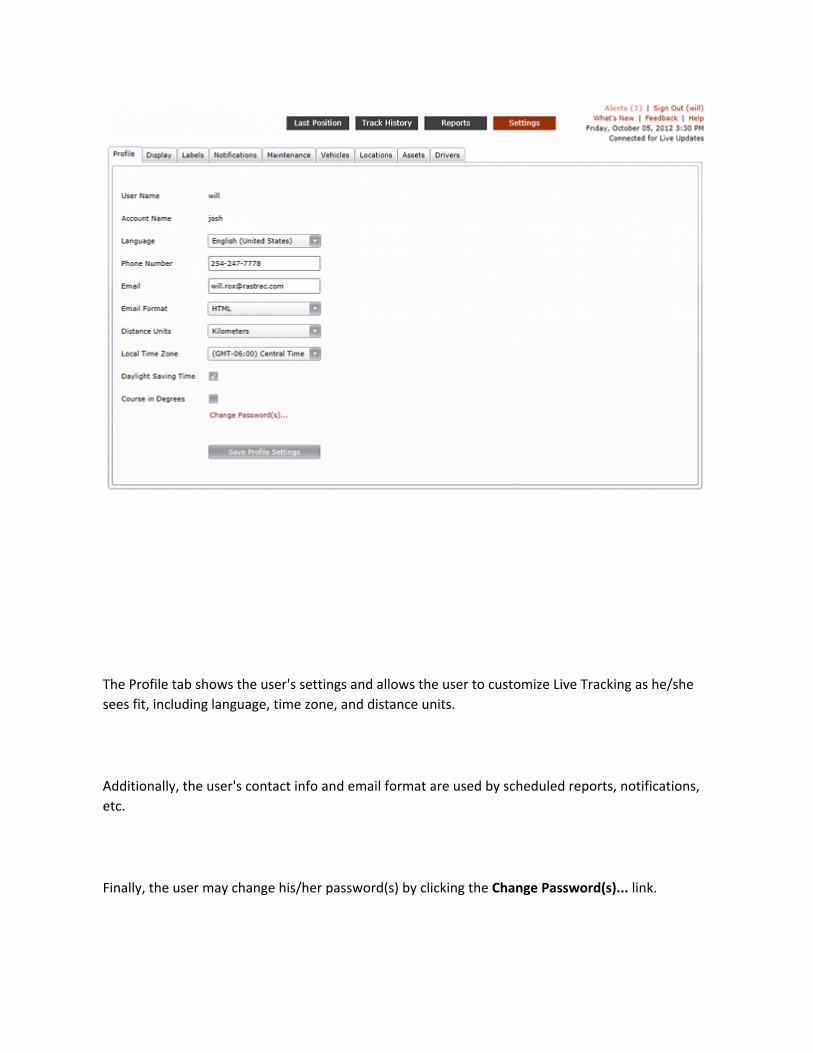
The Profile tab shows the user's settings and allows the user to customize Live Tracking as he/she
sees fit, including language, time zone, and distance units.
Additionally, the user's contact info and email format are used by scheduled reports, notifications,
etc.
Finally, the user may change his/her password(s) by clicking the Change Password(s)... link.

2.8.2 Display
The Display tab allows the user to set options for displaying data from vehicles.
The Column Display Settings are used to select which vehicle columns will appear in the in the
Last Update Table and Dashboard on the Last Position and Track History pages, respectively. Also,
many reports use the columns selected here to determine which vehicle columns will be shown in
their data tables.

The Available Columns listbox shows all of the columns that are not currently being displayed. The
Columns to Display listbox shows all of the columns that are being displayed. To show or hide
columns, click the Add > or < Remove buttons, respectively.
If you would like to change how a column is labeled, select the column in the Columns to Display
and click Edit Column Label . To remove a label, select the labeled column and click Clear Column
Label . Additionally, you can change the order in which columns are displayed throughout Live
Tracking. The columns are shown in the Columns to Display listbox in the order that they are
displayed. To change the position of a column, click Move Up Or Move Down until the column is at
the correct position in the list. Please note that to save the Column Display Settings, you must click
Save Columns.
The Alert Settings determine whether to show real-time alerts as messages or notifications are
received from vehicles.
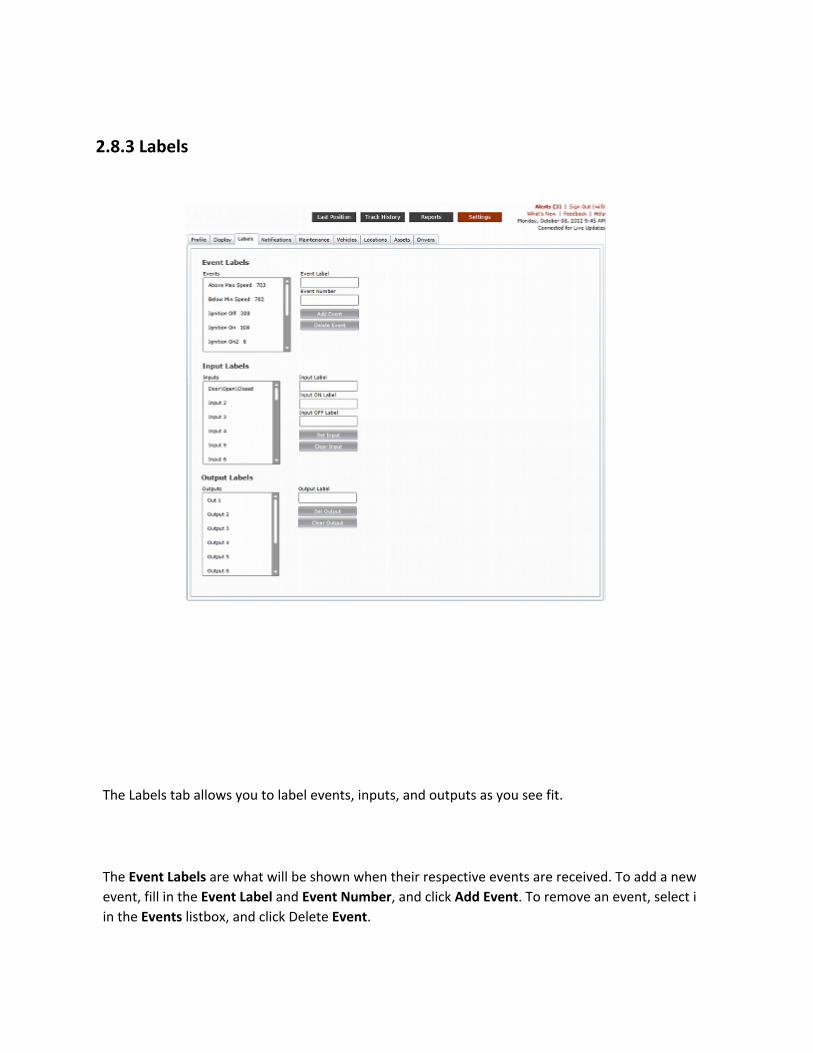
2.8.3 Labels
The Labels tab allows you to label events, inputs, and outputs as you see fit.
The Event Labels are what will be shown when their respective events are received. To add a new
event, fill in the Event Label and Event Number, and click Add Event. To remove an event, select it
in the Events listbox, and click Delete Event.

The Input Labels and Output Labels are what will be shown when their respective inputs/outputs
are received. For example, if Input 1 corresponds to a vehicle's ignition, you may choose to label
the input as 'Ignition', the Input ON Label as 'Ignition On', and the Ignition OFF Label as 'Ignition
Off'. You can save this setting by clicking Set Input. To reset this input to its default 'Input 1' label,
select it in the list and click Clear Input. Output Labels functions similarly to Input Labels.
2.8.4 Notifications

The Notifications tab allows you to schedule notifications by email or phone to send when one or
more of your vehicles trigger them. These notifications may be scheduled to be sent for many
reasons, including entering/exiting a geofence or triggering an event. A notification is created by
choosing the notification method (email or phone voice message) and typing what the message
should contain. The Insert Column Values... link allows you to insert column values into the
message. For example, if your notification is created to notify when a vehicle enters a geofence
called "COVE", you might choose the message to be '{{ALIAS}} has entered COVE', where
{{ALIAS}} is inserted by clicking Insert Column Values..., choosing 'Vehicle', and clicking 'Insert'. If a
vehicle named 'Vehicle1' enters the COVE geofence, the notification's message will be 'Vehicle1
has entered COVE'.
In addition to entering/exiting a geofence, a notification may be triggered by a vehicle sending a
certain event. This may be a pre-defined event or a new event, and the notification may be set to
be sent always or only if a vehicle is inside/outside a geofence when the event is sent.

When all of the notification parameters have been set, the user clicks Add to save it. The user's
existing notifications are listed at the bottom of the page.
2.8.5 Maintenance
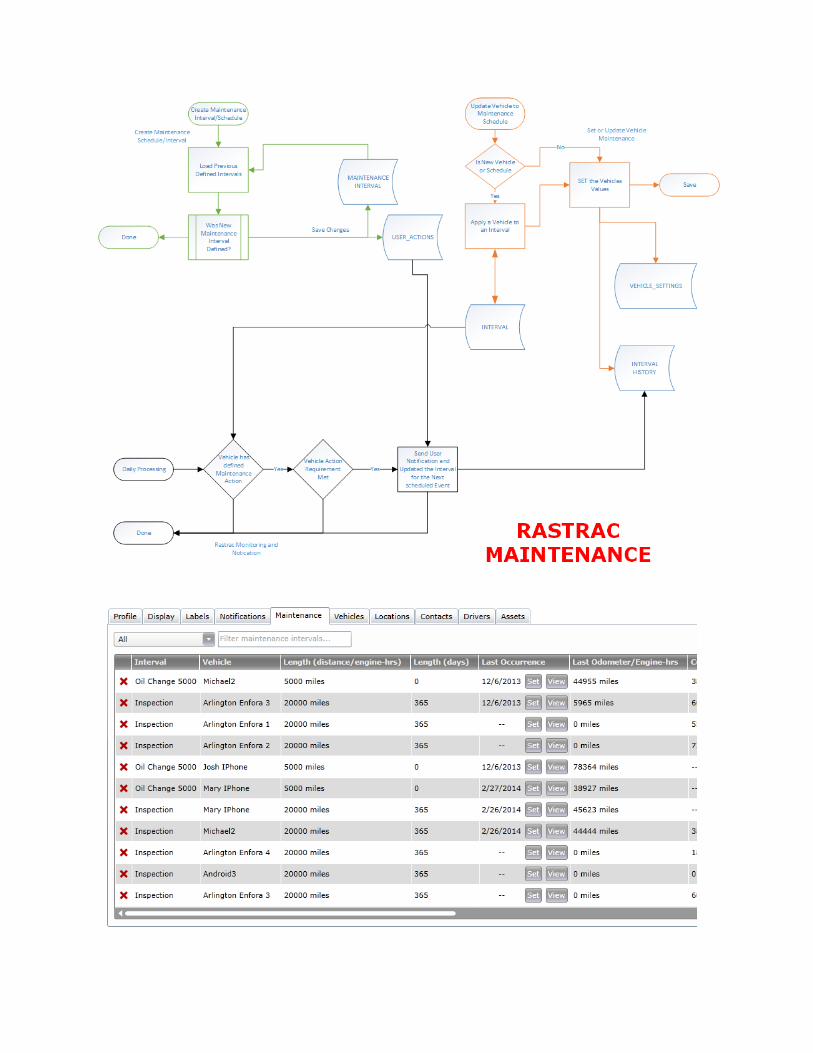

The Maintenance tab allows you to ensure your vehicles are well-maintained by keeping track of
required maintenance. This might include oil changes, tire rotations, etc. This is accomplished by
creating maintenance intervals and assigning them to the appropriate vehicles.
To create or assign a maintenance interval, click the '+' button, which opens the 'Assign/Add
Maintenance Interval' dialog. To create a new interval, click the 'Add/Edit interval...' link.

Here you can create a new interval or modify existing ones. To create a new interval, enter the
name of the interval and the length. Lengths can be expressed in distance, engine-hours, and/or
days.
2.8.6 Vehicles

The Vehicles tab serves as the vehicle settings page. For a given vehicle, you may set its
Nickname, the name that will appear for that vehicle throughout Live Tracking, the icon that
appears on the map for the vehicle, the Color of the vehicle's track, and the Group that the vehicle
belongs to.
Also, the Ignition On, Ignition Off, and Ignition Input may be set for a given vehicle, and you can
assign an Asset and/or Driver to the vehicle. In addition, the Ignore checkbox may be checked if
you do not wish to see updates or any other information for a vehicle. Please note that the Save
button must be clicked to save any changes to the vehicle settings.
Custom Icons
You can upload custom icons
2.8.7 Locations

The Locations tab functions and serves a purpose similar to the Vehicles tab. Here, the user may
set settings for each location, including its Nickname, the Icon that appears on the map for it, and
the Groups that it belongs to. If you do not wish to account for a location, check Ignore. Changes in
location settings must be saved by clicking Save.
2.8.8 Contacts

Contacts allow you to keep track of the contact information of your associates.
The user's contacts are used throughout Live Tracking to organize contact information and make
communicating with his/her associates easier. Examples include messaging, notifications, and
scheduled reports.
2.8.9 Drivers
Drivers allow you to know who is responsible for your vehicles at all times. Drivers may be
assigned to vehicles on the Vehicles tab or by right-clicking a vehicle in the vehicle list on the Last
Position or Track History page.
Available information on a Driver includes Name, Address, Phone Number, Email address, Driver
ID, etc. Additionally, you may add a picture of the driver.
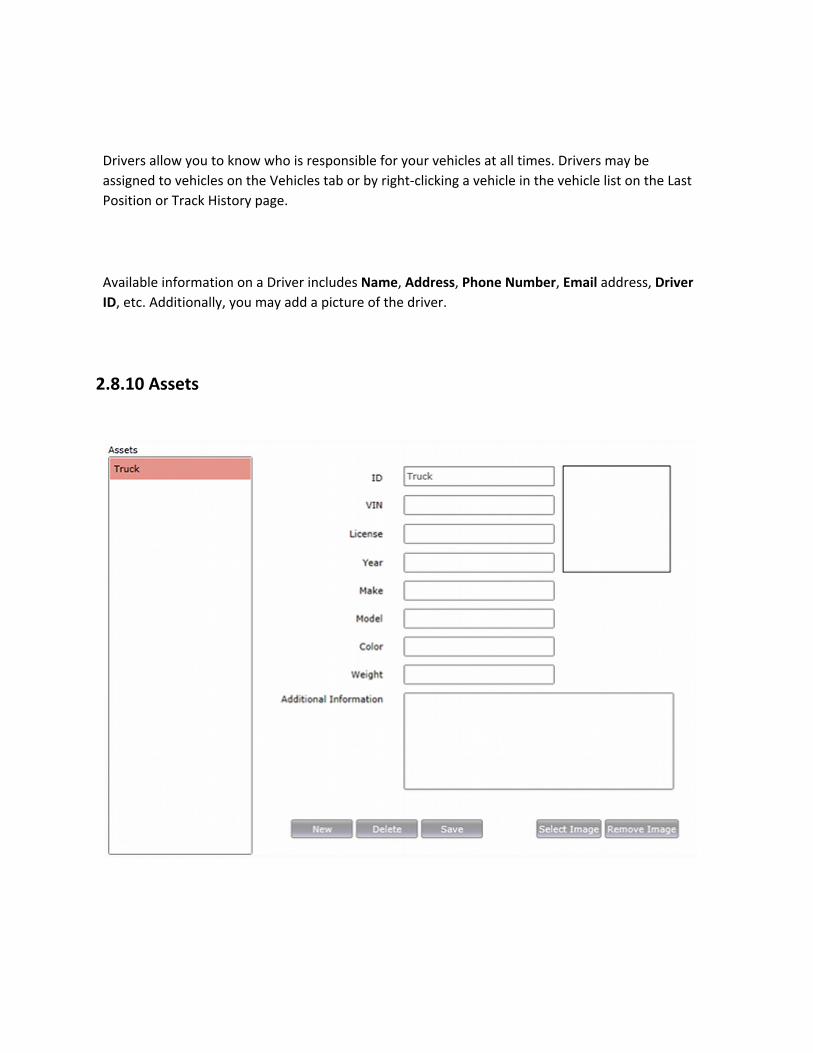
2.8.10 Assets
Assets represent physical equipment. They allow you to account for expensive machinery, such as
pickup trucks, tractors, etc. by assigning them to vehicles. In this way, you can know where your
equipment is and who is using it at all times. Assets are assigned in the vehicle settings, accessed
through the Vehicles page or by right-clicking the vehicle in the vehicle list on the Last Position or
Track History page.
The Assets tab allows the user to create, delete, and edit assets. Available fields include ID, VIN
number, License number, Make, Model, etc. You can even add a picture of the equipment by
clicking Select Image.
3 Mobile
3.1 Current position On your smartphone or tablet, open your web browser and go to www.rastrac.net. Enter your login and
password, and click on sign in.
Upon a successful login, you will be brought to the page seen below, which will display the current
location of all of your devices.

Selecting the Vehicles button, will allow you to select a group or a vehicle to display their updates and
track.

Choosing a vehicle will display the latest update received from the device, as well as have several other
options including getting the current location, following the vehicle, and getting the vehicle’s track.
3.2 Device You can access Rastrac mobile from any smartphone or tablet. It is compatible with both Apple and
Android products.
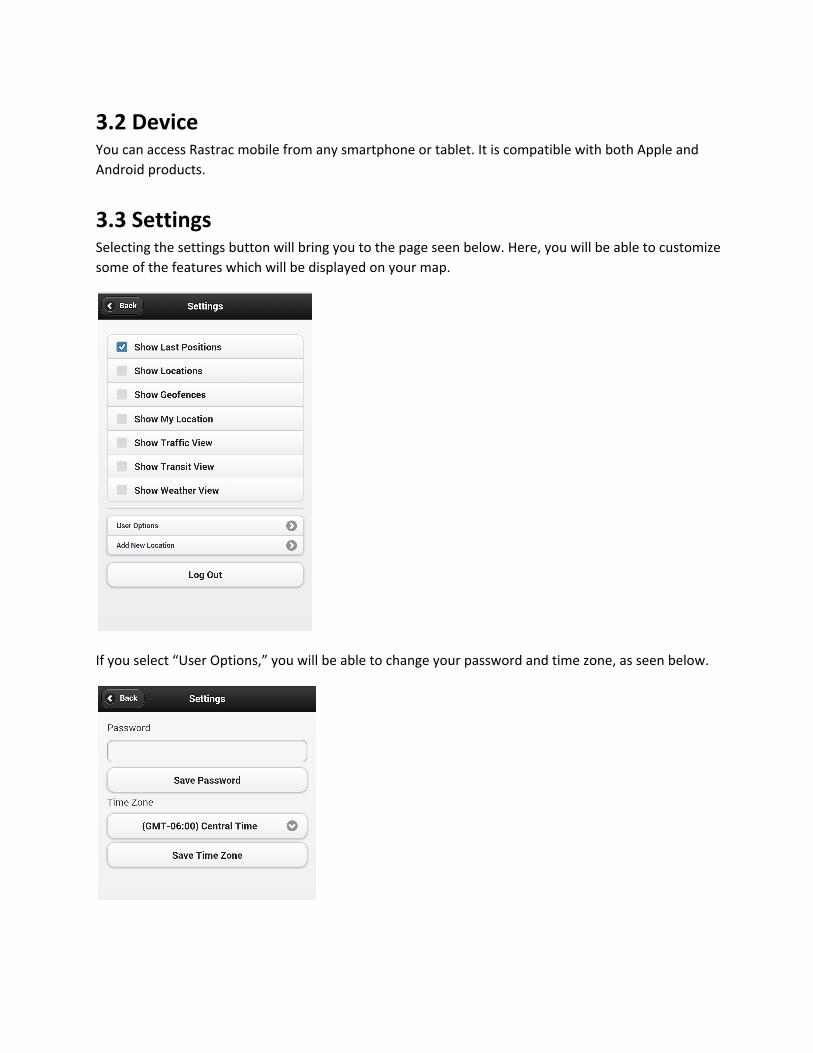
3.3 Settings Selecting the settings button will bring you to the page seen below. Here, you will be able to customize
some of the features which will be displayed on your map.
If you select “User Options,” you will be able to change your password and time zone, as seen below.