Embed Size (px)
Citation preview

Rat Oral Acute Toxicity Database and Evaluation of Variability
Agnes L. KarmausStaff Toxicologist, ILS in support of NICEATM
Predictive Models for Acute Oral Systemic Toxicity WorkshopApril 11, 2018
Disclaimer: ILS staff provide technical support for NICEATM,but do not represent NIEHS, NTP, or the official positions of any federal agency.

OBJECTIVE
Develop a large inventory of acute oral toxicity data to facilitate an international collaboration for predictive modeling
1. Establish a dataset of rate acute oral toxicity study LD50 data
2. Characterize the dataset to identify considerations for modeling
3. Evaluate variability of acute oral toxicity LD50 data and identify sources of this variability
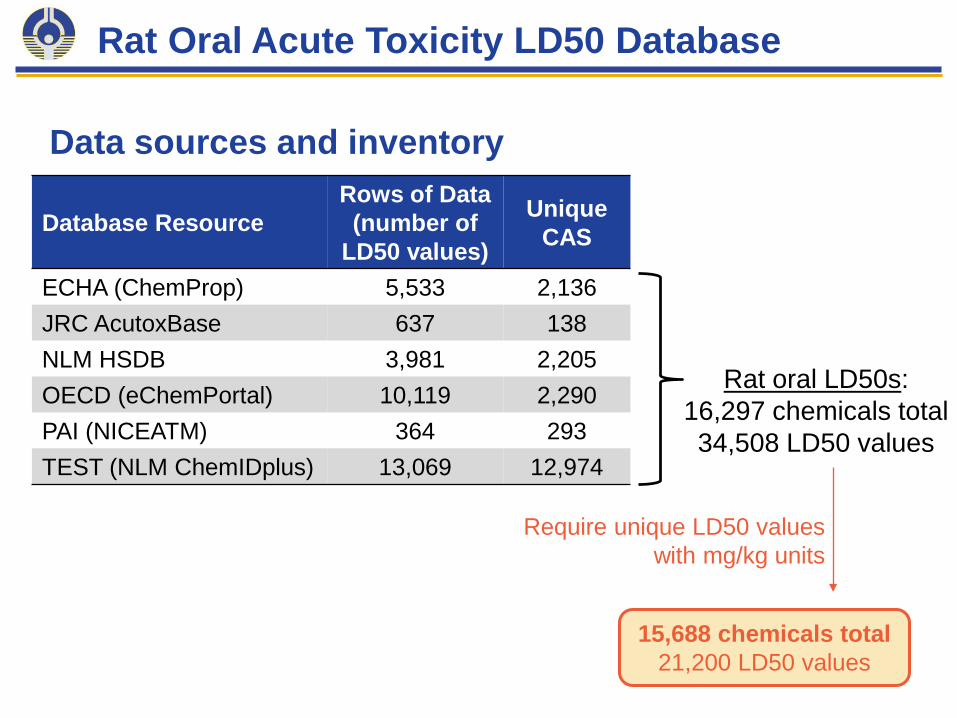
Rat Oral Acute Toxicity LD50 Database
Data sources and inventory
Database ResourceRows of Data (number of
LD50 values)
Unique CAS
ECHA (ChemProp) 5,533 2,136JRC AcutoxBase 637 138NLM HSDB 3,981 2,205OECD (eChemPortal) 10,119 2,290PAI (NICEATM) 364 293TEST (NLM ChemIDplus) 13,069 12,974
Rat oral LD50s:16,297 chemicals total34,508 LD50 values
Require unique LD50 valueswith mg/kg units
15,688 chemicals total21,200 LD50 values

Rat Oral LD50 per Chemical Across Sources

Data Processing
• Identify unique LD50 values per chemical
– Remove values that may be replicated across sources
• Include limit test and point estimate LD50 values
• Identify representative LD50 values where necessary
• Evaluate variability and impacts on hazard categorization and modeling
• Quantify variability and estimate reproducibility of acute oral toxicity bioassay

Remove duplicate values
Evaluating the LD50 Inventory

Impact on Hazard Categorization

Example: EPA Classification
Impact on Hazard Categorization
LD50 typePoint estimateMax (LD50 < ##)Min (LD50 > ##)
EPA cat. 1
EPA cat. 2
EPA cat. 3
EPA cat. 4

Evaluating the LD50 Inventory
14,745 point estimate LD50 values
6,455 limit testLD50 values

EPA Hazard Categorization
Dataset Inventory
EPA Category LD50 Range # of chemicals*Category I ≤ 50 mg/kg 1,094Category II > 50 ≤ 500 mg/kg 3,037Category III > 500 ≤ 5000 mg/kg 7,492Category IV > 5000 mg/kg 3,418*Number of chemicals from entire dataset (15,688 chemicals)
2,349 chemicals have ≥2 LD50 values:Number of categories
Number of chemicals
1 1,949 (83%)2 391 (17%)3 9 (<1%)
Categories Number of chemicals
I & II 11I & III 1I & IV 2II & III 146II & IV 1III & IV 230
I & II & III 3II & III & IV 6

GHS Hazard Categorization
Dataset Inventory
GHS Category LD50 Range # of chemicals*Category 1 ≤ 5 mg/kg 228Category 2 > 5 ≤ 50 mg/kg 869Category 3 > 50 ≤ 300 mg/kg 1,831Category 4 > 300 ≤ 2000 mg/kg 4,725Category 5 > 2000 mg/kg 7,158*Number of chemicals from entire dataset (15,688 chemicals)
2,349 chemicals have ≥2 LD50 values:Number of categories
Number of chemicals
1 2180 (93%)2 160 (7%)3 8 (<1%)4 1 (<1%)
Categories Number of chemicals
1 & 2 11 & 3 21 & 4 91 & 5 722 & 3 33 & 4 104 & 5 63
1 & 4 & 5 53 & 4 & 5 3
1 & 3 & 4 & 5 1

• Standard deviations of the 2,349 chemicals with ≥2 LD50 values were plotted per hazard category,revealing no association between potency and variability
Variability vs. Hazard Categories

Breakdown from the 15,688 chemical inventory
Acute Oral LD50 Dataset Replicate Inventory
• 13,339 chemicals with one LD50 value• 2,349 chemicals with ≥2 LD50 values• 1,120 chemicals with ≥3 LD50 values• 609 chemicals with ≥4 LD50 values• 347 chemicals with ≥5 LD50 values
Orders of magnitude for LD50s
Number of chemicals
0 546 (49%)
1 519 (46%)
2 39 (3%)
3 8 (0.7%)
4 8 (0.7%)

Evaluating “Performance” of the Animal Assay
1. Utilize subset of chemicals with ≥3 values (1,120 of 15,688)– These 1,120 chemicals represent 5,270 LD50 values
2. Identify a representative LD50 value for every chemical– Member of ATWG and ICCVAM agency feedback was solicited– Calculated as the median of the lower quantile– Derive hazard categories associated with the representative LD50
value
3. Using the representative LD50 value as “truth”, assess every one of the experimental values with summary statistics:
– Accuracy with 95% confidence interval– Sensitivity, specificity, and balanced accuracy

Representative LD50 vs. Experimental Values
Evaluating “Performance” of the Animal Assay
RMSE of 0.42 was also computed for this dataset based on the LD50 values
R2: 0.8024
Representative LD50 (log10(mg/kg))
Exp
erim
enta
l LD
50 (l
og10
(mg/
kg))

EPA Hazard Categorization
Evaluating “Performance” of the Animal Assay
• The accuracy of the experimental data when compared to the representative LD50-derived hazard category was 78%
95% confidence interval: 76% – 79%
Representative EPA Hazard CategoryExperimental 1 2 3 4
1 384 27 4 22 177 1006 59 43 42 459 2180 1004 10 23 253 433

GHS Hazard Categorization
Evaluating “Performance” of the Animal Assay
• The accuracy of the experimental data when compared to the representative LD50-derived hazard category was 74%
95% confidence interval: 73% – 75%
Representative GHS Hazard CategoryExperimental 1 2 3 4 5
1 75 3 0 2 02 59 247 25 2 43 2 152 598 30 84 0 46 311 1395 485 4 25 42 586 1561

By integrating replicate acute oral toxicity studies, representative LD50 values were derived and used as “truth” to assess the performance of the animal assay for identifying EPA and GHS hazard categories.
The accuracy for predicting EPA and GHS categories was 78% and 74%, respectively, and balanced accuracy ranged from 0.75-0.89 across the hazard categories.
Hazard Categorization “Performance” Summary
GHS 1 GHS 2 GHS 3 GHS 4 GHS 5Sensitivity 0.54 0.52 0.61 0.69 0.96Specificity 0.99 0.98 0.95 0.87 0.82Balanced Accuracy 0.77 0.75 0.78 0.78 0.89
EPA 1 EPA 2 EPA 3 EPA 4Sensitivity 0.63 0.66 0.87 0.80Specificity 0.99 0.93 0.77 0.94Balanced Accuracy 0.81 0.80 0.82 0.87

“Non-Toxic” and “Very Toxic” Endpoints
Additional “Performance” Evaluation
• Other endpoints of interest to ICCVAM agencies:– non-toxic (≤50 mg/kg)– very toxic (≥2000 mg/kg)
• The animal experimental data, and representative values were also used to evaluate performance for these endpoints:
RepresentativeExperimental Non-toxic false
false 2953 60Non-toxic 658 1561
RepresentativeExperimental Very toxic false
false 4624 229Very toxic 33 384
Non-toxic Endpoint PerformanceAccuracy 86%
95% Confidence Interval: 85.3% - 87.2%Sensitivity 96%, Specificity 82%
Balanced Accuracy 89%
Very Toxic Endpoint PerformanceAccuracy 95%
95% Confidence Interval: 94.4% - 95.6%Sensitivity 63%, Specificity 99%
Balanced Accuracy 81%

Hazard Categorization & “Performance” Evaluation
Summary
LD50 variability can result in implications for Hazard Categorization
Follow-up question:What are the sources of the variability?

Evaluation of Variability
• Standard deviation does not increase as a function of how many LD50 values there are per chemical
Standard deviations computed for 1,120 chemicalswith ≥3 LD50 values (5,270 LD50 values)

Identifying “Extreme” Values
Evaluation of Variability
• Tukey Fences (>1.5x interquartile range) applied to identify “extreme” values for all chemicals with ≥3 LD50 values (1,120 chemicals)
• 253 chemicals (23% of the 1,120 chemicals in the analysis) had at least one “extreme” value.
• 292 values were identified

Impact of “Extreme” Values on Standard Deviation
Evaluation of Variability
• Standard deviation does not increase as a function of how many LD50 values there are per chemical

Association with Chemical Use
Evaluation of Variability
• CPCat includes 6,127 chemicals from the oral acute dataset• 1,108 of the 1,120 chemicals with ≥3 LD50 values had use
information– There were 181 unique use terms associated with these chemicals– Chemicals were associated with anywhere from 1 to 737 use terms
• 1,815 chemicals had only one use term• 1,115 chemicals had >10 use terms
Four use terms with more than 500 chemicals associated:• Manufacturing• Consumer use• Pesticide• Industrial manufacturing

Variability per Use Term
Evaluation of Variability
• 155 use terms had at least three chemicals for which standard deviation was available
• There was no significant enrichment of any use term being associated with higher variability
• Use terms with highest mean standard deviation:
• Antiwrinkle (N = 5; SD = 0.37)• Glass (N = 5; SD = 0.33)• Polymer (N = 5; SD = 0.31)• Power generation (N = 11; SD
= 0.31)• Antishell (N = 4; SD = 0.3)

Variability by ToxPrint Chemotype
Evaluation of Variability

Manual Curation from Primary Literature
Evaluation of Variability
• Some “extreme” values were evaluated manually by retrieving the primary literature source of the data.
• While most studies were guideline studies, some old sources had different sex and strain usage that may contribute to some variability.
• Study design differences may account for some of the variability.– To investigate this further, a more detailed data extraction
from primary literature would be required.

Evaluation of Sources of Variability
Summary
Neither study replication, LD50 potency, chemical use, nor structure were significantly
correlated with increased variability.
Variation in study design may underlie some, but not all, of the variability.
Final consideration:Can we determine a confidence range for
acute oral toxicity LD50 values?

Defining a Confidence Range
• Bootstrapping of the standard deviations identified a 95% confidence interval for acute oral toxicity LD50 values of to ±0.31 log10(mg/kg)
LD50
(log
10(m
g/kg
))

Summary
• A large database of acute oral systemic toxicity LD50 values was compiled from numerous resources
• Chemicals with multiple LD50 values were used to evaluate the performance of this in vivo assay as well as characterize variability– Highly variability results in multiple hazard categories per chemical– Accuracy of the in vivo assay for hazard categorization was 74-78%
• Sources of variability were investigated:– Number of experiments, potency, chemical use category, or
physchem properties do not correlate with increased variability– Some of the chemicals with variable data had slight variations in
study design
• The 95% confidence interval identified for Acute Oral Systemic Toxicity LD50 values was ±0.31 log10(mg/kg)

THANK YOU!
Acknowledgements
• ICCVAM Acute Toxicity Working Group
• EPA/NCCT– Grace Patlewicz– Jeremy Fitzpatrick
• ILS/NICEATM– Dave Allen– Shannon Bell– Kamel Mansouri– Patricia Ceger
• NTP/NICEATM– Nicole Kleinstreuer– Warren Casey
Feedback welcome:Agnes Karmaus ([email protected])