Embed Size (px)
Citation preview
RATE REQUEST Presentation to the Board of Trustees Doyle N. Beneby, President & CEO
July 31, 2013
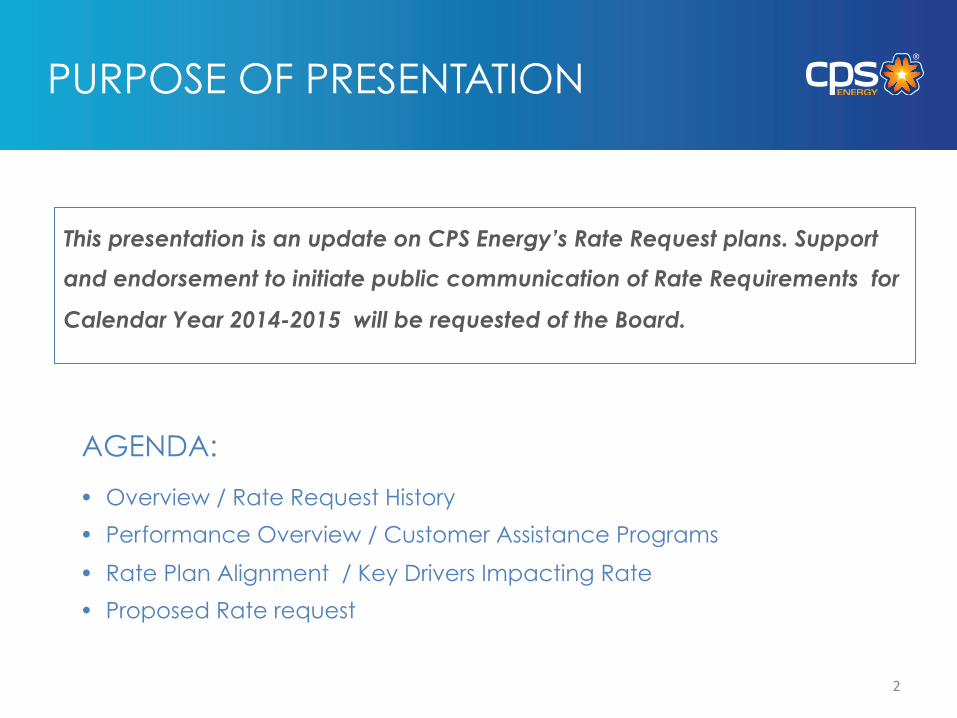
This presentation is an update on CPS Energy’s Rate Request plans. Support
and endorsement to initiate public communication of Rate Requirements for
Calendar Year 2014-2015 will be requested of the Board.
• Overview / Rate Request History
• Performance Overview / Customer Assistance Programs
• Rate Plan Alignment / Key Drivers Impacting Rate
• Proposed Rate request
AGENDA:
PURPOSE OF PRESENTATION
2
OVERVIEW
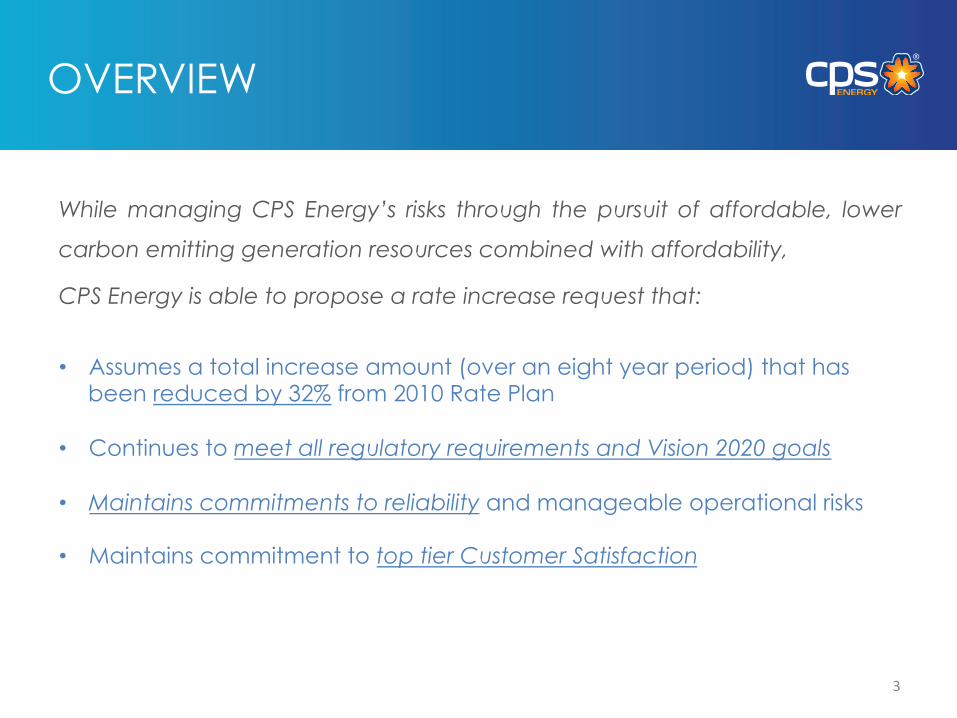
While managing CPS Energy’s risks through the pursuit of affordable, lower
carbon emitting generation resources combined with affordability,
CPS Energy is able to propose a rate increase request that:
• Assumes a total increase amount (over an eight year period) that has been reduced by 32% from 2010 Rate Plan
• Continues to meet all regulatory requirements and Vision 2020 goals
• Maintains commitments to reliability and manageable operational risks • Maintains commitment to top tier Customer Satisfaction
3
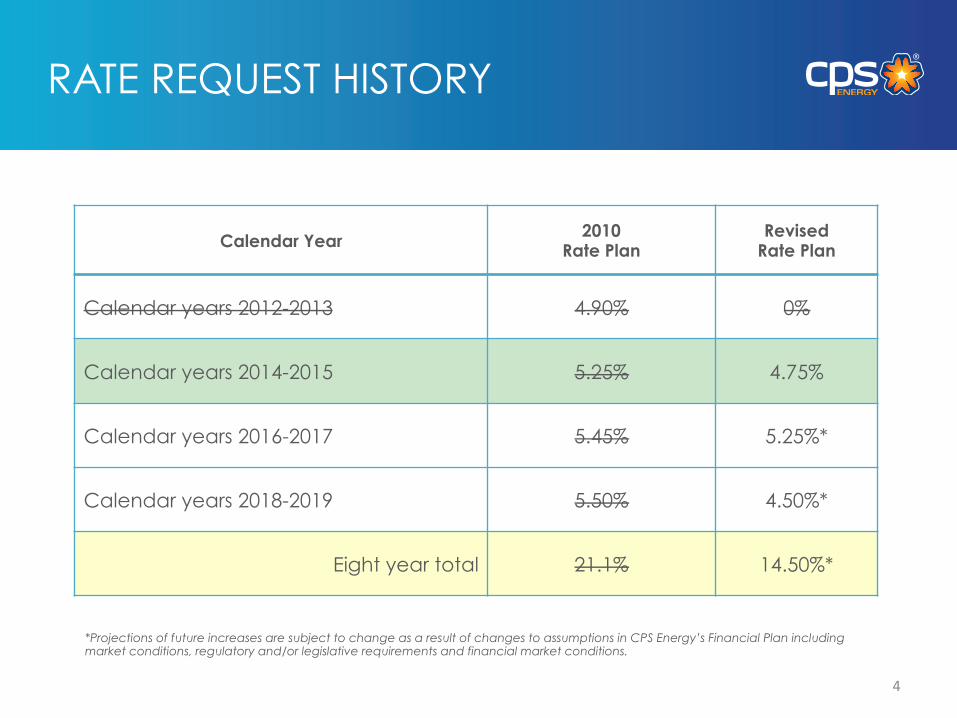
RATE REQUEST HISTORY
Calendar Year 2010 Rate Plan
Revised Rate Plan
Calendar years 2012-2013 4.90% 0%
Calendar years 2014-2015 5.25% 4.75%
Calendar years 2016-2017 5.45% 5.25%*
Calendar years 2018-2019 5.50% 4.50%*
Eight year total 21.1% 14.50%*
*Projections of future increases are subject to change as a result of changes to assumptions in CPS Energy’s Financial Plan including market conditions, regulatory and/or legislative requirements and financial market conditions.
4
PERFORMANCE OVERVIEW
• J.D. Power recognition as top large electric utility for Customer Satisfaction
• Improved reliability to top quartile of the industry
• Substantial emission reductions, on track to reduce emissions by an amount equivalent to 1 million cars off the road by the year 2020
• Recognized for having the premier credit rating in the industry by Bank of America Merrill Lynch
• Lowest rates among large/major Texas cities
• Over 250 SA jobs created; several million dollars committed to local education through New Energy Economy efforts
5
CUSTOMER ASSISTANCE PROGRAMS
• 10 active support programs for CPS Energy customers
• Expanding Affordability Discount program to assist 45,000 electric and 35,000 gas customers (increase of 5,000 electric and 5,000 gas customers in 2013), $8.55 and $3.75 monthly discount respectively
• Over 250,000 customers received a form of assistance from CPS Energy in FY 2013
• Approximately $5.9 Million in financial assistance was provided in FY 2013
6
RATE PLAN ALIGNMENT
• Reflects plan to protect CPS Energy customers by actively managing risk through generation diversification
• Supports the objectives of CPS Energy Vision 2020 and SA 2020
o Leveraging Clean Energy Development & Energy Efficiency Initiatives to Create Economic Opportunity in San Antonio
• Absorbs the impact of Government Accounting Standards Board
(GASB) financial regulations
7
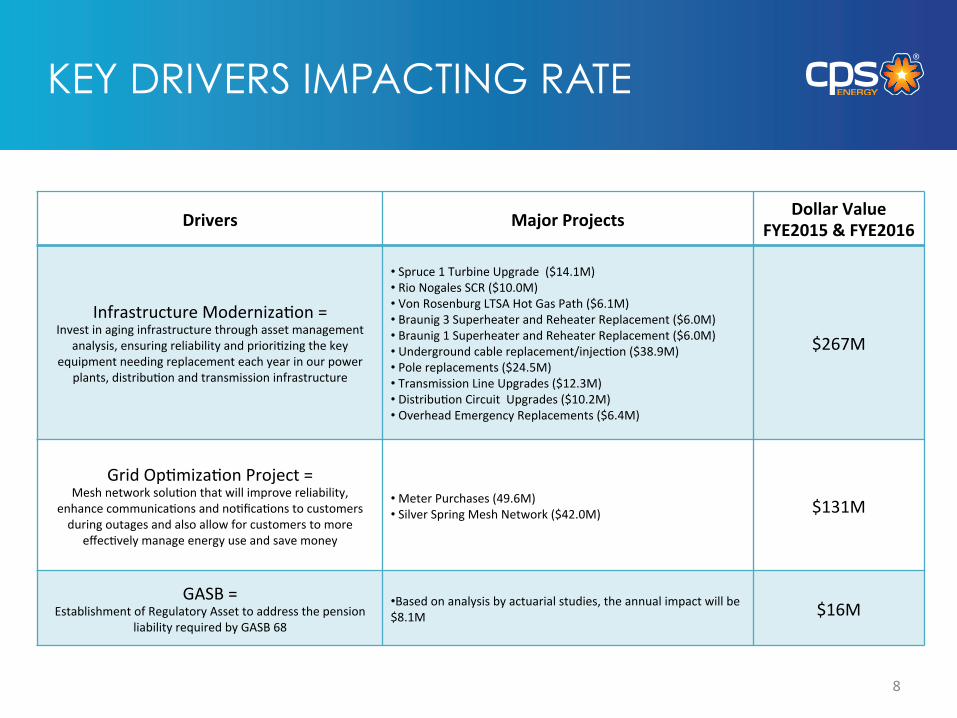
KEY DRIVERS IMPACTING RATE
Drivers Major Projects Dollar Value FYE2015 & FYE2016
Infrastructure Moderniza7on = Invest in aging infrastructure through asset management
analysis, ensuring reliability and priori7zing the key equipment needing replacement each year in our power
plants, distribu7on and transmission infrastructure
• Spruce 1 Turbine Upgrade ($14.1M) • Rio Nogales SCR ($10.0M) • Von Rosenburg LTSA Hot Gas Path ($6.1M) • Braunig 3 Superheater and Reheater Replacement ($6.0M) • Braunig 1 Superheater and Reheater Replacement ($6.0M) • Underground cable replacement/injec7on ($38.9M) • Pole replacements ($24.5M) • Transmission Line Upgrades ($12.3M) • Distribu7on Circuit Upgrades ($10.2M) • Overhead Emergency Replacements ($6.4M)
$267M
Grid Op7miza7on Project = Mesh network solu7on that will improve reliability,
enhance communica7ons and no7fica7ons to customers during outages and also allow for customers to more
effec7vely manage energy use and save money
• Meter Purchases (49.6M) • Silver Spring Mesh Network ($42.0M) $131M
GASB = Establishment of Regulatory Asset to address the pension
liability required by GASB 68
• Based on analysis by actuarial studies, the annual impact will be $8.1M $16M
8
RATE REQUEST / BILL IMPACT
• Management analysis indicates a need for a rate case with a February 1, 2014 effective date in the amount of 4.75%, comprised of:
o Base Rate Adjustment 4.19% o GASB Recognition 0.56%
• Monthly Bill Impact of $5.19 for the Average Residential
Combined Bill o Electric Monthly Bill Impact = $3.98 o Gas Monthly Bill Impact = $1.21
9
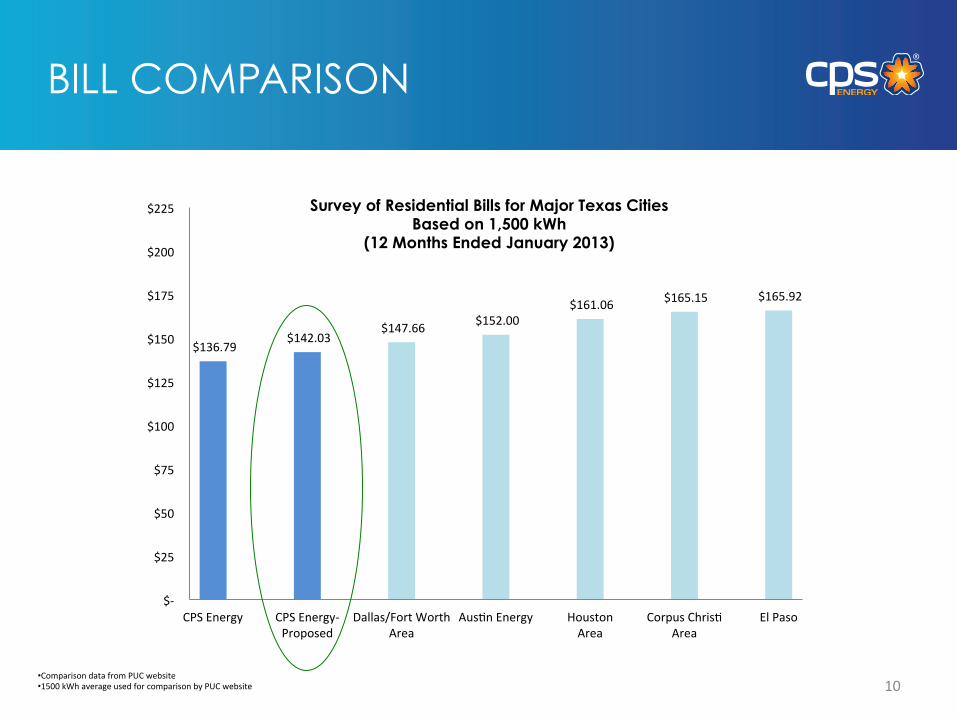
BILL COMPARISON
$136.79 $142.03
$147.66 $152.00 $161.06 $165.15 $165.92
$-‐
$25
$50
$75
$100
$125
$150
$175
$200
$225
CPS Energy CPS Energy-‐ Proposed
Dallas/Fort Worth Area
Aus7n Energy Houston Area
Corpus Chris7 Area
El Paso
• Comparison data from PUC website • 1500 kWh average used for comparison by PUC website 10
Survey of Residential Bills for Major Texas Cities Based on 1,500 kWh
(12 Months Ended January 2013)
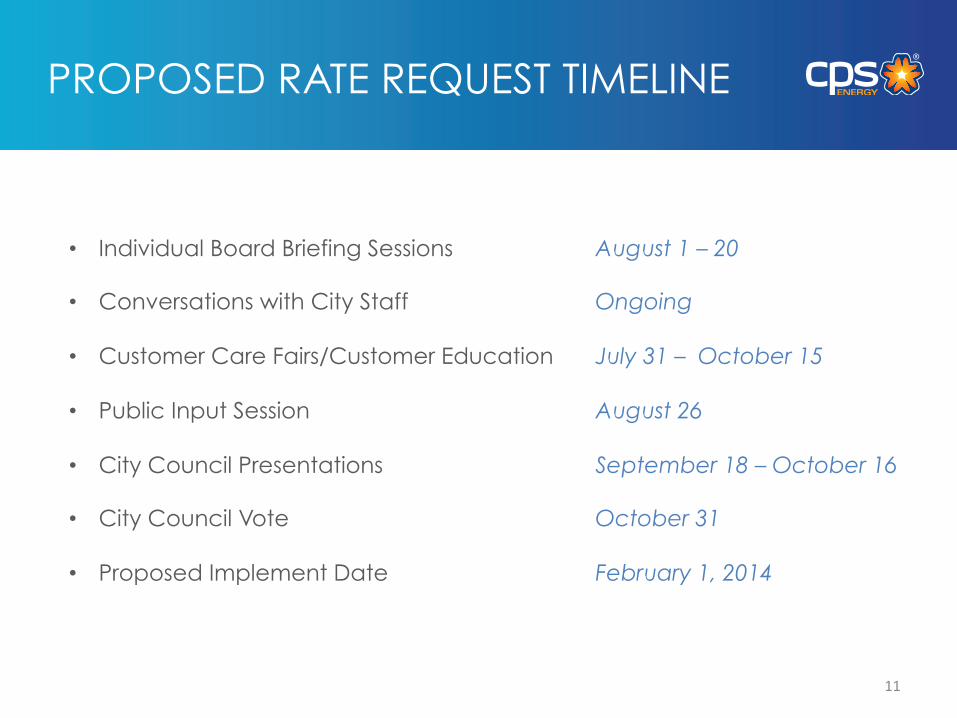
PROPOSED RATE REQUEST TIMELINE
• Individual Board Briefing Sessions August 1 – 20 • Conversations with City Staff Ongoing • Customer Care Fairs/Customer Education July 31 – October 15 • Public Input Session August 26 • City Council Presentations September 18 – October 16 • City Council Vote October 31 • Proposed Implement Date February 1, 2014
11
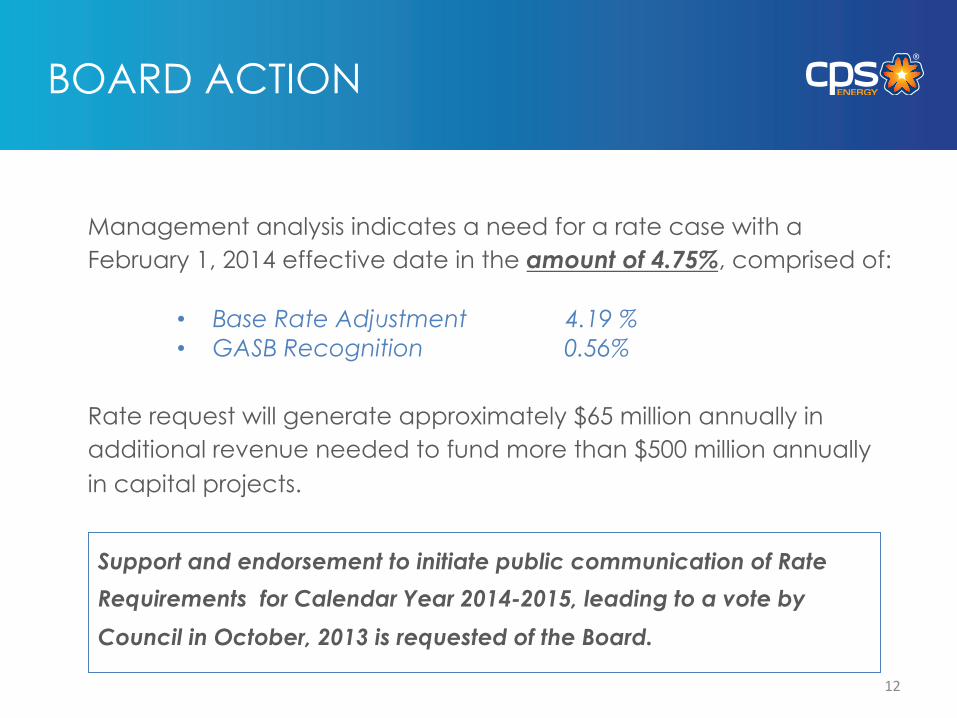
BOARD ACTION
Management analysis indicates a need for a rate case with a February 1, 2014 effective date in the amount of 4.75%, comprised of:
• Base Rate Adjustment 4.19 % • GASB Recognition 0.56%
Support and endorsement to initiate public communication of Rate
Requirements for Calendar Year 2014-2015, leading to a vote by
Council in October, 2013 is requested of the Board.
12
Rate request will generate approximately $65 million annually in additional revenue needed to fund more than $500 million annually in capital projects.

13
SUPPORTING SLIDES
14
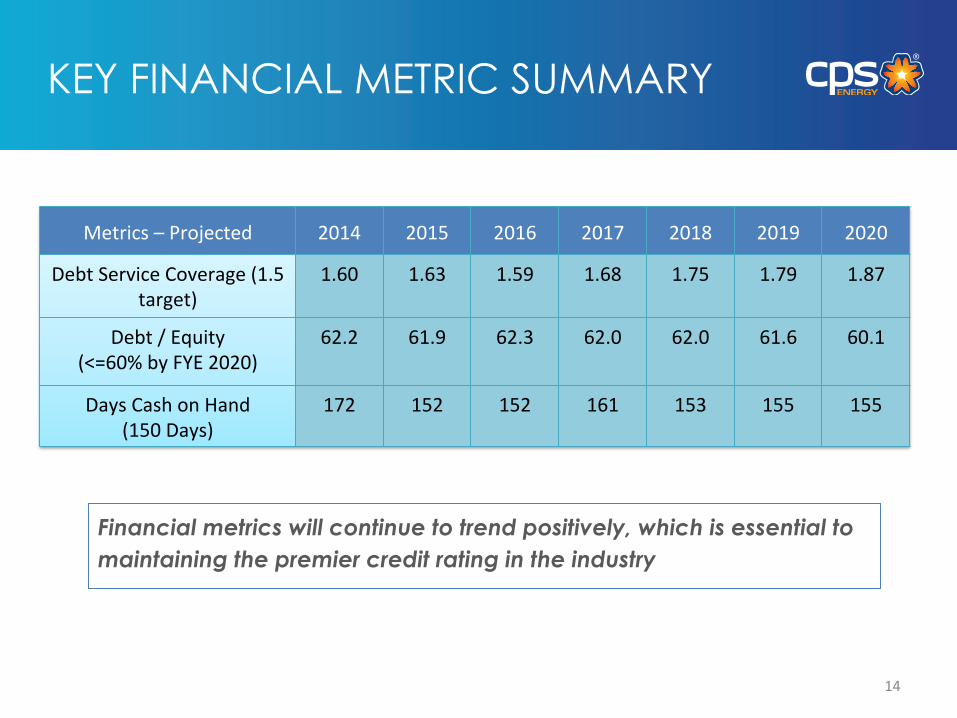
KEY FINANCIAL METRIC SUMMARY
Metrics – Projected 2014 2015 2016 2017 2018 2019 2020
Debt Service Coverage (1.5 target)
1.60 1.63 1.59 1.68 1.75 1.79 1.87
Debt / Equity (<=60% by FYE 2020)
62.2 61.9 62.3 62.0 62.0 61.6 60.1
Days Cash on Hand (150 Days)
172 152 152 161 153 155 155
Financial metrics will continue to trend positively, which is essential to maintaining the premier credit rating in the industry
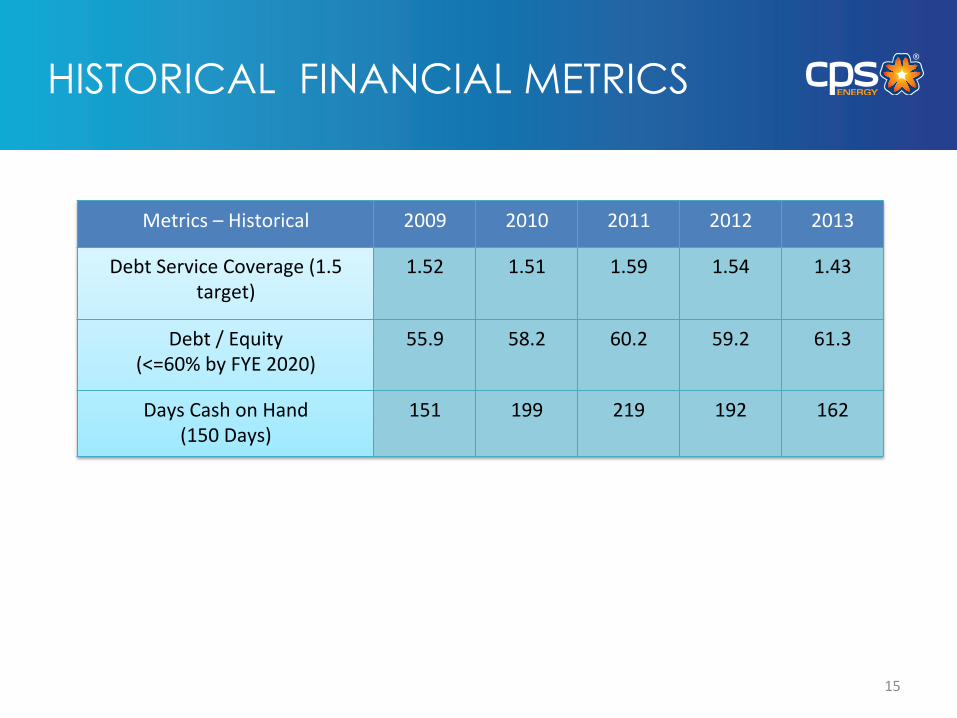
Historical Financial Metrics
Metrics – Historical 2009 2010 2011 2012 2013
Debt Service Coverage (1.5 target)
1.52 1.51 1.59 1.54 1.43
Debt / Equity (<=60% by FYE 2020)
55.9 58.2 60.2 59.2 61.3
Days Cash on Hand (150 Days)
151 199 219 192 162
15
HISTORICAL FINANCIAL METRICS