Embed Size (px)
Citation preview

Rate Case Studies
Table of ContentsIntroduction . . . . . . . . . . . . . . . . . . . . . . . . . . . . . . . . . . . 3
Bandera Electric Cooperative . . . . . . . . . . . . . . . . . . . . 5
Cobb EMC Electric Cooperative . . . . . . . . . . . . . . . . . 10
Hoosier Energy Rural Electric Cooperative . . . . . . . 18
Mid-Carolina Electric Cooperative . . . . . . . . . . . . . . . 24
St . Croix Electric Cooperative . . . . . . . . . . . . . . . . . .30
Sioux Valley Energy Electric Cooperative . . . . . . . . 37
Washington Electric Cooperative . . . . . . . . . . . . . . . 43

Rate Case Study ▪ 3
IntroductionElectric cooperatives, and the electric utility industry in general, are facing potentially fundamental changes as a result of rapidly evolving technologies and policy initiatives. Whether spurred by changing kilowatt-hour consumption, consumer-member interest in solar or other distributed generation, growth in distributed energy resources, or state policy changes, these developments can have a significant impact on how cooperatives do business.
Taken together, the significant financial and strategic implications of these new realities are compelling many cooperatives to revisit traditional ratemaking models to ensure that rates allow co-ops to fairly recover their costs and margins while maintaining reliable, affordable, safe, and sustainable energy services.
The following seven case studies illustrate some of the innovative ways in which cooperatives are reassessing their rate structures to better fit the needs of their member-consumers. The profiles of the cooperatives run the gamut – from Vermont, to Texas, to South Dakota, to Georgia – and their individual approaches to designing their rate structures are equally diverse. One thing, however, unites them all: their commitment to empowering their member-consumers through a transparent and democratic process that meets local wants and needs through local control.

Rate Case Study Bandera Electric Cooperative

Rate Case Study • 5Bandera Electric Cooperative
Bandera Electric Cooperative: A Rate to Reflect the Wholesale MarketIn May of 2013, the newly hired CEO of Bandera Electric Cooperative (Bandera or Cooperative), William (Bill) Hetherington, had the opportunity to attend the company’s annual meeting before officially starting his tenure. As it would turn out, one of the topics of the meeting would occupy a great deal of Hetherington’s time for years to come. In an environment where growth in kilowatt-hour sales (kWh) was being outpaced approximately six fold by the growth in distributed energy resources (DER), Bandera was concerned about financial stability and cross subsidization. At the meeting, Bandera’s plan to update their rate structure to address these challenges faced headwinds:
“The board chairman began talking about the new rate design involving demand charges for the residential class,” explained Hetherington.1 “Questions arose, and the members had a hard time understanding the answers.”
The difficulty explaining the changes, however, was secondary in Hetherington’s mind to what he perceived as a fundamental mismatch of rate structure and cost causation. “The reality is we aren’t being charged for demand,” explained Hetherington. “In Texas, there is no demand component in the wholesale market.”
A month later, Hetherington convinced the board not to go forward with the new rate. Bandera knew the end result it wanted to achieve, but was not sure how to get there. What rate design could Bandera adopt that would be both fair to all members and help maintain financial stability?
Who is Bandera Electric Cooperative?
Bandera was first electrified 77 years ago. Its rugged and rocky service territory is located to the northwest of San Antonio, in the counties of Bandera, Bexar, Kendall, Kerr, Medina, Real, and Uvalde. Bandera’s 34,000 meters are 90 percent residential and are served by 4,500 miles of distribution lines and 103 miles of Transmission lines.
Bandera has a partial requirements agreement for its power supply with the Lower Colorado River Authority (LCRA) under a market-based, cost-plus model. The LCRA has been the primary wholesale provider of electricity in Central Texas since 1937. LCRA’s base load is composed of 50 percent coal-fired generation, 45 percent natural gas, and 5 percent renewable. Under the terms of its agreement, Bandera can purchase up to 35 percent of its power supply from other suppliers in short-term, fixed price contracts including solar, wind, and natural gas resources.
1 Phone interview between Power System Engineering, Inc., and Bandera CEO William Hetherington. April 12, 2016. All citations from Hetherington are from this interview, unless otherwise noted.
State: Texas
Membership: 34,000
Wholesale Supplier: LCRA
Transmission Market: ERCOT
Regulation: Uregulated except for transmission
BEC Key Facts

Rate Case Study • 6Bandera Electric Cooperative
Bandera is a part of the ERCOT footprint, which features a competitive wholesale market with no demand charge. Bandera is billed based on a time-of-use (TOU) wholesale rate which attempts to follow market energy prices. In order to receive the hourly meter data that is necessary for the TOU wholesale rate, Bandera employs Aclara automated metering infrastructure (AMI) across its entire system.
Like all cooperatives in Texas, Bandera distribution operations and rates are self-regulated; however, the transmission portion of its operations is regulated. The Cooperative’s transmission costs are itemized separately and priced per kilowatt (kW) based on Bandera’s contribution to ERCOT’s coincident peak.
What Prompted Reassessing the Rate Structure?
Hetherington had successfully argued against a demand charge based on three ideas. First, he believed that demand charges simply irritated members; second, with Bandera’s current meters, members couldn’t verify for themselves what their demand was; and third, Bandera didn’t incur a demand charge in its wholesale rates, so it would be difficult to justify making its members pay one. What he felt he could argue in favor of was a rate design that contained a higher level of transparency regarding wholesale power cost.
“There was a general misunderstanding of how we get billed. It took me the first year to establish trust,” said Hetherington. “[Members] thought it didn’t matter when they used energy because they were paying a flat rate. This isn’t true. We are charged on TOU rates. So I said, ‘we shouldn’t have flat residential rates. It’s not how we are being charged.’ We want to be able to tell customers they can save money by using less during the peak.”
For members to receive accurate price signals and truly trust that the rates they pay correspond to Bandera’s costs, Bandera was going to have to design a rate that provided members a level of detail that they had never had before.
The New Rate Structure: Decision Making to Position Bandera for the Future
In 2013 Bandera hired the consulting firm Guernsey to conduct a cost-of-service study.2 The results were appropriate from a traditional view point, but what Hetherington wanted was to capture the dynamic nature of the ERCOT wholesale market and translate it into a distribution rate design. With that goal in mind, Bandera and its newly hired internal rate expert began by dividing the fixed-charge component of the rate into two categories: an availability charge and a delivery/distribution charge.
Bandera’s fixed availability charge is composed of customer-related charges and was calculated at $25. The delivery/distribution charge, which was also designed to recuperate fixed costs, is based on usage. Although the amount may change for the final rollout of the rate, Bandera has been using a calculated amount of $.021358 per kWh for both its residential single-phase service and the voluntary TOU rate that currently serves as a trial run of the final rate. The following table summarizes the current residential single-phase rate:3
1Phone interview between Power System Engineering, Inc., and Bandera CEO William Hetherington. April 12, 2016. All citations from Hetherington are from this interview, unless otherwise noted.
2 For more information about Guernsey, visit www.guernsey.us. 3 Source: “Rates & Fees”, http://www.banderaelectric.com/residential-services/products-services/rates-fees/

Rate Case Study • 7Bandera Electric Cooperative
Charge Amount
Availability Charge $25 .00 per meter
Delivery/Distribution Charge $0 .021358 per kWh
Energy Charge $0 .067075 per kWh
Fuel Cost Adjustment Varies
BEC Residential Single-Phase Service (current rate)
The current TOU rate is summarized below (Note that the final rate will have a “shoulder” period in the calculation of the energy charge, as where the current rate has only two periods, “summer” and “non-summer”.):41
Bandera considered multiple options for the delivery/distribution charge. Although Bandera chose to use a flat rate for the voluntary program, the Cooperative considered breaking the delivery/distribution charge into on-peak and off-peak components and it may still adopt such a design in the final rate. The volumetric aspect of their design admittedly lacks the certainty of a fixed charge, but, in the end, it was the importance of providing transparency to the membership that took priority. “It is not optimal because we are still not recovering all of the distribution costs as a fixed fee,” explained Hetherington, “but [it] does allow customer control of electric costs by giving price signals on energy.”
The energy portion of the rate consists of an on-peak, off-peak charge to better convey the way ERCOT charges Bandera.
4 Ibid.
Charge Amount
Availability Charge $25 .00 per meter
Delivery/Distribution Charge $0 .021358 per kWhEnergy Charge, Summer (June-Sept) Economy (11:01 p .m . - 10 a .m .) $0 .04520Normal (10:01 a .m . - 2 p .m .; 6:01 p .m . - 11 p .m .) $0 .06420Peak (2:01 p .m . - 6 p .m .) $0 .10900
Non-Summer (Oct-May)
Economy (11:01 p .m . - 7 a .m .) $0 .04800Normal (7 a .m . to 5 p .m .; 7:01 p .m . to 11 p .m .) $0 .05920Peak (5:01 p .m . - 7 p .m .) $0 .07070
Fuel Cost Adjustment Varies
Time-Based Usage (voluntary trial-run rate)

Rate Case Study • 8Bandera Electric Cooperative
Although providing so much detail on a bill might at first appear overwhelming, Bandera believes that separating the costs will help eliminate any distortion of information from the energy charge so that members can be proactive in relation to their usage.
With the major elements of the design nearing completion, Bandera chose the official launch date of January 1, 2017—a date far enough in the future to accommodate a year-long implementation plan. During this time, Bandera will also review the rate design after conducting an in-house COS study to insure that the rate is still in line with power and operating costs.
Educating and Communicating with Member-Consumers
Conveying the elements of a new rate design is made all the more difficult by the fact that industry terminology is often foreign to the members. A rate may be competently designed, but if the members distrust it due to a lack of understanding of the purpose it serves, they may not engage with it at a level that maximizes its potential. Bandera understood this from the beginning and took the time that was needed to explain why proposed changes were important.
Bandera conducted numerous town-hall meetings and discussions to help members understand the planned changes. One of the techniques that Hetherington used to help members understand the wholesale rate was to show an ERCOT price graph. “They see that the price varies from two to 22 cents, and that it’s not fixed like they are billed,” Hetherington said. “They get it. You can’t educate enough.”
A lesson learned from the town-hall meetings is to concentrate on price and assure the members that the rate design is revenue neutral. To help with this aspect, highlighting the results of the voluntary TOU rate has been effective. Currently, five percent of the members are on the rate and save between five to ten percent per month. This real-world example has helped dispel the general perception that a new rate design entails an increase in rates.
Although Bandera has received overwhelmingly positive comments during the town-hall meetings, a potential problem is that the members who come to the meetings may be those who signed up for the voluntary TOU rate. A truly effective education of the membership should strive to provide clarity even to members who have shown little previous interest in the rate structure.
During conversations with members, it became clear that the concept of demand presented an obstacle: “People don’t understand demand, but they understand that on-peak is expensive,” explained Hetherington. “Our intent was to break the bill down to its components to help them understand what they are paying for and send them the right incentive.”
Hetherington admits that explaining the new rate to members will require effort. Bandera will resume monthly town-hall meetings leading up to the official launch date, and try to reach everyone either directly or through magazine articles or mail.
As the launch approaches, Bandera has also begun educating staff about the changes. “We started explaining this to our employees,” said Hetherington. “They are just as challenged in understanding the bills as anyone. When our employees get it, I know we’ve got it figured out. I need everyone, including our linemen, to understand it.”
The Days of One-Size-Fits-All Are Over
Hetherington believes that utility customers will no longer support the one-size-fits-all model of rate design. He recommends that co-ops assemble the resources they need to do scenario planning and

Rate Case Study • 9Bandera Electric Cooperative
assess how operational changes will affect different rate classes. “You need a dynamic rate making effort,” he said. “Rate design must be taken seriously to provide transparency and granularity.”
Although Bandera’s new rate has not yet officially gone into place, Hetherington already imagines changes the future may bring: “Eventually we would like to offer a variety of energy plans as retail choice increases in probability. Much like making selections on investments, the amount of risk is how we will package energy solutions, i.e., the no-risk option would have a flat kWh fee, the moderate-risk option would have TOU pricing with intermittent hedges, and the aggressive option would have real-time pricing.”
Hetherington believes that modern rates are generally more the result of following tradition than they are the result of innovation. As he sees it, rates are currently very much in tune to what kind of structure the utility exists in. A particular utility’s rates might look quite different if that utility suddenly found itself transported to a different state and regulatory environment. With an increasingly transient national population, how can consumers be expected to understand regional pricing differences in an undifferentiated commodity?
The type of transparency that Bandera is currently striving toward in its rates may help provide the answer to that question.
Key Takeaways
1. The decision whether or not to adopt a demand charge for the residential class should be informed by a cooperative’s wholesale power rate structure. Bandera opted not to adopt a demand charge because the Cooperative itself does not pay one.
2. Members are often unaware of how the cooperative is billed for wholesale power. Bandera’s members did not realize that the fixed kWh charge they paid did not correspond to how the Cooperative was billed for wholesale power. Explaining this helped members understand the fairness of the proposed changes.
3. For a TOU rate to be successful, education efforts must be made to explain to members what they are paying for and how the rate allows them to save money by making small changes in consumption.
To learn more about Bandera EC, contact William Hetherington, CEO, at [email protected] or visit Bandera’s website at www.banderaelectric.com.

Rate Case Study Cobb Electric Membership Corporation

Rate Case Study • 10Cobb Electric Membership Corporation
Cobb EMC: Rate Design to Adapt to Declining SalesIn 2014 Cobb Electric Membership Corporation’s (Cobb or Cooperative) commitment to reliability and high performance standards gained national and local attention. The Georgia-based cooperative received the National Rural Electric Cooperative Association’s (NRECA) first-ever Cooperative Spirit Award for its focus on increased transparency and accountability, stronger governance, and lower operating costs. Shortly thereafter, Cobb was named EMC of the Year by Georgia EMC statewide association for its support of and service to thousands of residents in five metro Atlanta counties. In the same year, Cobb was ranked the second most reliable among Georgia’s 41 cooperatives and the third most reliable among 25 co-ops in the nation with more than 100,000 members.1
At the same time, however, Cobb was experiencing a trend that that needed to be addressed: declining kilowatt hour (kWh) sales growth and even significant declines in annual sales in the wake of the Great Recession. For a co-op that had experienced rapid growth along with the Atlanta suburbs it serves, the potential erosion of financial stability caused by decreasing sales posed a significant challenge in that rates that had functioned well during the growth period now had the potential to negatively impact the utility’s financial position.
Who Is Cobb Electric Membership Corporation?
Cobb was formed in 1938 to serve 489 residential members and 14 business accounts. Today, Cobb provides electricity to over 180,000 residential and commercial members in the counties of Cobb, Bartow, Cherokee, Fulton, and Paulding, which are situated to the northwest of Atlanta. Cobb’s distribution system is composed of over 9,000 miles of line spreading out over 432 square miles. Cobb exhibits a summer peak, and, like all co-ops in Georgia, is not rate regulated. It is the second largest of Georgia’s EMCs by members and sales, and one of the largest in the nation.
Roughly 75 percent of Cobb’s power requirements are supplied by Oglethorpe Power, one of the nation’s largest supply cooperatives.2 Oglethorpe is owned by the 38 electric membership corporations that it serves. The remainder of Cobb’s power comes mostly from Southern Power, a wholesale generation subsidiary of Southern Company. Cobb is one of the largest purchasers of solar energy among cooperatives nationwide and is on track to become the largest.3
Because of its proximity to Atlanta, Cobb’s consumers tend to have higher incomes than found in many areas of Georgia.4 The average member is approximately 54 years old. Younger members are typically transient apartment dwellers. Cobb’s management stated that the demographics have not changed much over the years.
Cobb EMC Key Facts
State: Georgia
Membership: 180,000
Wholesale Supplier: Oglethorpe Power and Southern Power
Transmission Market: Jointly operated by Georgia Power Company, Oglethorpe Power Corporation, Municipal Electric Authority of Georgia, and the City of Dalton
Regulation: Unregulated
1 Cobb EMC 2015 Annual Report. P.2. Retrieved from: https://www.cobbemc.com/sites/cobbemc/files/Cobb%20EMC/Files/PDFs/Company%20Reports/2015AnnualReport.pdf2 For more information about Oglethorpe Power, visit www.opc.com.3 www.cobbemc.com/content/cobb-emc-signs-largest-solar-power-purchase-agreement-georgia-co-op-history

Rate Case Study • 11Cobb Electric Membership Corporation
As a result of Cobb’s focus on cost reduction and fiscal discipline, Cobb has been able to provide its members with some of the lowest electricity prices in the state. For the past several years, Cobb’s rates in both summer and winter have frequently ranked among the 10 lowest out of Georgia’s 94 electric utilities at various use levels.5
Cobb’s service territory features full advanced metering infrastructure (AMI), and its members can track their energy usage via SmartHub®, its self-service site that allows members to compare current and past energy usage, as well as monitor the effectiveness of energy-efficiency upgrades to the home.
What Prompted Reassessing the Rate Structure?
For Cobb, 2014 featured multiple awards based on performance, reliability, and public service; however, where Cobb was less likely to reach new heights was in kilowatt hours (kWh) sales.
From 2010 to 2014, Cobb experienced general increases in both the number of meters on its system and the total utility plant (i.e., buildings, equipment, infrastructure, etc.), as shown below (note that the drop in meters from 2013 to 2014 is due to the sale of Cobb’s southern district in south Georgia.):
4 Phone interview of April 11, 2016 between Power System Engineering, Inc., and Cobb EMC managers Chip Nelson, CEO; David Johnson, COO; and Kevan Espy, Vice President – Marketing & Corporate Communications. All citations from Nelson, Johnson and Espy come from this interview, unless otherwise noted.5 Georgia Public Service Commission. Residential Rate Surveys. Accessed on April 15, 2016. http://www.psc.state.ga.us/electric/surveys/residentialrs.asp
Cobb EMCNumber of Active Meters (M)
198
197
196
195
194
193
192
191
190
2010 2011 2012 2013 2104
191.7
193.1
194.9
197.6
194.6

Rate Case Study • 12Cobb Electric Membership Corporation
Over the same period, total operating revenue and kWh sales generally declined:
Cobb EMCTotal Utility Plant ($)(MM)
860
840
820
800
780
760
740
2010 2011 2012 2013 2014
778.9
815
838.3
814.3
843.9
Cobb EMCTotal Operating Revenue ($)(MM)
450
440
430
420
410
400
390
380
2010 2011 2012 2013 2014
433.3441.6
421.7
403.8
412.7

Rate Case Study • 13Cobb Electric Membership Corporation
Cobb’s Chief Operating Officer David Johnson attributes the multi-year declining trend in kWh sales to general energy efficiency measures, more efficient appliances, and more efficient lighting. The level of energy efficiency taking place in Cobb’s service territory is entirely attributable to Cobb’s customers. Johnson stated that distributed generation (DG) has not played a large role in this decline. “It hasn’t reached a significant level yet,” he said. “In Georgia, we don’t see what other states see. Out of about 180,000 members, we have roughly 60 DG installations right now.”
Declining to flat kWh sales growth combined with a trend of increasing fixed cost led the management at Cobb to take a hard look at their rate design with the aim of preventing further margin erosion that could negatively impact future performance.
The New Rate Structure: Decision-Making to Position Cobb for the Future
After in-house discussions and outside consultation with GDS Associates,6 the managers at Cobb realized that what they needed was a cost-of-service-based rate structure. Thanks to past experience, they also knew that if they could design a new rate that led to greater bill stability, their membership would likely approve of it. According to Johnson, “We created a structure in 1998 that gave each member a base charge that didn’t change. Then they paid per kWh, so bills didn’t fluctuate much between summer and winter. We knew members liked that.” Further reinforcement of a move toward a rate that provided bill stability came from the fact that the time-of-use (TOU) and critical-peak pricing (CPP) rates that Cobb was then offering had very few subscribers: fewer than 20 members had opted for the TOU rate, and no members had subscribed to the CPP rate. Cobb therefore knew that its members were not enthusiastic about rate designs that featured variability in the energy component.
With a general idea of where they wanted to end up, Cobb management was ready to begin weighing the possibilities. Their process involved a high level of collaboration within the organization that they would recommend to any utility undertaking such a task. As Johnson explained, “Co-ops should involve billing staff from the beginning. Involve the programmers or relevant staff early on. Ask: what can we do? How much data can we store? Through the process, say ‘here’s what we are thinking about—which one creates more difficulties for you?’ Don’t tell them what the final decision is without talking about it first to see if it’s possible.”
6 For more information on GDS Associates, visit www.gdsassociates.com.
Cobb EMCTotal Utility Plant ($)(MM)
4.2
4.1
4
3.9
3.8
3.7
2010 2011 2012 2013 2014
4.1
4
3.8 3.8 3.8

Rate Case Study • 14Cobb Electric Membership Corporation
In the same spirit of involvement, the managers at Cobb worked closely with their board of directors, keeping them updated and explaining the pros and cons of various rate designs. As it turned out, board members were hearing about similar cost-recovery issues at national events, so they were also being educated about the issue externally and were, therefore, attuned to the importance of the issue.
The first element of the new rate structure was decided upon quickly. Cobb calculated the consumer-related fixed cost to be $28 and therefore set the service charge at that amount. The question then became how to break out the other charges. For the first runs, they used a fully unbundled structure, breaking down all demand costs into demand charges and energy costs into energy charges. The results were not promising, as many members would have experienced major increases and some major decreases. Cobb also realized from those first attempts that the abrupt change in rates that was initially determined appropriate from a strict cost-of-service approach would have been too much too soon, and that communications and member education would be vital. They moved on, knowing, however, that the three basic elements of service charge, demand, and energy would remain.
Successive variations were not rushed. Cobb intended the process to move at a relaxed pace in order to take the time to keep stakeholders informed and on board. The entire process took approximately one year.
The final design features a $28 service charge, a peaking service charge of $5.55 per kWh/hour (more on this terminology later), and an energy charge of $0.066570 per kWh. The peaking service charge is based on a customer’s highest demand occurring during Peak Conservation hours, typically between the hours of 2pm to 7pm, excluding holidays. Cobb will notify customers of “peak-conservation days” so that they will have the opportunity to modify their consumption and lower their peaking charge. The new rate, named the “Smart Choice”, is summarized below7:
The Smart Choice will eventually replace Cobb’s “Standard Rate”, which is summarized below:8
7 Source: https://www.cobbemc.com/sites/cobbemc/files/Cobb%20EMC/Files/PDFs/Rates/2016/Res/RateSchedule-R-14-January-1-2016.pdf; Retrieved April 29, 2016.
Charge Amount
Service Charge $28.00 per month
Peaking Service Charge
First 3 kWh/hour Billed $0.00 per kWh/hour
Over 3 kWh/hour Billed $5.55 per kWh/hour
Energy Charge 0.06657 per kWh
The Smart Choice Rate (Applies to single-phase, residential dwellings)
Charge Amount
Service Charge $22.00 per month
EnergyWinter (Nov 1 - April 30): First 900 kWh $0.081615 per kWhOver 900 kWh $0.084218 per kWhSummer (May 1 - Oct 31) First 900 kWh $0.081615 per kWhOver 900 kWh $0.122408 per kWh
The Standard Rate (Applies to single-phase, residential dwellings)

Rate Case Study • 15Cobb Electric Membership Corporation
The new Smart Choice rate does not perfectly reflect how Cobb incurs costs in order to serve its members, but moves toward an unbundled design without making a drastic change. According to Johnson, “Our fixed cost from Oglethorpe and Southern Power are set on an annual basis. Once set, it’s set for the next year. If our cost is $11 to $12 per kW per month, and we pass along only $5.55, we still have about $6 being covered in the energy component. Energy is still inflated compared to what the actual cost of energy is.” However, a straight pass-through of the entire fixed cost simply would have caused too big of an impact. “I think at the end of the day, the final decision came down to this: this scenario likely had the most acceptable impact to the membership,” continued Johnson. “We were still able to unbundle, to keep it revenue neutral, and to limit the impact to the greatest number of members. We reasoned: this is probably not the final product. In the future, we might unbundle further. We’ll see.”
When Cobb tested the final design to confirm the revenue-neutral aspect, they found that 90 percent of all members would either see a reduction to their bills or no more than a $10 per month increase. They also found that 50 percent of the members would see a decrease if consumption stayed the same.
Educating and Communicating with Member-Consumers
With the final design now in place, Cobb shifted its efforts toward communications and member education. For the new rate to be truly effective, it would have to be both understandable and acceptable to the members.
To assess member reactions to the proposed rate, Cobb established three focus groups. “We wanted a good amount of variety in the focus groups in order to see it from all angles,” said Johnson. Cobb’s managers were present during the focus-group sessions, but they made sure that their presence would not influence the participants’ answers. Cobb’s managers observed the discussions from behind a darkened window and could relay questions to the moderator as subjects arose that needed further elaboration.
Several important lessons were learned as a result of using focus groups. First, there was a problem with the terminology used to describe the rate. Members did not understand or prefer the term “demand charge”. They could more easily understand energy, and they could understand kWh per hour. Cobb therefore decided to avoid using the term demand and decided to use the term “kWh per hour”. Additionally, they used this knowledge to refine their marketing material. Second, some members were not aware of what drove costs. Johnson explained, “I remember one individual having the perception that it would be unfair to penalize someone for something they did for just one hour. We have to educate members as to what drives cost.”
How Cobb Rolled Out the New Rate to Its Consumers
The Smart Choice rate applies to all new residential members as of January 1, 2016 and is optional for all other residential members beginning June 1, 2016. These customers will receive separate communication about their rate structure and will be informed of peak-conservation days. In addition to providing notification via their website and hotline, Cobb is currently looking into text messaging and social media.
8 Source: https://www.cobbemc.com/sites/cobbemc/files/Cobb%20EMC/Files/PDFs/Rates/2016/Res/RateSchedule-R-12(Rate10)Jan-1-2016.pdf; Retrieved April 29, 2016.

Rate Case Study • 16Cobb Electric Membership Corporation
Cobb intends to move all members to the new rate by 2019 and has developed a communication timeline in order to facilitate the transition. Current promotion of the rate is aimed at showing existing members the cost-saving benefits of curbing use during peak hours, which Cobb believes will lead to a high level of voluntary adoption. For those members who remain on the old rate, Cobb will increase its communication efforts in late 2017 and early 2018 to let them know that they will be moved to the new rate as of January 1, 2019. Although Cobb has this timeline in place, Espy added that “over the next year and a half we will be monitoring our members’ usage and coincident peak hours; our demand and energy rates; and conducting focus groups to see if we need to modify our rates and or shift our target date.”
To prepare employees for eventual questions about the rate, Cobb provided education to both its office and field staff. “We videoed David [David Johnson, COO] explaining Smart Choice to our customer service representatives. We posted the video to our intranet site so employees could understand. Chip [Chip Nelson, CEO] had meetings to let members know we were rolling this new rate out so they would be familiar at least with the new rate structure,” explained Kevan Espy, Vice President of Marketing & Corporate Communications.
Future communication with members will be a key component of the success of the Smart Choice rate. “We will educate members on how to control the demand component through the peak notification days,” said Johnson. Cobb has historically offered load management programs, rewarding members for helping to lower overall demand cost. Under those programs, the entire membership would benefit from the actions of the few. With the new rate, members who modify their behavior will benefit. Cobb believes that when members are educated about this aspect of the rate, it will provide a powerful incentive to shift consumption away from peak hours.
Communication with local solar developers has gone well, and maintaining good communication with them will be important. Cobb analyzed how the new rate would affect rooftop solar and found that it could extend the payback period, but the amount depends on how much the solar system reduces a member’s demand. Cobb therefore believes it is important to educate solar developers on the rate structure so that they will understand that the optimal orientation of the solar panels will depend on when the member’s peak demand occurs.
Monitoring the Progress
As the membership increases its adoption of the Smart Choice rate, the managers at Cobb will not be the only ones interested in the results. “In Georgia, there are three or four other utilities that are very interested in this rate structure, but they are watching to see how our program turns out,” said Johnson. Currently, the only similar rate structure in the state is offered by Georgia Power, an IOU. However, the rate is optional under their design.
If the new rate yields positive results and the members’ actions help keep rates low, Cobb will more than likely find a number of similarly designed rates being adopted by both neighboring and national utilities.
Rate Case Study • 17Cobb Electric Membership Corporation
Key Takeaways
1. The rate-design process is enhanced by early involvement of programmers and relevant staff, who can help eliminate options that are not within the technical capacities of the cooperative.
2. The decision to adopt a demand charge should be accompanied by careful consideration of the impacts on the membership. Cobb set its residential demand charge at about half of what it pays for demand to its wholesale provider—a level the Cooperative admits is too low. Cobb believes it is better to find an acceptable impact on the membership and plan for adjustments in the future than it is to make a large change too early.
3. Members require education to understand what drives costs. Cobb discovered through focus groups that members had difficulty understanding the major cost driver “demand”. This knowledge was used to design marketing materials that better explain actions that members can take to control costs and save money.
To learn more about Cobb EMC, contact Kevan Espy, Vice President of Marketing and Corporate Communications, at [email protected] or visit Cobb’s website at www.cobbemc.com.

Rate Case Study Hoosier Energy Electric Cooperative

Rate Case Study • 18Hoosier Energy Electric Cooperative
Hoosier Energy: Proactive Demand-Side ManagementIn 2008, stakeholders in Indiana were debating whether the state should develop requirements for investor-owned utilities (IOUs) regarding demand-side management (DSM). The then-current DSM offerings were described by the Indiana Utility Regulatory Commission (IURC) as “nonexistent or inconsistent”. 1 Hoosier Energy and its member distribution cooperatives had long encouraged efficient and economic use of electricity through the promotion and financial support of efficiency measures, but had not established an official policy on DSM. Although Hoosier Energy and its member distribution cooperatives were not rate regulated, Hoosier Energy believed it should create its own policy-one that would not only show state regulators its commitment to DSM but also tailored to the cooperative structure, thereby making it more effective for Hoosier Energy and its member systems than a policy designed for the IOUs.
Who is Hoosier Energy?
Headquartered in Bloomington, Indiana, Hoosier Energy was founded in 1949 with the goal of providing reliable power at the lowest cost to distribution cooperative members. Shortly after incorporation, the founding member systems resolved to apply for a $6.5 million Rural Electrification Administration (REA) loan with the goal of building a generation and transmission facilities. Roughly 20 years would pass before that goal would be achieved in the form of Indiana’s first electric cooperative power plant, the Frank E. Ratts Generating Station, which operated for over 45 years until its closure in 2015.
Hoosier Energy has a generating capacity of 1,926 megawatts (MW) from coal (58%), natural gas (37%), and renewables (5%). The shift toward the current resource mix began in 2000, a time when Hoosier Energy’s generation came entirely from coal resources. Hoosier Energy projects it will increase its renewable resources to 10 percent of total energy provided to member systems by 2025.2
Hoosier Energy’s transmission system comprises 25 transmission stations, 335 delivery points and approximately 1,700 miles of transmission lines that delivered 7.4 million megawatt-hours (MWh) to member systems in 2015 and 2 million MWh to non-members.
Hoosier Energy is owned by its 18 member distribution cooperatives located principally in the southern half of Indiana and also in southeastern Illinois. Collectively, the members serve almost 300,000 consumers (about 650,000 people) by means of 36,000 miles of distribution lines over a service territory of 15,000 square miles. Neither Indiana nor Illinois’ distribution cooperatives are rate-regulated by their respective states.
State: Indiana
Membership: 18 distribution cooperatives
Generatipoin Capacity: 1,926 megawatts
Transmission Market: MISO
Regulation: Not rate regulated
Hoosier Engergy Key Facts
1 IURC News Release. December 9, 2009. Retrieved June 15, 2016. http://www.in.gov/iurc/files/The_IURC_Concludes_DSM_Investigation(4).pdf2 Hoosier Energy’s 2015 Annual Report, p. 10. Retrieved on June 15, 2016. https://cdn.hepn.com/Content/files/HEAnnualReport.pdf

Rate Case Study • 19Hoosier Energy Electric Cooperative
What Prompted Reassessing the Rate Structure?
Hoosier Energy officially adopted Board Policy No. 5-3, Demand-Side Management Program, on October 11, 2008—a full year before the IURC would conclude its DSM investigation in relation to IOUs. The policy outlined principles that would guide Hoosier Energy’s DSM initiatives and proposed the goal of achieving a five-percent reduction in 2018 summer peak demand and similar reductions in energy usage for those member systems participating in the program. This goal was set based in part on the avoided cost of combustion turbines at Hoosier’s Lawrence Station, a natural gas peaking plant. Assuming full member participation, Hoosier Energy calculated that a five-percent decrease in demand would amount to 95 MW or the equivalent of two combustion turbines at Lawrence Station.
Hoosier Energy believed it could make the greatest progress toward its demand reduction goal by supporting a voluntary load-control program for member systems. A load-control program involves installing remotely controllable switches on appliances that allow the member system to turn the appliances off or on during periods of high or low overall system usage. Hoosier Energy would determine the appropriate periods during which it wanted to influence consumption (called “load-control periods”) and send a signal to the distribution cooperatives to inform them that a load-control period was occurring. Distribution cooperatives would then have control of the program in regard to their members and can choose whether to relay the load-control signal to them. However, before such a program could be implemented, Hoosier Energy first wanted to modify its Standard Wholesale Rate to provide member systems and end-consumers with price signals necessary to make load-control activities financially beneficial.
From April 2001 to April 2007, Hoosier Energy’s Standard Wholesale Rate consisted of a demand charge, billed as a dollar amount per kilowatt (kW) of coincident demand, and a flat energy charge, billed in cents per kilowatt hour (kWh) for all kWh. In April 2007, the rate was modified to expand the demand component. The changes in the rate are summarized in the following table:Under both rates, coincident peak was measured as the delivery point’s clock-hour demand that was coincident
3 The dollar amounts from Hoosier’s tariffs are not publicly available and therefore will not be presented in this study.
Monthly Rate
Demand Charge [dollars] per kW of Coincident Demand
Energy Charge [cents] per kW for all kWh
Standard Wholesale TariffApril 1, 2001
Monthly Rate
Demand Charge
Production Component [dollars] per kW of Coincident Demand
Transmission Component [dollars] per kW of Non-Coincident Demand
Substation and Radial Line Component [dollars] per kW of Non-Coincident Demand
Energy Charge [cents] per all kWh
Standard Wholesale TariffApril 1, 2007

Rate Case Study • 20Hoosier Energy Electric Cooperative
with Hoosier’s system peak during the on-peak period defined as the hours between 7 a.m. and 11 p.m. E.S.T. Non-coincident demand was defined as the delivery point’s highest kW demand for any rolling 30-minute period during the billing month.
Although the newer rate was a step in the direction of unbundling the demand charge and thereby providing members more detailed pricing information, Hoosier Energy now wanted a rate design that would provide actionable price signals aimed at reducing demand in the context of a load-control program.
The New Rate Structure: Decision-Making to Position Hoosier Energy for the FutureImplemented on April 1, 2010, the new rate further unbundled production demand and adopted on-peak/off-peak energy pricing. A power cost tracker also applies to all energy purchased by member systems. The new rate is summarized in the following table:
4 Interview conducted on June 14, 2016 between Power System Engineering, Inc., and Laura Cvengros, Hoosier Senior Analyst – Rates and Tariffs. All citations from Cvengros were taken from this interview unless otherwise noted.
Monthly Rate
Demand Charge
Production Component
Summer [dollars] per kW of summer Coincident Demand
Winter [dollars] per kW of Winter Coincident Demand
Transmission Component [dollars] per kW of Coincident Demand
Substation and Radial Line Component [dollars] per kW of Billing Non-Coincident Demand
Energy Charge
On-Peak [cents] per all kWh
Off-Peak [cents] per all kWh
Excess Net kVARh Charge [dollars] per kVARh per Month
Standard Wholesale TariffApril 1, 2010
An innovative aspect of Hoosier’s rate design resides in the calculation of the summer and winter production components of the demand charge. The summer coincident demand is calculated for the months of June through August at each member system’s delivery point as the clock-hour demand that is coincident with Hoosier Energy’s system peak demand occurring during load-control periods within the on-peak demand period, defined as between 7 a.m. and 11 p.m. EST. Summer coincident demand also applies in the months of September through November and is calculated as the average of the summer coincident demands for the preceding months of June through August. Winter coincident demand for the months of December through February is calculated at each member cooperative system’s delivery point as the clock-hour demand that is coincident with Hoosier Energy’s system peak demand occurring during load-control periods within the on-peak demand period, defined as between 7 a.m. and 11 p.m. EST. Winter coincident demand for the months of March through May is calculated based upon average peak demand in December through February.
The fact that the tariff requires the production component of the demand charge to be based upon coincident peak during load-control periods means Hoosier Energy must have at least one load-control event during each peak month (December through February and June through August) billing period to bill demand. Laura Cvengros, Hoosier Energy’s Senior Analyst – Rates and Tariffs, added, “what makes this complicated is that our transmission demand rate is also billed on coincident peak, but that coincident peak may not be the same coincident peak as we use for production demand.”4 This is because the coincident peak for determination of transmission demand does not have to occur during a load-control period.

Rate Case Study • 21Hoosier Energy Electric Cooperative
Shifting the summer and winter demand charges to a coincident peak that occurs during load-control events provides members the opportunity to manage and shift their peak energy consumption at times they know will be meaningful in regard to cost reduction. Furthermore, the change in consumption would occur automatically for those members enrolled in the program. Cvengros explained, “Voluntary participants in the load-control program install switches on their air conditioners and water heaters. Hoosier Energy sends a signal out to our member systems that allows them to control those devices during periods throughout peak months.”
Educating and Communicating with Consumers
Hoosier Energy’s Managers Association—the CEO’s and General Managers of its 18 member distribution cooperatives - participated early and throughout the G&T rate-design process. “We had a rate consultant5 on board that worked on the design and helped educate staff and members during the process. The consultant presented different options on how the rate could be implemented, how much of a change it would be for each member system, and how the price signal would work on production-demand components.”
The Managers Association also contributed to design of the new wholesale rate. “They were involved in the final structure,” said Cvengros, “and considered options in terms of how the rate would be implemented and how these pieces would work. At one point, they were presented an option where Hoosier would roll out the new structure over a period of time. The Managers Association concluded it would be better to go all the way rather than rolling it out slowly and losing some of the price signal.”
How did Hoosier Energy Roll Out the New Rates to its Consumers?
The rate design was finished in mid-2009 but would not be implemented until almost a year later. “Hoosier Energy has a policy in place that when we approve a new rate, it cannot go into effect until eleven months later to give members time to revise or update their retail rates,” explained Cvengros. “Out of our 18 members, five of them looked at their new wholesale structure, did cost-of-service work and implemented something pretty quickly or even in conjunction with the timing of our implementation. Others waited to see what their wholesale bills looked like and then rolled out a new rate over the next 12 months. Some of them have maintained their same rate structure but changed retail rates to accommodate their wholesale power costs.”
When the new rate went into effect in April 2010, Hoosier Energy saw differing levels of participation in the load-control program among its member systems. “Some of them have been very proactive on it,” said Cvengros. “The more that they can get off-peak during that load-control event, the lower their power bill is going to be, so some put a lot of effort into it. Others either haven’t wanted to bother their members with it or didn’t think it would make much of a difference. Hoosier Energy’s intent was to give them price signals through our rate structure and it’s up to each member system to decide if or how to pass those signals through to their consumers.”
Hoosier Energy tracks the participation in the load-control program and reports results in its DSM Annual Report.6 The cumulative number of devices controlled across all the member systems and the cumulative demand savings are shown in the chart below:
5 GDS Associates, Inc. For more information on GDS, visit www.gdsassociates.com.6 For the most recent report, see www.hepn.com/dsm.asp. Historical reports referenced in this study were obtained from Hoosier.

Rate Case Study • 22Hoosier Energy Electric Cooperative
Although the program has shown significant MW savings, the incremental addition of new devices being load controlled has declined, dropping from over four thousand annually between 2010 and 2011 to approximately one thousand between 2014 and 2015. This slowing in the pace of adoption could be from market saturation but could also come, as Cvengros believes, from member fatigue: “It’s takes a lot of staff effort and resources to sign up consumers to participate in load control, and our member systems always have a lot on their plates. Some members have put expanding load control on a back burner. If they have retail members with load control, that’s great, they’ll continue to im-plement and compensate their customers, but they’re not adding many new switches or growing the program.”
Financially, the program has been successful. Savings have consistently outpaced costs and Total Resource Cost test or “TRC” ratios (calculated as the ratio of program benefits to program costs, in-cluding both the utility’s and participants’ costs) have been above two every year since inception. This indicates financial benefits from having the program have been over twice the cost of the program. The costs that Hoosier Energy incurs to support the program and the calculated lifetime economic benefits are shown below (note there are no economic costs to participants):
Total Devices Controlled and Summer/Winter MW Savings
18,000
16000
14,000
12,000
10,000
8,000
6,000
4,000
2,000
-
14.0
12.0
10.0
8.0
6.0
4.0
2.0
0.02009-2010 2011 2012 2013 2014 2015
5,093
9,367
12,02013,460
14,49015,538
Hoosier Energy Costs and Lifetime Economic Benefits (MM)$9.00
$8.00
$7.00
$6.00
$5.00
$4.00
$3.00
$2.00
2009-2010 2011 2012 2013 2014 2015
$3.03
$5.54
$7.23$8.15
$5.12 $5.51
Hoosier Energy Costs Lifetime Economic Benefits
$0.96
$1.72 $2.17 $2.40 $2.56 $2.70
Cumulative Summer peak MW Savings
Total Deviced Controlled
Cumulative Winter peak MW Savings
4.2
6.98.9
5.9 6.6 7.1 7.5
10.0 10.9 11.7
4.73.0
Rate Case Study • 23Hoosier Energy Electric Cooperative
Lessons Learned Thus Far
Hoosier Energy has learned that the education efforts needed to support the new rate must be ongo-ing. “It’s a more complicated rate design and we’ve worked to help member systems understand it,” said Cvengros. With 18 member systems, Hoosier also has the challenge of educating new CEO’s and Managers when turnover occurs. Explained Cvengros, “It can take a while to understand the aver-aging aspect of our production demand and how that all works together, so education has been an ongoing process.”
The unpredictability of the electric markets has also had impacts on Hoosier Energy’s rate design. “We keep hearing that between regulation and retirement of coal, capacity is going to start becoming expensive, but it hasn’t,” said Cvengros. “It’s worked well for us but I don’t know if we or member CEO’s would develop the same rate design today.” However, Hoosier Energy is happy with the rate and has no plans to change it. “It gives us an insurance policy,” said Cvengros. “If capacity should become more expensive, we have this structure to work with.”
Key Takeaways
1. Taking a proactive position in relation to state regulatory policy discussions helps show coopera-tives are willing to address policy issues and don’t need to be folded into new regulations or legis-lation. Hoosier Energy created its own DSM policy to both further its own long-standing efficiency goals and to ensure it had a policy that was specific to the structure of cooperatives.
2. Member system participation and engagement is very important. Education for a new rate design should be thought of as an ongoing process that extends far past implementation. Member distribu-tion cooperatives may need continued support as they update their own rates or experience turnover.
3. The broader market may not develop along the lines that a rate was designed to address. Hoosier Energy’s new rate design may have been dampened by an unexpectedly inexpensive capacity market but the G&T believes putting the rate in place was a good policy decision.
To learn more about Hoosier Energy, contact Laura Cvengros, Senior Analyst—Rates and Tariffs, at [email protected] or visit Hoosier’s website at www.hepn.com.

Rate Case Study Mid-Carolina Electric Cooperative

Rate Case Study • 24Mid-Carolina Electric Cooperative
Mid-Carolina Electric Cooperative: Moving Toward Cost-Based RatesB. Robert “Bob” Paulling became President and CEO of Mid-Carolina Electric Cooperative (MCEC or Cooperative) in 2013 and inherited a problem common to many utilities: “Our basic account charge was not capturing enough revenue, and at the same time our sales were declining,” he explained.1 Paulling wanted to find a solution that would both prevent revenue erosion and empower members to control their costs, which precluded a simple rate increase. Armed with decades of demand data, Paulling and the managers of MCEC set out to design a time-of-use (TOU) demand rate, which would better correspond to the cost of serving its members.
Who is Mid-Carolina Electric Cooperative?
On June 20, 1940, eleven men held a meeting in Batesburg, South Carolina, a rural community approximately 40 miles west of Columbia, to incorporate the Mid-Carolina Electric Cooperative. On October 14 of the same year, the Rural Electrification Administration (REA) granted MCEC its first loan to supply electricity to 945 members and finance the construction of power lines -- a task made all the more difficult due to the manual labor and supply shortages that were prevalent during World War II.
Over the years, MCEC has expanded to serve approximately 46,000 members (54,000 meters) on over 4,100 miles of line in the counties of Lexington, Richland, Saluda, Aiken, and Newberry. MCEC’s service area, located principally to the west of Columbia, encompasses not only rural and suburban areas, but also serves the area surrounding Lake Murray, a 50,000-acre lake featuring 500 miles of shore line that has become a popular recreational attraction. Approximately 7,000 of MCEC’s members are commercial, including businesses such as convenience stores, restaurants, and strip malls. Total energy sales are approximately 88 percent residential and 12 percent commercial and industrial.
MCEC is a self-regulated utility that incurs a winter peak of approximately 350 megawatts (MW) and a summer peak of 295 MW. The majority of the members have heat pumps with electric resistance heating. Heat pumps provide heat by moving thermal energy opposite to the direction of spontaneous heat flow by capturing heat from a cold space and releasing it to a warmer one.
State: South Carolina
Membership: 45,000
Wholesale Supplier: Central Electric Power Coop
Transmission Market: Santee Cooper
Regulation: Unregulated
MCEC Key Facts
1 Phone interview on May 12, 2016 between MCEC President and CEO B. Robert Paulling and Power System Engineering, Inc. All citations from Paulling come from this interview, unless otherwise noted.

Rate Case Study • 25Mid-Carolina Electric Cooperative
MCEC, like all of South Carolina’s electric cooperatives, is provided with wholesale power by Central Electric Power Cooperative (Central)2 through a joint agreement with the South Carolina Public Service Authority, better known as Santee Cooper3. Central has no direct generation ownership, but rather designs and builds transmission lines between the bulk transmission system and member-owned delivery points. Central purchases the majority of its power from Santee Cooper and Duke Energy Carolinas. MCEC’s wholesale cost is roughly 48 percent energy and 52 percent demand, and demand is billed based on a monthly coincident peak (CP).
MCEC’s entire service area features advanced metering infrastructure (AMI) from Aclara called TWACS® (Two-Way Automatic Communications System), which allows for hourly interval data reading and two-way data transfer, among other functions.
What Prompted Reassessing the Rate Structure?
In a volumetric model of rate design, the majority of a utility’s costs to serve its customers are recovered in a bundled, average charge per kilowatt hour (kWh) and thus recovered based on the quantity sold. This model was no longer ideal for MCEC for three reasons. First, in an environment of decreasing sales, MCEC’s rates were on the verge of no longer recovering the level of revenue required to provide service to MCEC’s members. Second, MCEC no longer considered the volumetric model to be fair. “We knew we didn’t want intra-class residential subsidization to occur,” Paulling said. “In winter, there are some manufactured homes that will use 5,000 kWh per month. Every one of them [i.e., every kWh] has an adder to recover fixed costs. Being penalized like that isn’t right.” This “penalty” can occur because a rate that is based on the volumetric model recovers a higher amount of fixed costs in the kWh charge, and therefore customers who consume an unexpectedly high amount of kWh will contribute more than their fair share toward fixed cost recovery. Conversely, customers who consume fewer kWh can end up not contributing enough. In MCEC’s service territory, there clearly were customers who also fell into that second category: “Look at lake houses, which are often only used seasonally. They aren’t carrying their full cost,” said Paulling. Third, MCEC believed that the volumetric model did not give its members enough opportunity to control their costs. The Cooperative’s then-current rates did not provide its members enough information to know when they could take actions that would be a win-win for MCEC and themselves, as ultimately the savings were passed down to them through lower monthly bills.
The New Rate Structure: Decision Making to Position MCEC for the Future
To design the new rate, MCEC enlisted the help of its rate consultant, GDS Associates, Inc., (GDS).4 The Cooperative also kept Central updated throughout the entire process. The first change MCEC made was to raise the account charge. MCEC had commissioned a cost of service (COS) study from GDS years earlier in preparation for a previous rate adjustment; and although the results of that study indicated that MCEC should increase its account charge, the volumetric-based ratemaking it employed at the time caused them to leave a large portion of the account costs to be recuperated in the kWh charge. Now, MCEC shifted more of the cost of having an account into the account charge. “When we had a volumetric rate, we were at $19,” explained Paulling in regard to the residential rate. “We went up about $5 to $24, and we broke that down to a daily charge of 80 cents. We went to the daily charge because some billing cycles have 29 days and some 30. To make it simple, we went daily. Overall, we feel that if you use zero energy, the account charge now covers having that account on the system.”
2 For more information on Central, visit www.cepci.org.3 For more information on Santee Cooper, visit www.santeecooper.com.4 For more information on GDS Associates, Inc., visit www.gdsassociates.com.

Rate Case Study • 26Mid-Carolina Electric Cooperative
MCEC also knew that it wanted to implement a demand charge, which would more appropriately recover the cost of the infrastructure necessary to serve a customer. Demand and energy in the electric utility industry can be compared to speed and total miles driven for an automobile; i.e., if a driver says that he has driven 150 miles per hour, it’s unclear how far he drove. However, what is known is that he needed a powerful engine. Conversely, if a driver says he has driven 150 miles, it’s not clear how fast he went; and he could have driven those miles at a leisurely pace with a relatively small and inexpensive engine. Generally speaking, when utility customers have a large demand, the utility must spend more money on the infrastructure necessary to serve that customer. To continue the previous analogy, billing customers based only on the amount of kWh they consume would be equivalent to a car rental agency billing a customer only for the quantity of miles he drove without taking into consideration that he opted for a sports car rather than an economy car.
MCEC believed that the difficulty in designing a demand charge resided in setting the time period during which demand was measured in a way that would allow customers to comfortably adapt to it. This would involve delineating periods of high use (“on-peak”) and low use (“off-peak”) and effectively conveying that information to members. “Normally, back in the day, there was not enough difference between on-peak and off-peak. The window was just too large,” said Paulling. In order to narrow this time period down, MCEC looked at over 30 years of historical data. “We started with data from 1984 and plotted every coincident peak (CP),” he said. The coincident peak represents a period of time during which the electric system experiences its overall maximum demand. A related concept is the non-coincident peak, which is a measure of the sum of individual consumers’ maximum demands. “In the winter months [November through March], the CP occurred between 6 and 9 a.m.,” explained Paulling. “In summer [April through October], the CP always happened between 4 and 7 p.m. And throughout those 32 years of data, the peak occurred on various days of the week. Sometimes it was on a weekend; sometimes, a weekday.” Based on the historical findings, MCEC set the period during which customers’ monthly demand would be measured between 6 to 9 a.m. in the winter and 4 to 7 p.m. in the summer. “We look at those 90 hours and pick the customer’s highest hour, and that’s what demand is. We use the actual meter data for that hour,” said Paulling.
The amount to charge for demand was also carefully decided. “If you look at what our demand cost is from the wholesale supplier, it’s about $16 per kW: $12.50 for generation and $3.50 for transmission,” said Paulling. “MCEC’s distribution demand charge is about $4. So the true cost is about $20. We came up with a charge of $12 per kW for our cost because we wanted to make sure it was revenue neutral. Our real cost is $20, so how did we charge only $12? It’s because of diversity. Our non-coincident peak is normally 160 percent of the CP. That’s how we derived the charge of $12 per kW for residential. This is based on that one peak hour in that 90 hours.” In layman’s terms, the reason MCEC could set its demand charge lower is because an individual customer’s peak electricity use doesn’t necessarily occur at the same time as the overall system’s peak demand. MCEC’s true cost of coincident demand is approximately $20, but residential members’ demand is calculated from an NCP demand that is approximately 160 percent of the CP. Therefore, in order to reflect the true price of CP demand, the NCP demand rate for residential members is calculated as approximately $20 x 100/160 = $12.50.
With the majority of the costs of accounts and demand accounted for, MCEC then turned to the energy charge. When the remaining distribution costs and the cost of the wholesale power were factored in, MCEC arrived at a residential price of 4.7 cents per kWh – a substantial reduction from the previous rate, which was about 11.5 cents per kWh. MCEC’s residential and commercial rates are summarized in the following table:5
5 Source: http://www.mcecoop.com/content/new-rate-structure, retrieved on May 20, 2016.

Rate Case Study • 27Mid-Carolina Electric Cooperative
MCEC studied how the rate would affect every member group and realized that some groups would require adjustments. For example, special considerations were made for net metering members. MCEC didn’t believe it would be fair to charge them the demand fee. Paulling explained, “If we did the demand charge, if it was sunny 29 days out of 30, they would have low demand except for that one cloudy day, their demand would be high. We would essentially be penalizing them for that one day of cloudy weather.” At the same time, MCEC needed a rate that would prevent the cost shifting it was trying to correct. “We have something unique,” said Paulling. “We went back and looked at those 90 hours on the residential and the commercial side. During those peak hours, if we forgot about demand and shifted everything onto the energy side, what would a kWh be worth? It’s 34.4 cents, no matter how you do the math, for both residential and commercial. So if we net meter you, every hour during the day not on peak, 4.7 cents is the number. We will credit you that amount. If on-peak, we’ll give you 34.4 cents. But if you buy during peak, you’ll pay 34.4 cents. That’s where we landed.” The net-metering members are on the same actual rate as all other residential members, but the above-described replacement of the demand charge for a higher kWh charge is addressed through a net-metering rider. “The solar folks are fine with it. With this rate, non-solar MCEC members are not subsidizing solar members,” he added.
Another customer class that required special consideration was churches. Because the churches in MCEC’s service territory generally had load factors (i.e., average use as a percentage of maximum use) of around 10 to 15 percent, MCEC believed their bills would double or triple under the new commercial rate. To avoid this, MCEC removed their demand charge and instituted the all-in volumetric charge of 34.4 cents per kWh during on-peak hours; the same amount it had determined when designing the net metering rate.
Educating and Communicating With Member-Consumers
Members began learning about the new rate design several months before its final implementation through outreach by the board of directors. Paulling said, “The board was involved during the whole process. We exchanged information with them for at least a year on why we needed to do this and how the process was going.” Paulling noted that the board was supportive of the changes and never recommended taking smaller steps toward the ultimate goal: “They said, ‘unless we go all in, our members won’t respond.’”
Account Charge
Residential @ $ 0.80 per day Commercial @ $ 1.10 per day
Energy Charge
Residential @ $ 0.04700 per kWh Commercial @ $ 0.05700 per kWh
On–Peak Charge
Residential @ $ 12.00 per kW Commercial @ $ 14.75 per kW
MCEC's New Rate Structure(Effective on bills rendered February 1, 2016)

Rate Case Study • 28Mid-Carolina Electric Cooperative
MCEC knew that its employees’ ability to explain why it had adopted this new rate and how the rate benefited members would be important. Paulling said, “I didn’t want one of my employees to get questions in the grocery store and not know how to respond. Internally, we conducted training for all of our employees. And with the member service staff, we spent hours. Now, they can really explain it all to our members. When they receive calls, it’s a short, simple process.”
Paulling also wrote letters to all members specific to their rates. In those letters, he explained that the Cooperative’s cost of power was greater during the on-peak hours MCEC had identified. He explained the three-hour window and how customers would be billed for demand. He also told them when the rate would go into effect and advised them to consult a brochure that MCEC had created to help members make small adjustments that would save them money under the new rate. The brochure was both mailed to members and featured on MCEC’s website.6 It explained the elements of the new rate structure and why it was necessary. Importantly, the language used emphasized that the new rate provided money-saving opportunities to the members that they previously did not have.
Even with the education efforts MCEC made, some members didn’t realize the ramifications of the new rate until they began receiving their bills. For example, members who had developed a years-old habit of turning down their thermostats at night to save money found that when they turned their thermostats back up in the morning, they were heating their houses during the most expensive time of the day.
Education efforts have continued after the roll out. Paulling himself wrote an article for the monthly newsletter explaining how air conditioners can best be used under the new rate. MCEC is currently trying to educate people to make small thermostat changes that will save them money.
How Did MCEC Roll Out the New Rates to its Consumers?
MCEC’s new rates began for all members in January of 2016 and were used to calculate bills as of February 1st. The actual implementation was quick, as members had officially been notified of the effective date toward the end of the previous year.
Although it is still early, the new rate structure appears to be fulfilling MCEC’s original goals. As Paulling explained, “January and February were right on the money -- we didn’t over or under collect. This past month was low usage. Revenue was higher than it would have been, which is exactly how the rate was designed. It flattens out bills. In shoulder months, revenue is higher; and in other months, it’s lower.”
MCEC has received some complaints during the roll out, but most of the members have been satisfied with the explanations they’ve received. Lakehouse owners who had been paying $30 to $40 were initially upset that they are now paying $40 to $50. MCEC explained that they had previously been undercharging them. “We talked it through with them,” said Paulling, “and they understood.”
The number of complaint calls has been less than in previous years. Moreover, MCEC’s American Customer Satisfaction Index (ACSI) scores this year were exactly the same as last year. MCEC is excited about the results so far and considers the rollout a success.
6 See http://www.mcecoop.com/sites/midcarolinaelectric/files/PDF/MCEC%20Rate%20Brochure.pdf

Rate Case Study • 29Mid-Carolina Electric Cooperative
Lessons Learned
Paulling stated that this process has reaffirmed a lesson that he has learned many times: every co-op is unique. “If you’ve seen one co-op…you’ve seen one co-op,” he likes to say.
One area in which his Cooperative’s uniqueness has caused some difficulty relates to the billing system. “We have an in-house enterprise billing system that we’ve had for 30 years,” said Paulling. “We are flexible. But now, we’re in the process of transferring to NISC [National Information Solutions Cooperative], which has its own set of challenges, as any change in bill configuration would. We’ve lost a lot of sleep over this, and it has been a long process; but we are now in a good position, and I think we’re ‘future proof.’”
Another important lesson to take away from MCEC’s new rate is that the level of education and communication a cooperative devotes to a new rate post-implementation should correspond to the type of rate being implemented and the participation required from the membership to make that rate a success. MCEC will continue providing education to its members about its new rate because, to a certain degree, the success of the rate will depend on members taking advantage of the savings that will come from shifting their use off-peak. MCEC is enthusiastic about helping its members do so.
Key Takeaways
1. When designing a rate that distinguishes between on-peak and off-peak periods, the on-peak period should not be so large that it prevents members from being able to adjust their consumption habits. MCEC chose a three-hour window, which is short enough, for example, to allow members to pre-heat or pre-cool their residences.
2. Cooperatives should consider how new rate designs affect every member class. MCEC found that its new rate had potentially over burdensome impacts on both net-metering members and churches. To compensate for this, MCEC adapted the rate for these members in a way that maintained a financially equivalent result.
3. A rate that is designed to encourage member participation will require ongoing member education. The success of MCEC’s new rate will in part depend on members taking advantage of the opportunity to reduce their peak demand. MCEC not only provided education on how to reduce demand during the rate’s implementation, but will also provide regular education on this issue going forward.
To learn more about Mid-Carolina Electric Cooperative, contact President and CEO B. Robert Paulling at [email protected] or visit MCEC’s website at www.mcecoop.com.

Rate Case Study St. Croix Electric Cooperative

Rate Case Study • 30St. Croix Electric Cooperative
St. Croix Electric Cooperative: Toward an Equitable Net-Metering Rate DesignIn August of 2012, St. Croix Electric Cooperative (SCEC or Cooperative) President/CEO Mark Pendergast sent a memo to SCEC’s board of directors to express his concern over a situation he believed had the potential to challenge the Cooperative’s ability to equitably provide power to its members. For the first time in the Cooperative’s history, SCEC expected three of its distributed generation (DG) members to produce more electricity than they purchased, thereby calling into question the allocation of costs and benefits under the current net-metering policy. At that time, SCEC’s net-metering policy was a very favorable rate for a small number of members. With growing interest in solar distributed generation among the membership, net metering was approaching a level with the potential for cost-shifting and cost-avoidance within SCEC’s membership. Pendergast knew long-term changes were needed to the net-metering policy while the number of members with distributed generation was still low enough to allow a relatively smooth transition toward a new policy.
Who is St. Croix Electric Cooperative?
SCEC was formed in 1937 as a result of the efforts of a group of farmers who were determined to supply rural St. Croix County, Wisconsin, with electric power. On May 24, 1939, SCEC delivered electricity to its first member near the village of Woodville. Throughout the years, SCEC’s membership has not only increased in St. Croix County, but has also expanded into the neighboring counties of Polk, Pierce, and Dunn. While maintaining its rural roots, SCEC has also embraced a growing suburban population in its service territory owing to SCEC’s proximity to the Minneapolis/St. Paul metro area. Today, SCEC serves over 10,500 members and has annual sales of over 185 million kilowatt-hours (kWh).
SCEC receives wholesale power from Dairyland Power Cooperative (Dairyland). Dairyland supplies power to over 25 electric distribution cooperatives and 17 municipal utilities located in Illinois, Iowa, Minnesota, and Wisconsin. Dairyland serves a population of approximately 600,000 members and, in 2014, sold over 6.5 billion kWh.1
SCEC offers community solar to its members through its Sunflower 1 project. Energized on July 8, 2014, the 103 kW Sunflower 1 project offered members the opportunity to subscribe to 500 watt production units. The original plan for the project called for an 88.5 kW solar array, but member interest resulted in expansion of the project during the planning phase.
SCEC is currently upgrading its entire service area to Sensus Advanced Metering Infrastructure (AMI) in order to both better manage its distribution grid and provide enhanced services for members. The new Sensus system will, among other benefits, allow SCEC to: retrieve meter readings within 15 seconds; monitor voltage at the per-meter level; receive alerts and notifications for tampering and high or low voltage; view substation loading in near real time; offer prepaid metering; allow members to see their energy usage in one-hour intervals on SCEC’s web portal; and offer time-of-use rates in the future.
State: Wisconsin
Membership: 10,500
Wholesale Supplier: Dairyland Power Cooperative
Transmission Market: MISO
Regulation: Uregulated
SCEC Key Facts
1 For more information on Dairyland, visit www.dairylandpower.com.

Rate Case Study • 31St. Croix Electric Cooperative
What Prompted Reassessing the Rate Structure?
Pendergast explained to the board of directors that SCEC had been offering a net-metering rate that far exceeded both the net-metering rate offered by regulated utilities and the compensation rate required by the Public Utility Regulatory Policies Act (PURPA). PURPA required utilities to compensate qualifying facilities customers for the power their systems produced at the utility’s wholesale avoided cost of producing a kWh. SCEC was compensating customers at the retail rate -- even for the kWh the net-metering consumers produced in excess of their own use. Not only was SCEC compensating consumer production at this generous rate, but the Cooperative was also allowing relatively large systems to qualify. As Pendergast explained, “Regulated utilities [in Wisconsin] were only paying net metering for systems sized up to 20 kW, and we were doing double that -- up to 40 kW.” 2
SCEC’s net-metering policy had been workable for the Cooperative when it applied only to a few net-metering members who still purchased electricity in the aggregate. Presently, however, three of SCEC’s net-metering consumers were about to become net producers of electricity, which called into question the allocation of costs and benefits under the current net-metering policy. Additionally, the trend in solar adoption was on the rise.
In 2012, SCEC had between 12 and 14 net-metering systems in its territory, three or four of which were wind systems. However, SCEC was witnessing a growing interest in solar from its members. “I think the interest came in part from our proximity to Minnesota and Xcel Energy,” Pendergast stated. “This was around the time that [then governor of Minnesota] Tim Pawlenty came out with his goal of 25 percent renewable energy by 2025. Solar in Minnesota was a lot more popular than in Wisconsin because of the size of utility rebates and the net metering threshold of 100 kW.” In St. Croix County, according to Pendergast, “We have the sixth highest per capita income in the state, and a lot of our membership commutes and works in the Minneapolis/St. Paul metro area. Our members were exposed to a lot of information on renewables from both solar advocates and contractors. I would say there was a lot more interest from our membership than in other parts of the state for that reason.”
SCEC was concerned that the anticipated growth in net metering would, under the current policy, lead to excessive compensation for production that would effectively result in net-metering members being subsidized by non-net-metering members. Dana Bolwerk, SCEC’s Communication and Events Coordinator, commented on why SCEC felt the need to make a change: “I think as a co-op you are always concerned about doing the right thing for your entire membership, not just a small percentage. Obviously, every member does have one vote, but you definitely need to look at the big picture and look at what’s best for the sustainability of the co-op going forward.”
The New Rate Structure: Decision Making to Position St. Croix for the Future
Roughly a year after Pendergast’s original memo to the board, changes to the net-metering rate were made. First, the size of the systems that could qualify for net metering was reduced from a maximum of 40 kW to 20 kW. Pendergast added, “We did grandfather two systems that were larger than that. As long as the original owner was the member, we would continue to give them full [i.e., retail rate for all production] net metering.” Second, for billing purposes, net-metering members would be moved to a monthly true-up rather than rolling forward excess production throughout the year. Third, production in excess of the monthly purchases would be paid at the Cooperative’s avoided cost rather than at the retail rate. Production up to the consumer’s level of consumption would continue to be credited at the retail rate. 2 Phone interview on May 13, 2016 between PSE, SCEC President/CEO Mark Pendergast, and SCEC Communications & Events Coordinator Dana Bolwerk. All citations from Pendergast and Bolwerk come from this interview, unless otherwise noted.
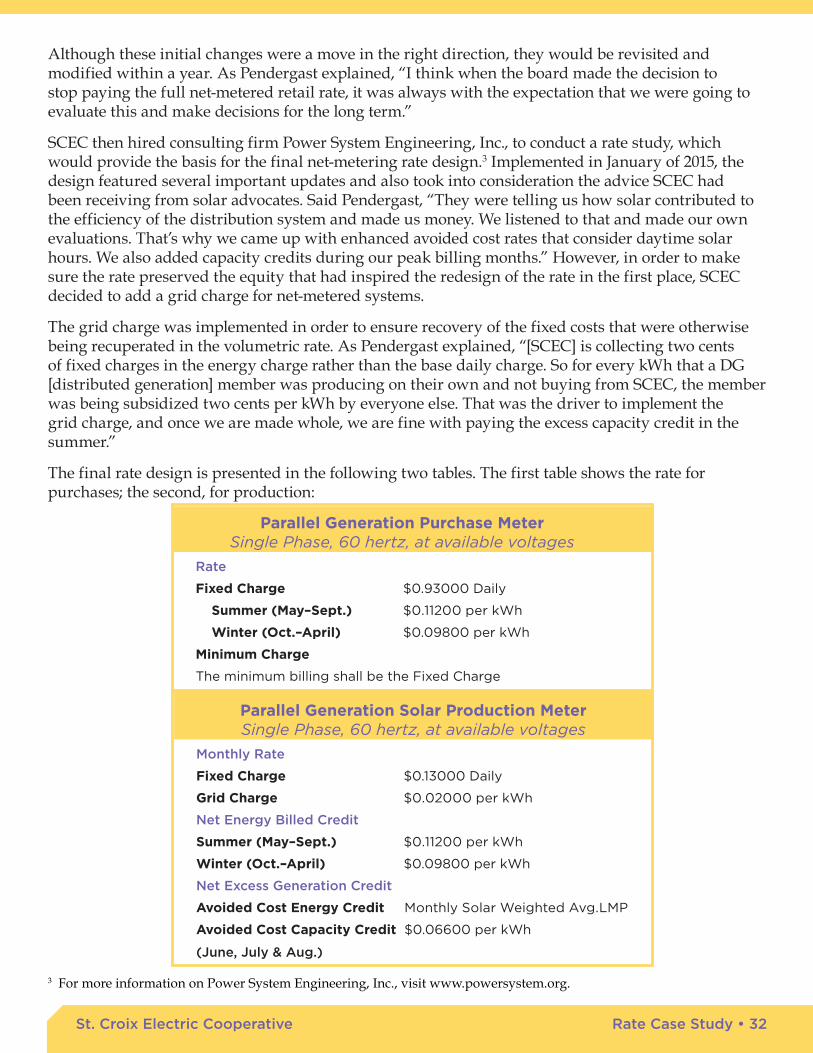
Rate Case Study • 32St. Croix Electric Cooperative
Although these initial changes were a move in the right direction, they would be revisited and modified within a year. As Pendergast explained, “I think when the board made the decision to stop paying the full net-metered retail rate, it was always with the expectation that we were going to evaluate this and make decisions for the long term.”
SCEC then hired consulting firm Power System Engineering, Inc., to conduct a rate study, which would provide the basis for the final net-metering rate design.3 Implemented in January of 2015, the design featured several important updates and also took into consideration the advice SCEC had been receiving from solar advocates. Said Pendergast, “They were telling us how solar contributed to the efficiency of the distribution system and made us money. We listened to that and made our own evaluations. That’s why we came up with enhanced avoided cost rates that consider daytime solar hours. We also added capacity credits during our peak billing months.” However, in order to make sure the rate preserved the equity that had inspired the redesign of the rate in the first place, SCEC decided to add a grid charge for net-metered systems.
The grid charge was implemented in order to ensure recovery of the fixed costs that were otherwise being recuperated in the volumetric rate. As Pendergast explained, “[SCEC] is collecting two cents of fixed charges in the energy charge rather than the base daily charge. So for every kWh that a DG [distributed generation] member was producing on their own and not buying from SCEC, the member was being subsidized two cents per kWh by everyone else. That was the driver to implement the grid charge, and once we are made whole, we are fine with paying the excess capacity credit in the summer.”
The final rate design is presented in the following two tables. The first table shows the rate for purchases; the second, for production:
Rate
Fixed Charge $0.93000 Daily
Summer (May–Sept.) $0.11200 per kWh
Winter (Oct.–April) $0.09800 per kWh
Minimum Charge
The minimum billing shall be the Fixed Charge
Parallel Generation Purchase MeterSingle Phase, 60 hertz, at available voltages
3 For more information on Power System Engineering, Inc., visit www.powersystem.org.
Monthly Rate
Fixed Charge $0.13000 Daily
Grid Charge $0.02000 per kWh
Net Energy Billed Credit
Summer (May–Sept.) $0.11200 per kWh
Winter (Oct.–April) $0.09800 per kWh
Net Excess Generation Credit
Avoided Cost Energy Credit Monthly Solar Weighted Avg.LMP
Avoided Cost Capacity Credit $0.06600 per kWh
(June, July & Aug.)
Parallel Generation Solar Production MeterSingle Phase, 60 hertz, at available voltages

Rate Case Study • 33St. Croix Electric Cooperative
The monthly solar weighted average LMP (locational marginal price) for the prior month is applied to the current month’s excess production. The solar weighted average LMP reflects the average hour-ly marginal wholesale cost of purchasing electricity at those times when solar is producing. This approach ensures the calculated avoided energy cost represents the energy costs being avoided due to solar production and is a refinement of other approaches that may average the LMP for all hours or for all daytime hours (even those hours when solar is not producing). One way to obtain the production profile used to determine the solar weighted average LMP is to use hourly production meter data. Another method, which SVE chose, is to use average production profiles by month from the National Renewable Energy Lab (NREL) PVWatts® calculator. The advantage of using the NREL data is that it is publically available, generally accepted in the industry and is not dependent on one weather dataset but averages multiple years and multiple sites for a particular region. The following chart illustrates the LMP in SCEC’s region:
SCEC made one further accommodation to current net-metering members as it implemented this second round of changes: they would be exempt from the grid charge for roughly eight years, a time period that corresponds to an arrangement SCEC has with its wholesale provider, Dairyland. “Dairy-land currently reimburses us the difference between our average power cost and the retail rate for net-metered accounts,” explained Pendergast, “but there’s a sunset on that, and our grandfathering date expires with the Dairyland date.” Moreover, the grandfathering clause applies only to previously interconnected systems at their original size, so any increases or additions to those systems would not be exempt from the grid charge.
Avoided Cost-Locational Marginal Price (LMP)
$0.1200
$0.1000
$0.0800
$0.0600
$0.0400
$0.0200
$-
January
February
MarchApril May
June July
August
Septemper
October
November
December
all hours - Monthly Solar Wtd. - Monthly Solar Weighted w/Capacity Credit
cent
s pe
r K
wh

Rate Case Study • 34St. Croix Electric Cooperative
Educating and Communicating with Member-Consumers
Broad education efforts that SCEC undertook included presenting the need and basis for developing the new rate structure on the Cooperative’s website. Staff responded to letters written by DG custom-ers and fielded phone calls from the affected members. Although letters to the editor critical of the DG rate changes appeared in local newspapers, there was no backlash from non-DG members about the rate change. SCEC also explained its position during board meetings when members appeared with representatives of the solar industry or solar advocacy groups.
These groups generally perceived SCEC as being anti-renewable energy. SCEC emphasized to them that it was the caretaker of the entire organization. “We explained that the board had a fiduciary responsibility,” stated Pendergast. “We told them that they needed to understand that SCEC’s ener-gy cost is four cents per kWh, and yet we are paying 11 cents for generation [from net-metering cus-tomers].” These efforts did not convince everyone, but the interaction helped SCEC understand how important the grandfathering clause would be when it would eventually make its second round of changes.
SCEC also had an opportunity to learn how its membership felt generally about solar in the form of SCEC’s Sunflower 1 community solar project. The initial planning for the project began in 2013. How-ever, SCEC’s board of directors felt that it should not move forward unless there was enough interest from the membership to show that the project would be fully subscribed upon completion. In Novem-ber 2013, SCEC mailed a bill insert to all of its members to assess the members’ level of interest. What they learned was that many members were interested in the Cooperative providing opportunities to participate in solar. The interest was strong enough to justify moving forward with the project, and members generally appreciated the opportunity to contribute to the Cooperative’s increase in its renewable energy portfolio without having to worry about the maintenance and operation of a solar array. However, some members were initially concerned about who would bear the financial burden. As Bolwerk explained, “They came to us asking, ‘Am I paying for this?’ You could see the look of relief on their faces when we said, ‘No. The members who subscribe to it will receive the benefits from it, but it’s not something that other members are on the hook for’.”
The fact that the Sunflower 1 project was being planned at the same time that changes to the net-me-tering rate were being made allowed SCEC to have a more complete view of how its members felt about solar, and to show that the Cooperative was not anti-renewable energy. Although SCEC was hearing negative comments from some members about the perceived decrease in benefits that net-me-tering members would receive under the new rate, other members were clearly indicating that they were supportive of a pro-solar policy as long as members who did not benefit from solar did not have to pay for it. From this, SCEC felt all the more convinced that addressing cost shifting in the net-meter-ing policy was the right thing to do.
How Did SCEC Roll Out the New Rate to its Members?
As the roll-out date approached, SCEC’s communication with its members changed from broad com-munication efforts through its website and customer service representatives to direct, individually tailored contact. “In the months before the new rate was implemented, I sent a letter to each of the DG members we had and made a personal phone call to them explaining the final rate and reviewing their terms for grandfathering,” explained Pendergast. “And I would say three-fourths of them were appreciative of the personal call and acknowledged in some form that we were doing the right thing by implementing the enhanced avoided cost calculation and the excess capacity credit in the summer. So it turned out really well.”

Rate Case Study • 35St. Croix Electric Cooperative
Even the more controversial grid charge went over fairly well. “It was pretty defensible,” said Pen-dergast. “When our monthly service charge was $28.23 a month and then the actual cost was $41…We explained to people that we were collecting that difference in revenue on the energy charge. Most people believed what we told them, and I think they could see it.”
Bolwerk believes that the way the rate was rolled out is yet another example of the Cooperative Dif-ference. “When Mark is taking the time to call these people, first of all, he’s doing it, and second of all they know him, and they do trust what he’s telling them -- he’s not someone in an office somewhere that they’ve never talked to, and I think that’s huge, especially in small towns and communities.”
Lessons Learned Thus Far
SCEC would advise cooperatives who plan to take a similar path that the changes necessary to the billing system can be challenging. When the board of directors decided to allow grandfathering, SCEC faced the problem of adapting its billing system to account for those grandfathered members who would not be subject to the grid charge. SCEC also found it challenging to account for DG sys-tems with characteristics that were different from the norm. For example, there were DG members who had off-peak systems, and one DG account that had four meters. “Taking all those factors into consideration, it was a struggle to get the programming to work out,” said Pendergast.
Pendergast stresses that it is essential to keep in mind where the cooperative optimally will end up in order to facilitate the process:
Looking back, had we known the outcome was going to be so favorable to the members and the Co-operative, it would have been easier. If the members want to add solar, we’re ready to give them the resources and information we can because we have a rate that is equitable in terms of services provid-ed. We didn’t have that before. The end result is that we landed in a good spot. We can promote solar and we can do it without any bias or concerns about the Cooperative.
A difficult lesson to learn was that the negative press caused by a vocal minority will eventually fade if the cooperative is pursuing a path that is fair. In October 2013, an SCEC director discovered a public website that was entirely devoted to criticizing the Cooperative’s solar policy. Around the same time, a local newspaper ran an article that included opinions of SCEC members who were unhappy with the first round of net-metering changes. The article was eventually picked up by Midwest Energy News and Pioneer Press, a St. Paul daily newspaper. This negative coverage was occurring at the same time SCEC was working to offer the Sunflower 1 community solar project to its members. However, rough-ly one year after the news article appeared, a Pioneer Press reporter contacted SCEC for a follow-up story. “After he talked to us and understood our policies and the way things were, the story was very neutral. He found out that there wasn’t much to say about us,” said Bolwerk.
What direction does SCEC plan to take next? A minor change to the net-metering rate may be possible as early as September 2016, when the new Sensus metering system will be in place. At that point, ex-plained Pendergast, “If we want to, we could see when excess production really is occurring and pay a market price based on that, and we could see if there’s actually any excess production during these months we’re paying the premium excess capacity credit.”
Rate Case Study • 36St. Croix Electric Cooperative
Key Takeaways
1. Net-metering policy should be designed with the goal of being fair and equitable to the entire mem-bership. Policy that is created to address the needs of a small segment of the membership during a specific time period could become problematic as trends change over the long run.
2. Once fixed-cost recovery is assured, a cooperative may have greater flexibility in the design of the remaining elements of its net-metering rate. After SCEC implemented a grid charge, it was then able to incorporate capacity credits during peak billing months and enhanced avoided cost rates that con-sider daytime solar hours.
3. With an issue as contentious as net metering, cooperative management should consider directing personalized correspondence toward affected members when implementing policy changes. This not only helps to establish trust, but also acts to counter the potentially biased information that net-meter-ing members may receive from solar advocates.
To learn more about St. Croix Electric Cooperative, contact Dana Bolwerk, Communications & Events Coordina-tor, at [email protected] or visit SCEC’s website at www.scecnet.net.

Rate Case Study Sioux Valley Energy Electric Cooperative

Rate Case Study • 37Sioux Valley Energy Electric Cooperative
Sioux Valley Energy: Assigning Costs Correctly in the Rate StructureIn the mid-1990s, Sioux Valley Energy (SVE or Cooperative) was formed through the merger of Sioux Valley Electric, located in South Dakota, and Southwestern Minnesota Cooperative Electric, located in Minnesota. Almost a decade later, the original rates from the two pre-merger cooperatives were largely still in place. “When we started this process, we had so many different rate tariffs,” explained Debra Biever, SVE’s Director of Customer and Employee Relations. “We had South Dakota rates. We had Minnesota rates. We had a lot of cost shifting occurring.”1 In addition to the financial concerns, SVE felt that the multiplicity of rate tariffs had a divisive impact on the Cooperative’s culture: “It felt like we were operating two separate cooperatives,” said Biever. “Having completely different rates for Minnesota and South Dakota only enhanced that division.” Believing that the variation that existed between the rates was too great to be eliminated through a single rate adjustment, SVE began to outline a multi-year process to simplify its tariffs and establish equity between its members.
Who is Sioux Valley Energy?
SVE’s origins can be traced back to 1938, when the Sioux Valley Electric Association (SVEA) was organized in Brookings, South Dakota. SVEA and two other newly organized cooperatives, East Central South Dakota Electric Association and the Sioux Empire Electric Association, had taken initial steps toward receiving loans from the Rural Electrification Administration (REA) when, in December of 1939, the three organizations decided to merge to form the Sioux Valley Empire Electric Association, Inc. Headquarters for the newly formed organization were placed in Colman, South Dakota, where they remain today.
Sioux Valley’s first line pole was set on May 17, 1940. By the end of 1941, the Cooperative was providing service to 748 members located in the counties of Brookings, Lake, Moody, Minnehaha, and part of Kingsbury. In the years that followed, construction increased rapidly. By 1949, Sioux Valley had amassed approximately 3,800 members, making it the largest cooperative in South Dakota -- a position it still holds today.
On September 25, 1995, a merger between Sioux Valley and Southwestern Minnesota Cooperative Electric was approved. The resulting cooperative, Sioux Valley-Southwestern Electric Cooperative, was serving over 17,000 members as of January 1, 1996. Today, the unregulated Cooperative conducts business as Sioux Valley Energy and provides service to over 23,000 members in the South Dakota counties of Brookings, Lake, Moody, Minnehaha, and Eastern Kingsbury, and in the Minnesota counties of Pipestone and Rock.
State: South Dakota & Minnesota
Membership: 23,000
Wholesale Supplier: East River Electric Power
Cooperative and L&O
Transmission Market: SPP
Regulation: Unregulated
SVE Key Facts
1 Phone interview between Tim McCarthy, CEO; Debra Biever, Director of Customer and Employee Relations; and Power System Engineering, Inc. conducted on May 13, 2016. All citations from McCarthy and Biever come from this interview, unless otherwise noted.

Rate Case Study • 38Sioux Valley Energy Electric Cooperative
SVE has deployed advanced metering infrastructure (AMI) throughout its service area. SVE uses AMI for several functions: to help in collections with remote disconnects and reconnects; to support its Prepaid Metering program; and to strengthen its Outage Management System (OMS). SVE has seen significant labor efficiencies as a result of both the remote disconnect/reconnect function and Prepaid Metering program. AMI’s effect on the OMS has been to allow the Cooperative to quickly identify the scope of an outage and whether it occurs on the utility or customer side of a meter, thus helping to decrease outage time. Additionally, the diagnostic tools that AMI brings to the OMS allow the Cooperative to better identify problem areas so that future replacements will occur more efficiently.
SVE receives wholesale power from East River Electric Power Cooperative and L&O Power Cooperative. The majority of the generation comes from Basin Electric Power Cooperative (Basin). Basin serves 138 consumer-owned member cooperative systems in parts of Colorado, Iowa, Minnesota, Montana, Nebraska, New Mexico, North Dakota, South Dakota, and Wyoming. Basin’s members serve over 2.9 million consumers across 540,000 square miles.2
What Prompted Reassessing the Rate Structure?
The merger that formed SVE left the utility with 41 different rate tariffs. “We had so many different rates,” said Biever. “It was complicated. We had rates with five declining rate blocks.” SVE wanted to consolidate its tariffs to make them more manageable for the Cooperative. SVE also believed that the rates no longer fairly recovered costs, and that both intra- and inter-class cost shifting was occurring. “The driver really was fairness to members as far as recovering what’s in the rate class and across rate classes,” said Biever.
SVE began working with consulting firm Power System Engineering, Inc. (PSE), who would conduct a cost-of-service study and rate design planning process with periodic updates throughout the multi-year process of adjusting rates.3 The initial cost-of-service study highlighted a missing element of SVE’s rates that the Cooperative had suspected was needed for equitable cost recovery: “Prior to [2007] we had a minimum bill, but our customers did not have a basic service charge,” explained Biever.
The New Rate Structure: Decision Making to Position SVE for the Future
SVE began by replacing many minimum charges in their existing tariffs with basic service charges. Although several tariffs were changed, SVE’s Farm and Rural Residential Rate will be presented in detail here because it underwent the greatest amount of change over the following decade. Currently, approximately 44 percent of SVE’s meters are subject to this rate. The table below summarizes the Farm and Rural Residential Rate as it was in 2005, before the rate-adjustment process began:
2 For more information on Basin, visit www.basinelectric.com/index.html. 3 For more information on PSE, visit www.powersystem.org.
Minimum Charge (5kVA) $13.50 per month
MInimum Charge (>5kVA) $1.10 per kVA per month
Energy
First 50 kWh $0.2700 per kWh
Next 50 kWh $0.13000 per kWh
Next 400 kWh $0.09300 per kWh
Next 1,000 kWh $0.07500 per kWh
Over 1,500 kWh $0.06750 per kWh
2005 Farm and Rural Residential Rate

Rate Case Study • 39Sioux Valley Energy Electric Cooperative
Presented below, SVE’s initial change to the Farm and Rural Residential Rate reduced the five-block structure for energy to three blocks, and replaced the minimum charge with a basic service charge.
This initial step was designed to serve as a bridge between the old Farm and Rural Residential tariff and more comprehensive updates in the future. It placed greater emphasis on fixed cost recovery through the basic service charge and reduced the variation in the volumetric energy charge (i.e., the per kWh charge). However, the cost of service studies that SVE had commissioned indicated that significant changes would be necessary in order to properly allocate cost recovery between the fixed and volumetric charges. With the help of its consultant, SVE planned a series of adjustments beginning in 2009, the final of which was made in 2016. The changes progressively shifted a greater proportion of fixed cost recovery toward the basic service charge while simplifying the volumetric rate and adjusting the three blocks, as shown below:
Although not discussed in detail in this case study, several rate schedules were adjusted in a similar way. For example, the Residential Rate gradually moved from a monthly basic service charge of $11.50 in 2009 to a charge of $18.50 in 2016, while the volumetric charge for Residential was changed from a declining block structure to a uniform rate. Currently, roughly 45 percent of SVE’s meters are subject to this rate. The changes to the Residential Rate are shown in the table below:
Basic Service Charge
Single Phase $17.00 per month
Three Phase $35.00 per month
Energy Charge
First 500 kWh $0.09500 per kWh
Next 4,500 kWh $0.07500 per kWh
Excess $0.06100 per kWh
2007 Farm and Rural Residential Rate
2009 2010 2011 2012 2013 2016
Basic Service Charge
Single Phase (per month) $20.00 $25.00 $30.00 $35.00 $40.00 $50.00
Three Phase (per month) $40.00 $50.00 $60.00 $70.00 $80.00 $90.00
Energy Charge
First 500 kWh (per kWh) $010400 $0.10380 $0.10380 $0.10480 $0.10550 $0.09100
Next 1,000 kWh (per kWh) $0.08300 $0.08670 $0.09190 $0.09480 $0.09340 $0.09100
Excess (per kWh) $0.06600 $0.06800 $0.07460 $0.08540 $0.09340 $0.09100
Farm and Rural Residential Rate
2009 2010 2011 2012 2013 2016
Basic Service Charge $11.50 $12.50 $13.50 $15.00 $16.50 $18.50
Area Lighting – $ 2.37 $ 2.60 $ 2.86 $ 3.15 $ 3.15
Energy Charge
Flat Charge – – – – $0.09340 $0.09100
First 500 kWh (per kWh) $0.08300 $0.08670 $0.9190 $0.09480 – –
Excess (per kWh) $0.06600 $0.06800 $0.07460 $0.08540 – –
Residential Rate

Rate Case Study • 40Sioux Valley Energy Electric Cooperative
Another example is the General Service Rate, which also saw increases in the basic service charge while the volumetric charge moved from a declining block structure to a uniform rate. Approximately 9 percent of SVE’s meters are subject to this rate. The changes to the General Service Rate are shown in the table below:
Educating and Communicating with Member-Consumers
SVE’s multi-year approach has required a continuous and patient education effort in order to prepare members for almost yearly rate adjustments and he¬lp them avoid the type of fatigue and frustration that could potentially have arisen if they had not understood why the changes needed to be made. Said Biever:
It was incredibly important to explain what the cost of service study was, what the outcome of the study was and the philosophy behind it. We started with the cost of service study so that they understood how costs are allocated. It was very complex and complicated, but we tried to break it down and just cover it, and we are still doing that today. That’s one of the keys: you can’t just throw this at the board, the members, or employees and expect them to understand it all the first time through. We broke it down. We would cover it over a couple of months, and we would repeatedly present this. We have a rate update meeting every year for sure, but we also just finished conducting what we call a mini-seminar with our board on rates even though we just covered this a few months ago. We’re getting in front of our board several times a year.
SVE’s CEO Tim McCarthy added, “We’ve done that mini-seminar three times since I’ve been here, and I’ve been here for just over three years. This is on top of all the other messages.” SVE has used multiple methods to reach as many members as possible. Biever explained:
Some of the keys behind this process are first of all educating the board on what the basic service charge is and what it covers, and then educating our employees so that they also under-stand and can explain it and support it when talking to our members. And when we instituted the basic service charge back in 2007, we also sent bill stuffers, wrote newsletter articles, and talked at district meetings. Our meetings are a little bit different than some co-ops. We’re in front of the members at their individual districts once a year. We also spoke about the basic ser-vice charge at the annual meeting, and in addition, for those large power rates that we restruc-tured, we actually did account visits with our larger, key accounts face-to-face.
2009 2010 2011 2012 2013 2016
Basic Service Charge
Single Phase (per month) $26.00 $30.50 $35.50 $40.50 $45.50 $50.00
Three Phase (per month) $55.00 $61.00 $71.00 $81.00 $91.00 $90.00
Area Lighting – $ 2.37 $ 2.60 $ 2.86 $ 3.15 $ 3.15
Energy Charge
Flat Charge – – – – – $0.09100
First 500 kWh (per kWh) $0.10400 $0.10380 $0.10380 $0.10480 $0.10550 –
Next 4,500 kWh (per kWh) $0.07900 $0.08280 $0.08300 $0.08980 – –
Excess (per kWh) $0.06600 $0.06800 $0.07460 $0.08540 $0.09340 –
General Service Rate
Rate Case Study • 41Sioux Valley Energy Electric Cooperative
SVE also obtained valuable information from its Member Advisory Council (MAC), which is a group made up of members from across SVE’s different districts. MAC members are appointed by board directors and serve three-year terms. Each district is represented by three to five members, who are eligible for reappointment at the term’s end. SVE meets with this group roughly four times a year. “Whenever we had a big philosophical change to make in our rate structures, we would get in front of that Member Advisory Council to run it by them,” noted Biever. “We then had that input of how the change was going to be perceived by our members and what recommendations they had. We really took that to heart, and that helped guide us as well.”
SVE believes that to truly educate board members and consumers about rate design, rates must be discussed regularly, regardless of whether an adjustment is being considered. “We make it part of our strategic planning discussions,” said Biever. “During almost every strategic planning meeting we’ve had, rates are definitely one of the items identified, and I think that’s appropriate. The board needs to understand that when you’re thinking of strategic objectives and ultimate outcomes, that’s when you really need to start thinking about rates -- not just when you need a rate increase.”
Rate education that occurs outside the need for a general adjustment may have the advantage of being perceived more favorably than rate education conducted to accompany a rate increase, which consum-ers may view negatively. In SVE’s case, the informed perspective that the board and Member Advi-sory Council developed regarding rate design led to an unexpected situation. Explained McCarthy, “I think one of our biggest surprises was, once we got them educated, how aggressive the Member Advisory Council and the board were willing to be in moving those charges.”
“In 2010, when we really started to aggressively think about an approach with our basic service charges going forward five years, we actually recommended a less aggressive option, and the board overruled us,” added Biever. “They said, ‘no, we need to do what’s right and we need to get these rates in alignment with those fixed costs,’ and they elected to go with the more aggressive option, which we fully supported but hadn’t thought they were ready for. They surprised us with their commitment to going forward with that.”
“A similar thing happened this year,” explained McCarthy. “We moved our fixed charges on our basic residential rates up to cover around 83 percent of the fixed costs, and we had board members who said, ‘why not just go to 100 percent?’”
“We had to remind them that this isn’t an exact science either,” added Biever. “It’s based on assump-tions and allocations. We’re going to go this far, but we’re not quite ready to go to what the cost of service study shows was 100 percent.”
How Did SVE Roll Out the New Rates to its Consumers?
Although SVE’s multi-year rate adjustments were announced well in advance through education ef-forts, implementing a succession of rate changes ran the risk of provoking rate-adjustment fatigue. In 2010, after SVE had made its third increase to the basic service charge, the Cooperative received quite a bit of backlash from the changes. “We questioned if we had been too aggressive,” explained Biever. “We went back to square one, and we talked about why we had made the changes. We looked through our original presentation and talked about what was driving these adjustments, and then it became clear. We were on the right path and we needed to stay on it, and our reasons for choosing it were still valid.”

Rate Case Study • 42Sioux Valley Energy Electric Cooperative
As more adjustments were made, SVE continued to communicate the reasons it had undertaken the changes. Rather than seeing an increase in customer concerns, updated rates were implemented with fewer and fewer complaints. “When we made the change from $35 to $40 for Farm and Rural Residen-tial, we received much fewer calls,” said Biever about the basic-service charge increase leading into 2013. “They knew what to expect and when it was coming.”
SVE held the rates constant during 2014 and 2015, and then implemented the final planned basic-ser-vice charge increase of $10 this year along with a volumetric charge adjustment. “Now I think the members truly understand what the basic service charge is paying for and we’re not hearing com-plaints as much today,” said Biever.
Lessons Learned Thus Far
Even though SVE adopted a basic service charge that has more than doubled over the last five years, SVE’s American Customer Satisfaction Index (ACSI) scores have remained strong over the same pe-riod. Additionally, SVE believes the changes in the rates have been financially successful in that the basic service charge is now recovering a higher percentage of fixed costs and doing so in a way that is fair to members both between and within rate classes. The lesson to take away from this is not, how-ever, that the Cooperative has now reached an acceptable steady state. “Rate design is never done,” said Biever.
“I think it’s been very successful up to this point,” added McCarthy. “I think it’s on us to make sure it continues to be successful by continuing with the education and making sure we’re recalibrating all the time. If we come to a point where things have changed environmentally and an aspect of this philosophy no longer works, we’ve got to come up with something new that will work. You’ve got to be open-minded, to really go back and reassess and self-evaluate all the time.”
Key Takeaways
1. Cooperatives should provide rate education for board members and other stakeholders on a regular basis whether or not a rate adjustment is on the horizon. SVE treated rate education as a necessary component of strategic planning. As a result, the SVE Board of Directors and the Member Advisory Council were comfortable with the Cooperative’s new design and even showed willingness to make greater adjustments than management had proposed.
2. Education is one of the keys to avoiding rate-adjustment fatigue among members. SVE’s multi-ple-year adjustment process was regularly reinforced by education efforts that showed the fairness of the changes. As successive adjustments were made, the number of complaints SVE received decreased and its ACSI scores remained strong.
3. Cooperatives should not remain locked into their initial rate strategies if their operating environ-ments change to the detriment of their rates. Rates should be revisited regularly to insure that the assumptions on which they were designed are still valid.
For more information about Sioux Valley Electric, contact Debra Biever, Director of Customer and Employee Relations, at [email protected] or visit SVE’s website at www.siouxvalleyenergy.com.

Rate Case Study Washington Electric Cooperative

Rate Case Study • 43Washington Electric Cooperative
Washington Electric Cooperative: Operating in a Challenging Net-Metering EnvironmentBy mid-2013, Washington Electric Cooperative, Inc. (WEC or Cooperative) had already greatly exceeded Vermont’s net-metering cap of four percent of peak demand, and growth showed no signs of slowing. When newly appointed General Manager Patricia (Patty) Richards reviewed WEC’s net-metering penetration, she learned that WEC was already at ten percent of peak demand. With new net-metering legislation on the horizon and increasing concerns over cost shifting, Richards believed that WEC’s net-metering policy was not sustainable and headed in the wrong direction. WEC temporarily suspended acceptance of new net-metering applications due to being way over the cap instituted by state law and decided to take a strategic look at the direction Vermont lawmakers wanted to take.
Who is Washington Electric Cooperative?WEC’s system was energized on December 2, 1939. Its diesel-generated power provided electricity to 150 farms and homes over 55 miles of distribution line. Today, the diesel generators have been replaced by renewable energy resources. WEC owns and operates both the Wrightsville hydroelectric generating station (a store-and-release plant that has a nominal output of 800 kW) and a landfill-gas-to-energy facility with five engines at Vermont’s largest landfill in Coventry (totaling 8 MW). The latter provides enough electricity to meet roughly two-thirds of WEC’s members’ needs. The approximately 38 percent of WEC’s remaining energy needs are fulfilled through contracts for electricity generated from wind, hydro, and biomass.
Fully regulated by the Vermont Public Service board (PSB), WEC provides service to over 10,800 members, 97 percent of whom are residential consumers. WEC’s service area is spread over 2,728 square miles of north-central Vermont in the counties of Washington, Orange, Caledonia, and Orleans. It delivers electricity through 1,200 miles of distribution line, with eight substations. WEC has deployed smart meters throughout its system.
With its largest commercial load being a high school, WEC exhibits what Richards calls a classic residential load profile for the Northeast. The system peak of approximately 16 megawatts (MW) occurs in the winter.1
What Prompted Reassessing the Rate Structure?On April 1, 2014, the Vermont Legislature passed Act 99. This new legislation raised the cap on net metering for state utilities from four percent to 15 percent of peak demand. Several utilities that, like WEC, had reached the previous cap and suspended net-metering applications began offering net metering to consumers again.
For WEC, a rare opportunity presented itself through Act 99’s Achievement Provision, which stipulated that utilities that received more than 90 percent of their power supply from renewable resources and that met 10 percent of their peak demand with net metering systems qualified to design their own net-metering programs. Of Vermont’s 16 electric utilities, only WEC met those criteria.
State: Vermont
Membership: 10,500
Wholesale Supplier: Ownership of generation
Transmission Market: ISO New England
Regulation: Regulated
WEC Key Facts
1 Washington Electric Cooperative, Inc. Co-op Currents: The newsletter of the Washington Electric Cooperative, Inc. East Montpelier, Vermont. July/August 2013. P. 5

Rate Case Study • 44Washington Electric Cooperative
The opportunity to design its own net-metering program offered WEC the chance to test the market and fix aspects of the former program that were deemed ineffective. However, WEC first had to define what it believed had not worked so far. After in-house analysis, WEC determined that it had lost money on the previous program to the tune of a 1.3% rate increase. WEC noted that net-metering consumers who produced more kilowatt hours (kWh) than they consumed were able to “zero” out the customer portion of their bills that would otherwise have gone toward paying the fixed costs that the Cooperative must incur to provide service to its members. The net-metering consumers were able to do this because they were receiving a credit per kWh produced that was applied to their entire bill—not just the energy, or kWh, portion of the bill. When net-metering consumers produced excess kWh, the credit they received allowed them to eliminate their share of costs such as infrastructure and billing—costs that the utility could not avoid and that were not reduced by the presence of rooftop solar. These unavoidable costs were being shifted to non-net-metering consumers through higher rates even though the net-metering customers still relied on this infrastructure to keep their homes powered 24/7.
Richards wanted to capitalize on the opportunity afforded by Act 99’s Achievement Provision to design a program that resulted in financial improvement for the Cooperative and that was fair and balanced to both net-metering and non-net-metering consumers. The message to her colleagues was simple: “Let’s get a new design that minimizes cost shift between consumers.”2 WEC’s Board of Directors had been concerned from the beginning with the financial impacts of the old net-metering programs and were therefore enthusiastic about the possibility of change.
The New Rate Structure: Treating All Members Equitably An important principle that would guide WEC’s new program was that all members, including those who chose to net meter, should pay a customer charge. The distribution infrastructure, billing function, and other services provided by WEC not only make it possible for regular consumers to receive service, but also make it possible for net-metering consumers to sell excess energy to the Cooperative and receive service when they are unable to supply themselves electricity. To prevent net-metering consumers from both avoiding their cost of service and shifting that cost to non-net-metering consumers, WEC decided that the customer charge must be paid in full by all members. “Zeroing” out or reducing the customer charge through excess kWh production would no longer be possible. Similarly, every member would also have to pay the full amount of the mandated energy efficiency charge that supports Efficiency Vermont, a statewide energy efficiency utility established by the PSB and funded by a volumetric charge added to all Vermonters’ electric bills.
The new approach to the customer charge did not, however, fully address the issue of holding each member responsible for the costs that their connection to the electricity grid causes the Cooperative to incur. This is because WEC was still recovering substantial fixed costs through volumetric charges (i.e., cost per kWh). WEC’s members pay a relatively low customer charge of $12.24. The following table summarizes WEC’s Farm and Residential rate:3
2 Ibid.3 Source: http://www.washingtonelectric.coop/wp-content/uploads/2011/03/Website-Rate-Schedule-2014-edited.pdf; Retrieved April 29, 2016.
Charge Amount
Monthly Customer Charge $12.24
Energy Charge
First 200 kWh/Month $0.09790 per kWh
Over 200 kWh/Month $0.21859 per kWh
Farm and Rural Residential Rate
Rate Case Study • 45Washington Electric Cooperative
An additional design mechanism was necessary to insure that cross-subsidization was not taking place. WEC approached the problem by calculating wha¬t rooftop solar was worth to the utility. “Solar panels provide savings for the utility. We save 9.6 cents from market charges from ISO in New England, plus we get RECS with our new program,” Richards said.4 WEC added an admittedly generous six cents per kWh to represent the value of the RECS for a total value of 15.6 cents. WEC’s volumetric rate for farm and residential members was approximately 21 cents per kWh, meaning that WEC lost approximately five cents for every kWh produced by solar net-metering consumers.
To make up for this loss, WEC decided to implement a grid service fee of approximately 5 cents for every kWh generated by distributed generation (DG). The total amount of charges from the grid service fee would reflect the gross amount of kWh produced multiplied by the grid service fee, from which is then subtracted the customer charge—but in no case would the total be less than $0. Therefore, net metered members pay a grid fee for generation over and above 255 kWh. This grid fee is essentially the cost to the member to have WEC act as the backup or battery for their home generation based system. The need to measure a net-metering system’s gross kWh production resulted in the requirement of a second meter, entailing a one-time cost of approximately $223 (this amount includes installation).
Many of the remaining design elements were adopted from Act 99’s design. For example, both program designs provided monetary credits for excess generation that were “banked” to offset future kWh purchases. The credits expired after 12 months, thereby providing incentive for net-metering customers to size their systems according to their own use. Indeed, if the credits from kWh that are generated beyond consumers’ needs have no value after 12 months, then there is no financial incentive for consumers to purchase more solar panels than the amount needed to cover their own needs. To set the credit amount, WEC decided it would be appropriate to adopt the same rates stipulated in Act 99 at which net-metering consumers were credited for excess generation; this would insure that net-metering consumers throughout the state would know that they were receiving rates that were comparable to those received by consumers at neighboring utilities. Owners of systems smaller than 15 kW would be credited at a rate of 20 cents per kWh; owners of systems larger than 15 kW, at 19 cents.
With the new design nearing completion, Richards felt strongly that an additional element was necessary: the plan should be prospective rather than retroactive. “We can’t go back in time and ding someone for financial decisions they made in the past. People made a decision to build based on a different structure. It’s like pulling the rug out from underneath them,” she said.
The final net-metering rate design is presented below along with two examples of how the rate functions under different usage levels:5
4 Phone interview between WEC GM Patricia Richards and Power System Engineering, Inc., on April 11, 2016. All cita-tions from Richards are from this interview, unless otherwise noted.5 Source: http://www.washingtonelectric.coop/wp-content/uploads/2011/06/WELCOME-TO-WEC-NM-v.5-Nov-15.pdf, p. 4

Rate Case Study • 46Washington Electric Cooperative
Monthly Member Charge $12.24
1st 200 kWh/month rate $0.09790
Over 200 kWh/month rate $0.21859
EVT (Efficiently Vermont) Rate $0.01173
NM Grid Service Fee $0.04805
Net Excess Generation < 15 kW system $0.20000
Net Excess Generation > 15 kW system $0.19000
WEC Residential Net Metering Rate
Before DG After DG
Use kWh at Premises 500 500
Production kWh at DG system NA 300
Member Service Fee $12.24 $12.24
Grid Service Fee NA $2.18
Energy Charge ist Block $19.58 $19.58
Energy Charge 2nd Block $65.58 –
EVT (Efficiency Vermont) Rate $5.87 $2.35
Bill $103.26 $36.34
Banked amount to NM Credit –
Example #1 - Use is greater than production(Assumption: DG system < 15 kW)
Before DG After DG
Use kWh at Premises 500 500
Production kWh at DG system NA 600
Member Service Fee $12.24 $12.24
Grid Service Fee NA $16.59
Energy Charge 1st Block $19.58 0
Energy Charge 2nd Block $65.58 0
EVT (Efficiency Vermont) Rate $5.87 0
Bill $103.26 $28.83
Banked amount to NM Credit $20.00
Example #2 - Use is less than production(Assumption: DG system < 15 kW)

Rate Case Study • 47Washington Electric Cooperative
In example 1 above, the after-DG grid charge was calculated as follows:
In example 2 above, the after-DG grid charge was calculated as follows:
Educating and Communicating with Member-Consumers
Solar net metering has sparked a heated national debate, and owing to both the financial commitment and social engagement of net-metering customers, policy that is perceived as unfavorable to DG can sometimes result in angst among members and the solar industry, as has recently been exemplified in Nevada.6 WEC knew that to promote understanding of the new design, it would be essential to involve stakeholders from the beginning.
Delivering a consistent message involves keeping people informed throughout the rate-design process. WEC’s Board of Directors was involved from very early on because the directors had recognized that there was a problem with the old net-metering rate—a problem which was verified with clear analysis. Again, Richards emphasizes the importance of fairness when undertaking analysis that may result in policy changes: “The utility does save some money when someone installs solar. Don’t make up the number. Base it on what the technology is worth in the marketplace.”
WEC informed its members of the need for change early on. WEC strongly believes in keeping its members aware of industry concerns, and one way WEC accomplishes this is through its newsletter, Co-op Currents, a high-quality publication with an enviable 75 to 80 percent member readership. The newsletter is ten pages in average length and features articles of diverse subjects, such as “Local Food and the Local Economy” and “Just a Lineman in the Rain”. Importantly, WEC’s managers are both featured in and write articles for Co-op Currents. Net-metering articles penned by Barry Bernstein, President of WEC’s Board of Directors, appeared from the beginning of the process, explaining, in plain language, the problems presented by the old net-metering program and the path WEC needed to take to arrive at a fair and just conclusion.
6 http://www.utilitydive.com/news/armed-observers-heighten-tensions-in-nevada-solar-net-metering-debate/413821/
After DG
Production kWh at DG system 300
Multiply: NM Grid Service Fee/kWh x $0.04805
$14.42
Subtract: Member Service Fee - $12.24
Grid Service Fee $ 2.18
Calculation of the Grid Service Fee from Example 1
After DG
Production kWh at DG system 600
Multiply: NM Grid Service Fee/kWh x $0.04805
$28.83
Subtract: Member Service Fee - $12.24
Grid Service Fee $16.59
Calculation of the Grid Service Fee from Example 2

Rate Case Study • 48Washington Electric Cooperative
How Did WEC Roll Out the New Rate?
Electric cooperatives in Vermont are fully regulated by the PSB, so after WEC had designed the new net-metering program, it petitioned lawmakers in August of 2013. The legislative process took a year, but eventually the new rate received approval.
As WEC began rolling out the program, it encountered unexpected difficulty implementing the new program design on its billing system. This problem, according to Richards, was the “biggest hurdle of the whole thing. If the billing system can’t handle it, you’ve got to do it by hand on the side. We got it figured out, but it took a long time and wasn’t simple.” Doing the calculation by hand presented customer-relations challenges: “If someone says they think they don’t have the right bill, they lose confidence in the utility.”
An important internal objective was to insure that staff could explain the changes to members. Said Richards, “We did general education, including for the linemen. Communication of the change has to be clear throughout the organization.” Richards emphasized that internal education is an ongoing process that can be challenging. Staff’s ability to accurately communicate information about the new program during the roll out was important, because WEC relied on one-on-one discussions with potential net-metering consumers rather than on town-hall meetings or workshops. When consumers called for information, WEC’s employees were expected to be able to walk them through the math to illustrate how net metering would work for them.
Richards emphasizes that it is important to keep telling the same story to the members: it is about fairness and equity. One member should not have to help pay for another member’s solar panels. “I think we lost the PR battle with some solar customers,” said Richards, “but won the battle with people who didn’t want to pay for other people’s solar.”
State Policy Changes Undermine WEC Program
Vermont’s Act 99 instructed the PSB to redesign the net-metering program for implementation on January 1, 2017—a date chosen to correspond to the then-anticipated expiration of federal tax credits for renewable energy systems, which could have affected solar participation rates. Although the tax credits have since been extended, Vermont’s net-metering redesign is currently underway as scheduled. The current draft of the program would override Act 99’s Achievement Provision, which gave WEC the opportunity to design its own net-metering program. This has potentially negative implications for WEC’s unique program, but until the Cooperative knows what the final rules are, it will have to wait to design a new program.
“We have to change again to comply with new rules,” said Richards. “We are going to have to do what everyone else is doing unless the board allows utilities to design their own programs that the law allows. We are already 100 percent renewable and have been telling our story as to why we are unique and should be allowed to do things differently.”
The new rule, the final version of which is due this summer, will most likely propose a very different version of net metering from the one WEC carefully designed. Explained Richards, “We don’t know if the draft rules will allow grid service fees or for WEC to design its own unique program. We are simply waiting to hear from the PSB.” Reaffirming Cooperative Values
Reaffirming Cooperative Values
WEC’s members receive electricity generated from 100 percent renewable resources. Many solar net-metering consumers pride themselves on replacing energy generated from fossil fuels with clean energy. On WEC’s system, however, solar-generated electricity replaces electricity from other renewable resources. A skeptic might wonder why WEC is so concerned with providing this option to its consumers in the first place—but not Richards: “We’re owned by our members, and our goal is to offer programs that the membership wants. WEC members who are excited and passionate about generating their own power and being more self-sufficient should have that opportunity.”7
Richards emphasizes that WEC is very pro-solar, but that policy decisions need to take place in the context of overall Cooperative membership. “We want to put forward a program that makes sense for everybody.”
Over the last two years, WEC has had the luxury of promoting a program it believes achieves that goal. The impending legislation that will guide the new net-metering program, however, may cut a very different path for WEC and the rest of Vermont’s electric utilities.
Key Takeaways
1. When addressing cost shifting, delivering a message of fairness and equity helps members understand that rate changes are being made to benefit the overall membership, not just to address concerns relating to a particular segment of the membership.
2. The rate at which DG customers are reimbursed for production should be determined by quantitative analysis. DG solar has a value, but that value should be determined specifically for each cooperative.
3. In an environment of changing legislative policy, it is important to consider that members who installed solar DG under one set of conditions may feel slighted if those conditions suddenly change unfavorably for them. WEC enacted limited grandfathering in order to be fair to these customers.
To learn more about Washington EC, contact Patricia Richards, CEO, at [email protected] or visit Washington’s website at www.washingtonelectric.coop.
7 Washington Electric Cooperative, Inc. Co-op Currents: The newsletter of the Washington Electric Cooperative, Inc. East Montpelier, Vermont. June 2014. P. 10


![Job Interview Tips | Interview Dress Code | Interview Questions [carocks.wordpress.com]](https://img.pdfslide.net/doc/110x75/587f73e91a28ab3f4e8b4c7b/job-interview-tips-interview-dress-code-interview-questions-carockswordpresscom.jpg)