Embed Size (px)
Citation preview
Rate versus Risk• Two basic measures of the occurrence of
new events (disease)– Cumulative incidence=Risk=Probability– Incidence rate=Rate=events per time units
• Last week we discussed the concept of cumulative incidence– Commonly calculated by the Kaplan-Meier
method when different follow-up times exist
• Incidence rate of disease is somewhat less intuitive but is the more fundamental measure
Main Points to be Covered
• Difference between cumulative incidence and person-time incidence rate
• Calculating a person-time incidence rate• Uses of person-time incidence rates• Relation of incidence rate to cumulative
incidence• STATA commands for rates• Assumptions of survival analysis
The Three Elements in Measures of Disease Incidence
• E = an event = a disease diagnosis or death
• N = number of at-risk persons in the population under study
• T = time period during which the events are observed
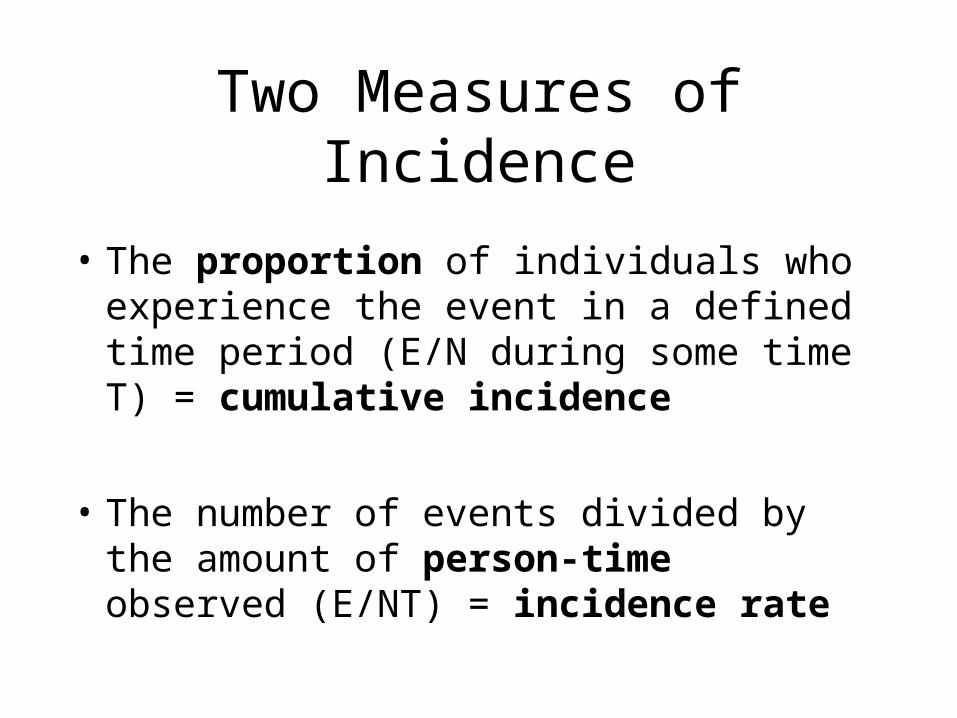
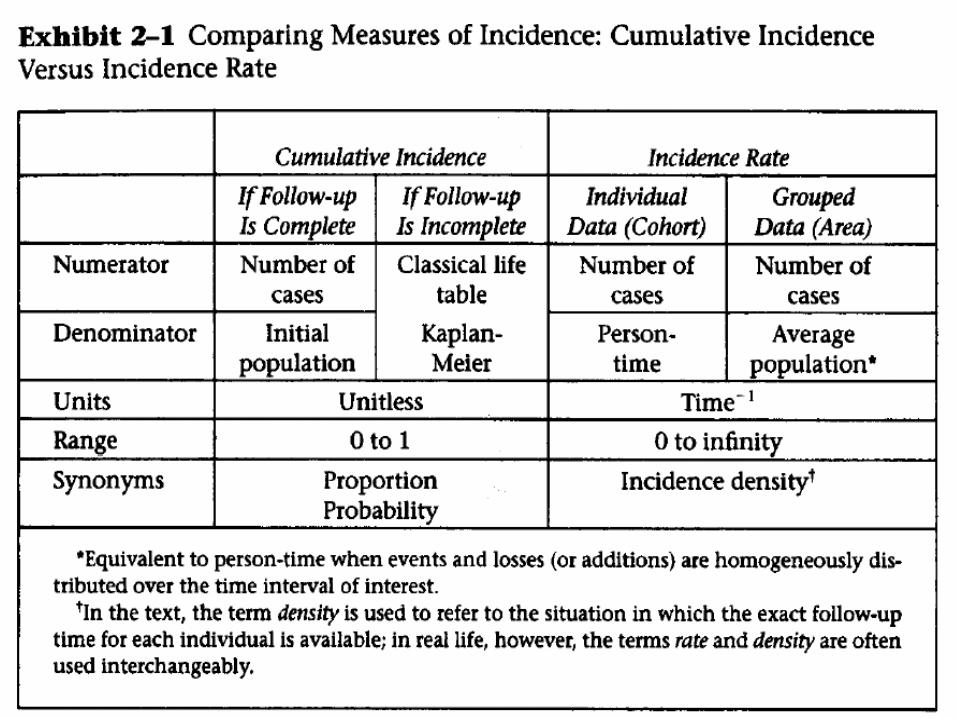
Two Measures of Incidence
• The proportion of individuals who experience the event in a defined time period (E/N during some time T) = cumulative incidence
• The number of events divided by the amount of person-time observed (E/NT) = incidence rate
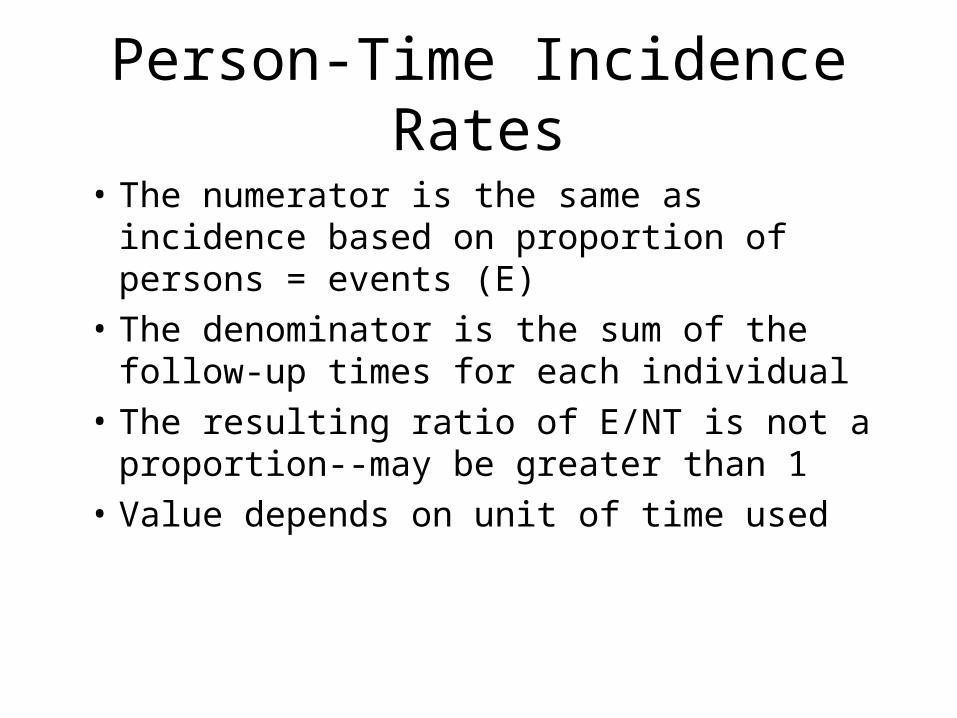
Person-Time Incidence Rates
• The numerator is the same as incidence based on proportion of persons = events (E)
• The denominator is the sum of the follow-up times for each individual
• The resulting ratio of E/NT is not a proportion--may be greater than 1
• Value depends on unit of time used
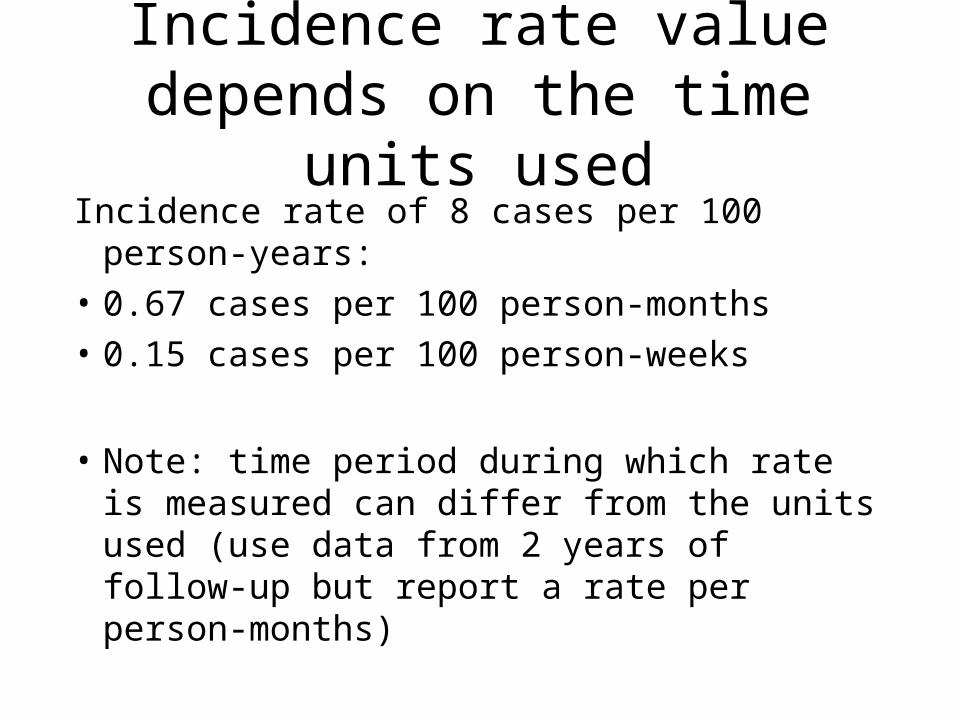
Incidence rate value depends on the time units used
Incidence rate of 8 cases per 100 person-years:
• 0.67 cases per 100 person-months
• 0.15 cases per 100 person-weeks
• Note: time period during which rate is measured can differ from the units used (use data from 2 years of follow-up but report a rate per person-months)
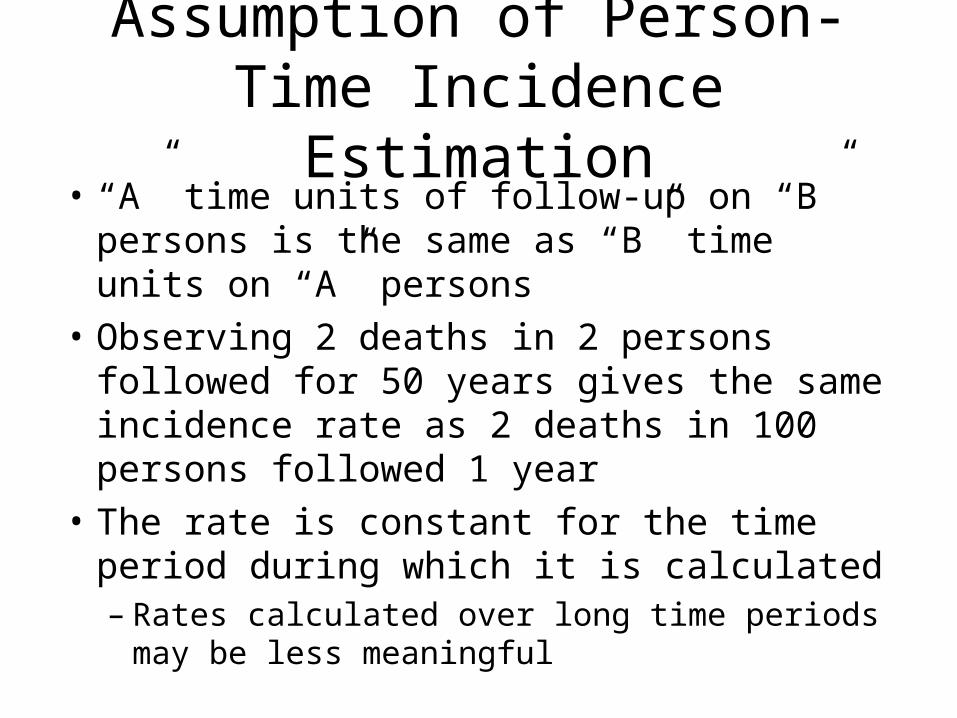
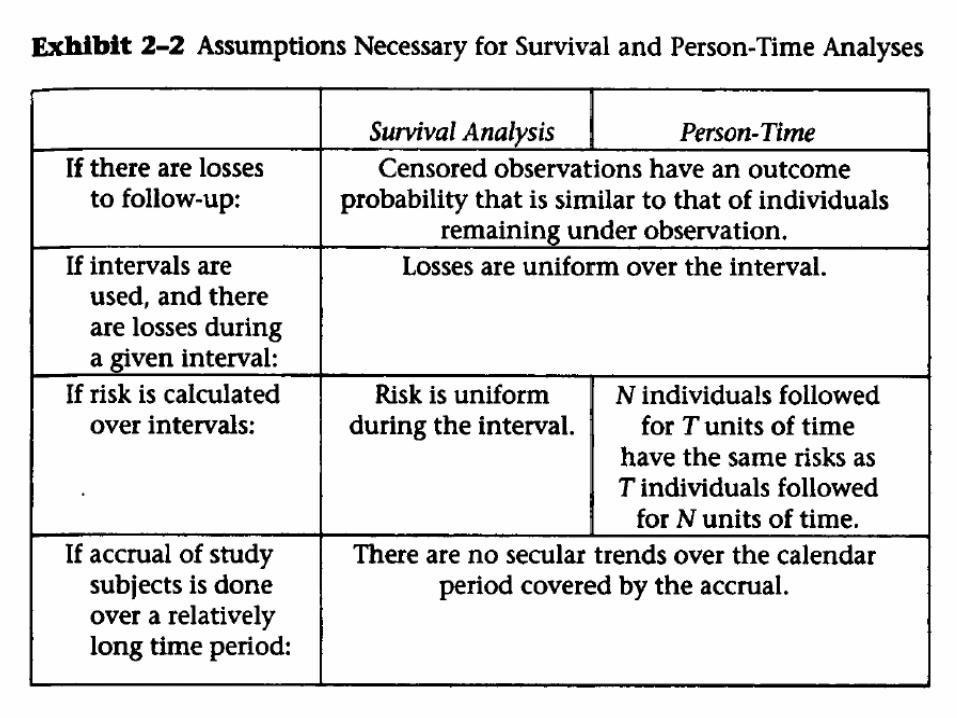
Assumption of Person-Time Incidence Estimation
• “A” time units of follow-up on “B” persons is the same as “B” time units on “A” persons
• Observing 2 deaths in 2 persons followed for 50 years gives the same incidence rate as 2 deaths in 100 persons followed 1 year
• The rate is constant for the time period during which it is calculated– Rates calculated over long time periods may be
less meaningful
Understanding the Difference between a Rate and Cumulative Incidence
• Rate can be thought of as how likely an event is to happen at any moment in time
• Cumulative incidence is the result of applying that rate to a defined population for a specified period of time
• A rate is calculated by using data from a time period, but the rate is assumed constant during that period (i.e., at any moment in time during the period the rate is the same)
Illustration of Rate versus Cumulative Incidence
• The mortality rate in the U.S. population in 2001 was 855 per 100,000 person-years (or 0.855 per 100 person-years)
• If everyone alive at the beginning of the year were followed for 5 years, the cumulative incidence of death (if the rate held constant) would be 4.2% at 5 years; at 10 years it would be 8.2%.
Relationship between Incidence Rate and Cumulative Incidence
• If time period is short, incidence rate and cumulative incidence will be close
• If rate is low, incidence rate and cumulative incidence will be close (unless study period is long)
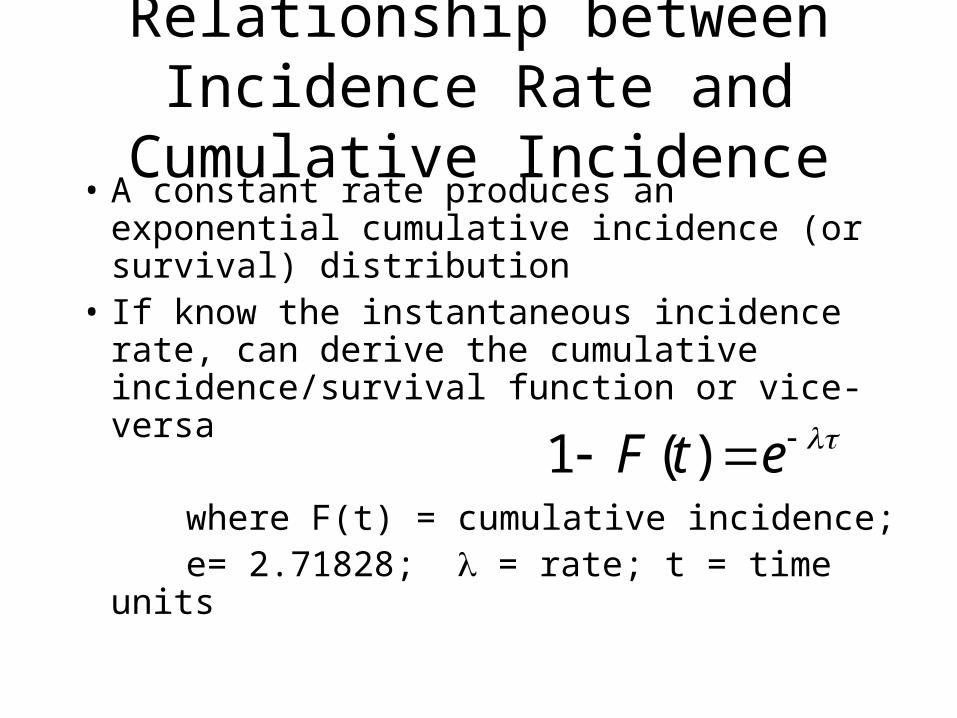
Relationship between Incidence Rate and Cumulative Incidence
• A constant rate produces an exponential cumulative incidence (or survival) distribution
• If know the instantaneous incidence rate, can derive the cumulative incidence/survival function or vice-versa
where F(t) = cumulative incidence; e= 2.71828; = rate; t = time units
etF )(1
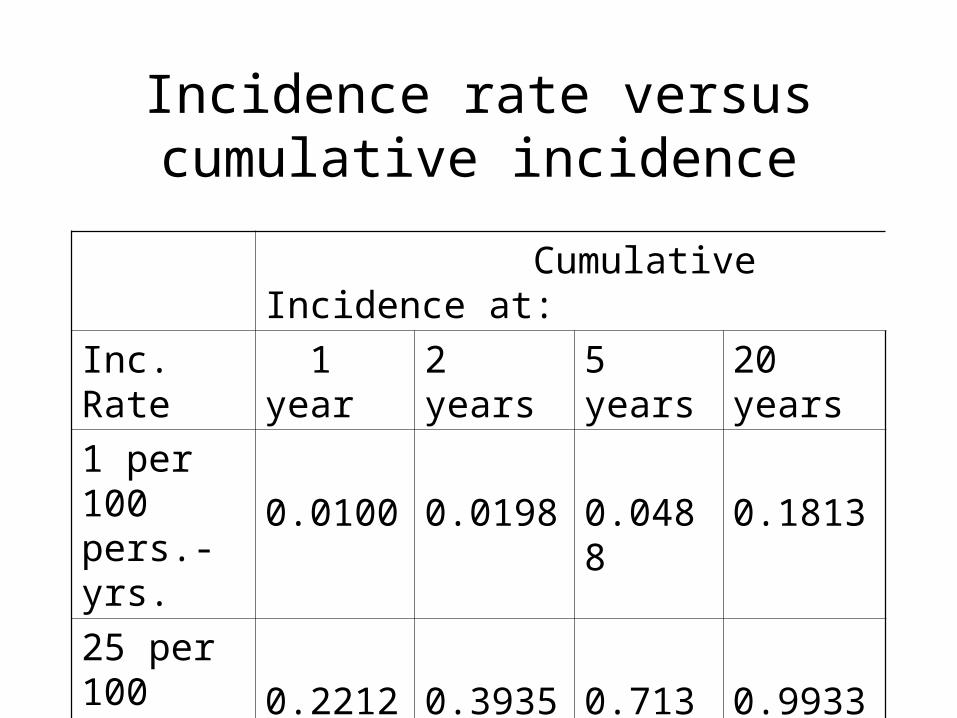
Incidence rate versus cumulative incidence
Cumulative Incidence at:
Inc. Rate 1 year 2 years 5 years 20 years
1 per 100 pers.-yrs. 0.0100 0.0198 0.0488 0.1813
25 per 100 pers.-yrs. 0.2212 0.3935 0.7135 0.9933
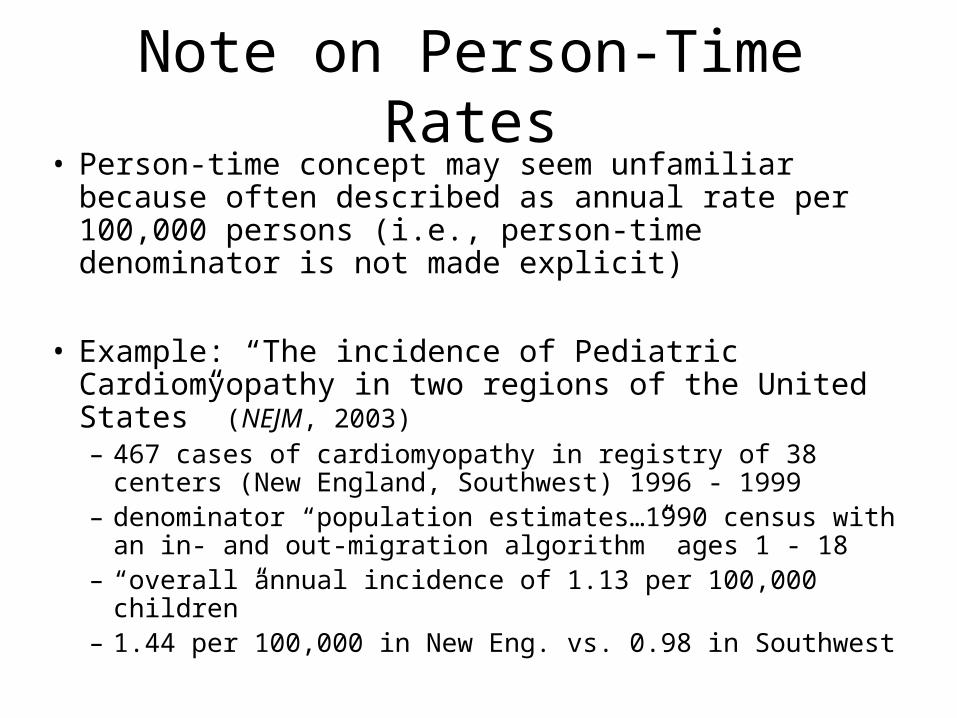
Note on Person-Time Rates• Person-time concept may seem unfamiliar because
often described as annual rate per 100,000 persons (i.e., person-time denominator is not made explicit)
• Example: “The incidence of Pediatric Cardiomyopathy in two regions of the United States” (NEJM, 2003)– 467 cases of cardiomyopathy in registry of 38 centers (New
England, Southwest) 1996 - 1999 – denominator “population estimates…1990 census with an
in- and out-migration algorithm” ages 1 - 18– “overall annual incidence of 1.13 per 100,000 children” – 1.44 per 100,000 in New Eng. vs. 0.98 in Southwest
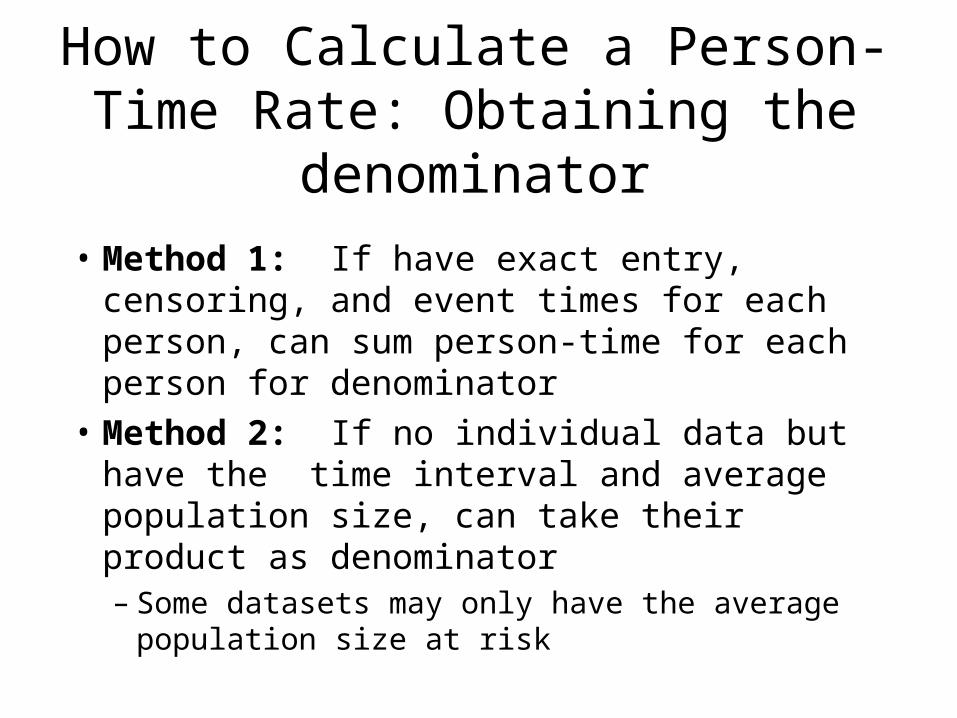
How to Calculate a Person-Time Rate: Obtaining the denominator
• Method 1: If have exact entry, censoring, and event times for each person, can sum person-time for each person for denominator
• Method 2: If no individual data but have the time interval and average population size, can take their product as denominator– Some datasets may only have the average
population size at risk
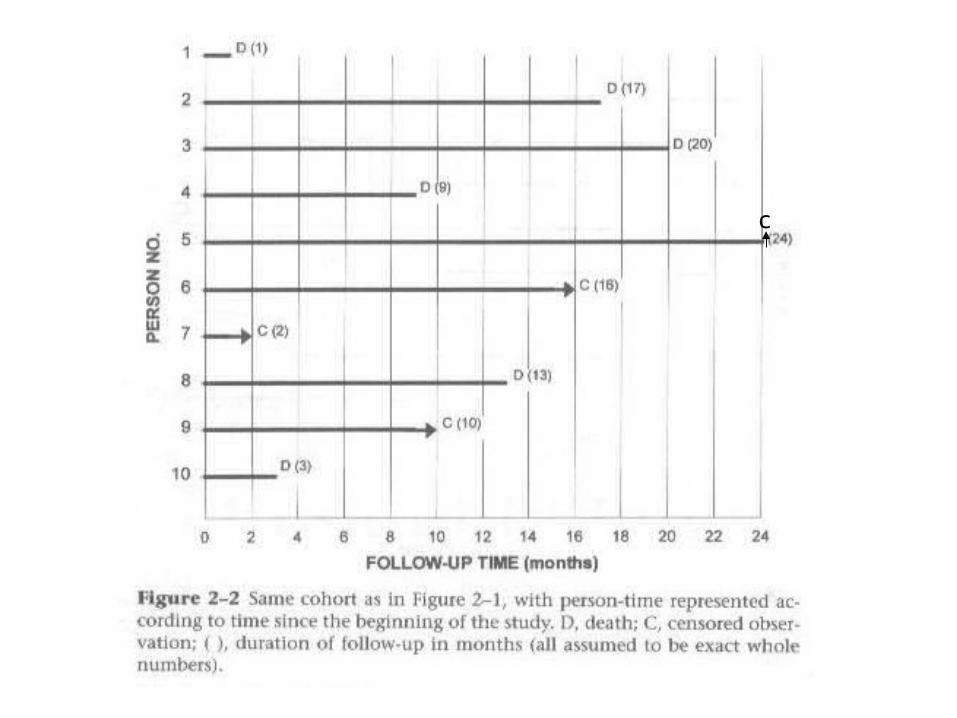
c
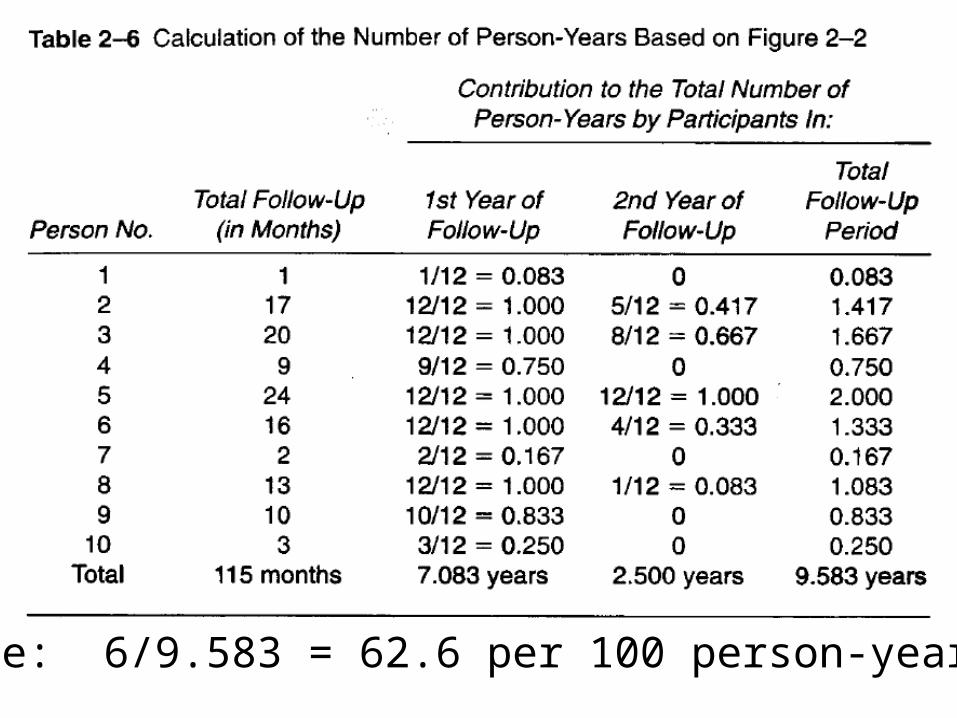
Rate: 6/9.583 = 62.6 per 100 person-years
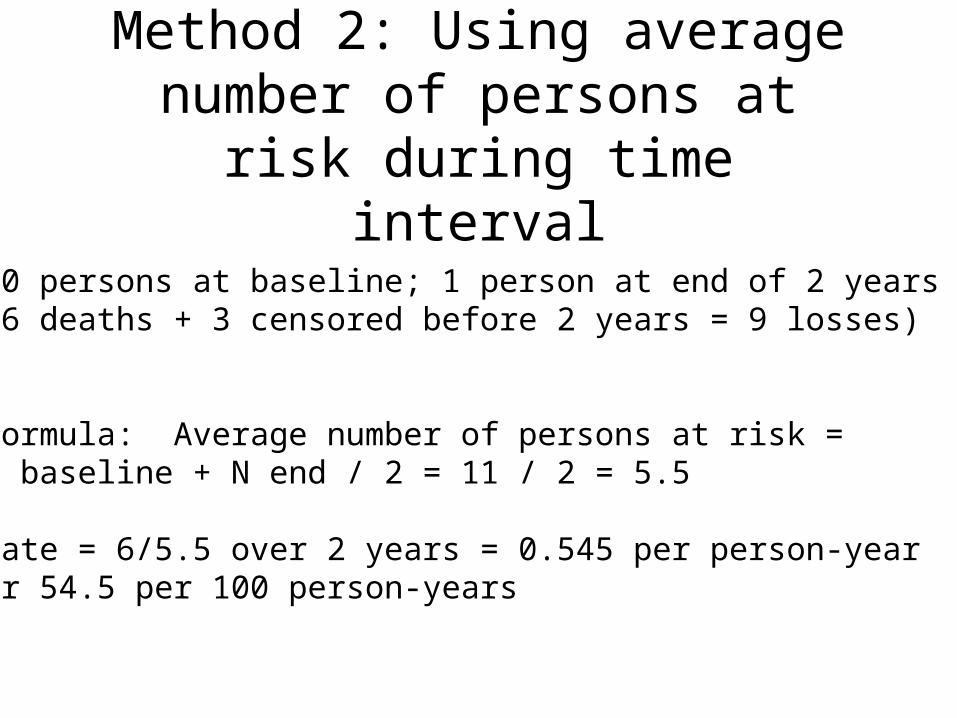
Method 2: Using average number of persons at risk during time interval
10 persons at baseline; 1 person at end of 2 years (6 deaths + 3 censored before 2 years = 9 losses)
Formula: Average number of persons at risk = N baseline + N end / 2 = 11 / 2 = 5.5
Rate = 6/5.5 over 2 years = 0.545 per person-yearor 54.5 per 100 person-years
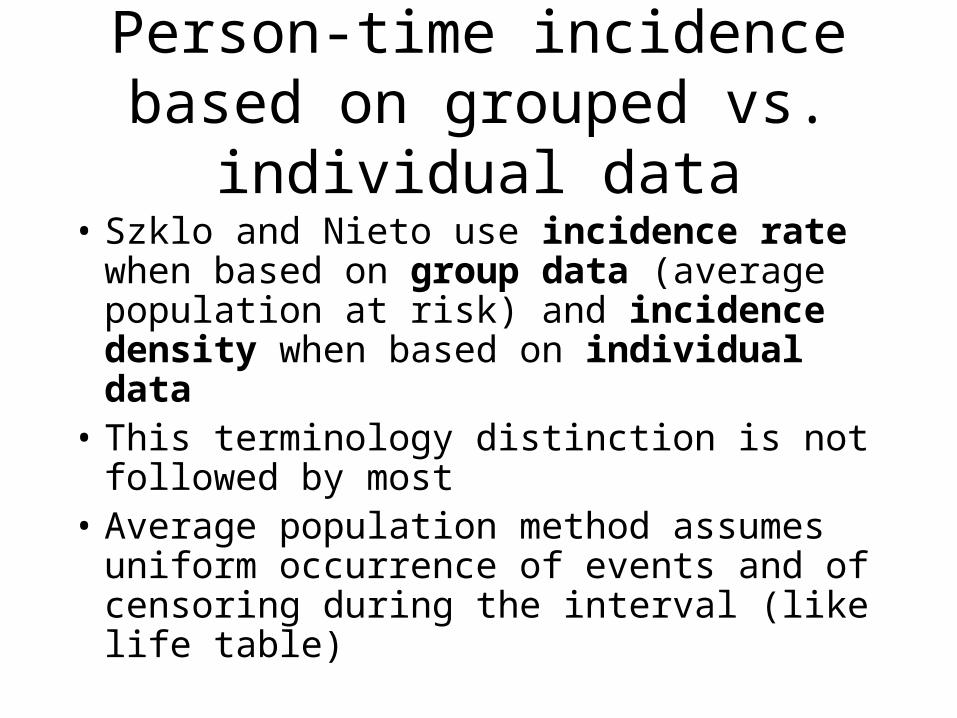
Person-time incidence based on grouped vs. individual data
• Szklo and Nieto use incidence rate when based on group data (average population at risk) and incidence density when based on individual data
• This terminology distinction is not followed by most
• Average population method assumes uniform occurrence of events and of censoring during the interval (like life table)
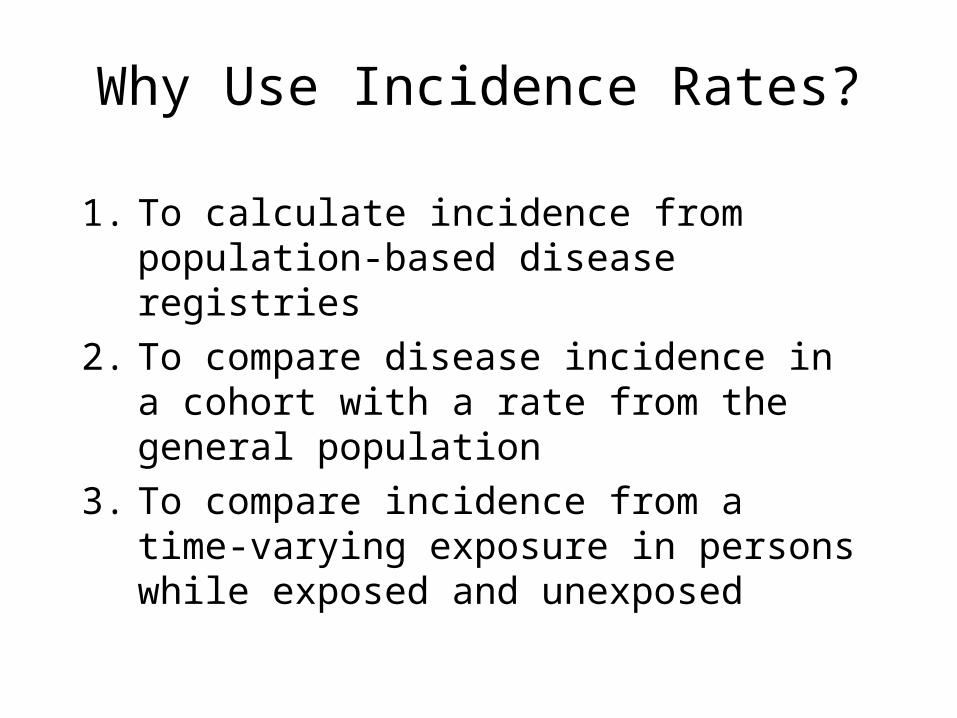
Why Use Incidence Rates?
1. To calculate incidence from population-based disease registries
(1) Calculating a rate from population-based registry of diagnoses
• Research question: What is the incidence rate for first diagnoses of breast cancer in Marin County and how does it compare with rates from other counties?
• Nearly all new breast cancer diagnoses are reported to the SEER cancer registry
• How to obtain a denominator for a rate?
Large Population Person-Time Rates
“Since the production of stable rates for cancers at most individual sites requires a population of at least one millionsubjects, the logistic and financial problems of attemptingto maintain a constant surveillance system [of everyone inthe population] are usually prohibitive.” Breslow and Day, Statistical Methods in Cancer Research
Solution: Do surveillance of all the cancer diagnoses and estimate the population denominator to get person-time at risk.
To get an incidence rate person-time denominator by the group method requires only an estimate of the average population size during the year (=the population at mid-year).
Average Population (Group data) rates versus individual data rates
• If losses are perfectly uniform, total person-time calculation for the denominator (and thus the rate) is the same whether based on average population size or individual follow-up
• For large populations the rate will be nearly identical calculated by either method
Potential Weakness of Using Census Data
• Calculating rates from census population data is very useful but caution is required as a full census is only done every 10 years
• Interim estimates of population change is made by the Census but over 10 years denominators may become inaccurate
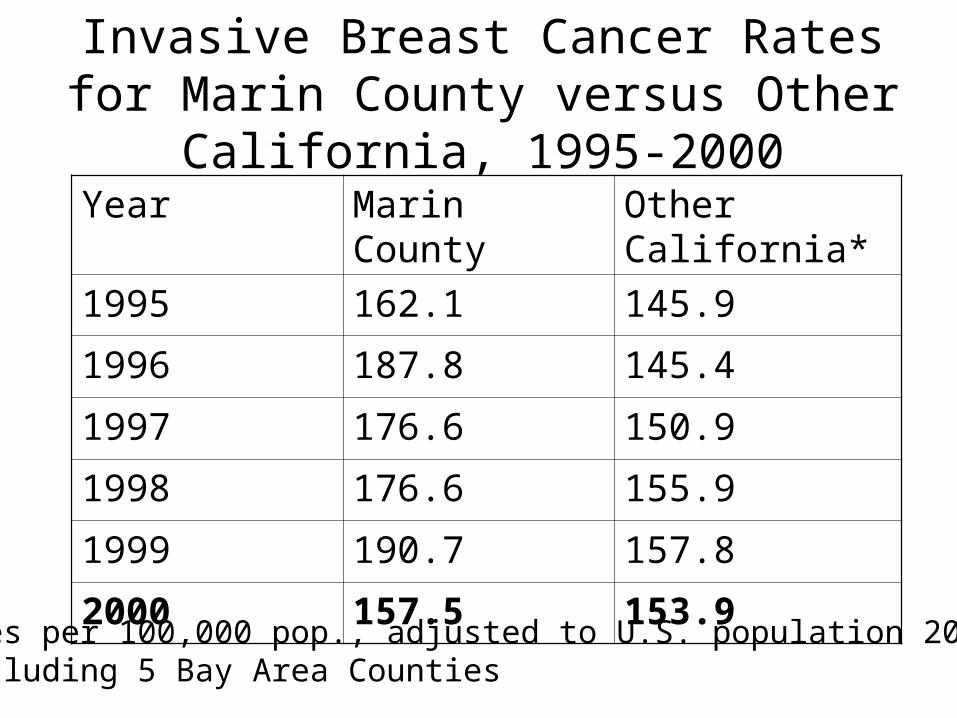
Invasive Breast Cancer Rates for Marin County versus Other California, 1995-2000
Year Marin County Other California*
1995 162.1 145.9
1996 187.8 145.4
1997 176.6 150.9
1998 176.6 155.9
1999 190.7 157.8
2000 157.5 153.9
Rates per 100,000 pop., adjusted to U.S. population 2000*Excluding 5 Bay Area Counties
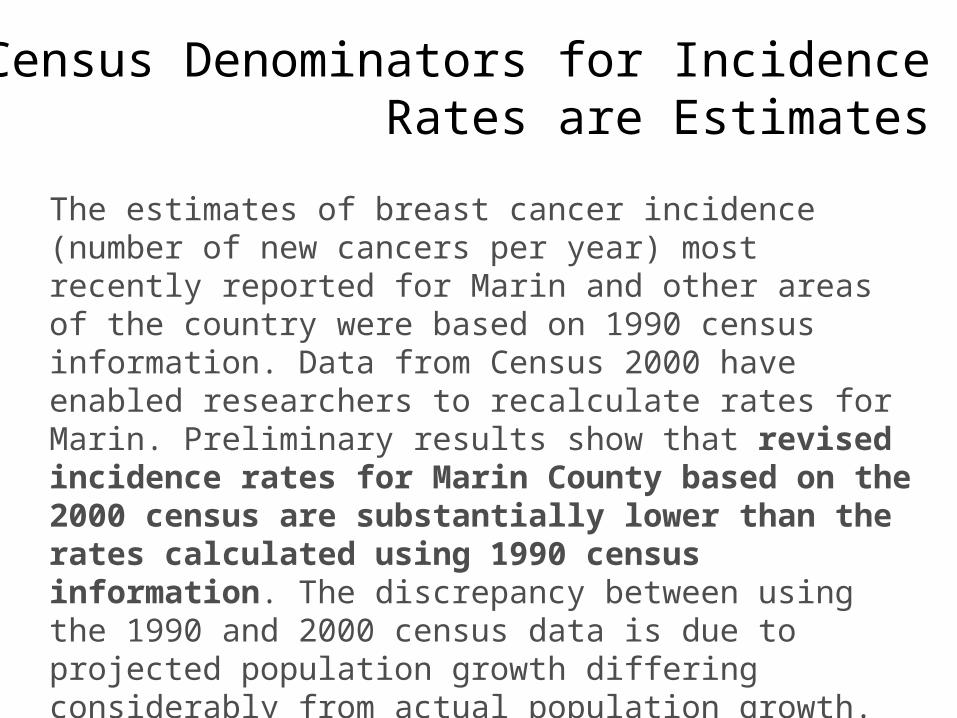
The estimates of breast cancer incidence (number of new cancers per year) most recently reported for Marin and other areas of the country were based on 1990 census information. Data from Census 2000 have enabled researchers to recalculate rates for Marin. Preliminary results show that revised incidence rates for Marin County based on the 2000 census are substantially lower than the rates calculated using 1990 census information. The discrepancy between using the 1990 and 2000 census data is due to projected population growth differing considerably from actual population growth.
Census Denominators for Incidence Rates are Estimates
Why Use Incidence Rates?
1. To calculate incidence from population-based disease registries
2. To compare disease incidence in a cohort with a rate from the general population
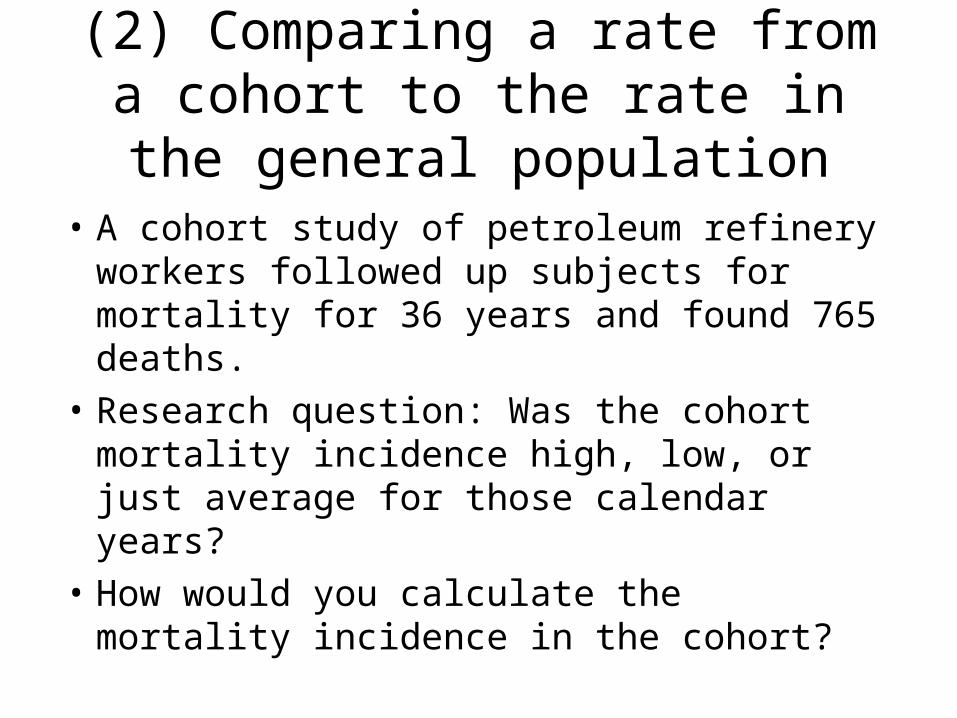
(2) Comparing a rate from a cohort to the rate in the general population
• A cohort study of petroleum refinery workers followed up subjects for mortality for 36 years and found 765 deaths.
• Research question: Was the cohort mortality incidence high, low, or just average for those calendar years?
• How would you calculate the mortality incidence in the cohort?
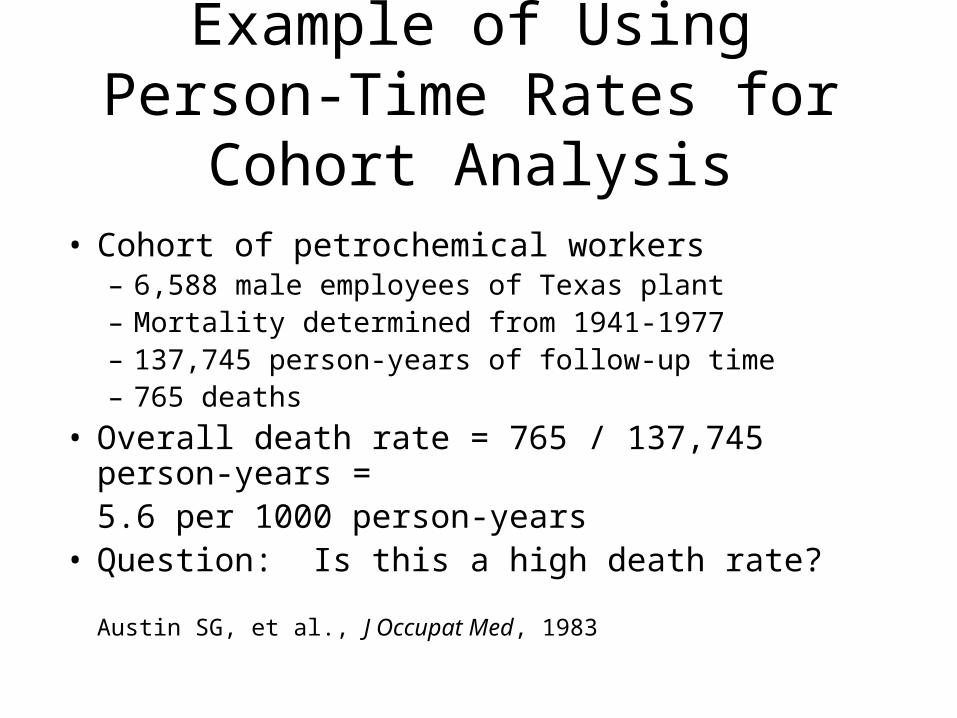
Example of Using Person-Time Rates for Cohort Analysis
• Cohort of petrochemical workers– 6,588 male employees of Texas plant– Mortality determined from 1941-1977– 137,745 person-years of follow-up time– 765 deaths
• Overall death rate = 765 / 137,745 person-years = 5.6 per 1000 person-years
• Question: Is this a high death rate?
Austin SG, et al., J Occupat Med, 1983
Cohort of petrochemical workers
• Could calculate KM estimate of cumulative incidence (for 36 years of follow-up), but what is the comparison group?
• If calculate a person-time rate, it can be compared to the expected death rate in the U.S. population (within age and calendar date groups)
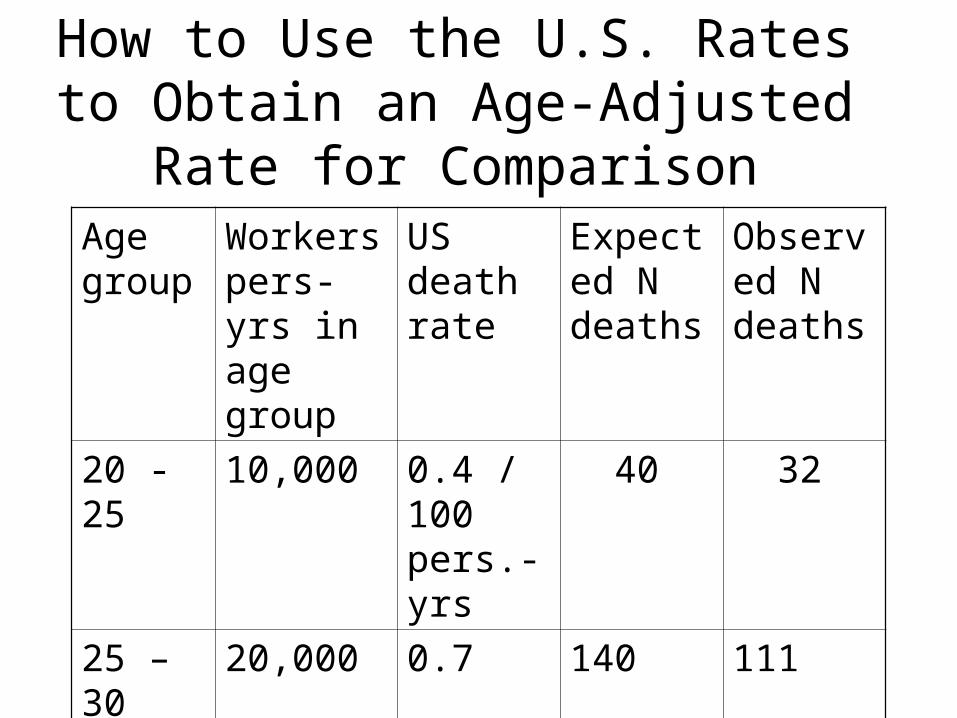
How to Use the U.S. Rates to Obtain an Age-Adjusted Rate for Comparison
Age group
Workers pers-yrs in age group
US death rate
Expected N deaths
Observed N deaths
20 - 25 10,000 0.4 / 100 pers.-yrs
40 32
25 – 30 20,000 0.7 140 111
30 – 35 30,000 1.2 360 305
Total 60,000 540 448
Cohort of petrochemical workers
• Applying U.S. population rates to the cohort age groups, get an expected 924 deaths in the cohort versus the 765 observed.
• Ratio of 765 observed/924 expected = 0.83 = 83%. This is called a Standardized Mortality Ratio (SMR).
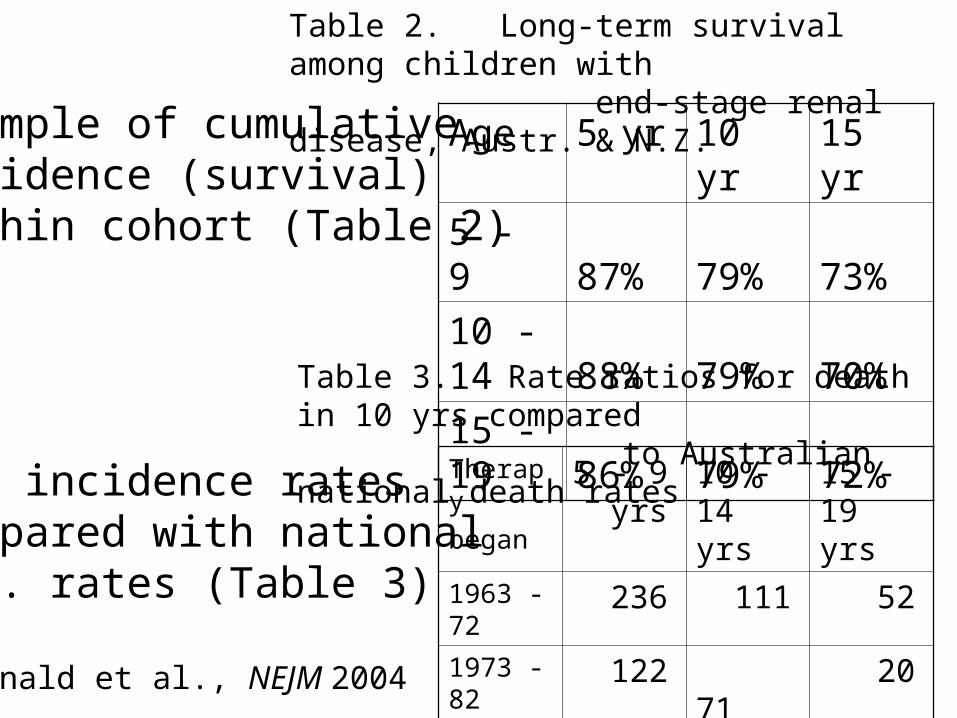
Example of cumulative incidence (survival)within cohort (Table 2)
and incidence ratescompared with national pop. rates (Table 3)
McDonald et al., NEJM 2004
Table 2. Long-term survival among children with end-stage renal disease, Austr. & N.Z.
Age 5 yr 10 yr 15 yr
5 - 9 87% 79% 73%
10 - 14 88% 79% 70%
15 - 19 86% 79% 72%
Therapy
began5 - 9 yrs
10 - 14 yrs
15 - 19 yrs
1963 - 72 236 111 521973 - 82 122 71 201983 - 92 30 37 19
Table 3. Rate ratios for death in 10 yrs compared to Australian national death rates
Why Use Incidence Rates?
1. To calculate incidence from population-based disease registries
2. To compare disease incidence in a cohort with a rate from the general population
3. To compare incidence from a time-varying exposure in persons while exposed and unexposed
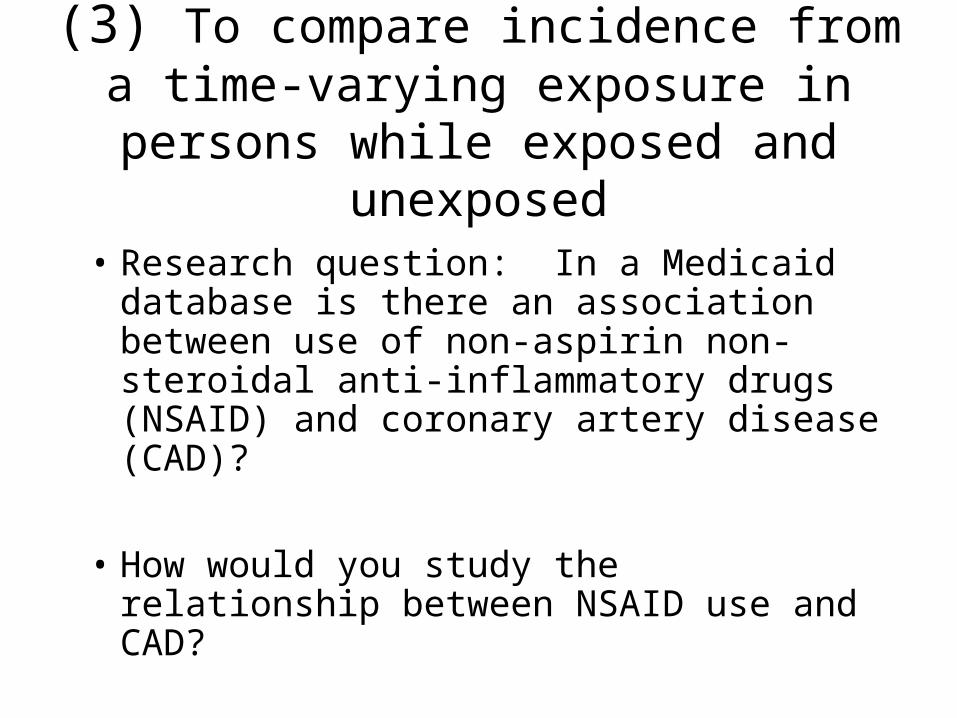
(3) To compare incidence from a time-varying exposure in persons while exposed
and unexposed
• Research question: In a Medicaid database is there an association between use of non-aspirin non-steroidal anti-inflammatory drugs (NSAID) and coronary artery disease (CAD)?
• How would you study the relationship between NSAID use and CAD?
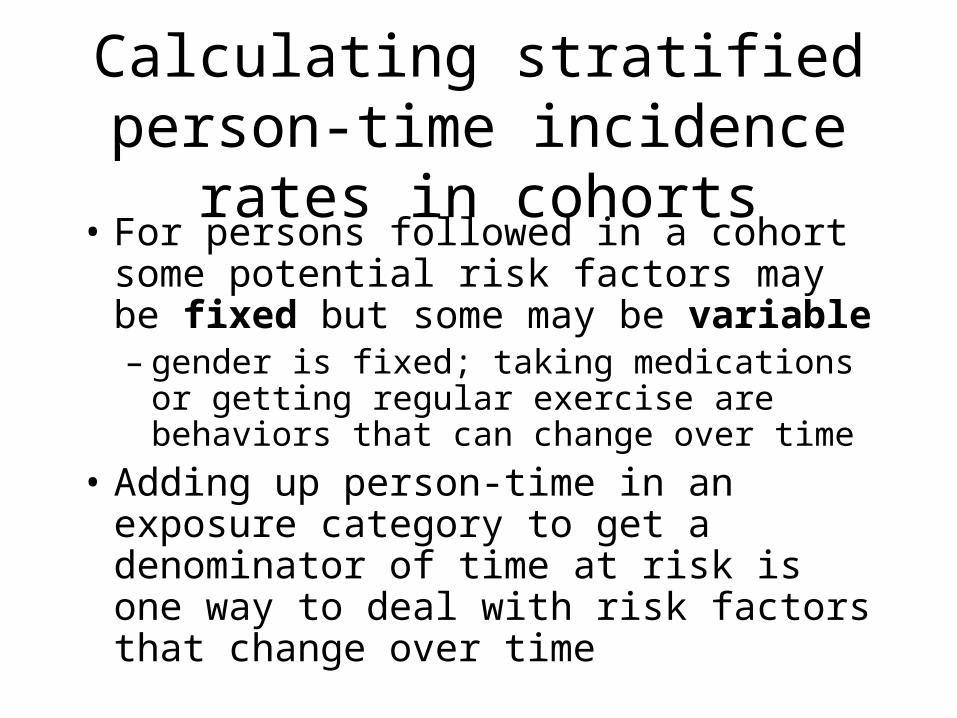
Calculating stratified person-time incidence rates in cohorts
• For persons followed in a cohort some potential risk factors may be fixed but some may be variable – gender is fixed; taking medications or getting
regular exercise are behaviors that can change over time
• Adding up person-time in an exposure category to get a denominator of time at risk is one way to deal with risk factors that change over time
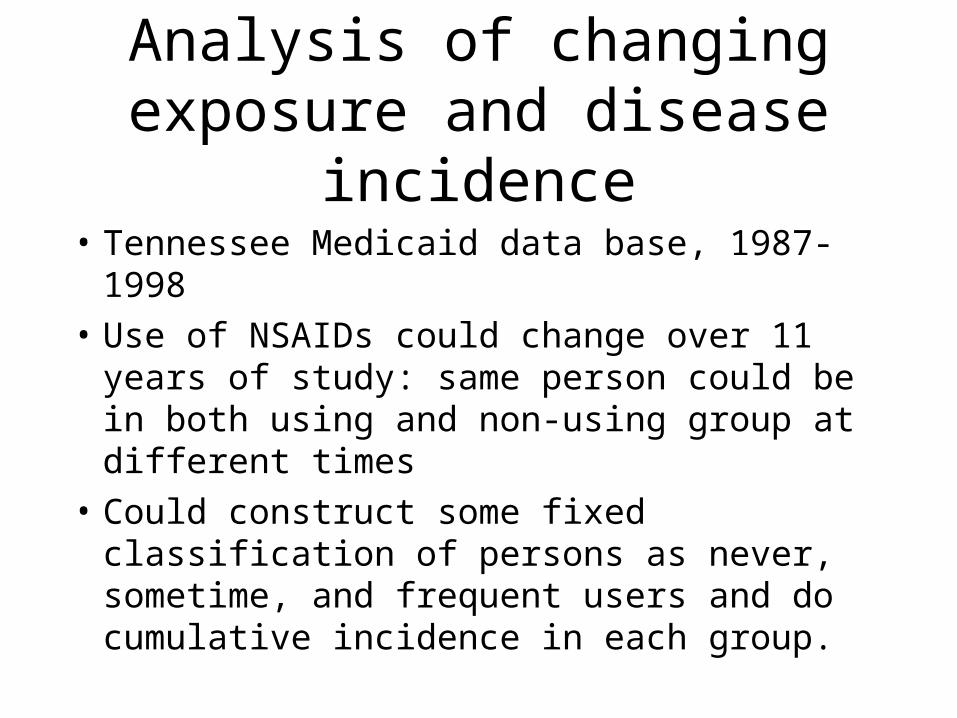
Analysis of changing exposure and disease incidence
• Tennessee Medicaid data base, 1987-1998• Use of NSAIDs could change over 11 years of
study: same person could be in both using and non-using group at different times
• Could construct some fixed classification of persons as never, sometime, and frequent users and do cumulative incidence in each group.
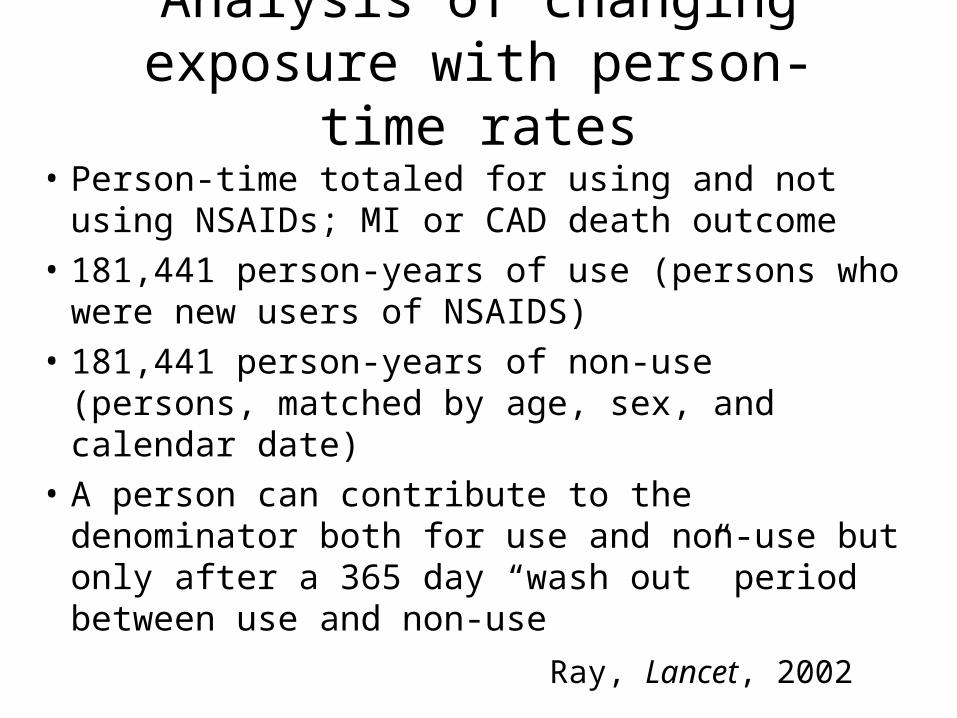
Analysis of changing exposure with person-time rates
• Person-time totaled for using and not using NSAIDs; MI or CAD death outcome
• 181,441 person-years of use (persons who were new users of NSAIDS)
• 181,441 person-years of non-use (persons, matched by age, sex, and calendar date)
• A person can contribute to the denominator both for use and non-use but only after a 365 day “wash out” period between use and non-use
Ray, Lancet, 2002
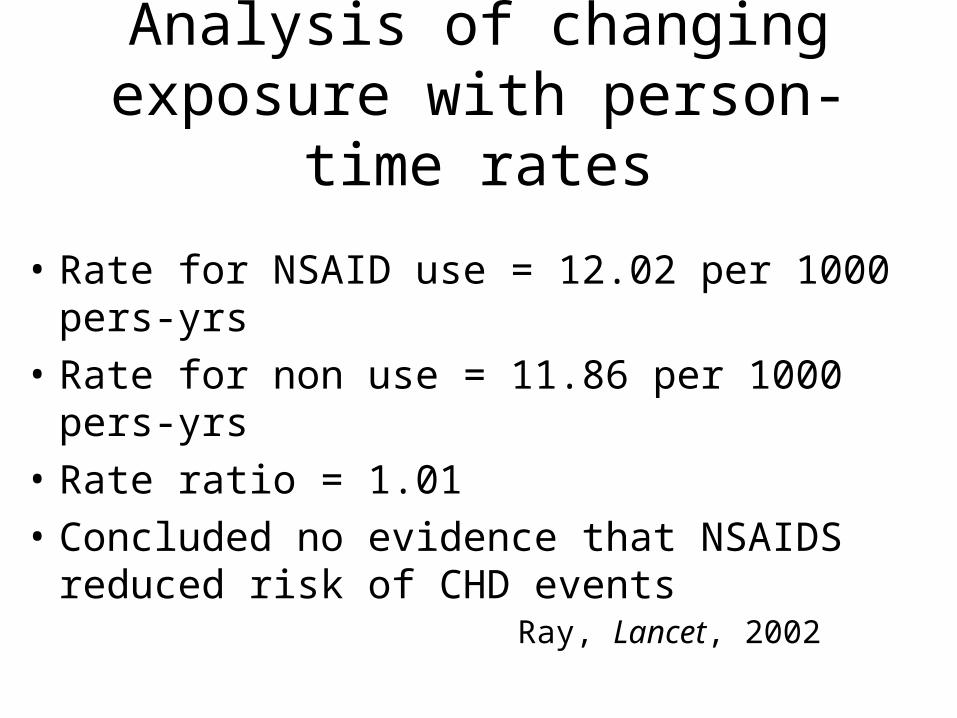
Analysis of changing exposure with person-time rates
• Rate for NSAID use = 12.02 per 1000 pers-yrs
• Rate for non use = 11.86 per 1000 pers-yrs
• Rate ratio = 1.01
• Concluded no evidence that NSAIDS reduced risk of CHD events
Ray, Lancet, 2002
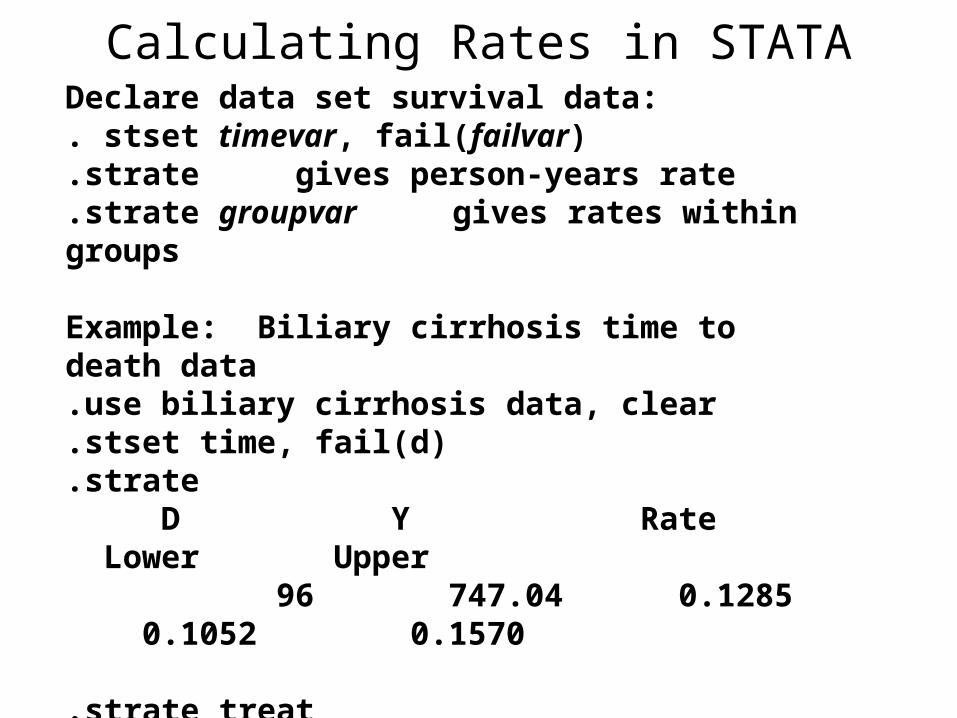
Calculating Rates in STATADeclare data set survival data:. stset timevar, fail(failvar).strate gives person-years rate.strate groupvar gives rates within groups
Example: Biliary cirrhosis time to death data.use biliary cirrhosis data, clear.stset time, fail(d).strate
D Y Rate Lower Upper 96 747.04 0.1285 0.1052 0.1570
.strate treatTreat D Y Rate Lower UpperPlacebo 49 355.0 0.138 0.104 0.183Active 47 392.0 0.120 0.090 0.160
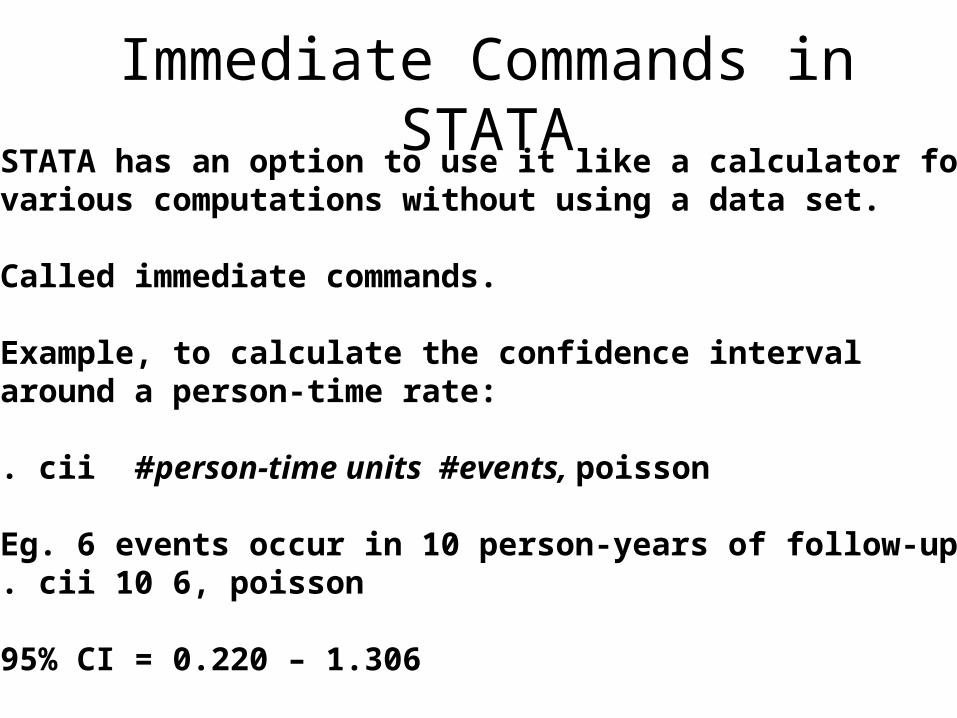
Immediate Commands in STATASTATA has an option to use it like a calculator forvarious computations without using a data set.
Called immediate commands.
Example, to calculate the confidence intervalaround a person-time rate:
. cii #person-time units #events, poisson
Eg. 6 events occur in 10 person-years of follow-up. cii 10 6, poisson
95% CI = 0.220 – 1.306
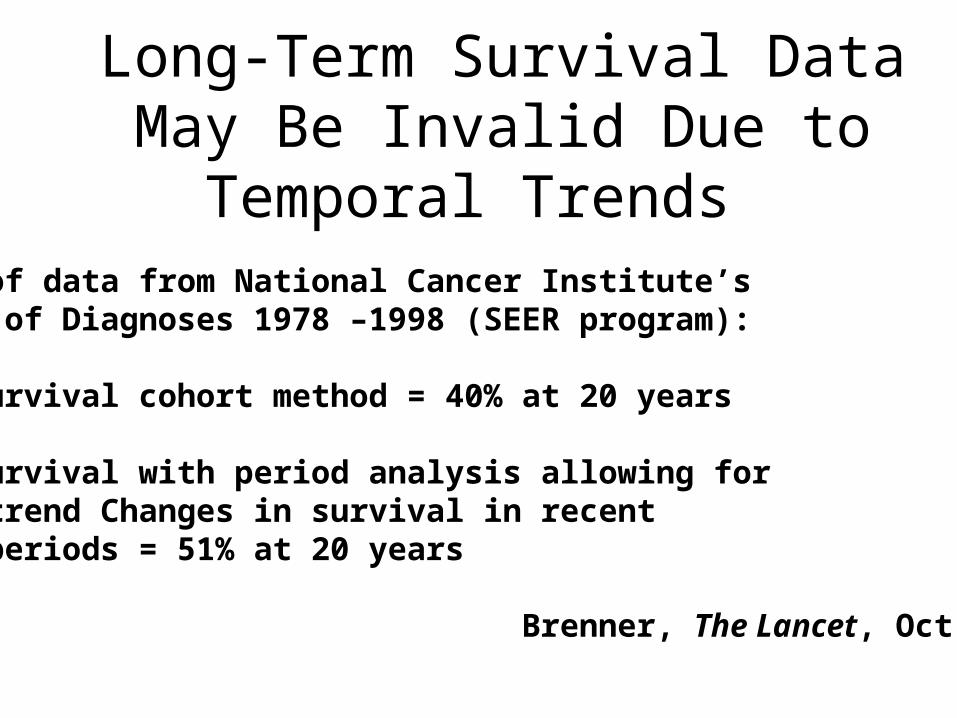
Long-Term Survival Data May Be Invalid Due to Temporal Trends
Analysis of data from National Cancer Institute’s Follow-up of Diagnoses 1978 –1998 (SEER program):
Overall survival cohort method = 40% at 20 years
Overall survival with period analysis allowing forTemporal trend Changes in survival in recentCalendar periods = 51% at 20 years
Brenner, The Lancet, Oct 12, 2002
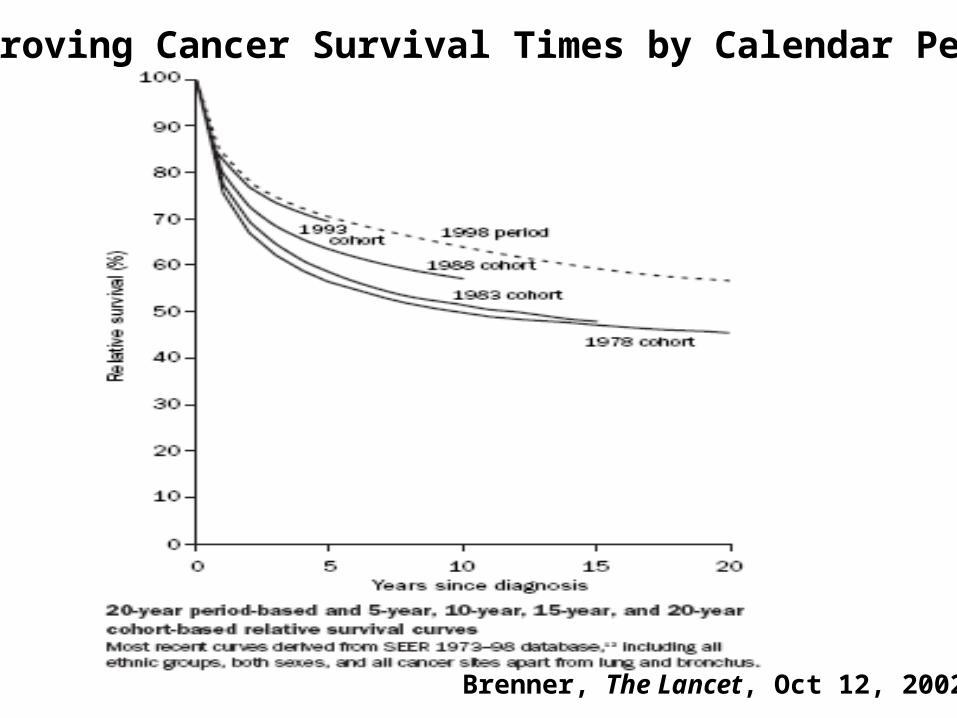
Improving Cancer Survival Times by Calendar Period
Brenner, The Lancet, Oct 12, 2002
Summary Points• Person-time incidence rate or density is not
the same thing as cumulative incidence and is not a proportion
• Person-time incidence rate can be calculated with individual or average population data– Allows incidence estimates in large populations
that are not completely enumerated– Allows comparison with population reference
rates from other data sources– Allows accumulation of time at risk for different
exposure strata