Embed Size (px)
Citation preview

Rater Effects as a Function of Rater Training Context
Edward W. Wolfe
Aaron McVay
Pearson
October 2010

Abstract
This study examined the influence of rater training and scoring context on the
manifestation of rater effects in a group of trained raters. 120 raters participated in the study and
experienced one of three training/scoring contexts: (a) online training in a distributed scoring
context, (b) online training in a regional scoring context, and (c) stand-up training in a regional
context. After training, raters assigned scores on a four-point scale to 400 student essays. Ratings
were scaled to a Rasch rating scale model, and several indices were computed for the sake of
determining the degree to which individual raters manifested evidence of severity, inaccuracy,
and centrality in the ratings that were assigned. The results indicate that latent trait indicators of
leniency and inaccuracy are nearly perfectly correlated with raw score indicators of those rater
effects. The results also reveal that the expected-residual correlation may be the most direct
latent trait indictor of rater centrality. The results of this study also suggest that raters who are
trained and score in online distributed environments may be less likely to exhibit centrality and
inaccuracy effects.
Keywords: writing assessment, rater training, rater effects, scoring
2

Human scoring of constructed-response assessment items has traditionally taken place at
regional scoring centers, at which trainers meet and present training materials to raters in a face-
to-face setting. Following training, raters receive and review paper copies of the products to be
scored and assign scores on handwritten or scannable forms, which are collected and entered into
a database. The process of distributing products and collecting and entering scores is somewhat
slow, making it difficult to conduct rater monitoring in a timely manner. Over time, technology
has been developed to facilitate the processes of training raters, distributing products to be
scored, and collecting assigned scores. For example, it is now possible for raters to receive
training materials and scanned copies of products to be scored through a computer interface.
Scoring project directors can then review and monitor scores that raters enter into a graphical
computer interface in real time. As a result, raters can conceivably be trained, qualify for scoring,
and assign scores from remote locations, such as their homes, without ever meeting with scoring
project directors in a face-to-face setting.
Few research studies have focused on how features of the training and scoring context,
such as computer-based distribution and collection systems, affect the quality of scores assigned
by human raters. Given that the reliability of scores of constructed-response items tends to be
low, relative to scores from multiple-choice items, test developers continuously seek ways to
eliminate error from scores assigned to constructed-response items. Typically, these efforts
include rater training, requiring raters to qualify for a scoring project, monitoring and retraining
raters during the scoring project, and utilizing score resolution procedures when the scores of
two or more raters differ. This article summarizes the results of a study that compares the scores
assigned to writing assessment performances under three conditions: (a) rater training that is
conducted online followed by scoring that occurs through a computer interface at remote
3

locations (referred to here as an online distributed training/scoring context), (b) rater training
that is conducted online followed by scoring that occurs through a computer interface, both of
which take place at a regional scoring center (referred to here as an online regional
training/scoring context), and (c) face-to-face training followed by scoring that occurs through a
computer interface, both of which take place in a regional scoring center (referred to here as a
stand-up regional context).
Much of the initial research concerning rater training focused on training content: (a)
rater error training, in which raters are informed of the existence of rating errors (e.g., leniency
and halo) and how to avoid those errors, and (b) frame of reference training in which raters learn
about relevant aspects of the products to be rated. That research revealed that rater error training
may reduce the occurrence of leniency and halo errors better than frame of reference training
(Bernardin, 1978; Ivancevich, 1979), while assigned ratings may be more accurate when frame
of reference training or no training at all is provided to raters (Bernardin & Pence, 1980;
Borman, 1979; Cellar, Curtis Jr, Kohlepp, Poczapski, & Mohiuddin, 1989; Hedge & Kavanagh,
1988; Noonan & Sulsky, 2001; Roch & O'Sullivan, 2003; Uggerslev & Sulsky, 2008). Several of
these initial studies revealed that either approach to rater training is more effective when training
immediately precedes rating (Bernardin, 1978; Ivancevich, 1979; Roch & O'Sullivan, 2003;
Sulsky & Day, 1994). One study suggested that each approach may be better at controlling
specific types of errors (Stamoulis & Hauenstein, 1993). However, a combination of rater error
training and frame of reference training was shown to be superior to either rater error training or
frame of reference training alone (McIntyre, Smith, & Hassett, 1984; Pulakos, 1984). Finally, at
least one study revealed that rater reactions to training may influence the effectiveness of training
efforts (Noonan & Sulsky, 2001).
4

Few systematic studies have compared the effectiveness or efficiency of online and face-
to-face rater training contexts. In one of the few direct comparisons of online and face-to-face
rater training, Knoch, Read, and von Randow (2007) compared the performance and attitudes of
two teams of eight writing assessment raters. Their results revealed that online and face-to-face
training reduce rater severity, inaccuracy, and central tendency, and that raters in the online
training condition were more similar in terms of levels of these rater effects following training
than were those in the face-to-face condition. The authors found no differences in terms of rater
perceptions, nor preferences for the two training media. A pair of studies (Elder, Barkhuizen,
Knoch, & von Randow, 2007; Elder, Knoch, Barkhuizen, & von Randow, 2005) followed eight
experienced raters who rated writing samples online before and after receiving online training
concerning the rating task. During training, raters rated writing samples and received immediate
feedback through that interface concerning the accuracy of the scores that they assigned. The
raters generally exhibited positive attitudes toward the online training system, indicating that the
system was effective and enjoyable and that the online training system changed the raters’
behaviors. The analyses also revealed that the range of rater severity decreased after completing
the online training.
Several of these studies have attempted to determine whether training medium may
reduce the frequency with which raters manifest various rater effects. A large body of literature
exists describing how rater effects may be detected in rating data, and much of that literature
focuses on applications of the Rasch rating scale model for that purpose (Andrich, 1978). That
model depicts the logit value of an examinee (n) being assigned a rating of x versus the next
lower rating category by a particular rater (r) as a linear function of three parameters that locate
5

the respondent (θn), rater (r), and rating scale category threshold (k) onto the same underlying
continuum
krnx
xLN
1
,
where k references the threshold between category x and x – 1. It is worth noting that, in the
current application, raters rate examinee responses to a single item. Parameters for this model are
estimated using joint maximum likelihood estimation procedures as implemented in commercial
software, such as Facets (Linacre, 2009a) or Winsteps (Linacre, 2009b).
Several statistical estimates associated with the Rasch rating scale model are useful for
evaluating rater effects. One of the most commonly studied rater effects is rater severity or
leniency, an effect that causes the scores assigned by a particular rater to be lower or higher,
respectively, than warranted. The Rasch rating scale model explicitly estimates parameters to
depict rater severity or leniency using the r component of the model. Specifically, r depicts the
relative location of the mean score assigned by rater r. Hence, in order to determine whether a
particular rater assigns scores that are more severe or lenient than other raters, a data analyst
would examine the value of r for that rater. In most cases, the interpretation of values of r is
based on a norm-referenced framework. That is, r depicts only how severe or lenient a
particular rater is relative to other raters. As a result, one must assume that the group of raters
assigns, on average, scores that are unbiased in order to validly interpret a rater’s true severity or
leniency tendencies.
Another potentially useful index is the score-estimate correlation ( ), also known as
the point-measure correlation. The score-estimate correlation is the latent trait analog to the
item-total correlation, often referred to as the point-biserial correlation. In applications to
,rxr
6

detecting rater effects, the score-estimate correlation is computed as the correlation between the
scores assigned by a particular rater to a group of examinees ( ) and the ability estimates of
those examinees ( ). The score-estimate correlation depicts the consistency between the rank
ordering of the examinees by a particular rater and the rank ordering of those examinees by
composite scores assigned by all other raters. Hence, the score-estimate correlation should be
sensitive to rater effects which create inconsistencies between these pairs of measures, such as
rater inaccuracy. When the consistency is low (i.e., when the rater is inaccurate), the value of the
correlation coefficient should approach zero. On the other hand, the score-estimate correlation
should not be influenced by rater effects that preserve the consistency of these two measures,
such as rater centrality (i.e., compression or truncation of the ratings toward the center of the
scoring distribution).
rx
A third set of indices that has been used to evaluate rater effects are four model-data fit
indices associated with the Rasch rating scale model. These include the weighted and
unweighted mean-squared fit statistics and the standardized versions of these two fit statistics.
The mean squared fit statistics (Wright & Masters, 1982) are based on the standardized residual
of the observed response for each person-item combination from the modeled expectation, given
the parameter estimates,
nrW
E nrnrnr
xz
where xnr = the score assigned to person n by rater r,
, the expected score assigned to person n by rater r,
m
knrnr kE
0
7

,
m
knrnr EkW
0
k = the scored responses, ranging from 0 to m, and
nrk = the model-based probability that person n be assigned a score in category k
by rater r.
Unweighted mean squared fit statistics for raters are computed as the average of the squared
standardized residuals across all persons scored by a rater,
N
zUMS
N
nnr
r
1
2
Weighted mean squared fit statistics for items are computed as the average of the squared
standardized residuals across all persons associated with an item, each weighted by its variance,
N
nnr
N
nnrnr
r
W
WzWMS
1
1
2
Each of these statistics can also be standardized via the Wilson-Hilferty cube root transformation
(Wilson & Hilferty, 1931) to obtain the standardized unweighted and weighted mean square fit
statistics (ZUMS and ZWMS) (Wright & Masters, 1982). Historically, rule-of-thumb upper and
lower limits for acceptable mean square fit values have been established for flagging items, such
8

as 0.7 and 1.3 for multiple-choice items, 0.6 and 1.4 for rating scales, and ±2.0 for the
standardized versions (Wright & Linacre, 1994).
Previous research has demonstrated that fit statistics may be sensitive to rater centrality
effects (i.e., the tendency for raters to assign scores to the middle rating categories too often) as
well as rater inaccuracy (i.e., the tendency for raters to assign scores that contain random error)
(Engelhard, 1994; Wolfe, Chiu, & Myford, 2000; Wolfe & Moulder, 2001). However, it is also
clear that it is difficult to differentiate these effects from each other using fit indices (Myford &
Wolfe, 2003, 2004; Wolfe, 2004, 2005). To address this problem, preliminary work has been
done to develop an index that is primarily sensitive to centrality effects (Wolfe, 2004, 2005).
Specifically, the expected-residual correlation (rexp,res) is based on the notion that the residuals
(i.e., observed score – expected score) produced by ratings that exhibit centrality will be positive
for examinees of low ability and negative for examinees of high ability. That is, a scatterplot of
the expected score (X axis) and residuals (Y axis) should have a negative slope when centrality
exists. Hence, analysts may be able to differentiate cases of rater inaccuracy from cases of rater
centrality by first identifying suspect cases based on rater fit indices and then differentiating
cases based on whether the expected-residual correlations are negative or not. Suspect cases that
are associated with negative expected-residual correlations would be flagged for centrality while
those associated with zero or positive expected-residual correlations would be flagged for
inaccuracy.
It is also important to emphasize that each of these diagnostic indices can be calculated
within two frames of reference. Specifically, an internal frame of reference depicts the
characteristics of a particular rater in the context of the characteristics of the pool of raters of
whom the rater is a member. To create a relative frame of reference, rating data from the pool of
9

raters is scaled, and parameters are jointly estimated for examinees and raters. In this case, the
rater’s leniency and fit are referenced to the typical ratings assigned by members of the rating
pool. On the other hand, an external frame of reference depicts the characteristics of a particular
rater in the context of the characteristics of scores that are external to the pool of raters of whom
the rater is a member. These external scores could have been produced by a pool of expert raters,
or the scores could be based on the examinee’s performance on an external test. In most cases, to
establish an external frame of reference, rating data from the pool of raters is scaled while fixing
the characteristics (i.e., anchoring the parameters) of examinees on measures that are based on
the external scores.
Purpose
The two purposes of the study summarized in this report are to (a) illustrate the
correspondence between raw score and Rasch rating scale model evidence of rater effects and (b)
utilize Rasch rating scale model indices to directly compare the rates with which writing
assessment raters exhibit evidence of inaccuracy, severity, and centrality after raters receive
online distributed, online regional, or face-to-face regional training. To that end, we first describe
the method employed in both studies. We then provide an illustration of a method for
determining the correspondence between raw and Rasch rating scale results in the detection of
rater effects. Finally, we summarize the results of a comparison of raters that are trained in these
various contexts on each of the diagnostic indices explored in the illustrative example.
METHOD
Data for this study were collected from 40 raters under each of three conditions (n = 120),
with conditions distinguished by the context within which rater training and scoring took place.
Raters participated in training activities, assigned scores on a 4 point rating scale to a common
10

set of 400 student essays through an online distribution system. This study focuses first on the
correspondence of potential diagnostic indices used to depict rater effects, and then utilizes these
indices to determine whether between-group differences exist with respect to the prevalence of
rater effects in the scores assigned by raters in the three training/scoring context groups.
Participants
Because raters could not be randomly assigned to training/scoring groups due to
geographic restrictions, raters for each group were selected from a pool of experienced writing
assessment raters to be comparable in terms of demographic (gender, age, ethnicity), educational
(undergraduate major and highest level attained), and professional experience (scoring and
teaching experience) variables. The participants had not previously scored essays for the
operational project from which papers were selected for use in the study, and all participants
were paid an equal lump sum for completing the training and scoring. Participants responded to a
questionnaire that documented the variables upon which study participant selection was based,
and Table 1 summarizes these characteristics.
The demographic, educational, and professional frequencies indicate that the three
training/scoring context groups were comparable. With respect to demographic characteristics,
participants in the online distributed group were slightly more likely to be female and under the
age of 55, while participants in the other two groups were more likely to be white. However,
these differences were not statistically significant: 2(2) Gender = 1.27, p = .52; 2
(4) Age = 7.66, p =
.09; and 2(8) Ethnicity = 13.73, p = .05. With respect to education, the online distributed scorers
were more likely to provide no response to undergraduate major and to have attained a graduate
degree than the other two groups. The difference between the reported undergraduate major for
raters in the three training/scoring context groups was statistically significant [2(8) = 22.07, p =
11

.006], while the difference for graduate degree was not [2(4) = 7.61, p = .13]. Finally, with
respect to teaching experience, the online distributed scorers were more likely to have previously
participated in four or more scoring projects and the online regional scorers were less likely to
have secured a teaching certification. However, neither of these differences is statistically
significant: 2(4) Scoring Experience = 1.88, p = .78; 2
(2) Teaching Certificate = 0.40, p = .88, respectively.
12

Table 1: Demographics, Education, and Experience by Training/Scoring Context
Variable Level Online Distributed
Online Regional
Stand-up Regional
Gender Female
Male
58% (23)
43% (17)
45% (18)
55% (22)
48% (19)
52% (21)
Age Under 30
30 to 55
55 or older
10% (4)
58% (23)
33% (13)
8% (3)
33% (13)
60% (24)
5% (2)
33% (13)
58% (23)
Ethnicity Asian
Black
Hispanic
White
No Response
5% (2)
15% (6)
5% (2)
63% (25)
13% (5)
3% (1)
3% (1)
3% (1)
88% (35)
5% (2)
0% (0)
8% (3)
5% (2)
88% (35)
0% (0)
Undergraduate
Major
Business
Humanities/Lib Arts
Sciences
No Response
23% (9)
50% (20)
8% (3)
20% (8)
35% (14)
53% (21)
33% (5)
0% (0)
38% (15)
46% (23)
5% (2)
0% (0)
Highest
Education
Level Attained
Bachelor’s
Master’s
Doctoral
55% (22)
35% (14)
10% (4)
68% (27)
13% (13)
0% (0)
75% (30)
23% (9)
3% (1)
Scoring
Experience
New
1 to 3 projects
4 or more projects
5% (2)
23% (9)
73% (29)
10% (4)
28% (11)
63% (29)
13% (5)
25% (10)
63% (25)
Teaching
Certification
Yes
No
23% (9)
78% (31)
18% (7)
83% (33)
23% (9)
78% (31)
Note: Percentages (and frequencies) for each group are displayed for each level of each variable.
13

Materials & Procedures
Raters were trained to apply a four-point, focused, holistic scoring rubric using training
materials that were originally developed for stand-up training delivered in an operational scoring
project from which responses for this study were sampled. Members of the range-finding
committee from the operational project assigned consensus scores to responses which were
compiled into two sets of ten practice papers (completed by raters during training) and three sets
of ten qualifying papers (scored by raters at the conclusion of training but prior to scoring).
Scoring directors also selected 12 validity papers which were seeded randomly into all raters’
scoring queues and four calibration (ongoing training) papers.
A content specialist, familiar with online and stand-up training, reviewed the materials
and made adjustments for online training. The scoring directors completed these online training
modules and online practice and qualification sets. With the exception of the fact that those
participating in online training viewed images of the original response, while those participating
in stand-up training viewed photocopies of the original response, the training materials were the
same for online and stand-up training. The stand-up trainer used standardized annotations written
for each response to explain the rationale for the consensus scores in order to minimize the
introduction of additional concepts or wording (beyond what was presented in the online
training) in the stand-up training group.
For the scoring component of the study, 600 responses were pulled at random from the
operational assessment for the single writing prompt, and each response was scored
independently by at least three scoring directors. The scoring directors then worked together to
choose the 400 responses raters in the study would score; they were instructed to choose a
variety of responses spanning the score point scale, eliminating blank or off-topic responses and
14

responses that were less representative of the response types most seen in scoring. The scoring
directors also chose 12 validity papers (very clear papers representing all score points) and a set
of calibration (retraining) papers. Three of the validity papers were designated as “validity
review” responses (i.e., if a rater assigned an incorrect score to one of these responses, the essay
distribution system would immediately send a message to the rater, providing an image of the
response with the correct score and an annotation explaining the correct score).
In the online training that was used with distributed raters and regional raters, the raters
were expected to complete the training at their individual paces. For the stand-up training in the
regional site, the raters were led through a training session from the front of the room with paper
training materials. Members of the stand-up group progressed through training as a group at the
same pace. At the regional site, raters could ask questions about the responses, either online or
by going directly to a supervisor, and either the scoring director or a scoring supervisor would
answer the question. For the distributed raters, scoring directors and scoring supervisors would
respond to questions online or by phone. Supervisory staff in all three groups documented
questions and interventions.
Analyses
Scoring data were scaled to a Rasch rating scale model using the Winsteps software
(Linacre, 2009b).1 The scaling and parameter estimation was carried out twice, each approach
estimating parameters through a different frame of reference. In the first scaling, parameters
were estimated for the Rasch rating scale model with no parametric restrictions being placed on
the process (i.e., all parameters were estimated, and none were fixed/anchored, referred to
1 It is common to utilize the Facets computer program to scale rating data to the Rasch rating scale model when there is more than one facet of measurement (e.g., raters and items). In the current study, because raters assigned scores to a single writing prompt, there was only one facet of measurement, so the Winsteps program was utilized due to the increased flexibility that program offers for post-scaling analysis.
15

previously as an internal frame of reference). In the second scaling, parameters were estimated
for the Rasch rating scale model by anchoring each examinee’s ability on the value of the
consensus score assigned by a panel of expert raters who carried out the range-finding process
conducted for this study (referred to previously as an external frame of reference).
For each rater, several indices were computed for each of the two scaling frameworks,
and those indices are shown in Table 2. The analyses were conducted in two phases. In the first
phase, each of the raw score indices were compared to the latent trait indices for the sake of
illustrating the correspondence between indices from the two contexts. Specifically, latent trait
indices that are shown to correspond to the mean of the ratings ( rX ) are indicators of
severity/leniency rater effects. Latent trait indices that are shown to correspond to the standard
deviation of the ratings ( ) are indicators of rater centrality. Latent trait indices that are shown
to correspond to the correlation between ratings and expert ratings ( ) are indicators of
accuracy/inaccuracy rater effects.
rS
Exrr ,
16

Table 2: Rater Effect Indices
Model Symbol Description
Raw Scores rX Mean of ratings
rS SD of ratings
Exrr , Correlation between ratings and expert ratings
Latent Trait r Rater location parameter estimate
,rx
r Score-estimate correlation
UMSr Unweighted mean-square fit index
WMSr Weighed mean-square fit index
ZUMSr Standardized unweighted mean-square fit index
ZWMSr Standardized weighted mean-square fit index
rexp,res Expected-residual correlation
In the second phase of the data analyses, individual raters were flagged for exhibiting
rater severity/leniency, centrality, and inaccuracy. Critical values for generating rater effect flags
were determined through a judgment-based process, and that process is described in the Rater
Effects Detection section of the RESULTS. The rates at which raters exhibited each of these
types of effects are compared across training/scoring contexts to evaluate the potential efficacy
of each approach.
RESULTS
Rater Effect Detection
Table 3 displays descriptive statistics for each of the raw score and latent trait rater effect
indicators. Raw mean ratings ranged from a low of 1.71 to a high of 2.84, meaning that the
difference in ratings was over 1 point apart on the 4-point scale for the most severe and lenient
17

raters. The standard deviation of the raw ratings ranged from a low of 0.73 to a high of 1.05,
meaning that the rater who exhibited the most evidence of centrality assigned ratings that were
only 70% as variable as those assigned by the rater who assigned the most variable ratings.
Finally, the validity coefficient, the correlation between the assigned raw ratings and the ratings
assigned by experts, ranged from a low of 0.46 to a high of 0.80.
Table 3: Rater Effect Index Descriptive Statistics
Index Mean SD Minimum Maximum
Consensus 2.23 0.88 1 4
rX 2.30 0.22 1.71 2.84
rS 0.88 0.08 0.73 1.05
Exrr , 0.70 0.06 0.46 0.80
r 0.00 0.74 -2.05 1.77
,rxr 0.76 0.06 0.52 0.88
UMSr 0.99 0.30 0.47 2.24
WMSr 1.00 0.29 0.49 1.85
ZUMSr -0.34 3.18 -8.04 9.00
ZWMSr -0.32 3.90 -9.00 9.00
rexp,res 0.01 0.16 -0.46 0.38
Note: The latent trait indices shown here are from the internal calibration.
The correlations between raw ratings and the rater severity estimates for both the internal
and external scaling strategies were both about 1.00, indicating that the rater location parameter
18

19
estimates provide the same depiction of rater severity as do the raw score indices. To
demonstrate the strength of the relationship between the remaining raw score and the latent trait
rater effect indicators, scatterplots were created for each relevant pairing. Figure 1 displays the
scatterplots for the centrality effect indicators. The top row displays the scatterplots for the
internal scaling, and the bottom row displays the plots for the external scaling. From left to right,
the columns display the relationship between the raw score standard deviation with UMSr, WMSr,
, and rexp,res. Clearly, for the internal scaling, the raw score standard deviation correlates
most strongly with the residual-expected correlation (r = .70). When the raw score standard
deviation suggests centrality (i.e., it approaches 0.00), the value of the residual-expected
correlation approaches -1.00. On the other hand, for the external scaling, the correlation is
strongest for UMSr and WMSr (r = .77 and .97, respectively). As the standard deviation becomes
smaller, which is evidence of rater centrality, so do these fit indices. It is worth noting that the
relationship between fit indices and raw score standard deviation is weak under the internal
scaling approach, which is the more common of the approaches employed in operational settings.
,rxr

Figure 1: Scatterplots for Centrality Indicators
Internal
Raw SD vs UMS
0.00
0.50
1.00
1.50
2.00
2.50
0.70 0.90 1.10SD
UM
S
Raw SD vs WMS
0.00
0.50
1.00
1.50
2.00
0.70 0.80 0.90 1.00 1.10
SD
WM
S
Raw SD vs Rpm
0.50
0.60
0.70
0.80
0.90
0.70 0.80 0.90 1.00 1.10
SD
Slo
pe
Raw SD vs Rres,exp
-0.50
-0.30
-0.10
0.10
0.30
0.50
0.70 0.80 0.90 1.00 1.10
SD
Rre
s,ex
p
Raw SD vs UMS
2.00
2.50
3.00
3.50
4.00
4.50
5.00
0.70 0.80 0.90 1.00 1.10
SD
UM
S
Raw SD vs WMS
2.00
2.50
3.00
3.50
4.00
0.70 0.80 0.90 1.00 1.10
SD
WM
S
Raw SD vs Rpm
-0.80
-0.70
-0.60
-0.50
-0.400.70 0.80 0.90 1.00 1.10
SD
Rpm
Raw SD vs Rres,exp
-1.00
-0.95
-0.90
-0.85
-0.80
-0.750.70 0.80 0.90 1.00 1.10
SD
Rre
s,ex
p
External
20

Figure 2 displays the scatterplots for the inaccuracy effect indicators. The top row
displays the scatterplots for the internal scaling and the bottom row displays the plots for the
external scaling. From left to right, the columns display the relationship between the raw score
standard deviation with UMSr, WMSr, , and rexp,res. Clearly, for the internal scaling, the
validity coefficient (i.e., the correlation between expert and raw ratings) correlates most strongly
with the score-measure correlation (r = .91). When the validity coefficient suggests inaccuracy
(i.e., it approaches 0.00), the value of the score-measure correlation also approaches 0.00. On the
other hand, for the external scaling, the relationship between the point-measure correlation and
the validity coefficient is nearly perfect (r = .99), although the relationship is negative rather than
positive. As the value of the validity coefficient approaches zero, the negative values of the
point-measure correlation increase toward zero also. It is also worth noting that, under internal
scaling, the relationship between fit indices and the validity coefficient is negative. In addition,
the relationship between the validity coefficient and the residual-expected correlation is
moderately strong and positive under the internal scaling and is strong and negative under the
external scaling.
,rxr
21

Figure 2: Scatterplots for Inaccuracy Indicators
Internal
Validity Coefficient vs UMS
0.00
0.50
1.00
1.50
2.00
2.50
0.40 0.50 0.60 0.70 0.80
Validity Coefficient
UM
S
Validity Coefficient vs WMS
0.20
0.60
1.00
1.40
1.80
0.40 0.50 0.60 0.70 0.80
Validity Coefficient
WM
S
Validity Coefficient vs Rpm
0.50
0.60
0.70
0.80
0.90
0.40 0.50 0.60 0.70 0.80
Validity Coefficient
Rpm
Validity Coefficient vs Rres,exp
-0.60
-0.40
-0.20
0.00
0.20
0.40
0.40 0.50 0.60 0.70 0.80
Validity Coefficient
Rre
s,ex
p
Validity Coefficient vs UMS
2
2.5
3
3.5
4
4.5
5
0.40 0.50 0.60 0.70 0.80
Validity Coefficient
UM
S
Validity Coefficient vs WMS
2
2.2
2.4
2.6
2.8
3
3.2
3.4
3.6
3.8
4
0.40 0.50 0.60 0.70 0.80
Validity Coefficient
WM
S
Validity Coefficient vs Rpm
-0.85
-0.8
-0.75
-0.7
-0.65
-0.6
-0.55
-0.5
-0.45
-0.40.40 0.50 0.60 0.70 0.80
Validity Coefficient
Rpm
Validity Coefficient vs Rres,exp
-0.95
-0.90
-0.85
-0.80
-0.75
-0.700.40 0.50 0.60 0.70 0.80
Validity Coefficient
Rre
s,ex
p
External
22

These relationships suggest the following potential strategies for detecting rater effects
within a latent trait scaling framework.
Severity/Leniency: Flag cases that are outside of an acceptable band surrounding the
center of the distribution of r values. A defensible way to determine the critical
values for this band would be to determine a maximum deviation in mean ratings that
would be deemed acceptable for the application in question. For example, if the
analyst believes that the maximum acceptable variability in ratings would be one-half
of a raw score point from the expert ratings, then the corresponding values of r can
be identified and raters falling outside of those limits would be flagged for severity or
leniency.
Centrality
o Internal Scaling: Flag cases that fall below a chosen value of rexp,res. A
defensible way to determine this critical value would be to identify a value of
the raw score standard deviation that is relatively small in comparison to the
average standard deviation of raw scores across raters, and then use simple
regression to determine the corresponding predicted value of rexp,res. For
example, if the analyst believes that a raw score standard deviation that is 80%
as large as the average raw score standard deviation is too small, then the
analyst would identify the corresponding values of rexp,res through simple
regression. Raters falling below that limit would be flagged for centrality.
o External Scaling: Flag cases that fall below a chosen value of WMS. A
defensible way to determine that critical value would be to identify a value of
23

Inaccuracy
o Internal Scaling: Flag cases that fall below a chosen value of ,rxr . A
defensible way to determine this critical value would be to identify a value of
the validity coefficient that would be deemed unacceptably low; then use that
value as the critical value for ,rxr , flagging raters falling below that limit for
inaccuracy.
o External Scaling: Flag cases that fall below a chosen value of ,rxr . A
defensible way to determine this critical value would be to identify a value of
the validity coefficient that would be deemed unacceptably low; then use that
value as the critical value for ,rxr , flagging raters falling below that limit for
inaccuracy.
We applied these strategies to identifying training/scoring context differences in rates of
rater effects. Specifically, through a judgmental process, we identified raw score thresholds for
which we wanted to flag raters for exhibiting each effect. Table 4 displays the results of that
process. For each rater effect, we determined a rationale (second column of Table 4) based on a
raw score metric for flagging raters for each type of effect. For example, we decided to flag
raters for severity or leniency if a rater’s mean raw score was more than one-half of a score point
away from the mean of the scores assigned by expert raters. For centrality, we decided to flag
raters if the standard deviation of their assigned scores was less than 90% of the value of the
24
25
standard deviation of the scores assigned by experts. For inaccuracy, we decided to flag raters if
the correlation between their assigned scores and those assigned by expert raters was less than
.65.
The fourth column of Table 4 indicates the analogous latent trait index for internal and
external scaling approaches, and the fifth and sixth columns display the critical values (arrived at
through the process indicated in the bulleted list above) and the classification agreement rate
with the raw score index, respectively. With the exception of detecting centrality under an
internal scaling, the agreement rates were greater than 90%.
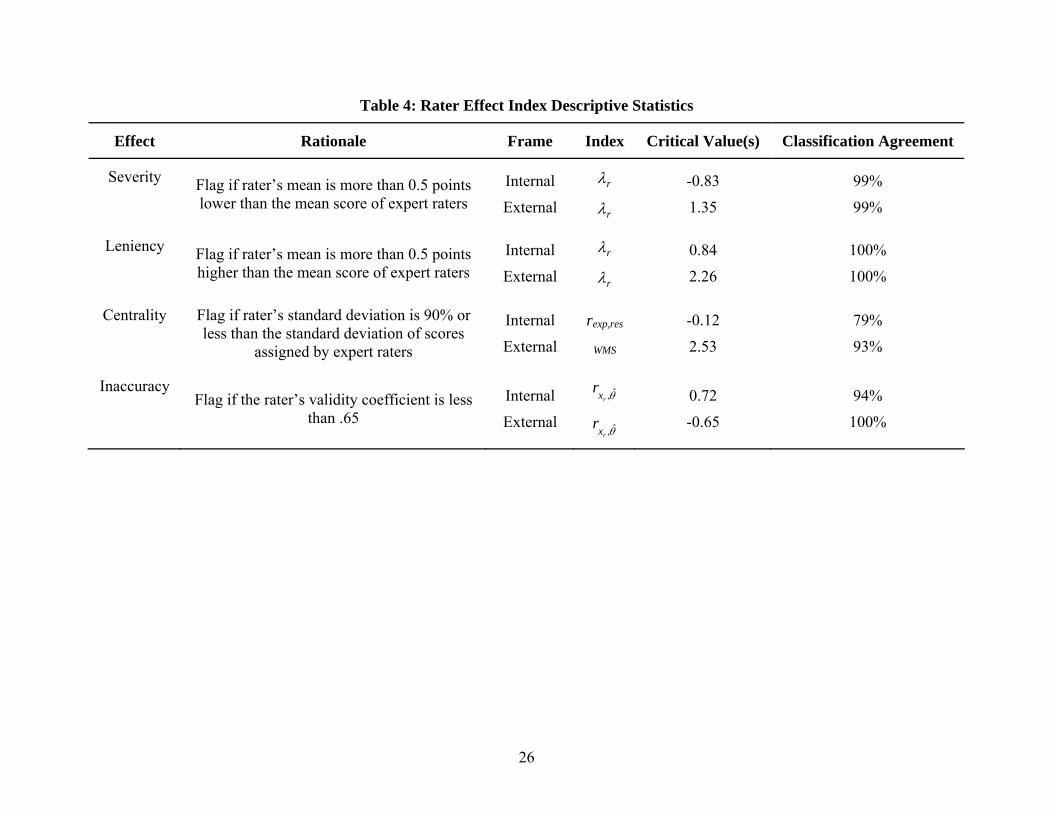
Table 4: Rater Effect Index Descriptive Statistics
Effect Rationale Frame Index Critical Value(s) Classification Agreement
Severity Flag if rater’s mean is more than 0.5 points lower than the mean score of expert raters
Internal
External
r
r
-0.83
1.35
99%
99%
Leniency Flag if rater’s mean is more than 0.5 points higher than the mean score of expert raters
Internal
External
r
r
0.84
2.26
100%
100%
Centrality Flag if rater’s standard deviation is 90% or less than the standard deviation of scores
assigned by expert raters
Internal
External
rexp,res
WMS
-0.12
2.53
79%
93%
Inaccuracy Flag if the rater’s validity coefficient is less
than .65
Internal
External
,rxr
,rxr
0.72
-0.65
94%
100%
26
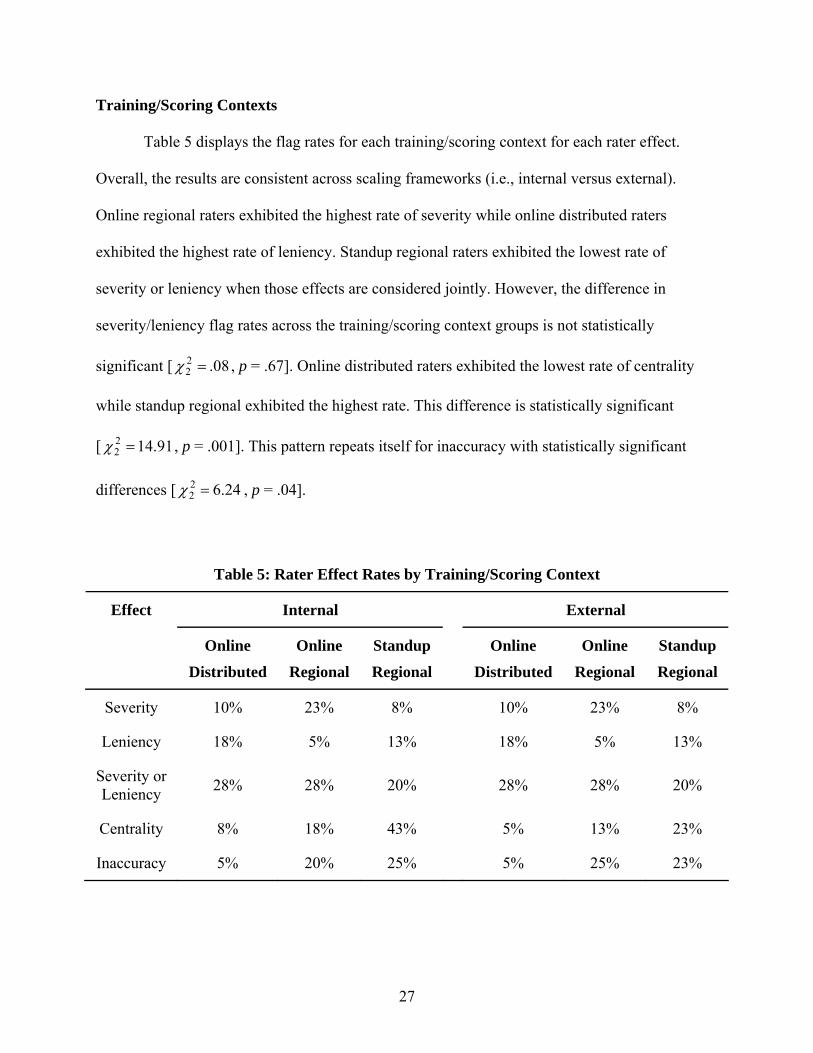
Training/Scoring Contexts
Table 5 displays the flag rates for each training/scoring context for each rater effect.
Overall, the results are consistent across scaling frameworks (i.e., internal versus external).
Online regional raters exhibited the highest rate of severity while online distributed raters
exhibited the highest rate of leniency. Standup regional raters exhibited the lowest rate of
severity or leniency when those effects are considered jointly. However, the difference in
severity/leniency flag rates across the training/scoring context groups is not statistically
significant [ , p = .67]. Online distributed raters exhibited the lowest rate of centrality
while standup regional exhibited the highest rate. This difference is statistically significant
[ 9 , p = .001]. This pattern repeats itself for inaccuracy with statistically significant
differences [ , p = .04].
08.22
1
24.622
.1422
Table 5: Rater Effect Rates by Training/Scoring Context
Internal External Effect
Online
Distributed
Online
Regional
Standup
Regional
Online
Distributed
Online
Regional
Standup
Regional
Severity 10% 23% 8% 10% 23% 8%
Leniency 18% 5% 13% 18% 5% 13%
Severity or Leniency
28% 28% 20% 28% 28% 20%
Centrality 8% 18% 43% 5% 13% 23%
Inaccuracy 5% 20% 25% 5% 25% 23%
27

DISCUSSION & CONCLUSIONS
The results of this study indicate that there is a fairly high level of consistency between
values of raw score and latent trait rater effect indices. Concerning severity and leniency, it is no
surprise that the rater location parameter estimate is strongly correlated with raw score means. In
the case of the Rasch model, rater location parameter estimates are non-linear transformations of
the raw total scores. Regardless of the scaling strategy implemented (i.e., internal versus
external), the relationship is nearly perfect. In fact, the classification agreement between raw
score and latent trait indicators of severity and leniency was about 99%.
Similarly, concerning rater inaccuracy, it is no surprise that the point-measure correlation
for raters is strongly correlated with the validity coefficient, which is the correlation between
ratings assigned by a rater and ratings assigned by expert raters. If one assumes that expert
ratings and estimated examinee abilities are comparable to true scores, then one would expect a
very high level of consistency in terms of how these two measures correlate with a rater’s
ratings. We found that this relationship is stronger under external scaling than under internal
scaling. Again, this result is not particularly surprising. In the case of external scaling, examinee
measures were anchored on the values of the expert-assigned scores. Hence, the correlation
between a rater’s ratings and the examinee measures, the point-measure correlation, should be
perfectly consistent with the correlation between a rater’s ratings and the expert-assigned scores,
the validity coefficient. On the other hand, in the case of internal scaling, examinee measures
were estimated based on the ratings assigned by the pool of raters. In this case, the examinee
measures are influenced by the idiosyncrasies of individual raters. As a result, the relationship
between the point-measure correlation and the validity coefficient is weaker, albeit still relatively
28

strong. In fact, the agreement rate between raw score and external flag rates for inaccuracy was
about 100% while it was only 94% for raw scores when compared to internal flag rates.
On the other hand, the results for centrality were somewhat unexpected. In previous
research, dating back to Engelhard (1994), analysts have focused on fit indices associated with
the raters to detect centrality effects. In this study, the raw score standard deviation was not very
highly associated with values of these fit indices—ranging from about .30 to about .40—under
an internal scaling frame of reference, which is likely the most common approach in operational
settings. In fact, it was the residual-expected correlation, proposed by Wolfe (2004, 2005), that
exhibited the strongest relationship to raw score standard deviations under an internal scaling
frame of reference. Regardless, that index in that frame of reference did not perform particularly
well, achieving only a 79% agreement with the raw score flags. Under the external scaling frame
of reference, however, the fit indices, particularly the WMS, correlated very strongly with the raw
score standard deviation, achieving a 93% agreement rate on rater flags. Further evaluation of
alternative methods for scaling data, and indices for detecting rater effects should be conducted,
particularly simulation studies.
The results of this study also suggest that raters who are trained and score in online
distributed environments may be less likely to exhibit centrality and inaccuracy effects. Because
the online-distributed raters performed better than the online-regional and the standup-regional
raters, it may be that a combination of the available population and the conditions under which
training takes place is the source of this difference. However, because this study was not a
randomized experiment, it is not possible to rule out pre-existing differences in the three groups,
although the groups were shown to be comparable with respect to demographic, educational, and
experiential variables. These results suggest that it may be possible to reach a broader population
29

of potential raters and to implement rater training and scoring in a considerably more efficient
manner than is current standard practice, should future research replicate these results.
30

References
Andrich, D. (1978). A rating formulation for ordered response categories. Psychometrika, 43,
561-573.
Bernardin, H.J. (1978). Effects of rater training on leniency and halo errors in student ratings of
instructors. Journal of Applied Psychology, 63(3), 301-308.
Bernardin, H.J., & Pence, E.C. (1980). Effects of rater training: Creating new response sets and
decreasing accuracy. Journal of Applied Psychology, 65(1), 60-66.
Borman, W.C. (1979). Format and training effects on rating accuracy and rater errors. Journal of
Applied Psychology, 64(4), 410-421.
Cellar, D.F., Curtis Jr, J.R., Kohlepp, K., Poczapski, P., & Mohiuddin, S. (1989). The effects of
rater training, job analysis format and congruence of training on job evaluation ratings.
Journal of Business & Psychology, 3(4), 387-401.
Elder, C., Barkhuizen, G., Knoch, U., & von Randow, J. (2007). Evaluating rater responses to an
online training program for L2 writing assessment. Language Testing, 24(1), 37-64.
Elder, C., Knoch, U., Barkhuizen, G., & von Randow, J. (2005). Individual feedback to enhance
rater training: Does it work? Language Assessment Quarterly, 2(3), 175-196.
Engelhard, G., Jr. (1994). Examining rater errors in the assessment of written composition with a
many-faceted Rasch model. Journal of Educational Measurement, 31, 93-112.
Hedge, J.W., & Kavanagh, M.J. (1988). Improving the accuracy of performance evaluations:
Comparison of three methods of performance appraiser training. Journal of Applied
Psychology, 73(1), 68-73.
Ivancevich, J.M. (1979). Longitudinal study of the effects of rater training on psychometric error
in ratings. Journal of Applied Psychology, 64(5), 502-508.
31

Knoch, U., Read, J., & von Randow, J. (2007). Re-training writing raters online: How does it
compare with face-to-face training? Assessing Writing, 12(1), 26-43.
Linacre, J.M. (2009a). Facets Rasch measurement computer program (Version 3.66.0) [computer
program]. Chicago, IL: Winsteps.com
Linacre, J.M. (2009b). WINSTEPS Rasch measurement computer program (Version 3.68.0)
[Computer program]. Chicago, IL: Winsteps.com.
McIntyre, R.M., Smith, D.E., & Hassett, C.E. (1984). Accuracy of performance ratings as
affected by rater training and perceived purpose of rating. Journal of Applied Psychology,
69(1), 147-156.
Myford, C.M., & Wolfe, E.W. (2003). Detecting and measuring rater effects using many-facet
Rasch measurement: Part I. Journal of Applied Measurement, 4, 386-422.
Myford, C.M., & Wolfe, E.W. (2004). Detecting and measuring rater effects using many-facet
Rasch measurement: Part II. Journal of Applied Measurement, 5, 189-227.
Noonan, L.E., & Sulsky, L.M. (2001). Impact of frame-of-reference and behavioral observation
training on alternative training effectiveness criteria in a Canadian military sample.
Human Performance, 14(1), 3-26.
Pulakos, E.D. (1984). A comparison of rater training programs: Error training and accuracy
training. Journal of Applied Psychology, 69(4), 581-588.
Roch, S.G., & O'Sullivan, B.J. (2003). Frame of reference rater training issues: recall, time and
behavior observation training. International Journal of Training & Development, 7(2),
93-107.
32

Stamoulis, D.T., & Hauenstein, N.M. (1993). Rater training and rating accuracy: Training for
dimensional accuracy versus training for ratee differentiation. Journal of Applied
Psychology, 78(6), 994-1003.
Sulsky, L.M., & Day, D.V. (1994). Effects of frame-of-reference training on rater accuracy
under alternative time delays. Journal of Applied Psychology, 79(4), 535-543.
Uggerslev, K.L., & Sulsky, L.M. (2008). Using frame-of-reference training to understand the
implications of rater idiosyncrasy for rating accuracy. Journal of Applied Psychology,
93(3), 711-719.
Wilson, E.B., & Hilferty, M.M. (1931). The distribution of chi-square. Proceedings of the
National Academy of Sciences of the United States of America, 17, 684-688.
Wolfe, E.W. (2004). Identifying rater effects using latent trait models. Psychology Science, 46,
35-51.
Wolfe, E.W. (2005). Identifying Rater Effects in Performance Ratings. In S. Reddy (Ed.),
Performance Appraisals: A Critical View (pp. 91-103). Hyderabad, India: ICFAI
University Press.
Wolfe, E.W., Chiu, C.W.T., & Myford, C.M. (2000). Detecting rater effects with a multi-faceted
Rasch rating scale model. In M. Wilson & G. Engelhard (Eds.), Objective measurement:
Theory into practice (Vol. 5, pp. 147-164). Stamford, CT: Ablex.
Wolfe, E.W., & Moulder, B.C. (2001). Detecting differential rater functioning over time
(DRIFT) using a Rasch multi-faceted rating scale model. Journal of Applied
Measurement, 2(3), 256-280.
Wright, B.D., & Linacre, M. (1994). Reasonable mean-square fit values. Rasch Measurement
Transactions, 8, 370.
33

34
Wright, B.D., & Masters, G.N. (1982). Rating scale analysis: Rasch measurement. Chicago, IL:
MESA.