Embed Size (px)
Citation preview

Rating Systems Vs Machine Learning on the context of sports
George Kyriakides, Kyriacos Talattinis, George StefanidesDepartment of Applied Informatics,
University Of Macedonia

Aim of the paper
• Study the performance of linear algebra rating systems and machine learning methods.• Evaluate the accuracy of each method.• Evaluate the quality of the predictions.

Structure of the presentation
• Clarify what is rating and ranking.• Explain linear algebra rating systems used in this paper.• Explain machine learning methods used in this paper.• Compare the rating systems and machine learning methods by
predicting soccer games (English Premier League).• Conclusions.• Possible future work.

Related research
• Nivard van Wijk uses a Pseudo Least-Squares Estimator to predict soccer matches.• Paul Kvam and Joel S. Sokol use logistic regression and markov chains to
predict basketball matches.• Keeneth Massey uses linear algebra to rank basketball and football teams.• Search engines use machine learning to rank search results.• No comparison between machine learning and linear algebra has been
made.• Studies on accuracy have been conducted for machine learning and linear
algebra independently, but never for profitability of the methods.

Rating
• The evaluation of an object, based on some desirable criteria. For example, a car may have a 1 to 5 stars NCAP safety rating.

Ranking
• A relationship between a set of objects, such that for any two items, one is ranked higher than the other and is consequently better, assuming that the object ranked highest is the best.• Rating can be used to rank a set of objects. Sorting a vector containing
ratings we are effectively ranking the elements.

Ranking

Rating Systems
• Many systems have been proposed:
• Massey• Colley• Markov• Keener• Google Page Rank• mHITS• Elo

Methods used in this paper
• Massey• Colley • mHITS

Massey Method
• Proposed by Kenneth Massey in 1997 to rank NCAA (National Collegiate Athletic Association) teams.• It uses a linear least squares regression to solve a system of linear
equations.• A rating vector is calculated, where each entry corresponds to the
rating of the team.

• Massey Method (2)
• First, the matrix M is generated , where Mij is the number of games teams i and j played, multiplied by -1 and Mii is the total number of games team i has played.
• The second step is to calculate the vector p, where pi is the total number of points scored by team i, minus the points that were scored against the team.• The final step is to solve the system of equations: Mr= p
where r is the vector of the ratings, so if ri > rj team i is better than team j.

Colley Method
• Proposed by astrophysicist Dr.Wesley Colley in 2001.• Variation of a simple method used to rank teams, which calculated
the win ratio of each team (wins divided by total games).• A system of linear equations is solved in order to find a rating vector.

Colley Method (2)
• First the matrix C is computed as follows:
Where nij is the total number of games played between teams i and j.• Second, the vector b is computed:
-)
Where wi are the total wins of team i and li are the total losses of team i.• Finally, the system of equations
Cr=b is solved, where r is the vector with the rating for each team.

mHITS(Offence-Defense model)
• It was proposed by Anjela Govan in 2009. • Generalization of HITS algorithm for ranking web pages. • It uses the offensive and defensive strength of the teams to calculate
their overall rating.• The method calculates the rating of a team:
Where ri is the rating of the team, oi is its offensive strength and di is its defensive strength.

mHITS(Offence-Defense model) (2)
• Initialize vector d(0)=[d1 d2....dn] as a vector of ones.• Compute the matrix A, where aij is the score that team j generated against
team i (0 if they did not play each other).• The third step of the initialization is to calculate
• Continue to refine o and d, by continuously computing
• High o values signify strong offence and low d values signify strong defense

Machine Learning

Methods used in this paper
• Decision Trees• Artificial Neural Networks• Random Forests

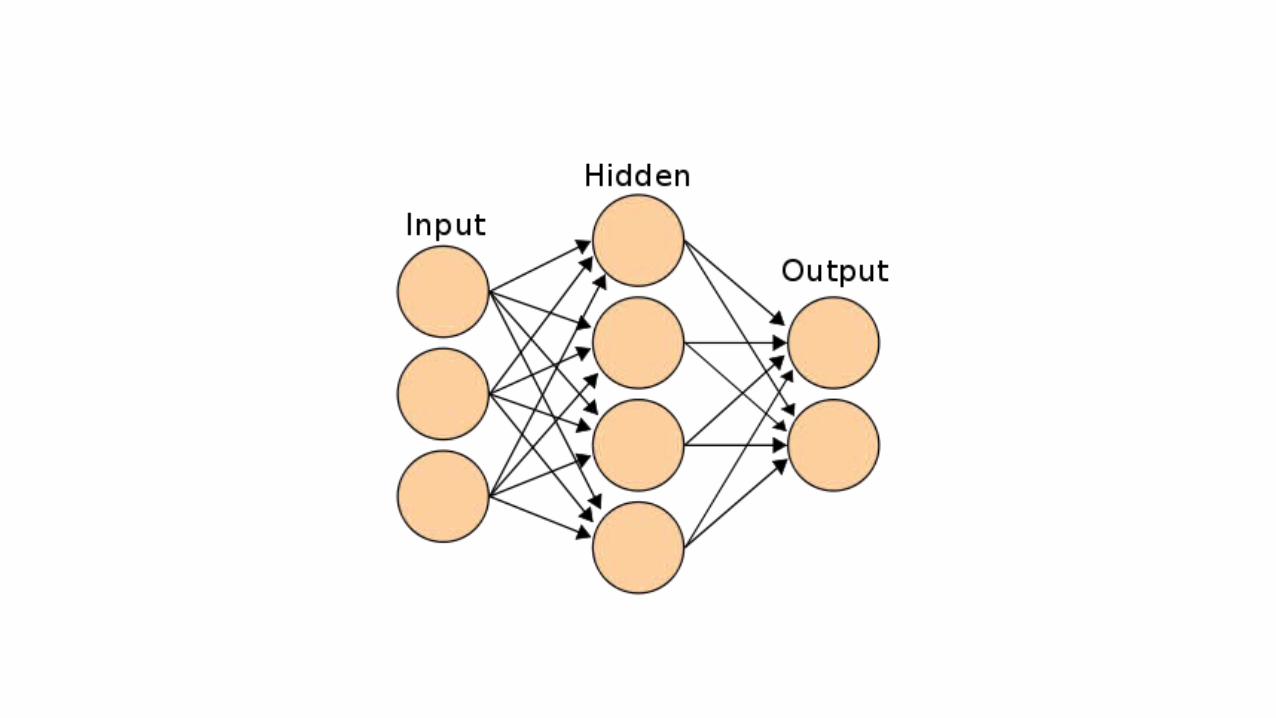
Artificial Neural Networks
• Networks of nodes which accept inputs and produce an output based on an activation function.• Nodes’ connections are weighted.• Usually organized in layers .• Each layer is a group of nodes not connected to any node of the same
group.• Input data is presented to the input layer, “hidden” layers process the
data and the presentation layer outputs the results.
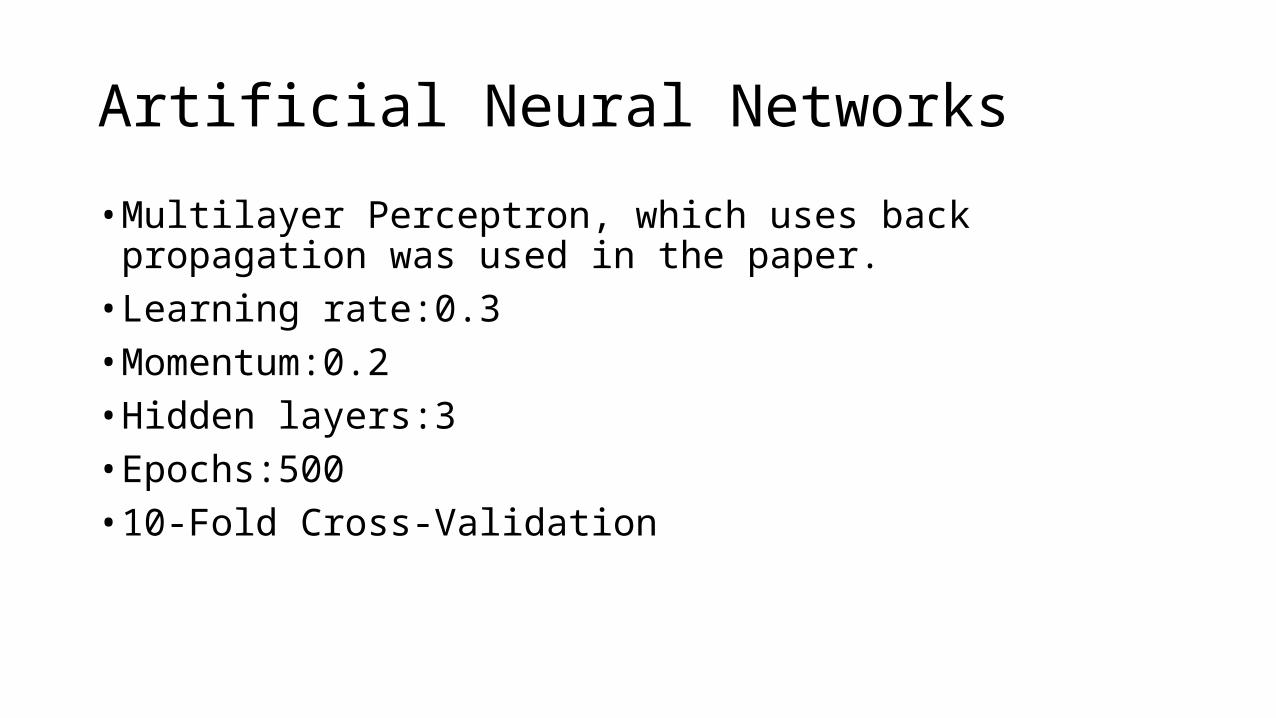
Artificial Neural Networks
• Multilayer Perceptron, which uses back propagation was used in the paper.• Learning rate:0.3• Momentum:0.2• Hidden layers:3• Epochs:500• 10-Fold Cross-Validation

Decision Tree Learning
• Uses a decision tree to classify/predict.• Also known as classification/regression trees.• Leaves represent class labels.• Branches split the data into appropriate sets.• Different algorithms use different criteria to split the data.

C4.5
• Uses Information Gain to measure the quality of the split. • Confidence factor: 0.7• Unpruned• 10-Fold Cross-Validation

Random Forest
• A multitude of decision trees is generated• Each tree is trained independently, using a different subset of the data• Input data is presented to all trees• The class that the highest percentage of trees produce is the output
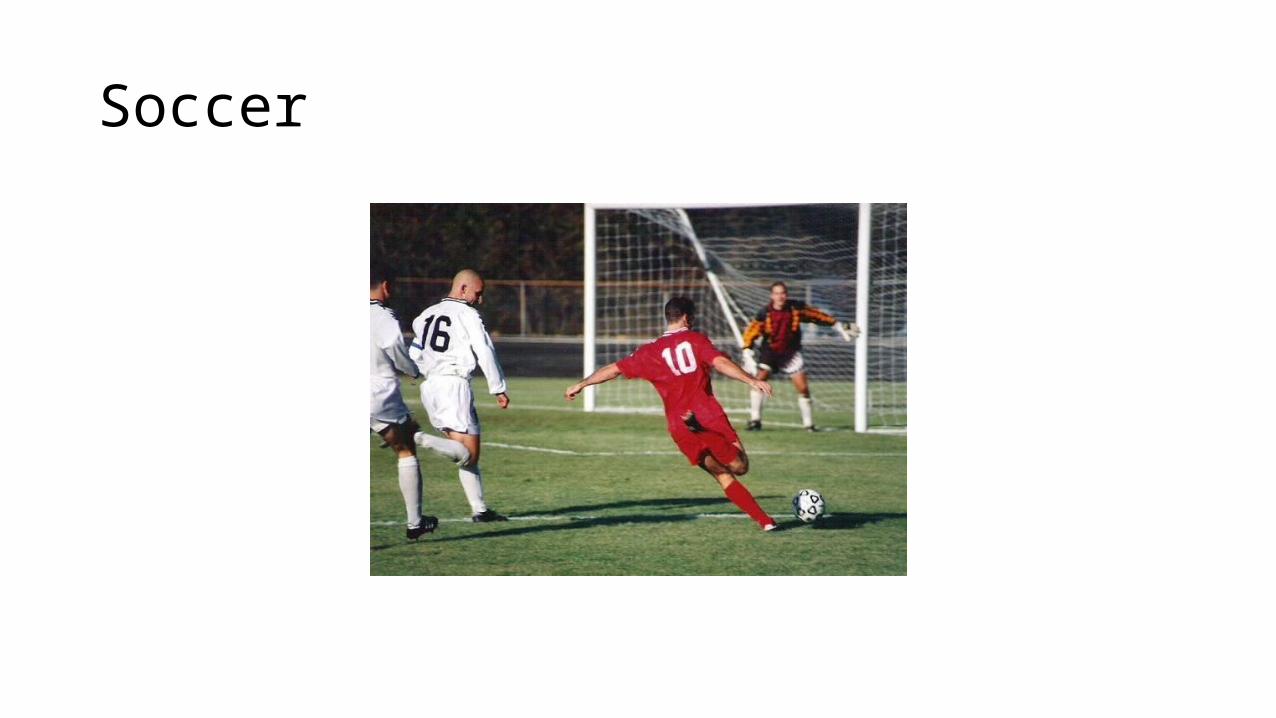
Soccer

Soccer
• Ternary Result Season 2009-2010
Draw Away Home
Predictions
• Hindsight• Foresight• Betting
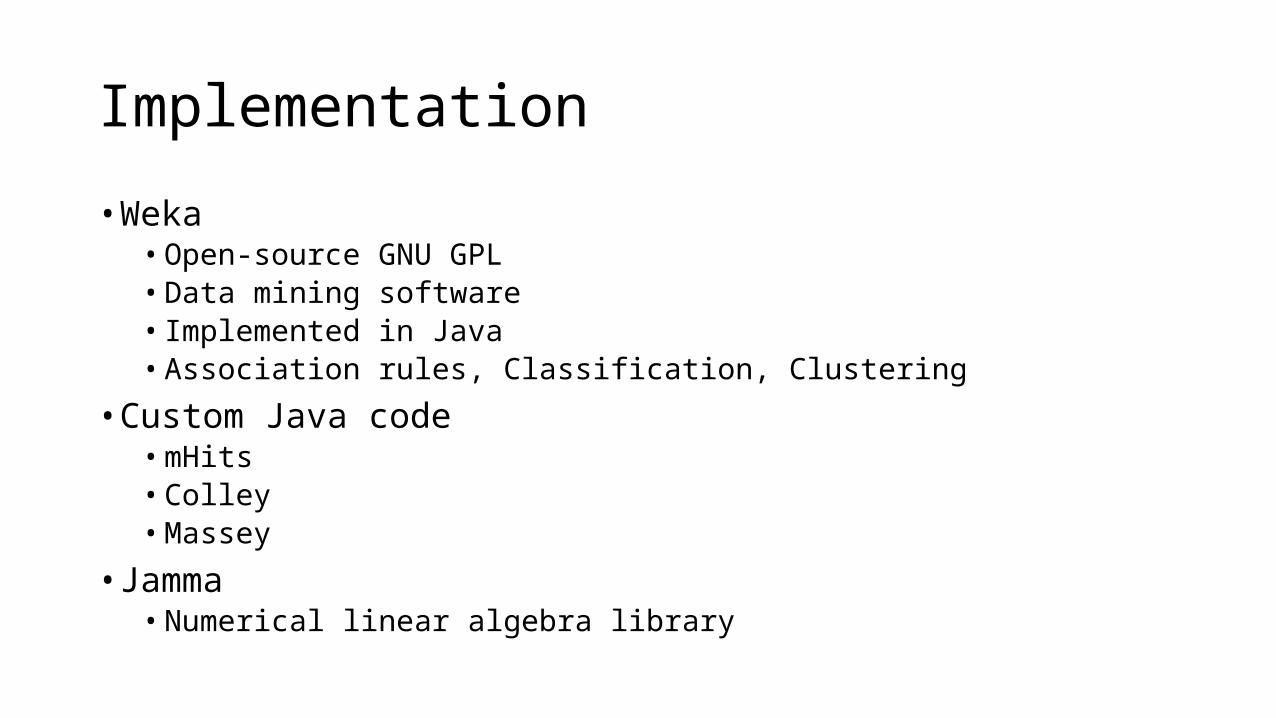
Implementation
• Weka• Open-source GNU GPL• Data mining software• Implemented in Java• Association rules, Classification, Clustering
• Custom Java code• mHits• Colley• Massey
• Jamma• Numerical linear algebra library

Hindsight AccuracyMethod
SeasonNeural Trees Forest MHITS Colley Massey
2008 /2009 52.63% 71.32% 97.11% 51.37% 53.62% 38.90%
2009 / 2010 56.32% 72.11% 94.74% 55.20% 56.54% 48.67%
2010 /2011 51.32% 60.79% 94.74% 45.07% 47.05% 42.18%
2011 /2012 50.53% 58.42% 96.32% 54.95% 55.46% 47.68%
2012 /2013 45.79% 55.00% 95.79% 50.88% 51.88% 42.95%

Hindsight (2)
2008 /2009 2009 / 2010 2010 /2011 2011 /2012 2012 /20130.00%
20.00%
40.00%
60.00%
80.00%
100.00%
120.00%
Neural Trees Forest MHITS Colley Massey

Confusion Matrices
• Confusion matrices allow the visualization of the performance of an algorithm• It indicates the quality of the predictions
• 95% Accuracy:
Class Actual
A B
A 95 5
B 0 0

Confusion Matrices (Hindsight)
Class Actual
Loss Win Draw
Loss 87 2 2
Win 5 186 2
Draw 1 8 87
Random Forest Decision Tree ANN94.74% 72.11% 56.32%
Class Actual
Loss Win Draw
Loss 65 21 5
Win 11 178 4
Draw 13 52 31
Class Actual
Loss Win Draw
Loss 18 46 27
Win 8 167 18
Draw 11 56 29

Foresight AccuracyMethod
SeasonNeural Trees Forest MHITS Colley Massey
2008 /2009 56.84% 49.47% 50.00% 56.97% 48.78% 36.25%
2009 / 2010 50.00% 52.63% 38.42% 53.05% 48.17% 42.10%
2010 /2011 46.32% 46.32% 41.58% 46.63% 42.78% 41.06%
2011 /2012 46.84% 46.84% 37.89% 53.35% 46.90% 45.83%
2012 /2013 50.53% 48.74% 48.42% 52.40% 47.70% 40.54%

Foresight (2)
2008 /2009 2009 / 2010 2010 /2011 2011 /2012 2012 /20130.00%
10.00%
20.00%
30.00%
40.00%
50.00%
60.00%
Neural Trees Forest MHITS Colley Massey

Confusion Matrices (Foresight)
Random Forest Decision Tree ANN37.89% 46.84% 46.84%
Class Actual
Loss Draw Win
Loss 21 15 17
Draw 18 12 13
Win 31 24 39
Class Actual
Loss Draw Win
Loss 17 11 25
Draw 13 6 24
Win 15 13 66
Class Actual
Loss Draw Win
Loss 16 4 33
Draw 19 0 24
Win 21 0 73

Making a profit
Quantity VS Quality

Making a profit
• Quantity.• 90% Accuracy – 1.05 average booking odds• In 100 games, betting 1 unit each time: • Win 90*0.05 = 4.5 • Lose 10• Net profit = 10-4.5 = -5.5

Making a profit
• Quality• 60% Accuracy – 2.5 average booking odds• In 100 games, betting 1 unit each time: • Win 60*1.5 = 90 • Lose 40• Net profit = 90 - 40 = 50
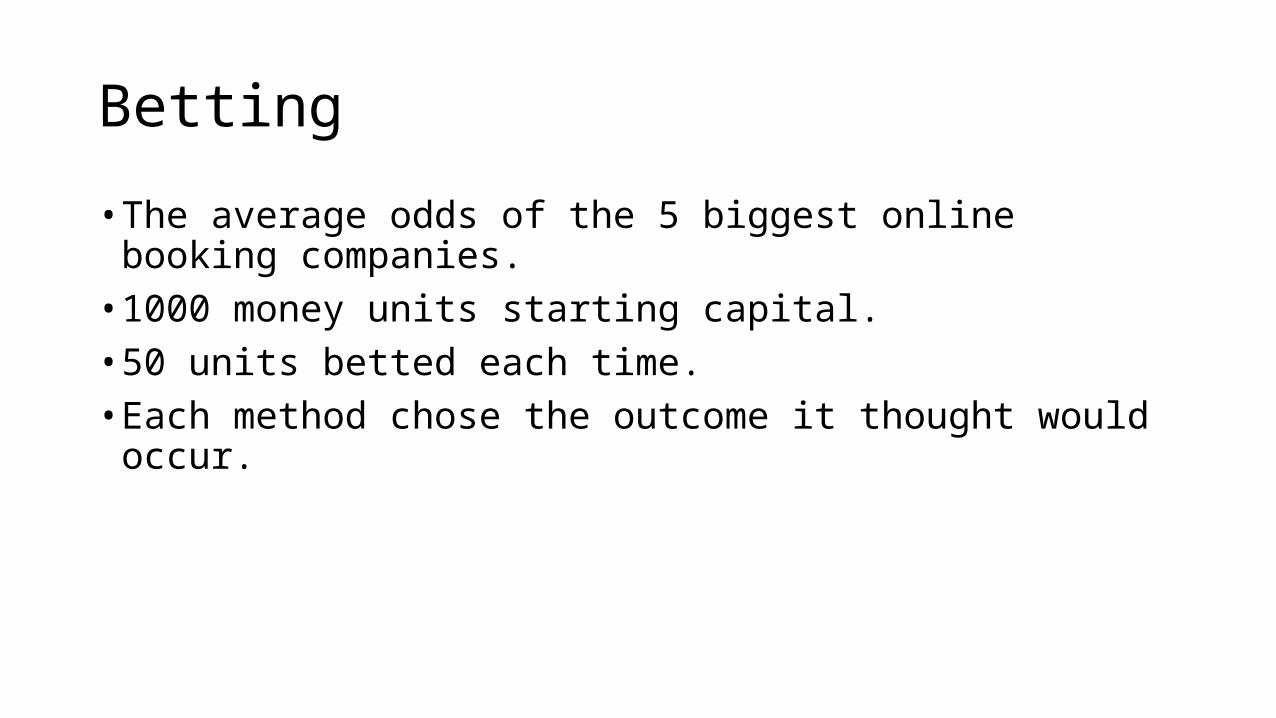
Betting
• The average odds of the 5 biggest online booking companies.• 1000 money units starting capital.• 50 units betted each time.• Each method chose the outcome it thought would occur.

Foresight Betting Money SumMethod
SeasonNeural Trees Forest MHITS Colley Massey
2008 /2009 1368 1422 1157 1802 510 -690
2009 / 2010 816 -918 54 480 157 -722
2010 /2011 1387 366 1899 132 -707 -351
2011 /2012 541 -55 99 1629 839 2252
2012 /2013 2010 1815 1635 1133 993 551
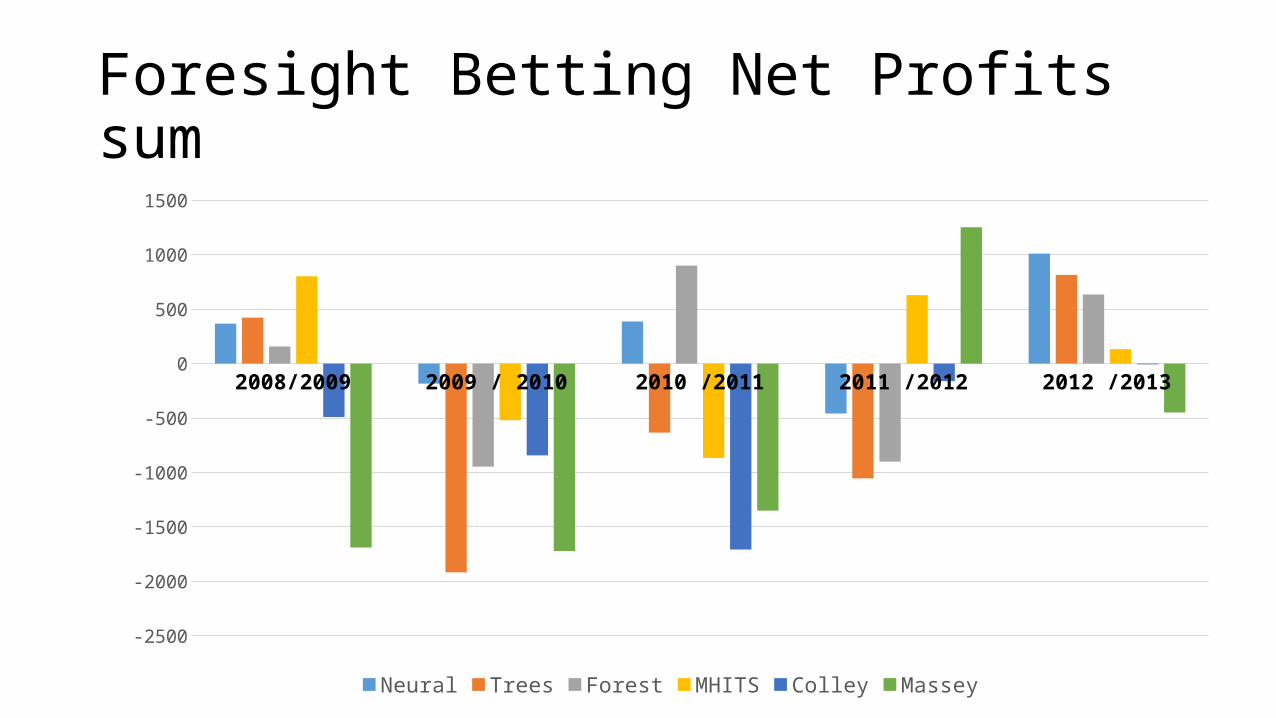
Foresight Betting Net Profits sum
2008/2009 2009 / 2010 2010 /2011 2011 /2012 2012 /2013
-2500
-2000
-1500
-1000
-500
0
500
1000
1500
Neural Trees Forest MHITS Colley Massey
Conclusions
• Machine learning proved to be superior in hindsight predictions and prediction quality.• Draws are the most difficult to predict.• mHITS is the best in foresight prediction accuracy, but not in quality.
• Neural Networks are the most profitable of all.• Random Forests constructed the best hindsight models.
Future Work
• Other Machine Learning Methods• Portfolio management for betting section• Other sports, where a draw is much less likely to be the outcome

Thank you very much for your attention!