Embed Size (px)
Citation preview
Statewide Rail Capacity and System Needs Study Task 7 – Rationale for Washington State Investment in Private Rail
prepared for
Washington State Transportation Commission
prepared by
Cambridge Systematics, Inc.
with
Global Insight, Inc. HDR, Inc. Transit Safety Management
December 2006 www.wstc.com
technical memorandum
technical memorandum
Statewide Rail Capacity and System Needs Study
Task 7 – Rationale for Washington State Investment in Private Rail
prepared for
Washington State Transportation Commission
prepared by
Cambridge Systematics, Inc.
with
Global Insight, Inc. HDR, Inc. Transit Safety Management
date
December 2006
December 2006 Statewide Rail Capacity and System Needs Study Task 7 – Rationale for Washington State Investment in Private Rail
i
Table of Contents
Introduction .............................................................................................................................. 1
Objective.................................................................................................................................... 3
Previous State Involvement in Rail Sector Projects .......................................................... 4 Washington Grain Train Program ................................................................................. 6
History....................................................................................................................... 6 Justification for State Participation........................................................................ 6
Produce Railcar Pool........................................................................................................ 7 History....................................................................................................................... 7 Justification for State Participation........................................................................ 8
Palouse River and Coulee City Line .............................................................................. 8 History....................................................................................................................... 8 Justification for State Participation........................................................................ 9
Justification for State Participation: Revised Code of Washington .............................. 12
Rationale for Public Participation in the Rail System ...................................................... 15 How Do the Four Primary User Groups Provide a Rationale for State Participation in the Rail System?.................................................................................... 15
Measurement of Public Benefit: Precedent from Other Organizations and States.... 25 Metrics and Evaluation Processes Used by Other States and Organizations.......... 25
Federal Railroad Administration (FRA) Benefits Methodology ....................... 25 Florida DOT.............................................................................................................. 26 Tennessee DOT......................................................................................................... 27 Freight Mobility Strategic Investment Board....................................................... 28 The Washington State Department of Transportation (WSDOT) Freight Rail Assistance Application Packet ............................................................................... 31
Framework to Examine Public Benefit ................................................................................ 32 What Metrics Should Be Used to Measure Public Benefit in Washington State? ... 33 How Can Public Benefit Be Measured/Quantified? ................................................... 35 Summary and Conclusion............................................................................................... 38
December 2006 Statewide Rail Capacity and System Needs Study Task 7 – Rationale for Washington State Investment in Private Rail
ii
List of Tables
Table 1. Previous State Participation in the Rail System – Three Examples......................... 5
Table 2. Relevant Sections of the Revised Code of Washington (RCW) ............................. 13
Table 3. Contribution to Washington State GSP of Freight-Rail Intensive Industries (in Billions of dollars)................................................................................................... 16
Table 4. Contribution to Washington State Employment of Freight-Rail Intensive Industries...................................................................................................... 16
Table 5. Pacific Ports Ranked by TEUs Handled 1994 and 2004 .......................................... 20
Table 6. Estimates of External Costs (Dollar Per Passenger Mile) ....................................... 24
Table 7. FRA Measurement of Benefits .................................................................................... 26
Table 8. Florida DOT Measurement of Benefits...................................................................... 27
Table 9. Tennessee DOT Measurement of Benefits ................................................................ 28
Table 10. FMSIB Criteria .............................................................................................................. 30
Table 11. Washington State Department of Transportation Freight Rail Assistance Application Packet Criteria........................................................................................ 32
Table 12. Washington State Measurement of Benefit .............................................................. 35
Table 13. Variables to Include in The State Benefit-Cost Analysis......................................... 36
Table 14. Possible Methodology by Which to Measure Public Benefit in Washington State.......................................................................................................... 37
Table 15. Cross-User Group Benefit/Impact Methodology.................................................... 39
December 2006 Statewide Rail Capacity and System Needs Study Task 7 – Rationale for Washington State Investment in Private Rail
ii
List of Figures
Figure 1 National Value of Crops Sold 2002 Washington State Compared Nationally .... 17
Figure 2. Total Employment in Agriculture and Food Sectors, 1997 – 2025 ........................ 18
Figure 3. Washington Amtrak Ridership Distributions by Station Location, Fiscal Year 2005............................................................................................................. 23
December 2006 Statewide Rail Capacity and System Needs Study Task 7 – Rationale for Washington State Investment in Private Rail
1
Task 7 – Rationale for Washington State Investment in Private Rail
Introduction
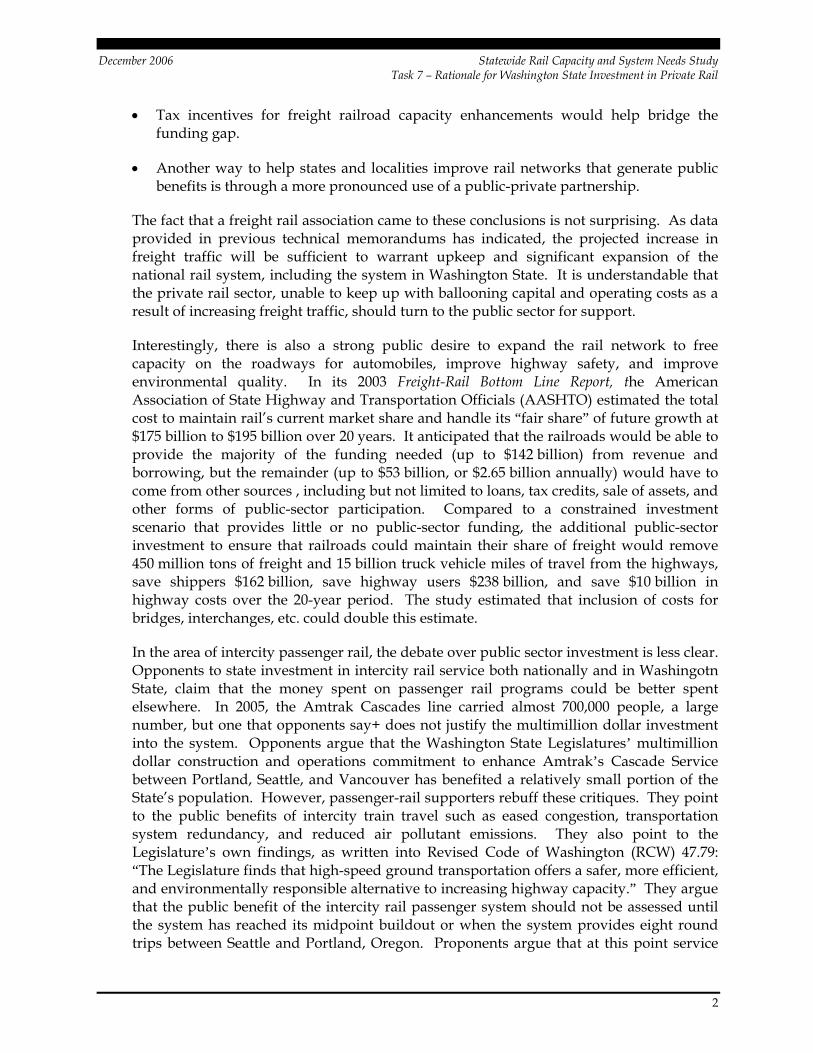
Public sector funding has been used throughout the history of the United States to develop and ensure a reliable and efficient transportation network. The Interstate Highway System, funded through the Federal-Aid Highway Act of 1956, granted a 90 percent Federal match to the development of highway infrastructure on the premise that a seamless roadway network was essential for the purpose of national defense and the transport of troops and material around the country. Likewise, the building of the United States canal system in the early 1800s was funded largely by the United States Reclamation Service (now the Bureau of Reclamation). This was done to facilitate the westward movement of American settlers and give access to the rich land and resources of the Western United States. The Federal funding of these transportation networks was justified on the premise that the public benefit received by the nation as a whole was worth the expenditure of public funds.
This premise is once again being brought to the forefront of Federal and state transportation decision-making. In September 2006, the American Association of Railroads (AAR), an organization that represents all of the major freight railroads in the United States, Canada, and Mexico, produced a policy paper entitled, The Importance of Adequate Rail Investments.1 Speaking as the voice for the Class I railroads, the paper came to the following conclusions:
• Despite recent gains in rail traffic and revenue, rail profitability is still insufficient to fund investment needs. The rail industry does not generate earnings sufficient to cover all of its costs and provide for reinvestment.
• Investments in freight rail infrastructure would lead to major public benefits. The railroad funding shortfall means that many rail infrastructure projects that would otherwise improve the ability of our nation’s farms, mines, and factories to move their goods to market; speed the flow of imports and exports; relieve highway congestion; reduce pollution; lower highway costs; save fuel; and enhance safety will be delayed or never made at all.
1 Railroads: The Vital Link to North America’s Economic Future: The Importance of Adequate Rail
Investment. Association of American Railroads, September 2006, www.aar.org.
December 2006 Statewide Rail Capacity and System Needs Study Task 7 – Rationale for Washington State Investment in Private Rail
2
• Tax incentives for freight railroad capacity enhancements would help bridge the funding gap.
• Another way to help states and localities improve rail networks that generate public benefits is through a more pronounced use of a public-private partnership.
The fact that a freight rail association came to these conclusions is not surprising. As data provided in previous technical memorandums has indicated, the projected increase in freight traffic will be sufficient to warrant upkeep and significant expansion of the national rail system, including the system in Washington State. It is understandable that the private rail sector, unable to keep up with ballooning capital and operating costs as a result of increasing freight traffic, should turn to the public sector for support.
Interestingly, there is also a strong public desire to expand the rail network to free capacity on the roadways for automobiles, improve highway safety, and improve environmental quality. In its 2003 Freight-Rail Bottom Line Report, the American Association of State Highway and Transportation Officials (AASHTO) estimated the total cost to maintain rail’s current market share and handle its “fair share” of future growth at $175 billion to $195 billion over 20 years. It anticipated that the railroads would be able to provide the majority of the funding needed (up to $142 billion) from revenue and borrowing, but the remainder (up to $53 billion, or $2.65 billion annually) would have to come from other sources , including but not limited to loans, tax credits, sale of assets, and other forms of public-sector participation. Compared to a constrained investment scenario that provides little or no public-sector funding, the additional public-sector investment to ensure that railroads could maintain their share of freight would remove 450 million tons of freight and 15 billion truck vehicle miles of travel from the highways, save shippers $162 billion, save highway users $238 billion, and save $10 billion in highway costs over the 20-year period. The study estimated that inclusion of costs for bridges, interchanges, etc. could double this estimate.
In the area of intercity passenger rail, the debate over public sector investment is less clear. Opponents to state investment in intercity rail service both nationally and in Washingotn State, claim that the money spent on passenger rail programs could be better spent elsewhere. In 2005, the Amtrak Cascades line carried almost 700,000 people, a large number, but one that opponents say+ does not justify the multimillion dollar investment into the system. Opponents argue that the Washington State Legislatures’ multimillion dollar construction and operations commitment to enhance Amtrak’s Cascade Service between Portland, Seattle, and Vancouver has benefited a relatively small portion of the State’s population. However, passenger-rail supporters rebuff these critiques. They point to the public benefits of intercity train travel such as eased congestion, transportation system redundancy, and reduced air pollutant emissions. They also point to the Legislature’s own findings, as written into Revised Code of Washington (RCW) 47.79: “The Legislature finds that high-speed ground transportation offers a safer, more efficient, and environmentally responsible alternative to increasing highway capacity.” They argue that the public benefit of the intercity rail passenger system should not be assessed until the system has reached its midpoint buildout or when the system provides eight round trips between Seattle and Portland, Oregon. Proponents argue that at this point service
December 2006 Statewide Rail Capacity and System Needs Study Task 7 – Rationale for Washington State Investment in Private Rail
3
and reliability will be sufficient enough to attract the predicted ridership and that the public benefits of the system become apparent.
To assess these trends and issues and determine a rationale for investing or not investing in the State’s rail system, Washington State must address several questions:
• Should the State invest public funds to support the privately owned freight railroads?
• What types of investments are appropriate and justifiable in the freight system?
• What types of investment are appropriate and justifiable in the passenger system?
• Where will the State realize the greatest public benefits from investments?
• What levels of service are required from the railroads to realize these public benefits?
This technical memorandum outlines the rationale for public sector investment in the rail system; addresses how the benefits and impacts of public investments can be measured and compared in a manner that is easily reproducible and implementable; and discussion how this information can be organized to make decisions to invest or not invest in the State’s rail system.
Objective
The objective of Technical Memorandum 7 is to define the rationale for public participation in rail improvements for Washington State,and to develop a methodology for estimating the benefits, costs, risks, and appropriate level of investment and public participation.
The first section of the technical memorandum provides an overview of the historical precedents for the State’s involvement in the rail system, including a brief description of:
• Cases where the State has participated in the private rail sector, including a brief case history and the principles that guided the State’s decision to participate; and
• Legislative framework currently in place to govern the State’s involvement in the rail system.
The technical memorandum then introduces the rationale for public participation in the rail system by describing the users of the rail system and explaining their importance to the health of the State’s economy. The four primary user groups include:
• Agriculture;
• Manufacturers;
• Ports and international trade businesses; and
• Rail Passengers.
December 2006 Statewide Rail Capacity and System Needs Study Task 7 – Rationale for Washington State Investment in Private Rail
4
The technical memorandum describes the concept of public benefit and a framework that can be used by the State to measure public benefits and make decisions about which projects or action it should consider, what level of state involvement is appropriate, and what types of partnerships with other interested entities are appropriate.
The following section reviews the processes developed by other states and organizations to measure how public benefit. The states and organizations include:
• Federal Railroad Administration (FRA);
• Florida Department of Transportation (DOT);
• Tennessee DOT;
• The Freight Mobility Strategic Investment Board (FMSIB); and
• The Washington State DOT Freight Rail Assistance Application Packet.
Finally, the technical memorandum describes a proposed framework by which to examine the public benefit of rail investments and actions in Washington State, covering:
• Best metrics to use to define public benefit (i.e., what constitutes public benefit);
• Suggested variables to use for Washington State benefit/impact methodology; and
• Framework by which public benefit can be measured.
The framework is then used in Technical Memorandum 8 to analyze several packages of projects as illustrations of how the recommended approach could be used for decision-making in Washington State.
Previous State Involvement in Rail Sector Projects
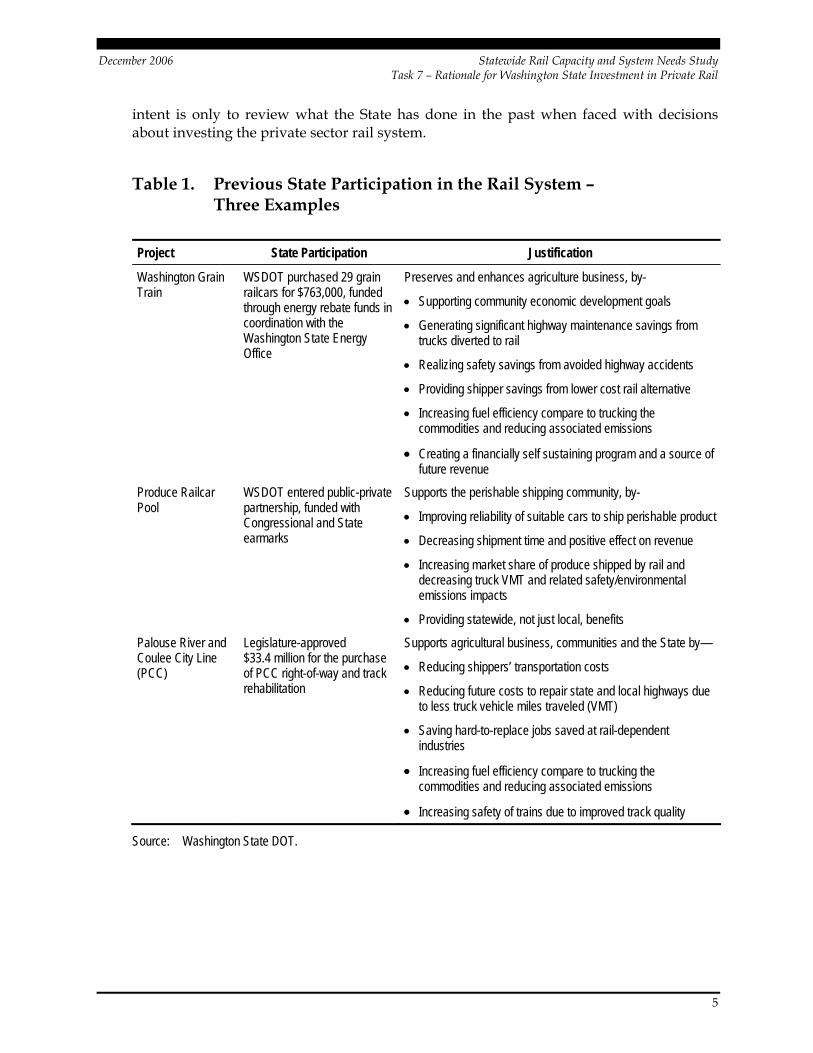
Washington State has a history of participation in the private rail system. Recent years have witnessed several occasions when the State determined that the public benefit of a rail investment or action justified the expenditure of public funds. Although the mechanisms and details of each case differ, it is worth reviewing these past cases to establish the historical perspective of state participation in the rail system. The three cases—listed in Table 1 and described below—are 1) the Washington Grain Train, 2) the Produce Railcar Pool, and 3) the Palouse River and Coulee City short line railroad (the PCC). Each case provides an overview of the project, a summary the State’s action, and a description of the public benefits identified by the State to of its level of participation.
The use of the case examples in this technical memorandum case examples is not intended to support or confirm the rationale for the State’s participation in these projects. The
December 2006 Statewide Rail Capacity and System Needs Study Task 7 – Rationale for Washington State Investment in Private Rail
5
intent is only to review what the State has done in the past when faced with decisions about investing the private sector rail system.
Table 1. Previous State Participation in the Rail System – Three Examples
Project State Participation Justification
Washington Grain Train
WSDOT purchased 29 grain railcars for $763,000, funded through energy rebate funds in coordination with the Washington State Energy Office
Preserves and enhances agriculture business, by-
• Supporting community economic development goals
• Generating significant highway maintenance savings from trucks diverted to rail
• Realizing safety savings from avoided highway accidents
• Providing shipper savings from lower cost rail alternative
• Increasing fuel efficiency compare to trucking the commodities and reducing associated emissions
• Creating a financially self sustaining program and a source of future revenue
Produce Railcar Pool
WSDOT entered public-private partnership, funded with Congressional and State earmarks
Supports the perishable shipping community, by-
• Improving reliability of suitable cars to ship perishable product
• Decreasing shipment time and positive effect on revenue
• Increasing market share of produce shipped by rail and decreasing truck VMT and related safety/environmental emissions impacts
• Providing statewide, not just local, benefits
Palouse River and Coulee City Line (PCC)
Legislature-approved $33.4 million for the purchase of PCC right-of-way and track rehabilitation
Supports agricultural business, communities and the State by—
• Reducing shippers’ transportation costs
• Reducing future costs to repair state and local highways due to less truck vehicle miles traveled (VMT)
• Saving hard-to-replace jobs saved at rail-dependent industries
• Increasing fuel efficiency compare to trucking the commodities and reducing associated emissions
• Increasing safety of trains due to improved track quality
Source: Washington State DOT.
December 2006 Statewide Rail Capacity and System Needs Study Task 7 – Rationale for Washington State Investment in Private Rail
6
Washington Grain Train Program
History
The Washington Grain Train Program was initiated by Washington State DOT in 1994 in response to a decision by the Class I railroads to shift their focus away from regional businesses and toward more lucrative long-haul service between the Pacific Northwest ports and the Midwest. The resulting grain car shortages in Washington State made it difficult and more expensive for Eastern Washington grain shippers to get their grain to market, reducing their competitiveness and market reach.
The Washington Grain Train Program is a public-private partnership (PPP) between Washington State DOT; four grain cooperatives (Wheat Growers of Endicott, Whitman County Grain Growers, Touche Valley Grain Growers, and St. John Grain Growers); the Blue Mountain Railroad; and the Port of Walla Walla. When the program was initiated, Washington State DOT purchased 29 grain cars for use by the four grain cooperatives. The cars were moved by the Blue Mountain Railroad, operating on light-density branch lines. Washington State DOT purchased the cars with Federal funds received as grants from the Stripper Well Oil Rebate Fund. The Port of Walla Walla manages the car fleet and acts as the fiduciary agent for the program. The program serves over 2,500 cooperative members and farmers in one of the most productive grain-growing regions in the world.
Justification for State Participation
The State’s objective in initiating the Grain Train Program was to alleviate grain car shortages in eastern Washington, preserve business for the short line railroads operating on the threatened light-density rail lines, and help ensure the viability of the grain industry and short line rail servces in Washington in the future. The economic evaluation of the Grain Train Program provides useful insights into the public sector benefits resulting from the first year of operation of the program.2 The public sector benefits in the first year of operation of the program, as identified by the study included—
• Shipper and community benefits extending beyond grain shippers, reaching to all products and commodities of rural areas, and all entities seeking economic development and rural area revitalization.
• Highway maintenance and rehabilitation cost savings resulting from the reduction of truck trips by the use of railcars. The 1995 savings were estimated to be $167,821 for state highways, and $20,906 for country roads, totaling to $188,727.
• Safety savings from avoided highway accidents, estimated to be $8,263 in 1995.
2 Retrieved from Washington State DOT web site at
http://www.wsdot.wa.gov/rail/projects/graindouble.cfm.
December 2006 Statewide Rail Capacity and System Needs Study Task 7 – Rationale for Washington State Investment in Private Rail
7
• Average shipper savings of $0.066 per bushel, resulting in total regional savings of $92,320 from the use of lower cost rail services compared to alternative modes (trucking and barge). With the application of economic multiplier effects, these savings were expected to be doubled throughout the regional economy.
• Fuel efficiency gains from the use of increased rail service, resulting in savings of almost 11,000 gallons of fuel valued at $14,129, as well as associated reductions in environmental pollution.
• The entire program was found to be financially self sustaining, bringing in revenues that could be used for railcar maintenance and rehabilitation, as well as purchase of new railcars.
Despite of reported public sector benefits of the Grain Train Program, there has been opposition to the State’s participation in investments in rail rolling stock. Free-market advocates maintain that the government has no business in intervening in the marketplace, using public dollars to subsidize one of sector (e.g., grain shippers and carriers) at the expense of other businesses. Taxpayer groups have criticized the limited and highly concentrated geographic focus of the Grain Train Program within the State as an unfair allocation of general tax funds.
These criticisms can be answered if benefits to the State in terms of true environmental and safety externalities and actual reduced maintenance costs exceed costs to the State of purchasing the trains. The benefits to shippers in terms of reduced rates are technically a private benefit, and the decision to preserve jobs in the affected businesses is a political decision. However, the latter should be based on regional economic development goals, and calls for measuring the degree of job benefits associated with the investment. Both issues are addressed in benefits evaluation methodology recommended in this technical memorandum.
Produce Railcar Pool
History
In 2003, the Washington Legislature passed the Produce Railcar Pool law in response to an ongoing shortage of refrigerated produce railcars for shipping perishable commodities. The perishable shipper community was being hurt financially by the shortage of proper equipment to ship their goods, often having to wait one to three weeks for a suitable car to become available. The problem was about to be exacerbated by the fact that Burlington Northern Santa Fe Corporation (BNSF) railroad had only 1,800 refrigerated cars servicing its entire route network and was planning to retire 700 of them. The refrigerated railcar shortage problem was affecting Washington State’s economy because shippers were being forced to either pay higher transportation costs or to miss shipments altogether, making them less competitive in domestic and international markets. The law recognized the importance of maintaining a supply of railcars to transport perishable agricultural
December 2006 Statewide Rail Capacity and System Needs Study Task 7 – Rationale for Washington State Investment in Private Rail
8
products, and authorized Washington State DOT to create and operate a Produce Railcar Pool Program if external capital was provided.
Washington State DOT created a public-private partnership among state, Federal, and private agencies. Funds for the program came from a $2 million grant secured by Senator Patty Murray (D-Washington). However, since Federal funds could not be used to start the program, Washington State lawmakers earmarked an additional $200,000 to jumpstart the program. Private enterprise was brought into the funding package by an agreement between Washington State DOT and Rail Logistics LC, a provider of refrigerated railcars. Rail Logistics leased 50 refrigerated railcars to the State at $1,000 per month per car. This number can increase at any time, based on demand from the perishable shipping community. Rail Logistics also entered into a management contract with the State to manage the program at $1,000 per month and $30 per car. An innovative twist to the partnership was the fact that Rail Logistics would return $750 of the per shipment fees to the State to be used for continued funding of the Railcar Pool Program.
Justification for State Participation
The Produce Railcar Pool program was initiated after the success of the Grain Train program. Some of the arguments given to justify the State’s participation in the Produce Railcar Pool Program included—
• The perishable shipping community has a direct and measurable positive benefit to the State’s economy. It is, therefore, worthwhile for the State to ensure that it has the railcar supplies necessary to continue uninterrupted and reliable perishable product shipments.
• The initiation of the Produce Railcar Pool Program will increase rail service reliability and performance by ensuring efficient refrigerated railcar supply, therefore, decreasing shipment times for produce to reach markets. This should have a measurable positive impact on the State’s economy.
• The railcar pool program is expected to increase market share of produce shipments by rail, thus, reducing truck traffic and vehicle miles of travel (VMT), which will have direct environmental and safety benefits for Washington State.
• Unlike the Grain Train Program, the Produce Railcar Pool Program is expected to have statewide coverage of shippers and not a localized benefit for the State. It will result in the optimal realization of public benefits from taxpayer dollars.
Palouse River and Coulee City Line
History
The Palouse River and Coulee City Railroad (PCC) is the second longest rail system in Washington State, with 370 route miles in Washington. The PCC provides freight rail
December 2006 Statewide Rail Capacity and System Needs Study Task 7 – Rationale for Washington State Investment in Private Rail
9
service to about 70 rail-dependent businesses in eastern Washington. Eighty percent of its million annual tons of cargo is wheat, lentils, and other agriculture-related products. WATCO, Inc. bought the track from the BNSF and the Union Pacific Railroad (UPRR) in the mid-1990s. At that time, the track had a considerable backlog of deferred maintenance needs, and WATCO was unable to invest the necessary capital to upgrade and properly maintain the track. WATCO submitted a letter to the Governor stating it would abandon approximately one-half of the track, impacting approximately one-half of the businesses, unless the State provided support. This prompted the Washington State DOT to evaluate the public benefits of continued operations on the existing PCC.
Based on the analysis, the Washington State Legislature approved a 10-year strategy for addressing large freight-rail assistance projects in the 2003 Transportation Funding Package. This included $33.4 million for PCC-related projects, including:
• Acquisition of the PCC right-of-way for $7.028 million;
• Rehabilitation of the northern PCC lines for $21.089 million; and
• Rehabilitation of the southern lines for $5.313 million.
State law allows for rehabilitation grants when the public owns the right of way. It was, therefore, necessary for the Washington State DOT to acquire the track and land. The former owner has signed a lease with the Washington State DOT to continue rail operations. Rather than collecting a rent for use of the track, the agreement between the Washington State DOT and WATCO requires WATCO to provide quality service to shippers in eastern Washington, and to provide annual funding for track maintenance at $6,000 per track mile in current dollars. WATCO had been investing at a rate of $3,100 per track mile.
Justification for State Participation
The State’s decision to participate in the PCC was a combination of a quantitative and qualitative assessment of the public benefit received from the short line. The benefits calculations for the PCC line followed the Federal Railroad Administration’s (FRA) benefit-cost guidelines.3 (See discussion in Interim Report 2 of this study). The specific items considered were—
• Shipper’s savings on transportation costs;
• Reduced future costs to repair state and local highways due to less truck VMT;
• Jobs saved at rail-dependent industries;
• Environmental protection in the form of less fuel usage and air pollution; and
• Increased safety of trains through improved track quality. 3 From the Washington State Department of Transportation Internet site at
http://www.wsdot.wa.gov/Projects/ PCC_Acquisition/.
December 2006 Statewide Rail Capacity and System Needs Study Task 7 – Rationale for Washington State Investment in Private Rail
10
Based on analysis directed by the Washington State DOT, it was determined that the combined PCC projects generated total discounted benefits of $62 million. When compared to the $33 million total costs, this produced a benefit-cost (B/C) ratio of 1.86 and met the statutory requirement. Each of these items is described in detail below.
Shipper’ Savings
Abandonment of approximately one-half of the PCC would force shippers to seek other transportation modes for moving their goods to market, increasing the transportation costs and service quality of shipments, and making these goods less competitive. A study commissioned by Washington State DOT found that continued service by the PCC would save Washington State shippers between $1.8 million and $2.3 million in average annual transportation costs. For grain, which competes in a very price-sensitive international market, this is a significant 0.05 to 0.07 cents per bushel savings.
These savings were derived by first estimating the quantity and type of goods that would no longer be able to use the PCC. Diversion estimates were prepared to determine the most likely new transportation method (e.g., by truck or by barge). Average rates for rail, truck, and barge were then applied to shipments moving over the existing network and also to shipments forced to divert in an alternative scenario. Shipper savings were calculated as the net difference between costs in the alternative and base scenarios. These costs were reported as average annual savings in current dollars.
Reduced Future Highway Costs
Diversions from rail to truck can also have a significant economic impact on highway maintenance costs. A reduction of 8,000 to 10,000 carloads per year on the PCC would add approximately 29,000 additional full truckloads to eastern Washington’s secondary highways. This was determined by estimating the likely mix of trucks required to haul the diverted traffic, and then converting from railcars to tons to Truck Load Equivalents (TLE). The next step was to project the likely routes taken by the trucks and to determine the type and thickness of the roadways. Roadway pavement deterioration rate curves were used to project damage to the roadways, and these estimates were converted into annual maintenance costs. The estimated annual roadway maintenance savings to the Washington State DOT from the PCC purchase were $4.2 million to $4.8 million annually.4
4 Tolliver, Denver, Modeling Cross-Modal Benefits from Local Rail Service: State of the Art and Future
Needs, presented at the 84th Transportation Research Board (TRB) Meetings, Washington, D.C., January 12, 2005.
December 2006 Statewide Rail Capacity and System Needs Study Task 7 – Rationale for Washington State Investment in Private Rail
11
Jobs Saved
An analysis of job impacts yielded the following results—
• Loss of approximately 30 PCC jobs with an average hourly wage of $11.38;
• Potential closure of Green Giant asparagus canning, impacting 60 full-time and 1,100 seasonal jobs;
• Potential closure of feed mill and feedlot, impacting 60 jobs in Creston, a town with total population of fewer than 300 people. This plant was estimated to be worth $1.5 million per year to the area’s economy;
• Job losses at various fuel and chemical loading/unloading facilities;
• Impacts to 350 jobs in a Spokane County industrial park; and
• Closure of a grain elevator in Coulee City, the last major private employer in the town.
The FRA benefit-cost methodology stipulates that preservation of jobs can be considered a benefit for the length of time a worker is expected to be unemployed.
Environmental Protection
On average, railroads are three times more fuel efficient than trucks.5 Diverting freight from truck to rail can contribute to environmental improvements due to reduced fuel usage, and corresponding improvements in air quality. Although this public benefit was considered, it was not formally quantified and included in the benefit-cost analysis.
Improved Safety
There are two forms of improved safety: 1) reduced truck accidents as a result of fewer trucks on the roads, and 2) improved safety on the railroad through observing proper maintenance. The improvements in railroad safety were cited specifically as a benefit of this project, but were not quantified formally for inclusion in the benefit-cost analysis.
Other Qualitative Concerns
The decision to invest public funds in the PCC also considered additional factors such as an operational analysis of the railroad to ensure that it had a viable business plan and sufficient traffic to operate successfully; a market analysis to examine expected changes in existing and new business; an infrastructure study to assess rehabilitation and
5 Association of American Railroads, Overview of U.S. Freight Railroads, September 2004.
December 2006 Statewide Rail Capacity and System Needs Study Task 7 – Rationale for Washington State Investment in Private Rail
12
maintenance needs; and a risk assessment to examine hazards, risks, and liabilities connected with the railroad.6
The Washington State DOT’s analysis demonstrated that the PCC purchase and rehabilitation were viable, met the requirements of the RCW, provided economic and community benefits, and was strongly supported by eastern Washington communities. The quantification of benefits yielding a 1.86 benefit-to-cost (B/C) ratio was necessary for the project to move forward and one of the principal factors leading to its approval.
Justification for State Participation: Revised Code of Washington
The State’s participation in the rail system is guided specifically by the RCW. This code is a compilation of all permanent laws enforced in the State of Washington. Any code included in the RCW has been enacted by the Legislature and signed by the Governor. The laws reflects the political conclusions of previous studies and research, and are worth examining both for the guidance they provide and for the fact that they may need to be modified in the light of new research or study.
The sections of the RCW that are relevant to the topic of public participation in the private rail industry are summarized below in Table 2. These RCW provisions are also cited in later sections of this technical memorandum and in the draft and final reports. They have influenced the policy statement development in this project, as well as influenced the benefit/impact evaluation methodology.
6 Uznanski, K., Regional Grain-Gathering Networks: Lessons Learned from Washington State, presented
at the 84th TRB Meetings, Washington, D.C., January 12, 2005.
December 2006 Statewide Rail Capacity and System Needs Study Task 7 – Rationale for Washington State Investment in Private Rail
13
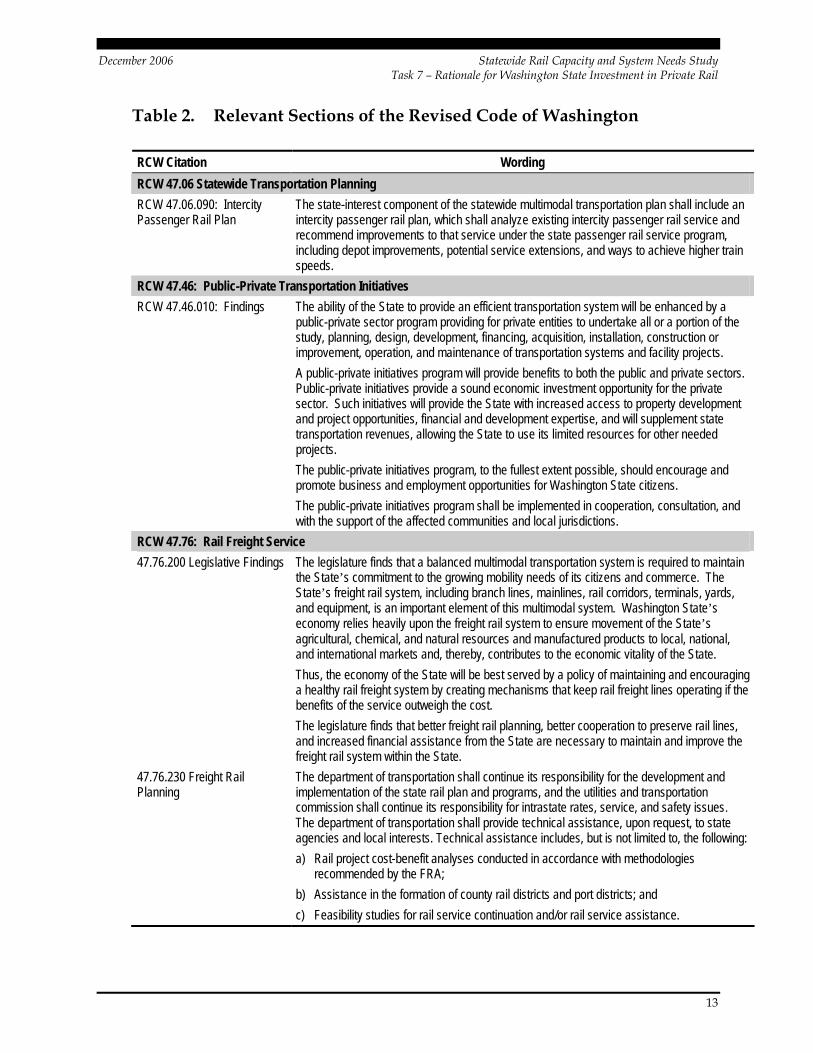
Table 2. Relevant Sections of the Revised Code of Washington
RCW Citation Wording RCW 47.06 Statewide Transportation Planning RCW 47.06.090: Intercity Passenger Rail Plan
The state-interest component of the statewide multimodal transportation plan shall include an intercity passenger rail plan, which shall analyze existing intercity passenger rail service and recommend improvements to that service under the state passenger rail service program, including depot improvements, potential service extensions, and ways to achieve higher train speeds.
RCW 47.46: Public-Private Transportation Initiatives RCW 47.46.010: Findings The ability of the State to provide an efficient transportation system will be enhanced by a
public-private sector program providing for private entities to undertake all or a portion of the study, planning, design, development, financing, acquisition, installation, construction or improvement, operation, and maintenance of transportation systems and facility projects. A public-private initiatives program will provide benefits to both the public and private sectors. Public-private initiatives provide a sound economic investment opportunity for the private sector. Such initiatives will provide the State with increased access to property development and project opportunities, financial and development expertise, and will supplement state transportation revenues, allowing the State to use its limited resources for other needed projects. The public-private initiatives program, to the fullest extent possible, should encourage and promote business and employment opportunities for Washington State citizens. The public-private initiatives program shall be implemented in cooperation, consultation, and with the support of the affected communities and local jurisdictions.
RCW 47.76: Rail Freight Service 47.76.200 Legislative Findings The legislature finds that a balanced multimodal transportation system is required to maintain
the State’s commitment to the growing mobility needs of its citizens and commerce. The State’s freight rail system, including branch lines, mainlines, rail corridors, terminals, yards, and equipment, is an important element of this multimodal system. Washington State’s economy relies heavily upon the freight rail system to ensure movement of the State’s agricultural, chemical, and natural resources and manufactured products to local, national, and international markets and, thereby, contributes to the economic vitality of the State. Thus, the economy of the State will be best served by a policy of maintaining and encouraging a healthy rail freight system by creating mechanisms that keep rail freight lines operating if the benefits of the service outweigh the cost. The legislature finds that better freight rail planning, better cooperation to preserve rail lines, and increased financial assistance from the State are necessary to maintain and improve the freight rail system within the State.
47.76.230 Freight Rail Planning
The department of transportation shall continue its responsibility for the development and implementation of the state rail plan and programs, and the utilities and transportation commission shall continue its responsibility for intrastate rates, service, and safety issues. The department of transportation shall provide technical assistance, upon request, to state agencies and local interests. Technical assistance includes, but is not limited to, the following: a) Rail project cost-benefit analyses conducted in accordance with methodologies
recommended by the FRA; b) Assistance in the formation of county rail districts and port districts; and c) Feasibility studies for rail service continuation and/or rail service assistance.
December 2006 Statewide Rail Capacity and System Needs Study Task 7 – Rationale for Washington State Investment in Private Rail
14
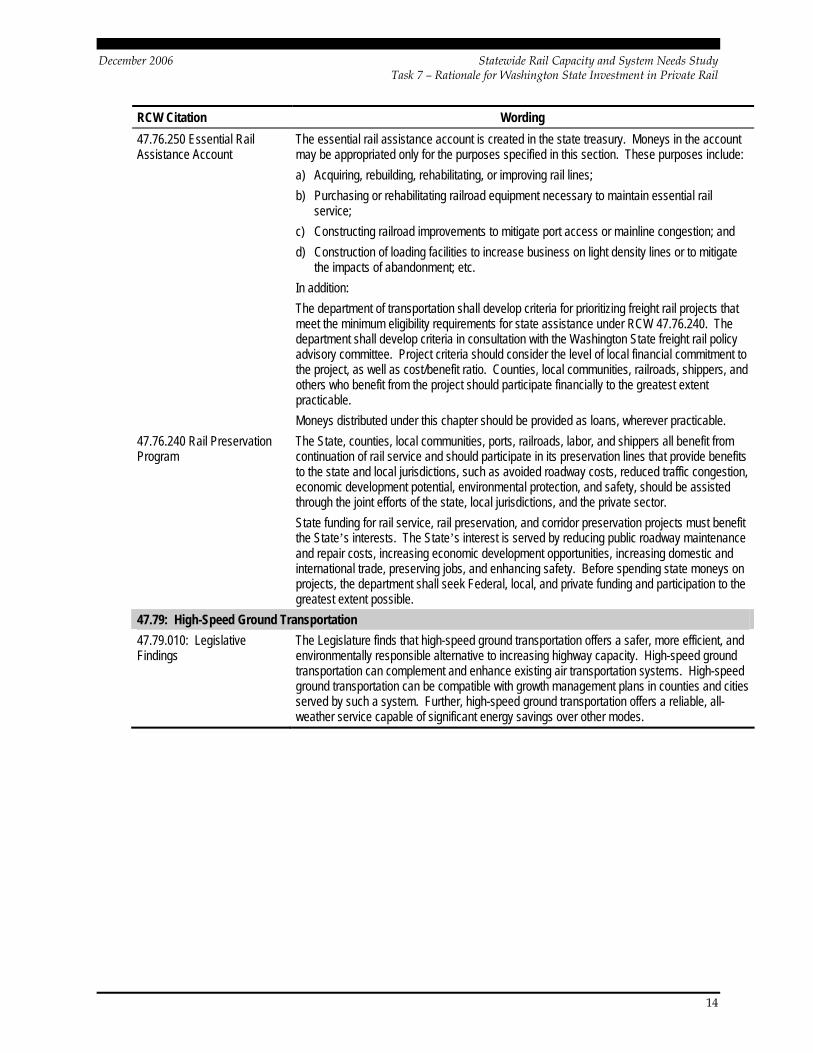
RCW Citation Wording 47.76.250 Essential Rail Assistance Account
The essential rail assistance account is created in the state treasury. Moneys in the account may be appropriated only for the purposes specified in this section. These purposes include: a) Acquiring, rebuilding, rehabilitating, or improving rail lines; b) Purchasing or rehabilitating railroad equipment necessary to maintain essential rail
service; c) Constructing railroad improvements to mitigate port access or mainline congestion; and d) Construction of loading facilities to increase business on light density lines or to mitigate
the impacts of abandonment; etc. In addition: The department of transportation shall develop criteria for prioritizing freight rail projects that meet the minimum eligibility requirements for state assistance under RCW 47.76.240. The department shall develop criteria in consultation with the Washington State freight rail policy advisory committee. Project criteria should consider the level of local financial commitment to the project, as well as cost/benefit ratio. Counties, local communities, railroads, shippers, and others who benefit from the project should participate financially to the greatest extent practicable. Moneys distributed under this chapter should be provided as loans, wherever practicable.
47.76.240 Rail Preservation Program
The State, counties, local communities, ports, railroads, labor, and shippers all benefit from continuation of rail service and should participate in its preservation lines that provide benefits to the state and local jurisdictions, such as avoided roadway costs, reduced traffic congestion, economic development potential, environmental protection, and safety, should be assisted through the joint efforts of the state, local jurisdictions, and the private sector. State funding for rail service, rail preservation, and corridor preservation projects must benefit the State’s interests. The State’s interest is served by reducing public roadway maintenance and repair costs, increasing economic development opportunities, increasing domestic and international trade, preserving jobs, and enhancing safety. Before spending state moneys on projects, the department shall seek Federal, local, and private funding and participation to the greatest extent possible.
47.79: High-Speed Ground Transportation 47.79.010: Legislative Findings
The Legislature finds that high-speed ground transportation offers a safer, more efficient, and environmentally responsible alternative to increasing highway capacity. High-speed ground transportation can complement and enhance existing air transportation systems. High-speed ground transportation can be compatible with growth management plans in counties and cities served by such a system. Further, high-speed ground transportation offers a reliable, all-weather service capable of significant energy savings over other modes.
December 2006 Statewide Rail Capacity and System Needs Study Task 7 – Rationale for Washington State Investment in Private Rail
15
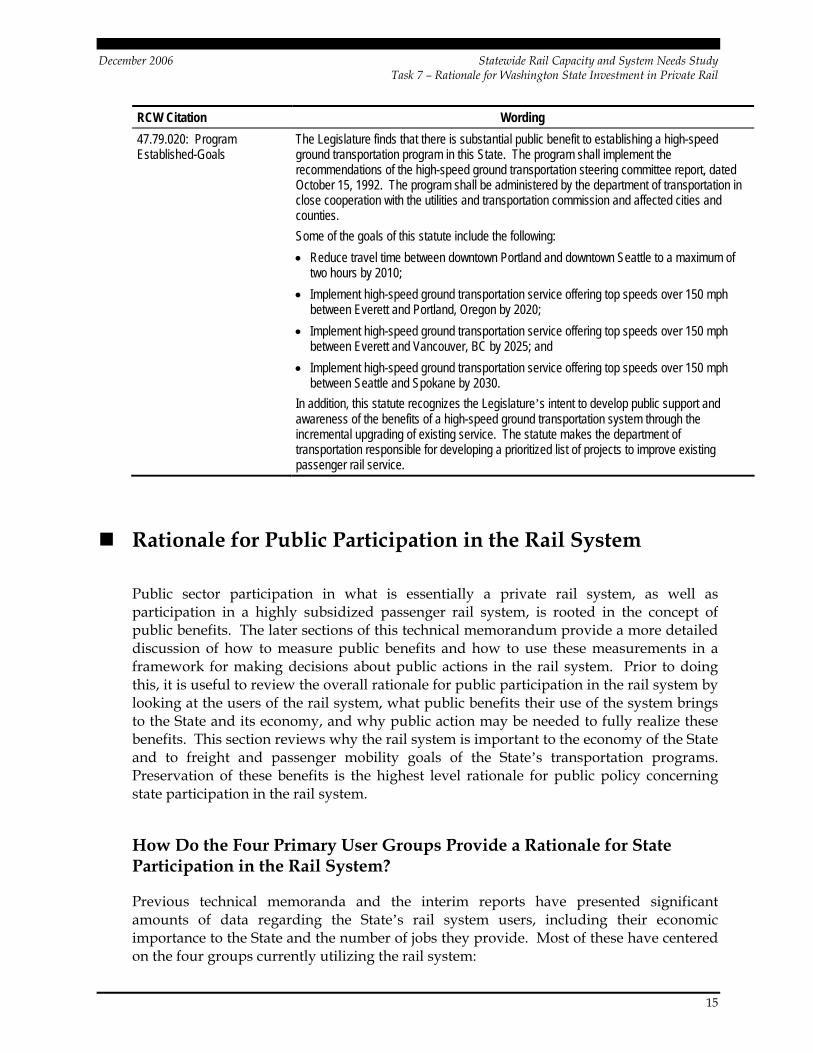
RCW Citation Wording 47.79.020: Program Established-Goals
The Legislature finds that there is substantial public benefit to establishing a high-speed ground transportation program in this State. The program shall implement the recommendations of the high-speed ground transportation steering committee report, dated October 15, 1992. The program shall be administered by the department of transportation in close cooperation with the utilities and transportation commission and affected cities and counties. Some of the goals of this statute include the following: • Reduce travel time between downtown Portland and downtown Seattle to a maximum of
two hours by 2010; • Implement high-speed ground transportation service offering top speeds over 150 mph
between Everett and Portland, Oregon by 2020; • Implement high-speed ground transportation service offering top speeds over 150 mph
between Everett and Vancouver, BC by 2025; and • Implement high-speed ground transportation service offering top speeds over 150 mph
between Seattle and Spokane by 2030. In addition, this statute recognizes the Legislature’s intent to develop public support and awareness of the benefits of a high-speed ground transportation system through the incremental upgrading of existing service. The statute makes the department of transportation responsible for developing a prioritized list of projects to improve existing passenger rail service.
Rationale for Public Participation in the Rail System
Public sector participation in what is essentially a private rail system, as well as participation in a highly subsidized passenger rail system, is rooted in the concept of public benefits. The later sections of this technical memorandum provide a more detailed discussion of how to measure public benefits and how to use these measurements in a framework for making decisions about public actions in the rail system. Prior to doing this, it is useful to review the overall rationale for public participation in the rail system by looking at the users of the rail system, what public benefits their use of the system brings to the State and its economy, and why public action may be needed to fully realize these benefits. This section reviews why the rail system is important to the economy of the State and to freight and passenger mobility goals of the State’s transportation programs. Preservation of these benefits is the highest level rationale for public policy concerning state participation in the rail system.
How Do the Four Primary User Groups Provide a Rationale for State Participation in the Rail System?
Previous technical memoranda and the interim reports have presented significant amounts of data regarding the State’s rail system users, including their economic importance to the State and the number of jobs they provide. Most of these have centered on the four groups currently utilizing the rail system:
December 2006 Statewide Rail Capacity and System Needs Study Task 7 – Rationale for Washington State Investment in Private Rail
16
1. Agriculture;
2. Manufacturers;
3. Ports and International Trade Businesses; and
4. Rail Passengers.
Establishing a clear link between these industries/user groups and public benefit to Washington State is an important step in justifying the State’s involvement in rail industry projects. It also helps to understand how these four user groups directly contribute to Washington State. Each of the four primary user groups is introduced below in their context of contributing the Washington State economy as a whole, and especially through the lens of the public benefit variables introduced later in this technical memorandum.
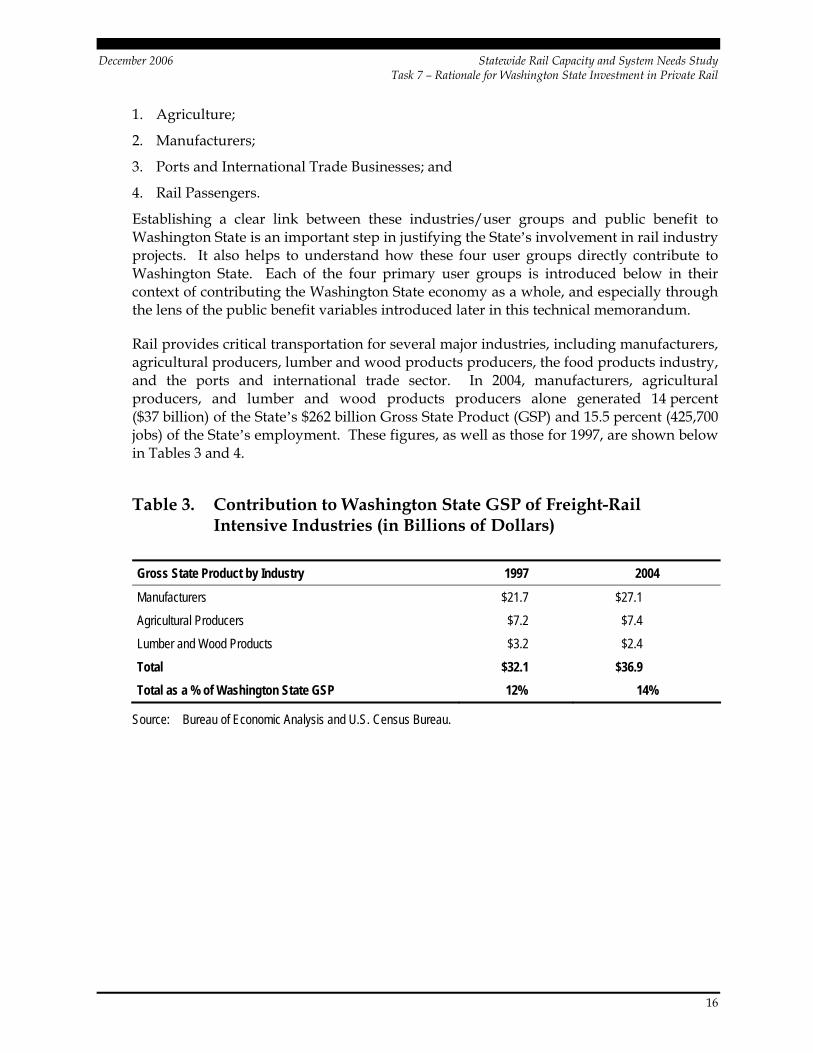
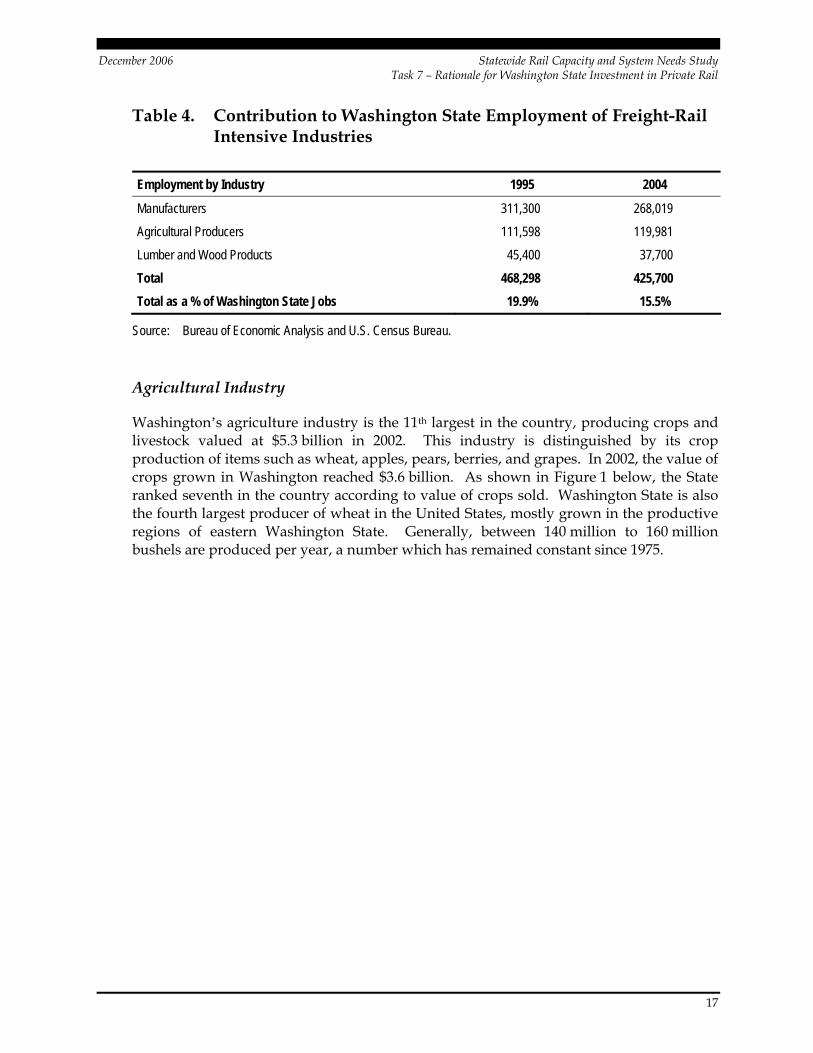
Rail provides critical transportation for several major industries, including manufacturers, agricultural producers, lumber and wood products producers, the food products industry, and the ports and international trade sector. In 2004, manufacturers, agricultural producers, and lumber and wood products producers alone generated 14 percent ($37 billion) of the State’s $262 billion Gross State Product (GSP) and 15.5 percent (425,700 jobs) of the State’s employment. These figures, as well as those for 1997, are shown below in Tables 3 and 4.
Table 3. Contribution to Washington State GSP of Freight-Rail Intensive Industries (in Billions of Dollars)
Gross State Product by Industry 1997 2004
Manufacturers $21.7 $27.1
Agricultural Producers $7.2 $7.4
Lumber and Wood Products $3.2 $2.4
Total $32.1 $36.9 Total as a % of Washington State GSP 12% 14%
Source: Bureau of Economic Analysis and U.S. Census Bureau.
December 2006 Statewide Rail Capacity and System Needs Study Task 7 – Rationale for Washington State Investment in Private Rail
17
Table 4. Contribution to Washington State Employment of Freight-Rail Intensive Industries
Employment by Industry 1995 2004
Manufacturers 311,300 268,019
Agricultural Producers 111,598 119,981
Lumber and Wood Products 45,400 37,700
Total 468,298 425,700 Total as a % of Washington State Jobs 19.9% 15.5%
Source: Bureau of Economic Analysis and U.S. Census Bureau.
Agricultural Industry
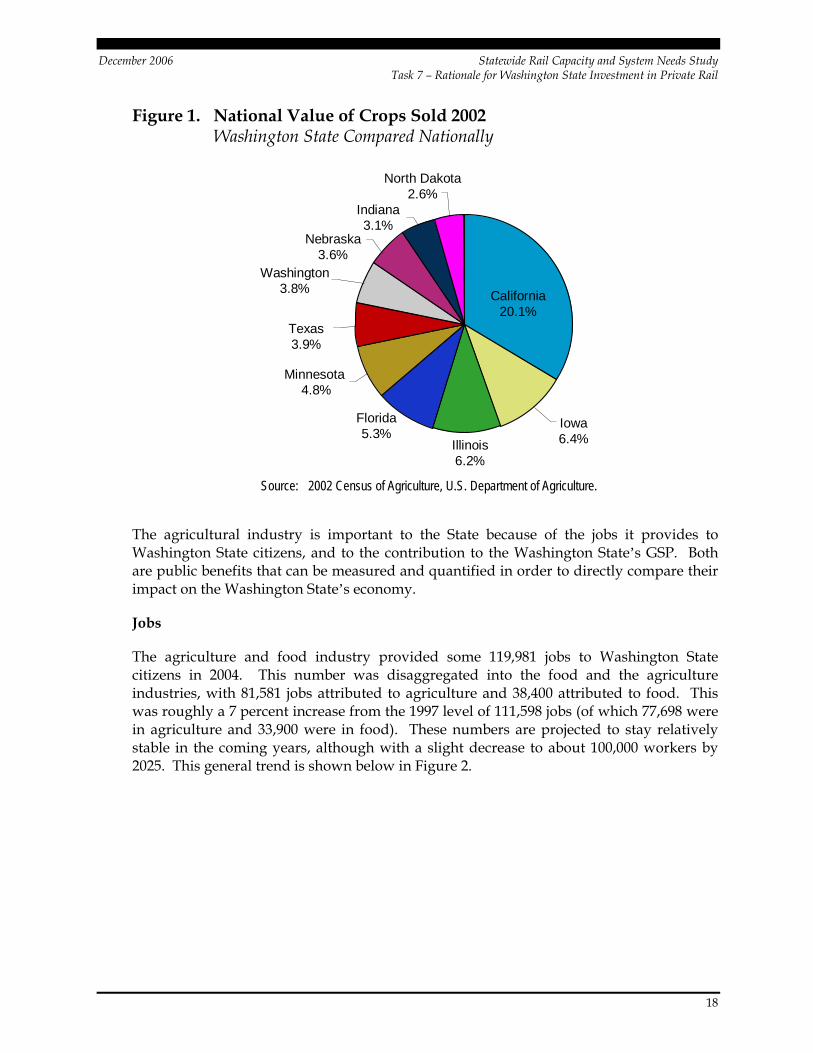
Washington’s agriculture industry is the 11th largest in the country, producing crops and livestock valued at $5.3 billion in 2002. This industry is distinguished by its crop production of items such as wheat, apples, pears, berries, and grapes. In 2002, the value of crops grown in Washington reached $3.6 billion. As shown in Figure 1 below, the State ranked seventh in the country according to value of crops sold. Washington State is also the fourth largest producer of wheat in the United States, mostly grown in the productive regions of eastern Washington State. Generally, between 140 million to 160 million bushels are produced per year, a number which has remained constant since 1975.
December 2006 Statewide Rail Capacity and System Needs Study Task 7 – Rationale for Washington State Investment in Private Rail
18
Figure 1. National Value of Crops Sold 2002 Washington State Compared Nationally
California20.1%
Illinois6.2%
Florida5.3%
Indiana3.1%
North Dakota2.6%
Nebraska3.6%
Minnesota4.8%
Texas3.9%
Washington3.8%
Iowa6.4%
Source: 2002 Census of Agriculture, U.S. Department of Agriculture.
The agricultural industry is important to the State because of the jobs it provides to Washington State citizens, and to the contribution to the Washington State’s GSP. Both are public benefits that can be measured and quantified in order to directly compare their impact on the Washington State’s economy.
Jobs
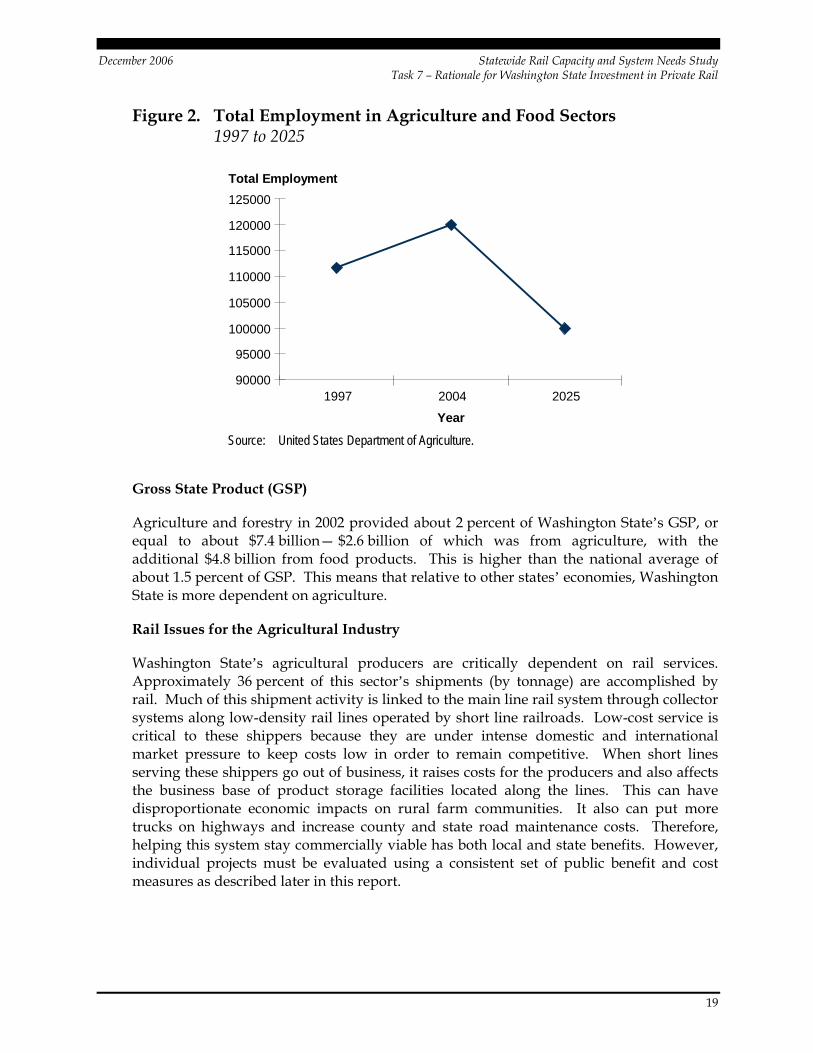
The agriculture and food industry provided some 119,981 jobs to Washington State citizens in 2004. This number was disaggregated into the food and the agriculture industries, with 81,581 jobs attributed to agriculture and 38,400 attributed to food. This was roughly a 7 percent increase from the 1997 level of 111,598 jobs (of which 77,698 were in agriculture and 33,900 were in food). These numbers are projected to stay relatively stable in the coming years, although with a slight decrease to about 100,000 workers by 2025. This general trend is shown below in Figure 2.
December 2006 Statewide Rail Capacity and System Needs Study Task 7 – Rationale for Washington State Investment in Private Rail
19
Figure 2. Total Employment in Agriculture and Food Sectors 1997 to 2025
90000
95000
100000
105000
110000
115000
120000
125000
1997 2004 2025
Year
Total Employment
Source: United States Department of Agriculture.
Gross State Product (GSP)
Agriculture and forestry in 2002 provided about 2 percent of Washington State’s GSP, or equal to about $7.4 billion— $2.6 billion of which was from agriculture, with the additional $4.8 billion from food products. This is higher than the national average of about 1.5 percent of GSP. This means that relative to other states’ economies, Washington State is more dependent on agriculture.
Rail Issues for the Agricultural Industry
Washington State’s agricultural producers are critically dependent on rail services. Approximately 36 percent of this sector’s shipments (by tonnage) are accomplished by rail. Much of this shipment activity is linked to the main line rail system through collector systems along low-density rail lines operated by short line railroads. Low-cost service is critical to these shippers because they are under intense domestic and international market pressure to keep costs low in order to remain competitive. When short lines serving these shippers go out of business, it raises costs for the producers and also affects the business base of product storage facilities located along the lines. This can have disproportionate economic impacts on rural farm communities. It also can put more trucks on highways and increase county and state road maintenance costs. Therefore, helping this system stay commercially viable has both local and state benefits. However, individual projects must be evaluated using a consistent set of public benefit and cost measures as described later in this report.
December 2006 Statewide Rail Capacity and System Needs Study Task 7 – Rationale for Washington State Investment in Private Rail
20
Ports and International Trade
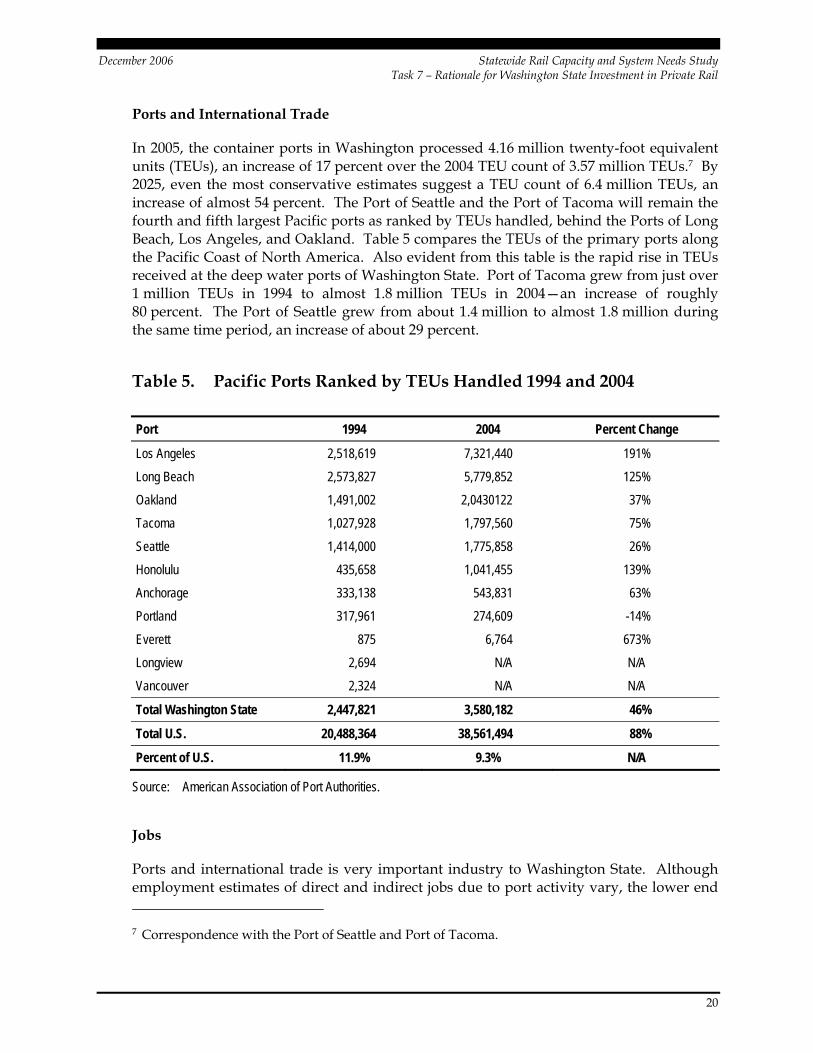
In 2005, the container ports in Washington processed 4.16 million twenty-foot equivalent units (TEUs), an increase of 17 percent over the 2004 TEU count of 3.57 million TEUs.7 By 2025, even the most conservative estimates suggest a TEU count of 6.4 million TEUs, an increase of almost 54 percent. The Port of Seattle and the Port of Tacoma will remain the fourth and fifth largest Pacific ports as ranked by TEUs handled, behind the Ports of Long Beach, Los Angeles, and Oakland. Table 5 compares the TEUs of the primary ports along the Pacific Coast of North America. Also evident from this table is the rapid rise in TEUs received at the deep water ports of Washington State. Port of Tacoma grew from just over 1 million TEUs in 1994 to almost 1.8 million TEUs in 2004—an increase of roughly 80 percent. The Port of Seattle grew from about 1.4 million to almost 1.8 million during the same time period, an increase of about 29 percent.
Table 5. Pacific Ports Ranked by TEUs Handled 1994 and 2004
Port 1994 2004 Percent Change
Los Angeles 2,518,619 7,321,440 191%
Long Beach 2,573,827 5,779,852 125%
Oakland 1,491,002 2,0430122 37%
Tacoma 1,027,928 1,797,560 75%
Seattle 1,414,000 1,775,858 26%
Honolulu 435,658 1,041,455 139%
Anchorage 333,138 543,831 63%
Portland 317,961 274,609 -14%
Everett 875 6,764 673%
Longview 2,694 N/A N/A
Vancouver 2,324 N/A N/A
Total Washington State 2,447,821 3,580,182 46%
Total U.S. 20,488,364 38,561,494 88%
Percent of U.S. 11.9% 9.3% N/A
Source: American Association of Port Authorities.
Jobs
Ports and international trade is very important industry to Washington State. Although employment estimates of direct and indirect jobs due to port activity vary, the lower end 7 Correspondence with the Port of Seattle and Port of Tacoma.
December 2006 Statewide Rail Capacity and System Needs Study Task 7 – Rationale for Washington State Investment in Private Rail
21
estimate is between 200,000 to 300,000 jobs. Individual estimates from the Ports of Seattle, Tacoma, and Vancouver show that they created 34,501 jobs (with $2.1 billion in wages and salaries); 113,000 jobs; and 5,500 jobs (with $242 million in wages and salary), respectively, in 2005.8 These individual counts differed in their definition of a “port-related job,” which explains some of their variability. Nevertheless, they are included here for illustrative purposes. A Washington Public Ports Association Study, completed in 2004, gave the estimate that one in three jobs in Washington State depended on trade.9 Regardless of which figure is used, it is evident that a large number of jobs are provided through the ports and international trade industry.
Gross State Product (GSP)
The Ports are beneficial to Washington State’s GSP because of the state and local taxes they pay as well as the GSP generated by total value of exports handled through the Ports. In 2004, the exports through Washington State ports contributed almost $26 billion (10 percent) to the State’s GSP. This is about twice the national average for percentage of GSP supplied through exports, meaning that the international trade sector is substantially more important for Washington State than most other states. Individual tax contributions from the ports are estimated at $211 million from the Port of Tacoma and $29 million from the Port of Vancouver. These contributions of the ports to the economy make them an important industry for the State’s economy.
Rail Issues for Ports and International Trade
The growth in international trade and intermodal usage has placed significant strains on the Washington State rail system. Capacity and locomotive availability issues have had the immediate effect of pushing more traffic into the north-south corridor between Seattle and Vancouver, creating conflicts and operational bottlenecks. Port-access issues and terminal capacity constraints are also an issue. In the longer term, the Washington State rail system does not have sufficient capacity in its east-west lines to meet projected demand. All of these issues could act as a constraint on international trade growth through the Washington State ports. These issues are also likely to spill over and affect all other traffic on the system as Class I railroads try to meet demand for their premium intermodal services. Class I railroads are likely to give lower priority to resolving these problems in the near to mid-term relative to issues elsewhere in the western railroad system, and this could reduce the benefits of international trade to the Washington State economy.
8 These job estimates are self reported by each Port, based on economic impact studies conducted
by Martin Associates in 2001 (Vancouver), 2004 (Seattle), and 2005 (Tacoma). The Port of Seattle explains that their estimates include direct, indirect, and induced jobs related to marine cargo activities, as well as jobs with associated regional manufacturing and distributions firms moving cargo through the Port.
9 2004 WPPA Marine Cargo Forecast, prepared by BST Associates, May 2004.
December 2006 Statewide Rail Capacity and System Needs Study Task 7 – Rationale for Washington State Investment in Private Rail
22
Manufacturers
Manufacturers using the rail system include industrial carload shippers such as electronic machinery, aerospace, and transportation equipment production. They also include other shippers such as lumber and wood products, both of which are historically very high-profile industries in Washington State.
Manufacturers are important to the State’s economy because of the jobs they provide to Washington State citizens, and their contributions to the State’s GSP. Both are public benefits that can be measured and quantified in order to directly compare their impact on the Washington State economy. As shown in Tables 3 and 4, the manufacturers contributed some $27 billion to the State’s GSP in 2004, as well as some 268,019 jobs.
Rail Issues for Manufacturer Shippers
As noted in Interim Report 1, manufacturer-shippers represent an economically healthy segment of the freight-rail user world and are likely to generate significant growth in carload shipments, provided the system can accommodate this growth. The characteristics of certain segments of the carload market have made it less desirable to the Class I railroads, and many industrial shippers in Washington State are seeing service declines and rate increases. There is a possibility that by making site improvements to reduce the need for mainline work events and by consolidating traffic, these shippers may be able to retain or even expand services. But this is likely to require up front capital that may be hard to come by. The impact to the State is likely to come in several ways —increased truck traffic in already congested areas as shippers shift to truck, loss of business as shippers look to places with better service options or proximity to their markets.
Passenger Users
The passenger rail sector includes both intercity rail and commuter rail. The commuter rail system that currently operates over the Class 1 system is the Sound Transit Sounder service. (The Sounder service is significant in State rail policy discussions only in so far as it shares track with the freight rail system and the Amtrak Cascades service, and solutions to problems faced by freight rail and the Amtrak Cascades are likely to involve Sound Transit.) The main focus of this discussion is the Amtrak Cascades intercity rail program because this is the largest state rail effort and it is the corridor with the highest near- and medium-term demand for service. This line is approximately 466 miles in length, running from Eugene, Oregon through to Vancouver, B.C. Currently, there are four daily trips between Seattle and Portland, one trip daily between Seattle and Bellingham, and one trip daily between Seattle and Vancouver, B.C.10 Ridership on the line reached 636,892 passengers in 2005, a 5.6-percent increase over 2004 ridership. Overall, the Amtrak service in Washington State carries the 9th highest ridership in the U.S. Figure 3 shows the
10 The fourth round trip began on July 1, 2006. Prior, there were only three round trips daily from
Seattle to Portland.
December 2006 Statewide Rail Capacity and System Needs Study Task 7 – Rationale for Washington State Investment in Private Rail
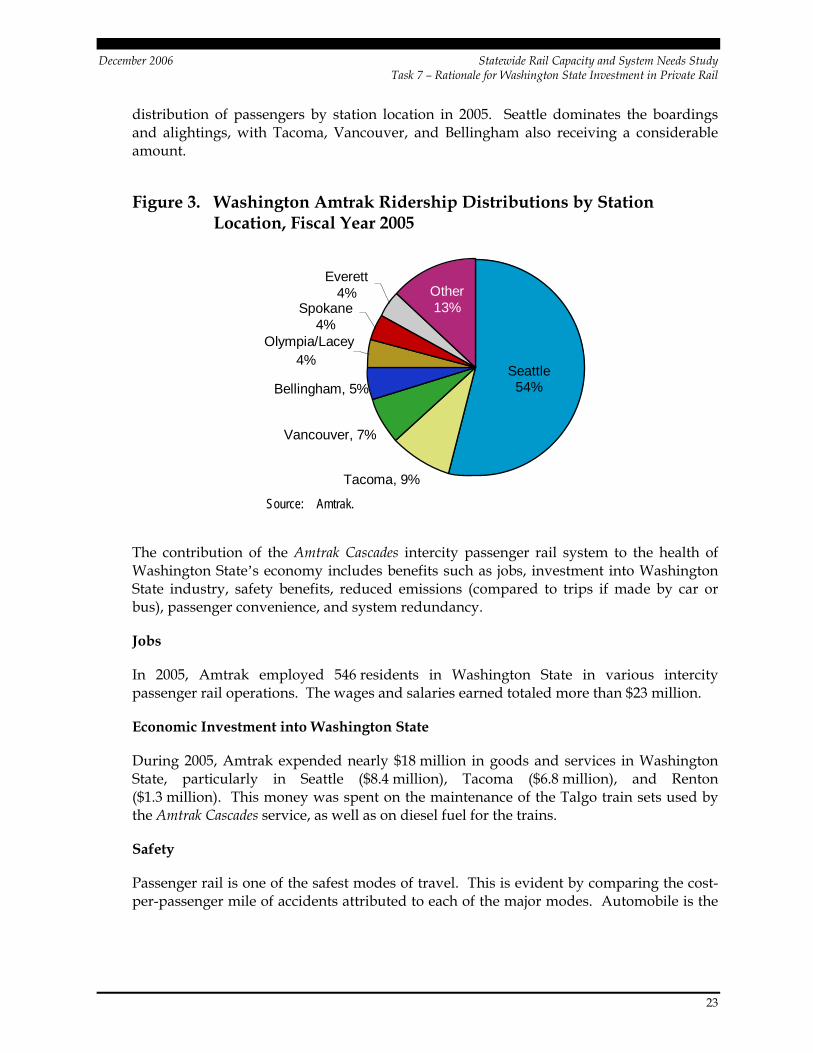
23
distribution of passengers by station location in 2005. Seattle dominates the boardings and alightings, with Tacoma, Vancouver, and Bellingham also receiving a considerable amount.
Figure 3. Washington Amtrak Ridership Distributions by Station Location, Fiscal Year 2005
Seattle54%
Tacoma, 9%
Vancouver, 7%
Bellingham, 5%
Olympia/Lacey4%
Spokane4%
Everett4% Other
13%
Source: Amtrak.
The contribution of the Amtrak Cascades intercity passenger rail system to the health of Washington State’s economy includes benefits such as jobs, investment into Washington State industry, safety benefits, reduced emissions (compared to trips if made by car or bus), passenger convenience, and system redundancy.
Jobs
In 2005, Amtrak employed 546 residents in Washington State in various intercity passenger rail operations. The wages and salaries earned totaled more than $23 million.
Economic Investment into Washington State
During 2005, Amtrak expended nearly $18 million in goods and services in Washington State, particularly in Seattle ($8.4 million), Tacoma ($6.8 million), and Renton ($1.3 million). This money was spent on the maintenance of the Talgo train sets used by the Amtrak Cascades service, as well as on diesel fuel for the trains.
Safety
Passenger rail is one of the safest modes of travel. This is evident by comparing the cost-per-passenger mile of accidents attributed to each of the major modes. Automobile is the
December 2006 Statewide Rail Capacity and System Needs Study Task 7 – Rationale for Washington State Investment in Private Rail
24
highest (at an average of $0.040 per passenger mile), airplanes are middle ($0.0035 per passenger mile), and passenger rail is the lowest (at $0.0007 per passenger mile)11. This suggests that there is a public benefit of safety savings whenever a passenger is diverted from airplane or automobile onto rail.
Environmental Externalities
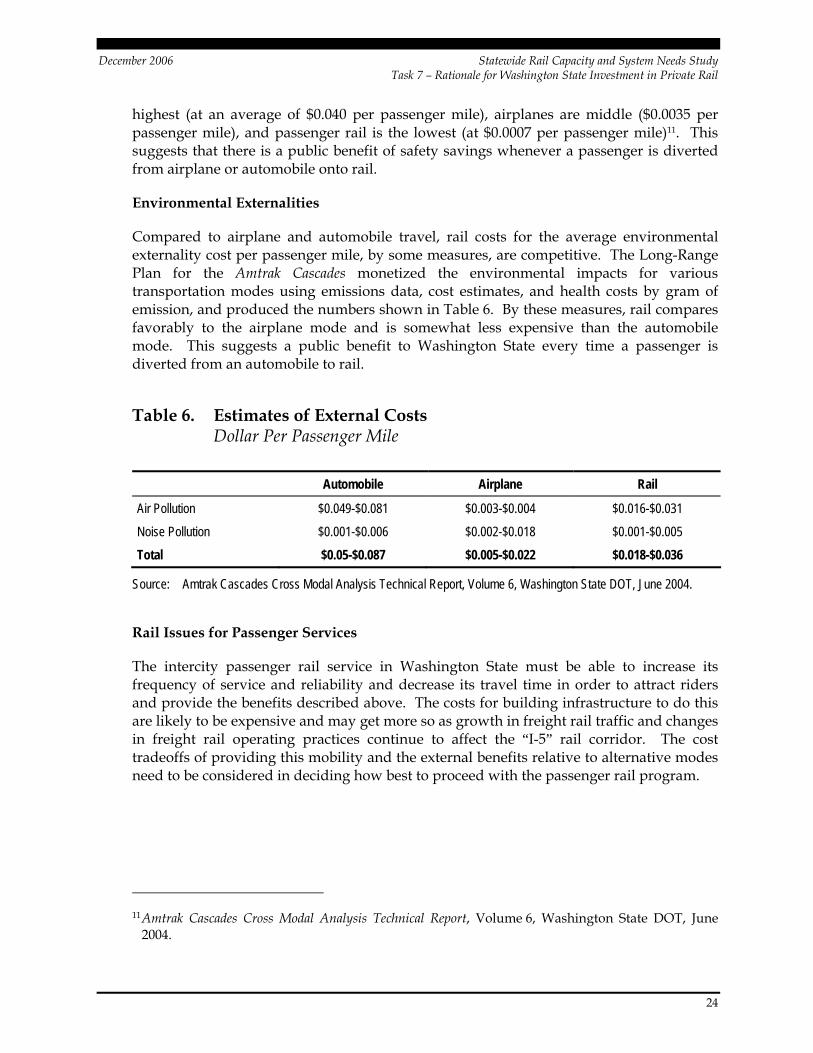
Compared to airplane and automobile travel, rail costs for the average environmental externality cost per passenger mile, by some measures, are competitive. The Long-Range Plan for the Amtrak Cascades monetized the environmental impacts for various transportation modes using emissions data, cost estimates, and health costs by gram of emission, and produced the numbers shown in Table 6. By these measures, rail compares favorably to the airplane mode and is somewhat less expensive than the automobile mode. This suggests a public benefit to Washington State every time a passenger is diverted from an automobile to rail.
Table 6. Estimates of External Costs Dollar Per Passenger Mile
Automobile Airplane Rail
Air Pollution $0.049-$0.081 $0.003-$0.004 $0.016-$0.031
Noise Pollution $0.001-$0.006 $0.002-$0.018 $0.001-$0.005
Total $0.05-$0.087 $0.005-$0.022 $0.018-$0.036
Source: Amtrak Cascades Cross Modal Analysis Technical Report, Volume 6, Washington State DOT, June 2004.
Rail Issues for Passenger Services
The intercity passenger rail service in Washington State must be able to increase its frequency of service and reliability and decrease its travel time in order to attract riders and provide the benefits described above. The costs for building infrastructure to do this are likely to be expensive and may get more so as growth in freight rail traffic and changes in freight rail operating practices continue to affect the “I-5” rail corridor. The cost tradeoffs of providing this mobility and the external benefits relative to alternative modes need to be considered in deciding how best to proceed with the passenger rail program.
11 Amtrak Cascades Cross Modal Analysis Technical Report, Volume 6, Washington State DOT, June
2004.
December 2006 Statewide Rail Capacity and System Needs Study Task 7 – Rationale for Washington State Investment in Private Rail
25
Measurement of Public Benefit: Precedent from Other Organizations and States
Metrics and Evaluation Processes Used by Other States and Organizations
Several other states and organizations have made the decision to participate in the rail sector if public benefits exceed public costs. To do this, they have first determined what constitutes “public benefit,” and then developed methods by which to measure the public benefit of rail improvement actions. This section reviews the variables chosen to represent public benefit by other states and organizations. This will help in the selection of variables by which to represent, measure, and quantify public benefits for Washington State. Many of the variables have been adapted from the FRA methodology developed in the early 1990s for the Local Rail Freight Assistance Program, and directed primarily at job retention on short line railroads formed from Class I spinoffs. The variables by which the FRA measures public benefit are summarized below, as well as those from the following states and organizations:
• Florida DOT, Florida Freight Rail Benefit/Cost Methodology, 2005;
• Tennessee DOT, Strategic Project Evaluation Protocols, and Procedures, Tennessee Rail System Plan, 2001;
• FMSIB, Freight Mobility Strategic Investment Program Criteria, 2006; and
• Washington State DOT Freight Rail Assistance Application Packet Criteria, 2006.
The variables chosen to represent public benefits for the FRA, Florida, Tennessee, FMSIB, and Washington State DOT all influenced the selection of variables by which to estimate the public benefit in Washington State. Those variables are described later in the technical memorandum.
Federal Railroad Administration (FRA) Benefits Methodology
The FRA method was developed to calculate the benefit-cost (B/C) ratios for projects where assistance is requested to acquire, rehabilitate, or construct rail facilities. It is based on seven metrics that represent the benefits to the public of a particular action.
The FRA methodology differentiates between two major types of benefits: 1) efficiency benefits and 2) secondary benefits. Efficiency benefits result from the impact that the project has on the reduction of transportation costs to the shipper and the increase in profits derived from the incremental traffic, which is the additional traffic that occurs due to service improvement. Secondary benefits are an indirect consequence of the project, such as the avoidance of relocation costs of shippers or other businesses, creation of new jobs or retention of current jobs, and reduction of both highway maintenance costs and
December 2006 Statewide Rail Capacity and System Needs Study Task 7 – Rationale for Washington State Investment in Private Rail
26
pollution emissions due to traffic diverted from trucks to rail. The salvage value of the facilities is also included.
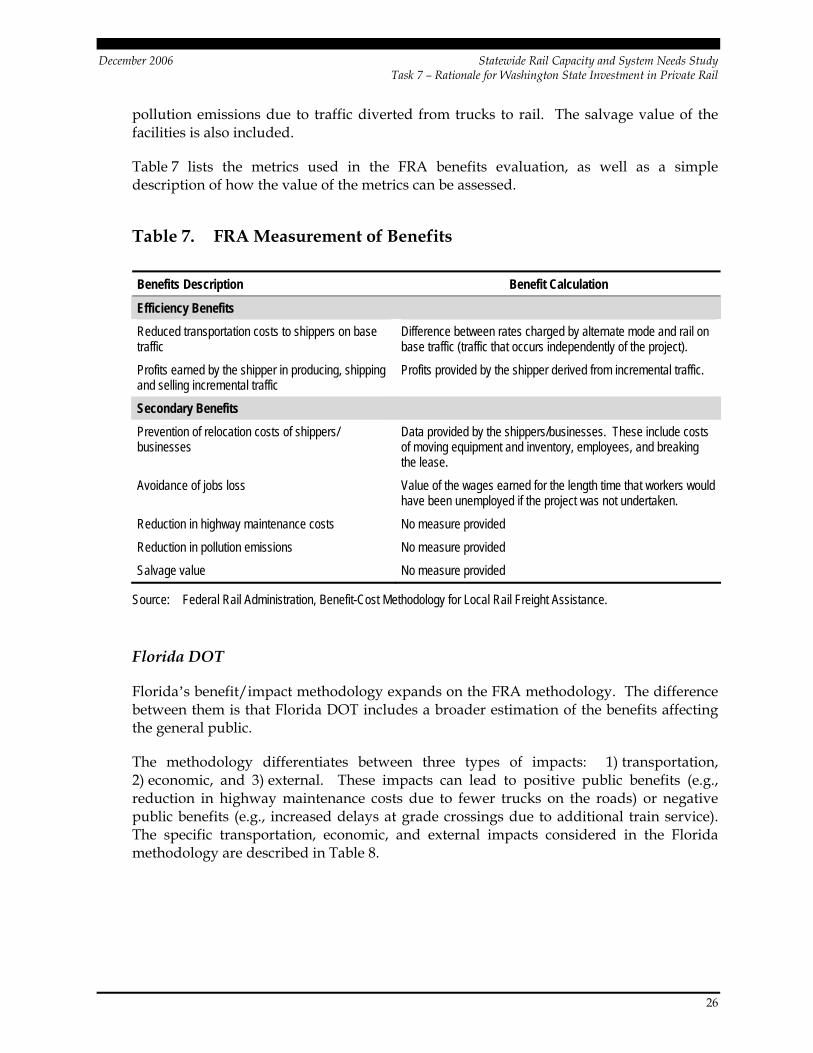
Table 7 lists the metrics used in the FRA benefits evaluation, as well as a simple description of how the value of the metrics can be assessed.
Table 7. FRA Measurement of Benefits
Benefits Description Benefit Calculation
Efficiency Benefits
Reduced transportation costs to shippers on base traffic
Difference between rates charged by alternate mode and rail on base traffic (traffic that occurs independently of the project).
Profits earned by the shipper in producing, shipping and selling incremental traffic
Profits provided by the shipper derived from incremental traffic.
Secondary Benefits
Prevention of relocation costs of shippers/ businesses
Data provided by the shippers/businesses. These include costs of moving equipment and inventory, employees, and breaking the lease.
Avoidance of jobs loss Value of the wages earned for the length time that workers would have been unemployed if the project was not undertaken.
Reduction in highway maintenance costs No measure provided
Reduction in pollution emissions No measure provided
Salvage value No measure provided
Source: Federal Rail Administration, Benefit-Cost Methodology for Local Rail Freight Assistance.
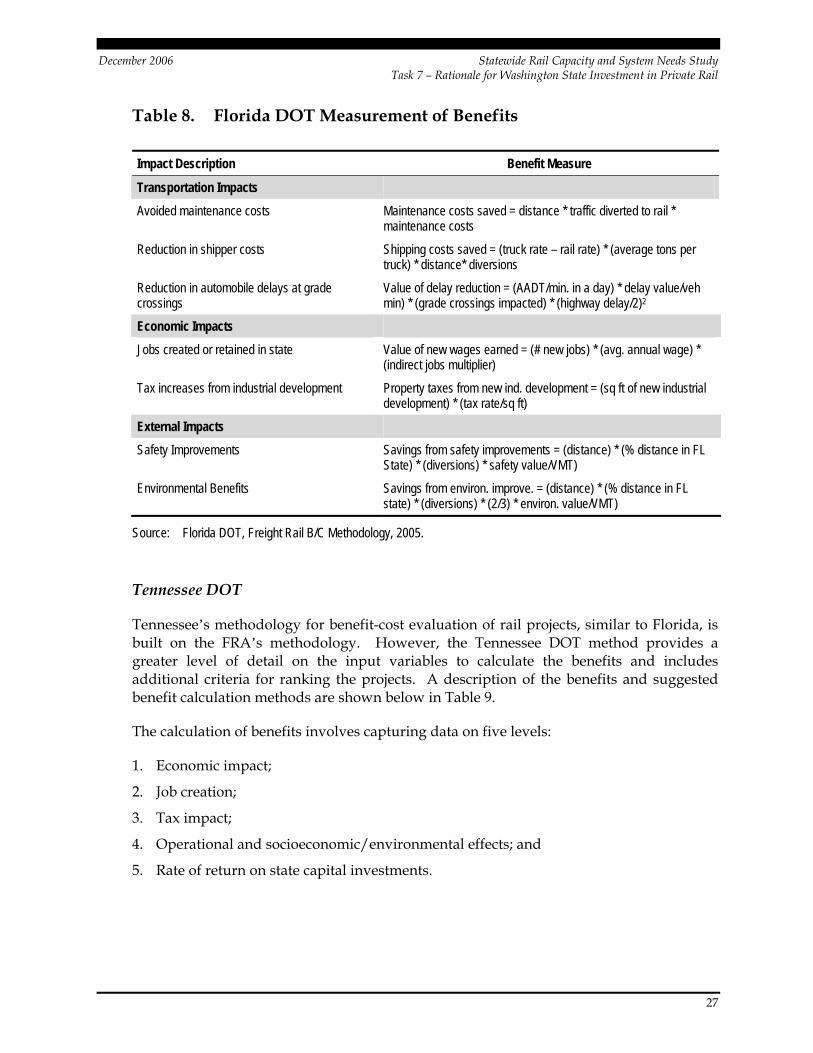
Florida DOT
Florida’s benefit/impact methodology expands on the FRA methodology. The difference between them is that Florida DOT includes a broader estimation of the benefits affecting the general public.
The methodology differentiates between three types of impacts: 1) transportation, 2) economic, and 3) external. These impacts can lead to positive public benefits (e.g., reduction in highway maintenance costs due to fewer trucks on the roads) or negative public benefits (e.g., increased delays at grade crossings due to additional train service). The specific transportation, economic, and external impacts considered in the Florida methodology are described in Table 8.
December 2006 Statewide Rail Capacity and System Needs Study Task 7 – Rationale for Washington State Investment in Private Rail
27
Table 8. Florida DOT Measurement of Benefits
Impact Description Benefit Measure
Transportation Impacts
Avoided maintenance costs Maintenance costs saved = distance * traffic diverted to rail * maintenance costs
Reduction in shipper costs Shipping costs saved = (truck rate – rail rate) * (average tons per truck) * distance* diversions
Reduction in automobile delays at grade crossings
Value of delay reduction = (AADT/min. in a day) * delay value/veh min) * (grade crossings impacted) * (highway delay/2)2
Economic Impacts
Jobs created or retained in state Value of new wages earned = (# new jobs) * (avg. annual wage) * (indirect jobs multiplier)
Tax increases from industrial development Property taxes from new ind. development = (sq ft of new industrial development) * (tax rate/sq ft)
External Impacts
Safety Improvements Savings from safety improvements = (distance) * (% distance in FL State) * (diversions) * safety value/VMT)
Environmental Benefits Savings from environ. improve. = (distance) * (% distance in FL state) * (diversions) * (2/3) * environ. value/VMT)
Source: Florida DOT, Freight Rail B/C Methodology, 2005.
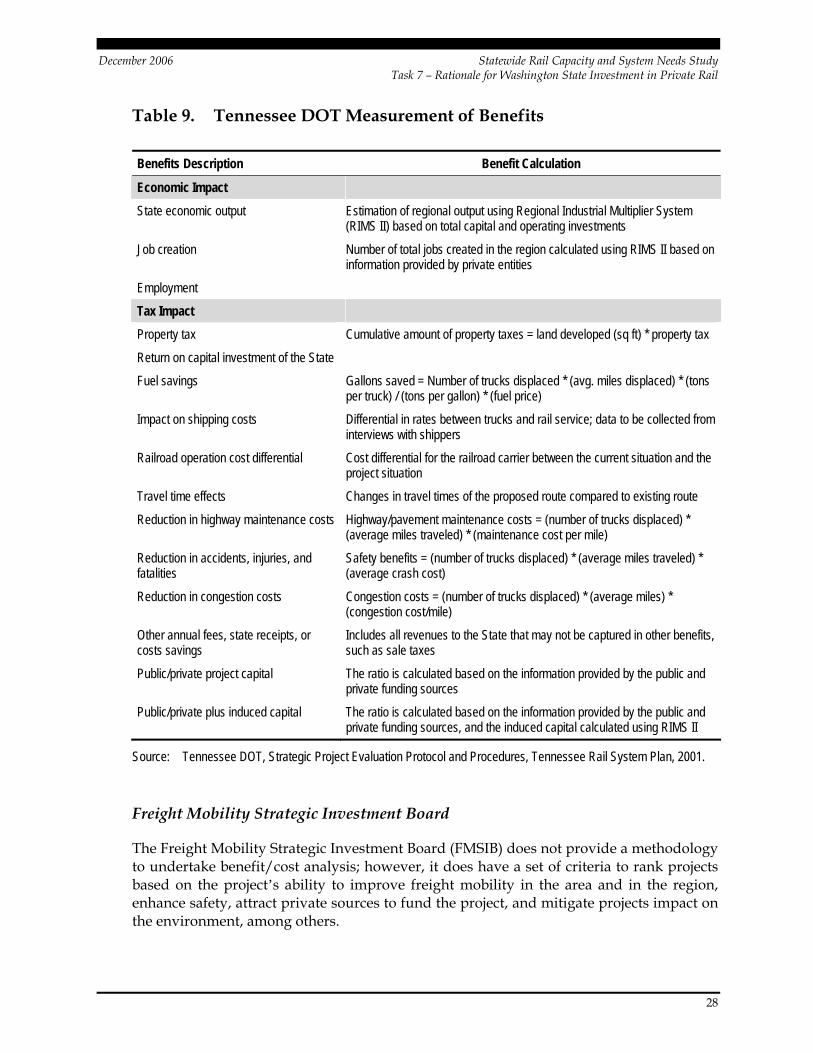
Tennessee DOT
Tennessee’s methodology for benefit-cost evaluation of rail projects, similar to Florida, is built on the FRA’s methodology. However, the Tennessee DOT method provides a greater level of detail on the input variables to calculate the benefits and includes additional criteria for ranking the projects. A description of the benefits and suggested benefit calculation methods are shown below in Table 9.
The calculation of benefits involves capturing data on five levels:
1. Economic impact;
2. Job creation;
3. Tax impact;
4. Operational and socioeconomic/environmental effects; and
5. Rate of return on state capital investments.
December 2006 Statewide Rail Capacity and System Needs Study Task 7 – Rationale for Washington State Investment in Private Rail
28
Table 9. Tennessee DOT Measurement of Benefits
Benefits Description Benefit Calculation
Economic Impact
State economic output Estimation of regional output using Regional Industrial Multiplier System (RIMS II) based on total capital and operating investments
Job creation Number of total jobs created in the region calculated using RIMS II based on information provided by private entities
Employment
Tax Impact Property tax Cumulative amount of property taxes = land developed (sq ft) * property tax
Return on capital investment of the State
Fuel savings Gallons saved = Number of trucks displaced * (avg. miles displaced) * (tons per truck) / (tons per gallon) * (fuel price)
Impact on shipping costs Differential in rates between trucks and rail service; data to be collected from interviews with shippers
Railroad operation cost differential Cost differential for the railroad carrier between the current situation and the project situation
Travel time effects Changes in travel times of the proposed route compared to existing route
Reduction in highway maintenance costs Highway/pavement maintenance costs = (number of trucks displaced) * (average miles traveled) * (maintenance cost per mile)
Reduction in accidents, injuries, and fatalities
Safety benefits = (number of trucks displaced) * (average miles traveled) * (average crash cost)
Reduction in congestion costs Congestion costs = (number of trucks displaced) * (average miles) * (congestion cost/mile)
Other annual fees, state receipts, or costs savings
Includes all revenues to the State that may not be captured in other benefits, such as sale taxes
Public/private project capital The ratio is calculated based on the information provided by the public and private funding sources
Public/private plus induced capital The ratio is calculated based on the information provided by the public and private funding sources, and the induced capital calculated using RIMS II
Source: Tennessee DOT, Strategic Project Evaluation Protocol and Procedures, Tennessee Rail System Plan, 2001.
Freight Mobility Strategic Investment Board
The Freight Mobility Strategic Investment Board (FMSIB) does not provide a methodology to undertake benefit/cost analysis; however, it does have a set of criteria to rank projects based on the project’s ability to improve freight mobility in the area and in the region, enhance safety, attract private sources to fund the project, and mitigate projects impact on the environment, among others.
December 2006 Statewide Rail Capacity and System Needs Study Task 7 – Rationale for Washington State Investment in Private Rail
29
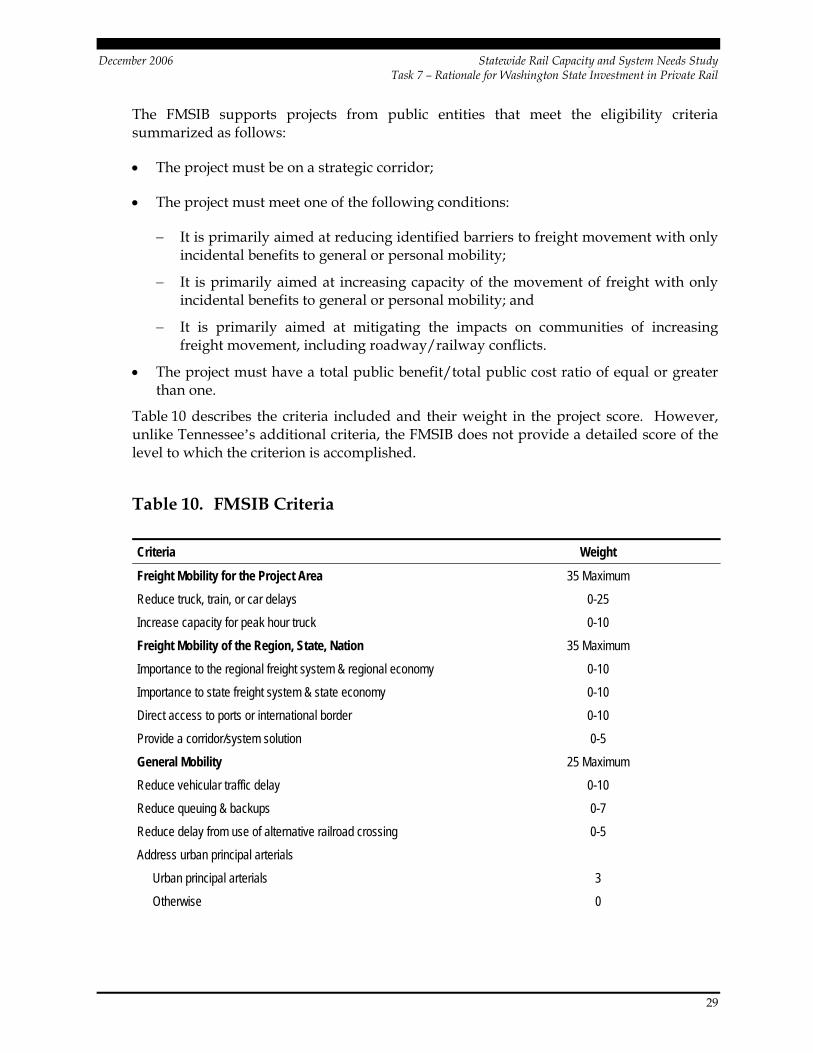
The FMSIB supports projects from public entities that meet the eligibility criteria summarized as follows:
• The project must be on a strategic corridor;
• The project must meet one of the following conditions:
− It is primarily aimed at reducing identified barriers to freight movement with only incidental benefits to general or personal mobility;
− It is primarily aimed at increasing capacity of the movement of freight with only incidental benefits to general or personal mobility; and
− It is primarily aimed at mitigating the impacts on communities of increasing freight movement, including roadway/railway conflicts.
• The project must have a total public benefit/total public cost ratio of equal or greater than one.
Table 10 describes the criteria included and their weight in the project score. However, unlike Tennessee’s additional criteria, the FMSIB does not provide a detailed score of the level to which the criterion is accomplished.
Table 10. FMSIB Criteria
Criteria Weight
Freight Mobility for the Project Area 35 Maximum
Reduce truck, train, or car delays 0-25
Increase capacity for peak hour truck 0-10
Freight Mobility of the Region, State, Nation 35 Maximum
Importance to the regional freight system & regional economy 0-10
Importance to state freight system & state economy 0-10
Direct access to ports or international border 0-10
Provide a corridor/system solution 0-5
General Mobility 25 Maximum
Reduce vehicular traffic delay 0-10
Reduce queuing & backups 0-7
Reduce delay from use of alternative railroad crossing 0-5
Address urban principal arterials
Urban principal arterials 3
Otherwise 0
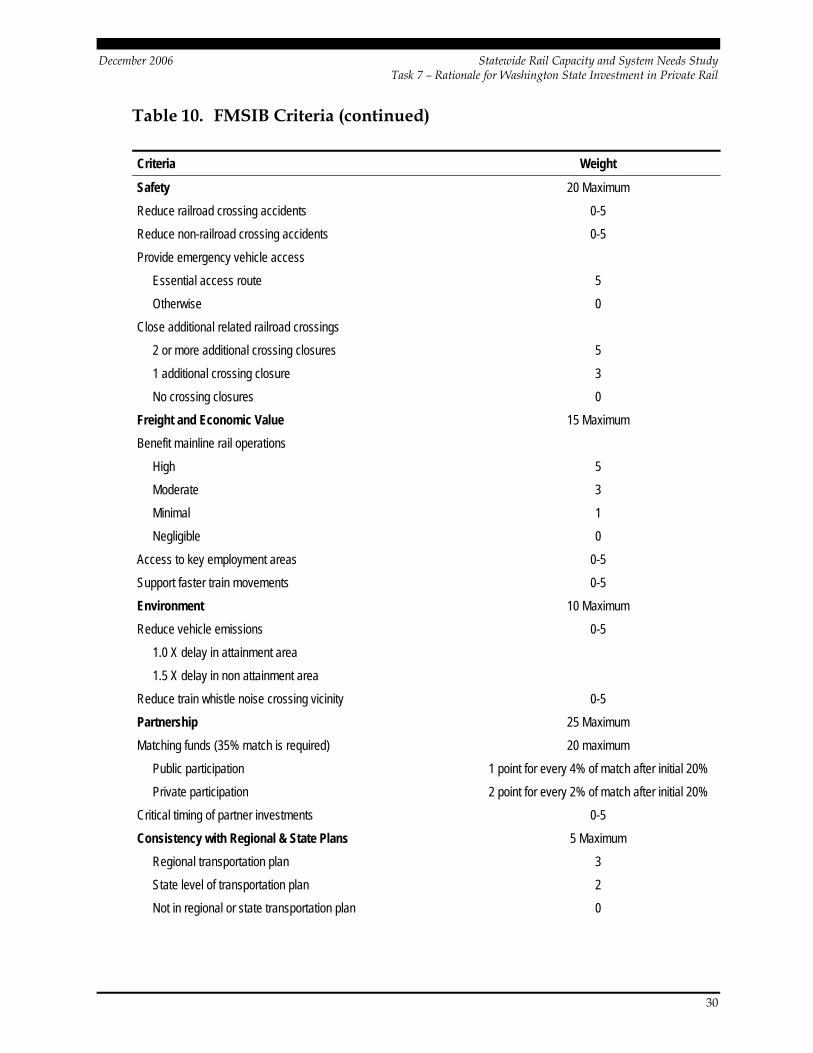
December 2006 Statewide Rail Capacity and System Needs Study Task 7 – Rationale for Washington State Investment in Private Rail
30
Table 10. FMSIB Criteria (continued)
Criteria Weight
Safety 20 Maximum
Reduce railroad crossing accidents 0-5
Reduce non-railroad crossing accidents 0-5
Provide emergency vehicle access
Essential access route 5
Otherwise 0
Close additional related railroad crossings
2 or more additional crossing closures 5
1 additional crossing closure 3
No crossing closures 0
Freight and Economic Value 15 Maximum
Benefit mainline rail operations
High 5
Moderate 3
Minimal 1
Negligible 0
Access to key employment areas 0-5
Support faster train movements 0-5
Environment 10 Maximum
Reduce vehicle emissions 0-5
1.0 X delay in attainment area
1.5 X delay in non attainment area
Reduce train whistle noise crossing vicinity 0-5
Partnership 25 Maximum
Matching funds (35% match is required) 20 maximum
Public participation 1 point for every 4% of match after initial 20%
Private participation 2 point for every 2% of match after initial 20%
Critical timing of partner investments 0-5
Consistency with Regional & State Plans 5 Maximum
Regional transportation plan 3
State level of transportation plan 2
Not in regional or state transportation plan 0
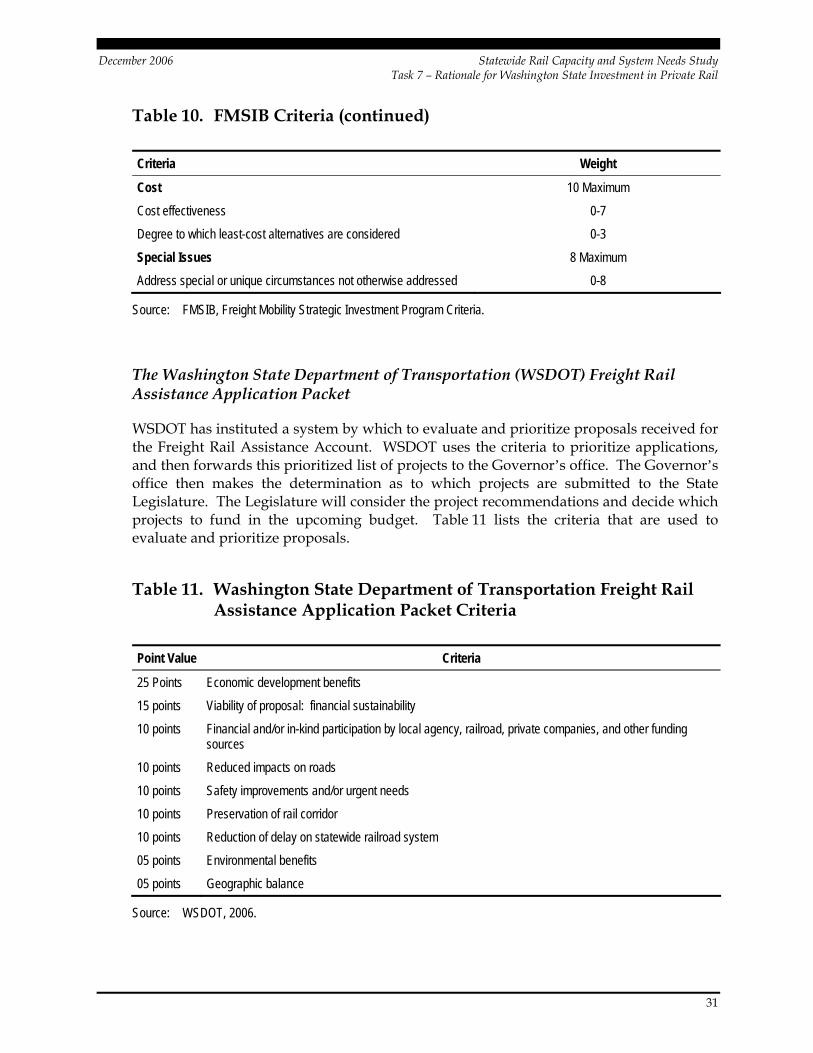
December 2006 Statewide Rail Capacity and System Needs Study Task 7 – Rationale for Washington State Investment in Private Rail
31
Table 10. FMSIB Criteria (continued)
Criteria Weight
Cost 10 Maximum
Cost effectiveness 0-7
Degree to which least-cost alternatives are considered 0-3
Special Issues 8 Maximum
Address special or unique circumstances not otherwise addressed 0-8
Source: FMSIB, Freight Mobility Strategic Investment Program Criteria.
The Washington State Department of Transportation (WSDOT) Freight Rail Assistance Application Packet
WSDOT has instituted a system by which to evaluate and prioritize proposals received for the Freight Rail Assistance Account. WSDOT uses the criteria to prioritize applications, and then forwards this prioritized list of projects to the Governor’s office. The Governor’s office then makes the determination as to which projects are submitted to the State Legislature. The Legislature will consider the project recommendations and decide which projects to fund in the upcoming budget. Table 11 lists the criteria that are used to evaluate and prioritize proposals.
Table 11. Washington State Department of Transportation Freight Rail Assistance Application Packet Criteria
Point Value Criteria
25 Points Economic development benefits
15 points Viability of proposal: financial sustainability
10 points Financial and/or in-kind participation by local agency, railroad, private companies, and other funding sources
10 points Reduced impacts on roads
10 points Safety improvements and/or urgent needs
10 points Preservation of rail corridor
10 points Reduction of delay on statewide railroad system
05 points Environmental benefits
05 points Geographic balance
Source: WSDOT, 2006.
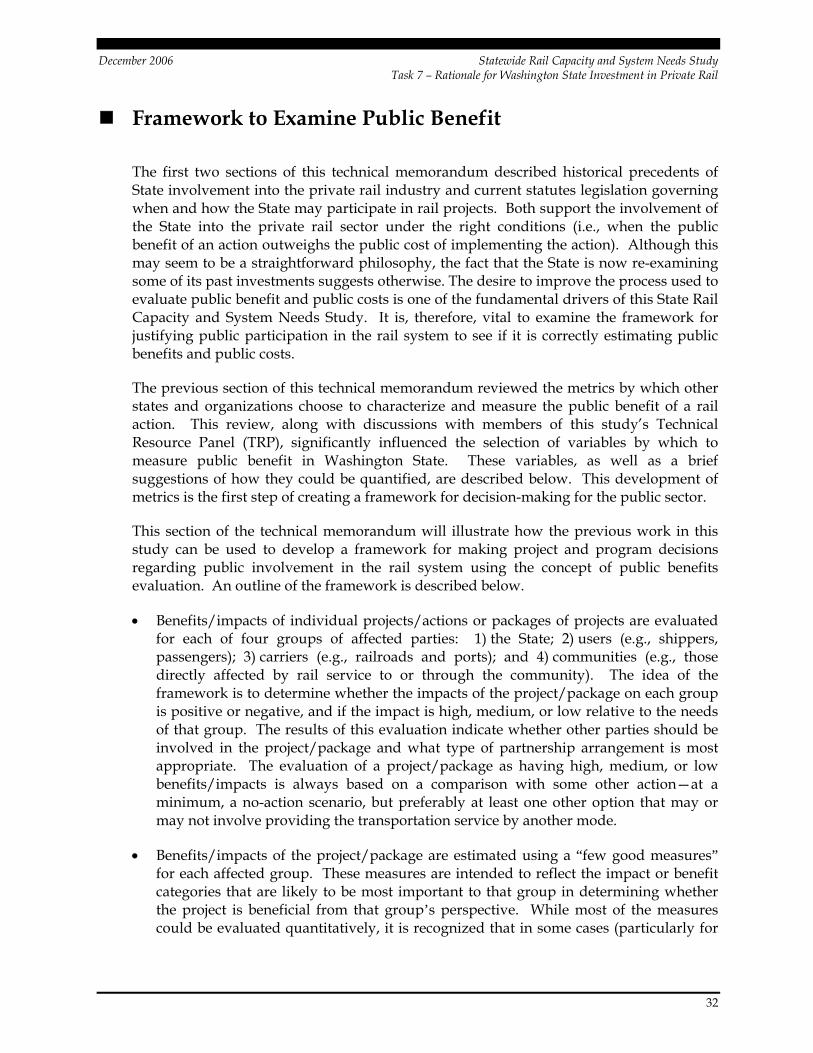
December 2006 Statewide Rail Capacity and System Needs Study Task 7 – Rationale for Washington State Investment in Private Rail
32
Framework to Examine Public Benefit
The first two sections of this technical memorandum described historical precedents of State involvement into the private rail industry and current statutes legislation governing when and how the State may participate in rail projects. Both support the involvement of the State into the private rail sector under the right conditions (i.e., when the public benefit of an action outweighs the public cost of implementing the action). Although this may seem to be a straightforward philosophy, the fact that the State is now re-examining some of its past investments suggests otherwise. The desire to improve the process used to evaluate public benefit and public costs is one of the fundamental drivers of this State Rail Capacity and System Needs Study. It is, therefore, vital to examine the framework for justifying public participation in the rail system to see if it is correctly estimating public benefits and public costs.
The previous section of this technical memorandum reviewed the metrics by which other states and organizations choose to characterize and measure the public benefit of a rail action. This review, along with discussions with members of this study’s Technical Resource Panel (TRP), significantly influenced the selection of variables by which to measure public benefit in Washington State. These variables, as well as a brief suggestions of how they could be quantified, are described below. This development of metrics is the first step of creating a framework for decision-making for the public sector.
This section of the technical memorandum will illustrate how the previous work in this study can be used to develop a framework for making project and program decisions regarding public involvement in the rail system using the concept of public benefits evaluation. An outline of the framework is described below.
• Benefits/impacts of individual projects/actions or packages of projects are evaluated for each of four groups of affected parties: 1) the State; 2) users (e.g., shippers, passengers); 3) carriers (e.g., railroads and ports); and 4) communities (e.g., those directly affected by rail service to or through the community). The idea of the framework is to determine whether the impacts of the project/package on each group is positive or negative, and if the impact is high, medium, or low relative to the needs of that group. The results of this evaluation indicate whether other parties should be involved in the project/package and what type of partnership arrangement is most appropriate. The evaluation of a project/package as having high, medium, or low benefits/impacts is always based on a comparison with some other action—at a minimum, a no-action scenario, but preferably at least one other option that may or may not involve providing the transportation service by another mode.
• Benefits/impacts of the project/package are estimated using a “few good measures” for each affected group. These measures are intended to reflect the impact or benefit categories that are likely to be most important to that group in determining whether the project is beneficial from that group’s perspective. While most of the measures could be evaluated quantitatively, it is recognized that in some cases (particularly for
December 2006 Statewide Rail Capacity and System Needs Study Task 7 – Rationale for Washington State Investment in Private Rail
33
private parties), these evaluations must be qualitative. In the case of the State, all of the benefit measures can be evaluated quantitatively.
• One of the benefit measures for the State is the B/C ratio. This is intended to be applied to all projects, both passenger and freight. The B/C ratio is introduced to enable state decision-makers to evaluate benefit-cost tradeoffs and not focus solely on benefits. The precise calculation methodology for the B/C ratio is left to the state DOT to finalize and may vary depending on the project type and the level of investment. However, the framework provides recommended benefit variables and general calculation approaches as a starting point.
• The B/C ratio is only one of the measures used to evaluate benefits/impacts to the State. Some of the other measures are also included within the benefit-cost calculation, but they are broken out separately so that decision-makers can weight these measures more heavily when making decisions than they would be weighted in a true B/C ratio. The framework does not recommend a specific weighting procedure, leaving this decision to the Legislature or the Commission after the State and the Washington State DOT have experience in quantifying and using the measures across a range of projects.
What Metrics Should Be Used to Measure Public Benefit in Washington State?
The purpose of a State Rail Policy is to guide the State to make decisions that create or protect public benefit. Two steps must be completed prior to making this determination: 1) the variables that best represent public benefit must be determined, and 2) methods by which to measure or compare the changes in these variables must be established.
Selecting the appropriate metrics by which to measure public benefit for Washington State rail user groups was a fairly extensive process. It used several sources of information to determine the variables by which to measure public benefit, including the following:
• Best practices review of rail benefit/cost methodologies used by other states and organizations (summarized above);
• Consultation with area experts, including shippers, community association representatives, ports, railroads, and others who are members of the Washington State Rail Study Technical Resource Panel; and
• Metrics derived from established state policy as captured in the RCW and in previous case studies of state participation in the rail system.
The selected metrics are meant to reflect those aspects of system performance that are most critical to each rail user group. The benefits to each user group were represented with quantitative measures as well as with a set of accompanying qualitative questions. The quantitative variables are provided so that public benefit can be evaluated in a simple manner. The qualitative questions are meant to help with a “fatal flaw” analysis —a review to ensure that the proposed project is practical and fits within the goals of the State.
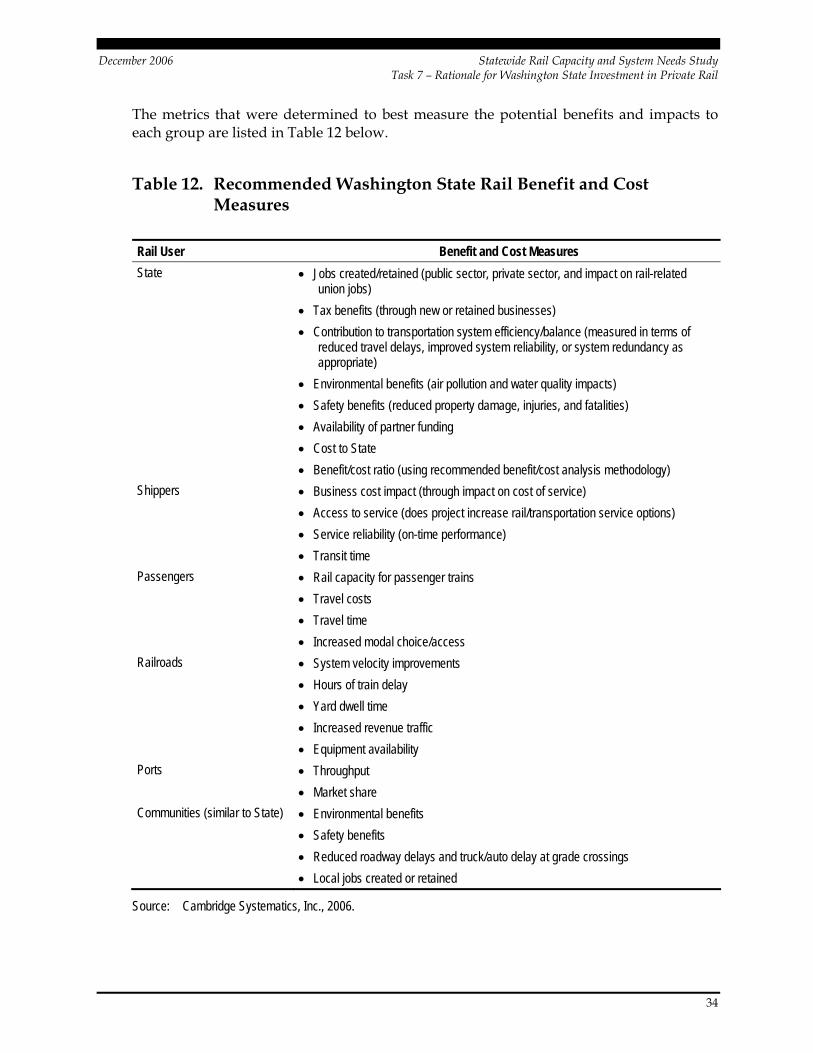
December 2006 Statewide Rail Capacity and System Needs Study Task 7 – Rationale for Washington State Investment in Private Rail
34
The metrics that were determined to best measure the potential benefits and impacts to each group are listed in Table 12 below.
Table 12. Recommended Washington State Rail Benefit and Cost Measures
Rail User Benefit and Cost Measures State • Jobs created/retained (public sector, private sector, and impact on rail-related
union jobs) • Tax benefits (through new or retained businesses) • Contribution to transportation system efficiency/balance (measured in terms of
reduced travel delays, improved system reliability, or system redundancy as appropriate)
• Environmental benefits (air pollution and water quality impacts) • Safety benefits (reduced property damage, injuries, and fatalities) • Availability of partner funding • Cost to State • Benefit/cost ratio (using recommended benefit/cost analysis methodology)
Shippers • Business cost impact (through impact on cost of service) • Access to service (does project increase rail/transportation service options) • Service reliability (on-time performance) • Transit time
Passengers • Rail capacity for passenger trains • Travel costs • Travel time • Increased modal choice/access
Railroads • System velocity improvements • Hours of train delay • Yard dwell time • Increased revenue traffic • Equipment availability
Ports • Throughput • Market share
Communities (similar to State) • Environmental benefits • Safety benefits • Reduced roadway delays and truck/auto delay at grade crossings • Local jobs created or retained
Source: Cambridge Systematics, Inc., 2006.
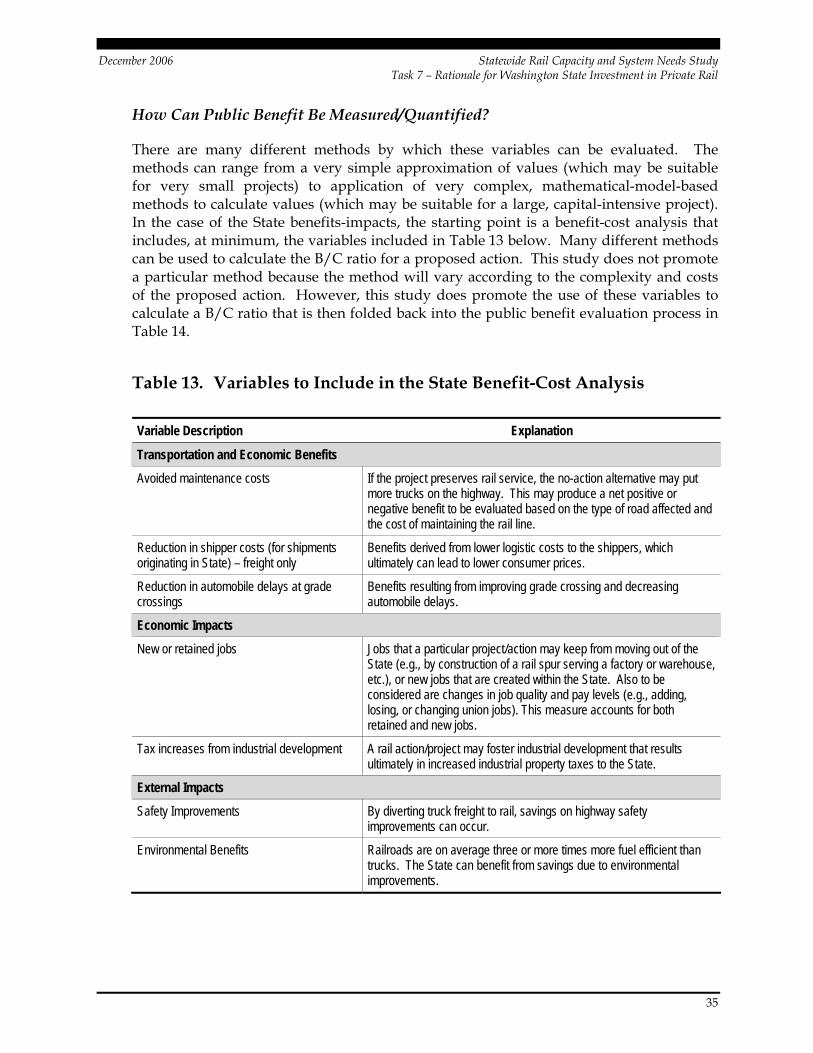
December 2006 Statewide Rail Capacity and System Needs Study Task 7 – Rationale for Washington State Investment in Private Rail
35
How Can Public Benefit Be Measured/Quantified?
There are many different methods by which these variables can be evaluated. The methods can range from a very simple approximation of values (which may be suitable for very small projects) to application of very complex, mathematical-model-based methods to calculate values (which may be suitable for a large, capital-intensive project). In the case of the State benefits-impacts, the starting point is a benefit-cost analysis that includes, at minimum, the variables included in Table 13 below. Many different methods can be used to calculate the B/C ratio for a proposed action. This study does not promote a particular method because the method will vary according to the complexity and costs of the proposed action. However, this study does promote the use of these variables to calculate a B/C ratio that is then folded back into the public benefit evaluation process in Table 14.
Table 13. Variables to Include in the State Benefit-Cost Analysis
Variable Description Explanation
Transportation and Economic Benefits Avoided maintenance costs If the project preserves rail service, the no-action alternative may put
more trucks on the highway. This may produce a net positive or negative benefit to be evaluated based on the type of road affected and the cost of maintaining the rail line.
Reduction in shipper costs (for shipments originating in State) – freight only
Benefits derived from lower logistic costs to the shippers, which ultimately can lead to lower consumer prices.
Reduction in automobile delays at grade crossings
Benefits resulting from improving grade crossing and decreasing automobile delays.
Economic Impacts New or retained jobs Jobs that a particular project/action may keep from moving out of the
State (e.g., by construction of a rail spur serving a factory or warehouse, etc.), or new jobs that are created within the State. Also to be considered are changes in job quality and pay levels (e.g., adding, losing, or changing union jobs). This measure accounts for both retained and new jobs.
Tax increases from industrial development A rail action/project may foster industrial development that results ultimately in increased industrial property taxes to the State.
External Impacts
Safety Improvements By diverting truck freight to rail, savings on highway safety improvements can occur.
Environmental Benefits Railroads are on average three or more times more fuel efficient than trucks. The State can benefit from savings due to environmental improvements.
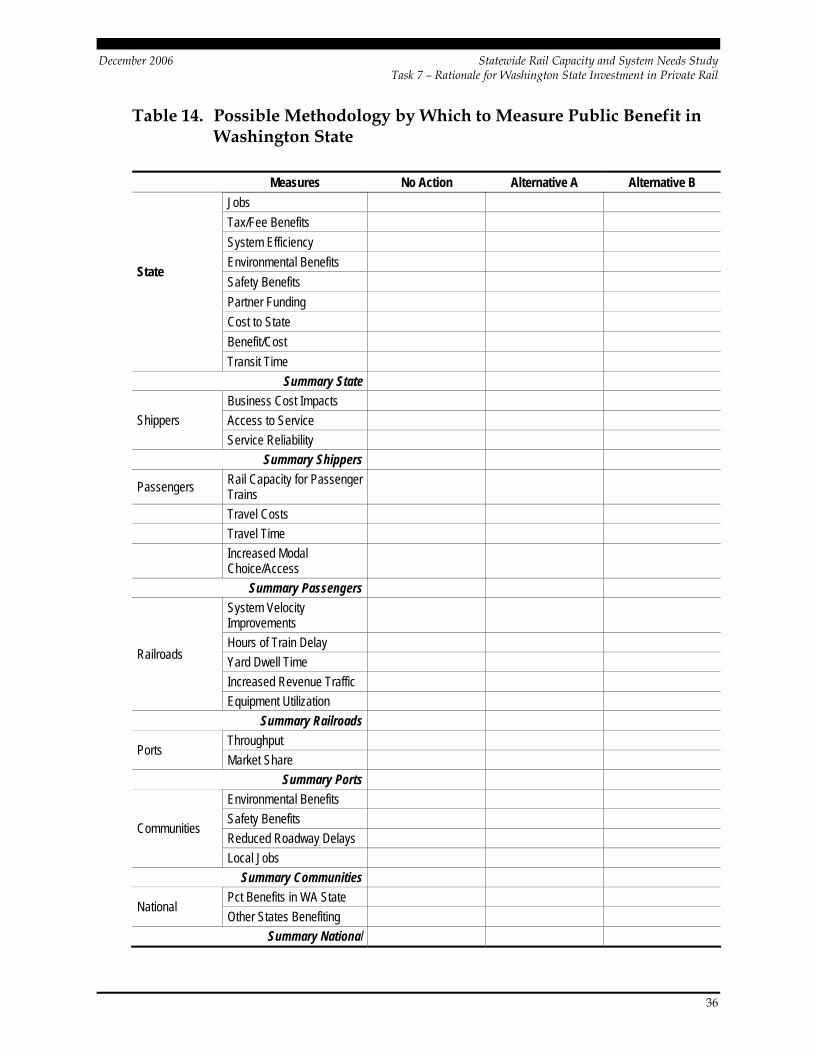
December 2006 Statewide Rail Capacity and System Needs Study Task 7 – Rationale for Washington State Investment in Private Rail
36
Table 14. Possible Methodology by Which to Measure Public Benefit in Washington State
Measures No Action Alternative A Alternative B Jobs Tax/Fee Benefits System Efficiency Environmental Benefits Safety Benefits Partner Funding Cost to State
State
Benefit/Cost Transit Time
Summary State Business Cost Impacts Access to Service Shippers Service Reliability
Summary Shippers
Passengers Rail Capacity for Passenger Trains
Travel Costs Travel Time
Increased Modal Choice/Access
Summary Passengers System Velocity Improvements
Hours of Train Delay Yard Dwell Time Increased Revenue Traffic
Railroads
Equipment Utilization Summary Railroads
Throughput Ports
Market Share Summary Ports
Environmental Benefits Safety Benefits Reduced Roadway Delays
Communities
Local Jobs Summary Communities
Pct Benefits in WA State National
Other States Benefiting Summary National
December 2006 Statewide Rail Capacity and System Needs Study Task 7 – Rationale for Washington State Investment in Private Rail
37
Source: Cambridge Systematics, Inc., 2006.
The results of the full assessment of benefits/impacts for all the affected groups will be summarized in a decision matrix. The decision matrices will allow for direct comparisons among alternative rail project packages, or comparisons between rail project packages and alternative modes with respect to the decision measures. Table 14 provides an example of a blank matrix. Illustrative examples of how to use this matrix are provided in Technical Memorandum 8. Wherever possible, measures will be quantified since this will make it easier to compare and rank each project with respect to each individual measure. Where the measures cannot be quantified, the analyst will need to exercise professional judgment and rate the project as having “high, medium, or low” benefits/impacts with respect to the measure in question.
As noted above, for private parties and for relatively small investments some of these measures may need to be evaluated qualitatively through discussions with the affected parties. However, for large investments, efforts should be made to develop independent estimates using tools, such as rail simulation models and economic impact models.12
Finally, each of the affected groups can be assigned a relative “received benefit” rating of “high,” “medium,” or “low.” The purpose of comparing the relative benefits received by all four groups is to summarize the benefits/impacts received by each group, and to use this information to draw conclusions about which groups are benefiting the most from any proposed action. Doing so gives a good indication of which groups should be more responsible for supporting and implementing a proposed action. It also can be used by the State to determine preliminary recommendations and an appropriate response to any proposed action.
The cross-group benefit methodology is a qualitative comparison that takes each individual user group’s relative rating of benefits (high, medium, or low) and compares them against each other. A separate comparison should be done for each proposed action. As shown in Table 15 below, there are many possible combinations of user group “relative ratings.” Each combination will lead to a different conclusion as to the appropriate state role or action.
12 Guide to Quantifying Economic Impacts of Large Scale Freight Investments, prepared for the U.S.
Department of Transportation by Cambridge Systematics, Inc., Economic Development Research Group, and Boston Logistics (available at http://www.dot.gov/freight/guide061018/guide.pdf) provides a good compendium description of both transportation and economic modeling tools that can be used to generate estimates of the variables listed as user benefits impacts in the proposed methodology if a more rigorous calculation procedure is justified.
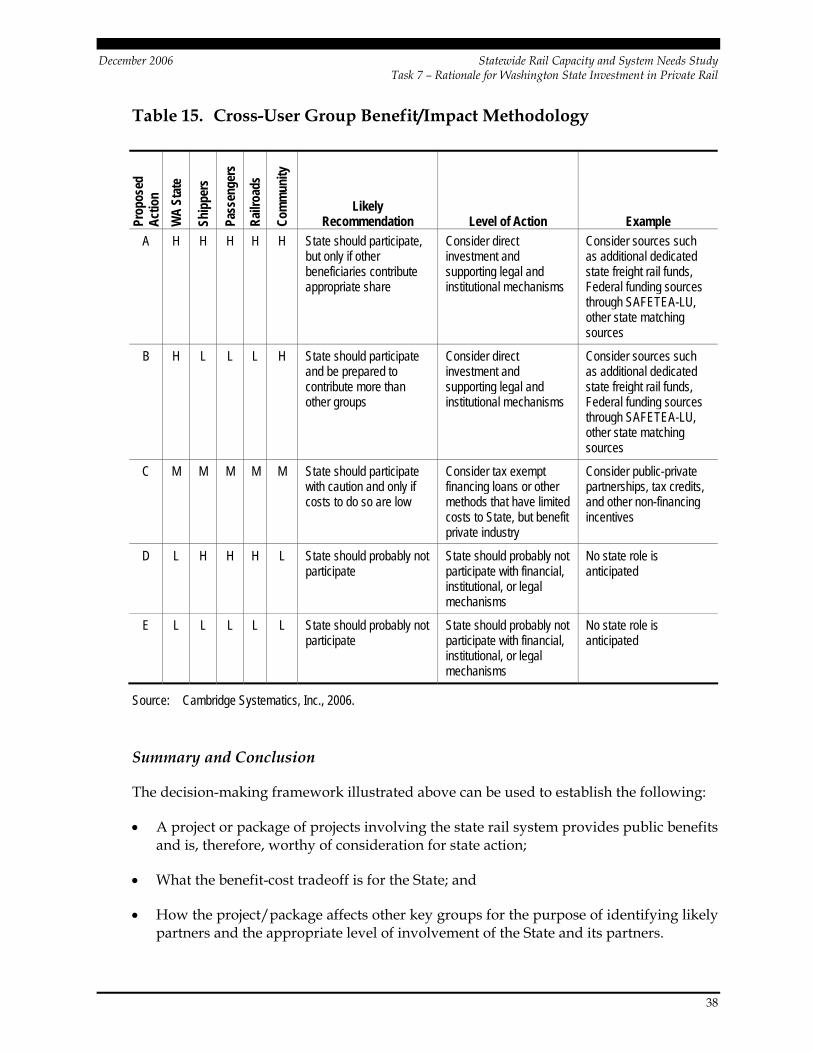
December 2006 Statewide Rail Capacity and System Needs Study Task 7 – Rationale for Washington State Investment in Private Rail
38
Table 15. Cross-User Group Benefit/Impact Methodology Pr
opos
ed
Actio
n W
A St
ate
Ship
pers
Pass
enge
rs
Railr
oads
Com
mun
ity
Likely Recommendation Level of Action Example
A H H H H H State should participate, but only if other beneficiaries contribute appropriate share
Consider direct investment and supporting legal and institutional mechanisms
Consider sources such as additional dedicated state freight rail funds, Federal funding sources through SAFETEA-LU, other state matching sources
B H L L L H State should participate and be prepared to contribute more than other groups
Consider direct investment and supporting legal and institutional mechanisms
Consider sources such as additional dedicated state freight rail funds, Federal funding sources through SAFETEA-LU, other state matching sources
C M M M M M State should participate with caution and only if costs to do so are low
Consider tax exempt financing loans or other methods that have limited costs to State, but benefit private industry
Consider public-private partnerships, tax credits, and other non-financing incentives
D L H H H L State should probably not participate
State should probably not participate with financial, institutional, or legal mechanisms
No state role is anticipated
E L L L L L State should probably not participate
State should probably not participate with financial, institutional, or legal mechanisms
No state role is anticipated
Source: Cambridge Systematics, Inc., 2006.
Summary and Conclusion
The decision-making framework illustrated above can be used to establish the following:
• A project or package of projects involving the state rail system provides public benefits and is, therefore, worthy of consideration for state action;
• What the benefit-cost tradeoff is for the State; and
• How the project/package affects other key groups for the purpose of identifying likely partners and the appropriate level of involvement of the State and its partners.
December 2006 Statewide Rail Capacity and System Needs Study Task 7 – Rationale for Washington State Investment in Private Rail
39
In Technical Memorandum 8, this decision-making framework will be set in the context of a series of policy alternatives that more clearly define the types of strategic investments and actions the State should consider in order to meet the needs of rail users in the State and to obtain benefits from their use of the rail system. This technical memorandum will also illustrate how the framework can be used to evaluate illustrative packages of projects that are designed to address specific needs of major rail user groups based on the analysis of the condition of the state system that is described in Interim Report #1.