Embed Size (px)
Citation preview
Ravello June 2012Meyer, Binfield and Thompson
Seth MeyerEconomistGlobal Perspective Studies GroupFAO, Rome
The Role of Biofuel Policy and Biotechnology in the Continued
Development of the Ethanol Industry in the United States
Wyatt ThompsonJulian Binfield
Food and Agricultural Policy Research InstituteUniversity of Missouri, USA
Ravello June 2012Meyer, Binfield and Thompson
Agenda• Model Overview• Biofuel policy and effects of US mandate
removal on biofuel and agricultural markets
• Simulation of technology adoption in the context of US biofuel policy, who benefits and why?
In the long run maize prices can’t be too cheap (relative to oil) too long but in the medium run (10 years) there can be substantial divergence.
Ravello June 2012Meyer, Binfield and Thompson
A Model of US Agriculture and Biofuel markets and policy
• Deterministic projections: single solution for endogenous variables based on a single set of assumptions. Smooth yield paths over 10 years.• Stochastic projections: (500 solutions based on 500 sets of assumptions in this case) introduces variability• Biofuel and agricultural policies are often non-linear and thus context plays a critical role in the results.• Explore both levels and variability.
Ravello June 2012Meyer, Binfield and Thompson
Stochastic model, part 1
• US partial equilibrium model– Rest of world represented with reduced form equations– Covers crop, livestock, biofuel (and energy) markets
• Dynamic– Solves for 10 consecutive years (2012/13 to 2021/22)– Has some path dependency– Includes some investment behavior (e.g., livestock, biofuel capacity)
• Hybrid
– Some parameters estimated econometrically– Others based on judgment, but calibrated to market data and often
reviewed
Ravello June 2012Meyer, Binfield and Thompson
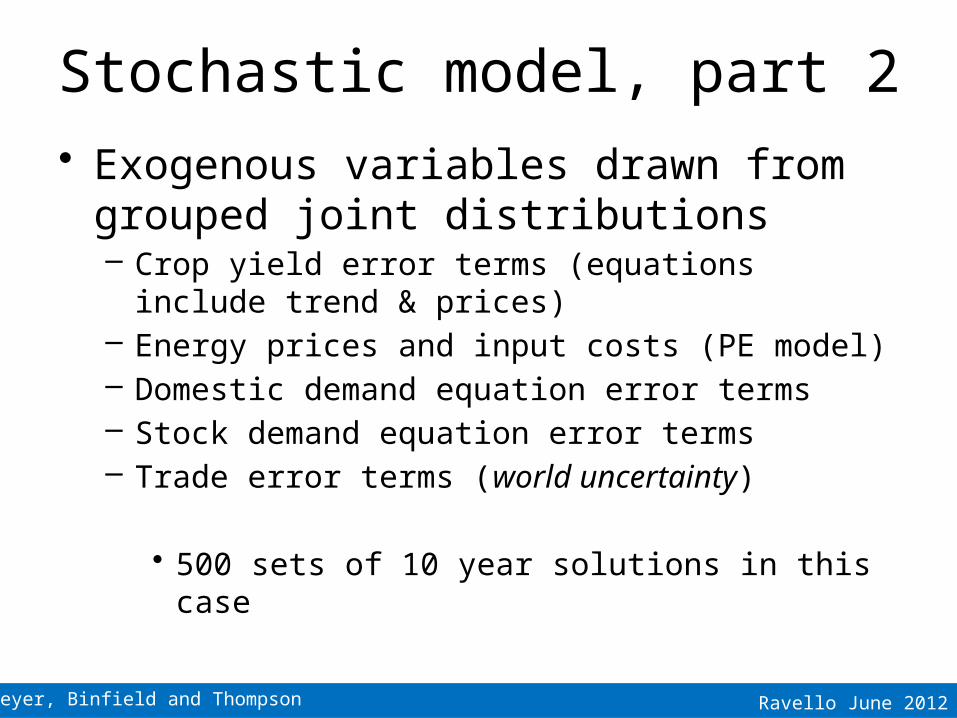
Stochastic model, part 2• Exogenous variables drawn from grouped
joint distributions– Crop yield error terms (equations include trend &
prices)– Energy prices and input costs (PE model)– Domestic demand equation error terms – Stock demand equation error terms– Trade error terms (world uncertainty)
• 500 sets of 10 year solutions in this case
Ravello June 2012Meyer, Binfield and Thompson
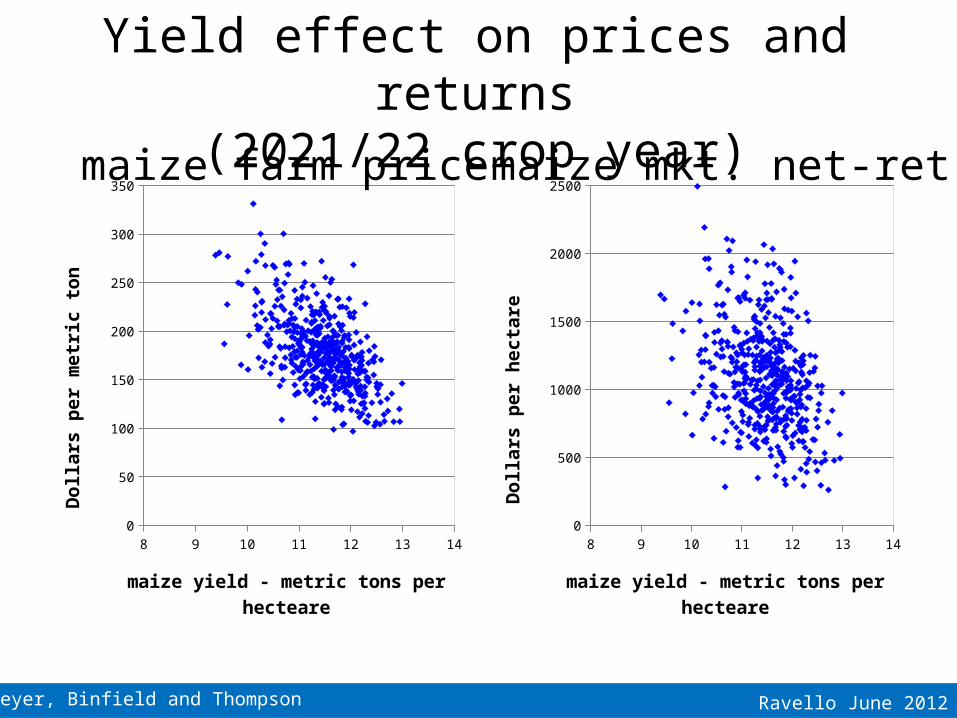
Yield effect on prices and returns(2021/22 crop year)
8 9 10 11 12 13 140
50
100
150
200
250
300
350
maize yield - metric tons per hecteare
Do
llars
pe
r m
etr
ic t
on
8 9 10 11 12 13 140
500
1000
1500
2000
2500
maize yield - metric tons per hecteare
Do
llars
pe
r h
ec
tare
maize farm price maize mkt. net-ret
Ravello June 2012Meyer, Binfield and Thompson
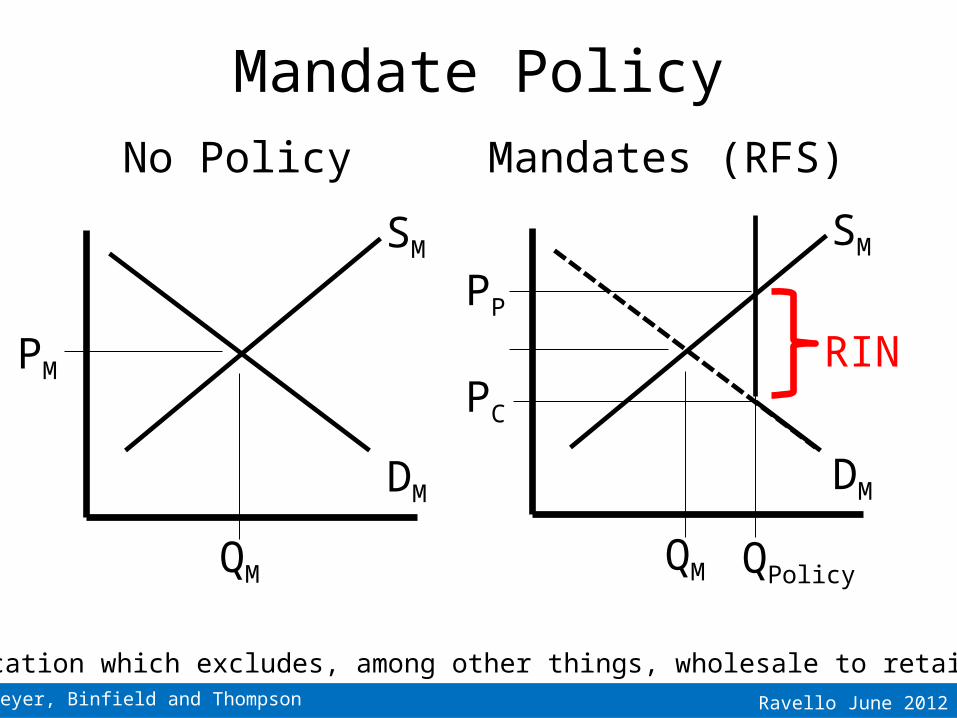
Mandate Policy
SM
DM
QM
PM
*Simplification which excludes, among other things, wholesale to retail markup
SM
DM
QM
PP
PC
QPolicy
No Policy Mandates (RFS)
RIN
Ravello June 2012Meyer, Binfield and Thompson
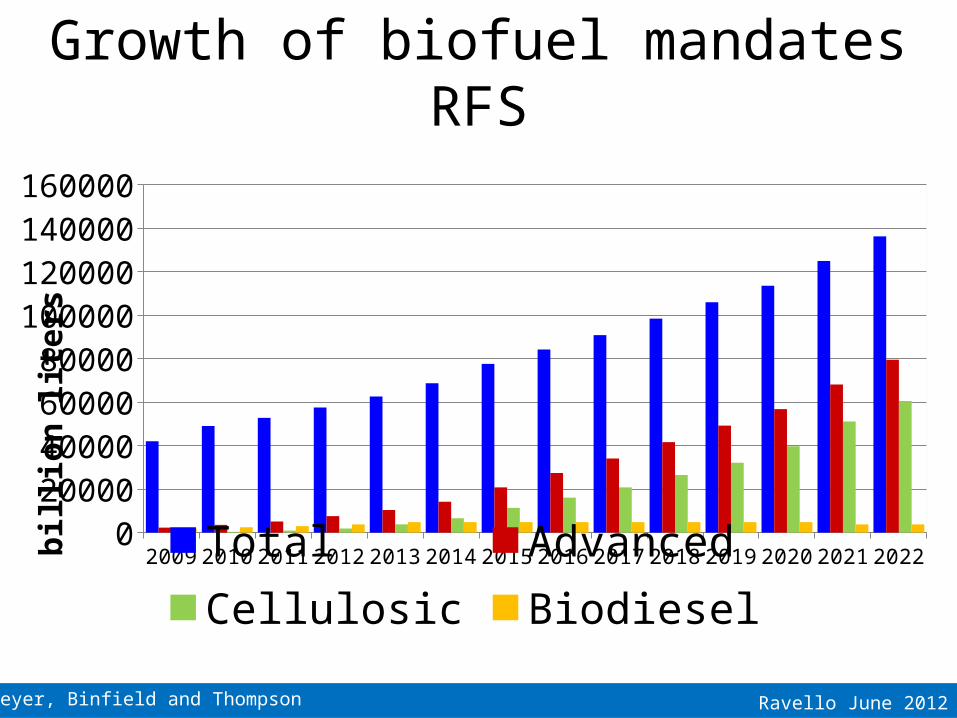
Growth of biofuel mandatesRFS
2009 2010 2011 2012 2013 2014 2015 2016 2017 2018 2019 2020 2021 20220
20000400006000080000
100000120000140000160000
Total AdvancedCellulosic Biodiesel
bil
lio
n l
ite
rs
How do blenders show they complied? RINS
Ravello June 2012Meyer, Binfield and Thompson
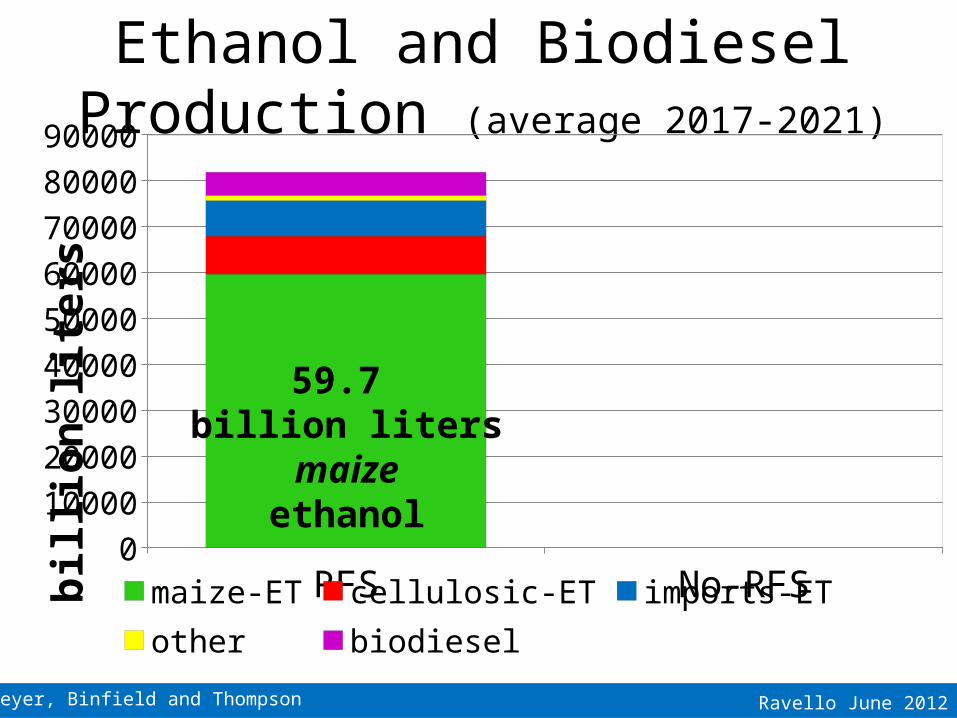
Ethanol and Biodiesel Production (average 2017-2021)
RFS No-RFS0
10000
20000
30000
40000
50000
60000
70000
80000
90000
maize-ET cellulosic-ET imports-ETother biodiesel
bil
lio
n l
ite
rs
59.7 billion litersmaize
ethanol
Ravello June 2012Meyer, Binfield and Thompson
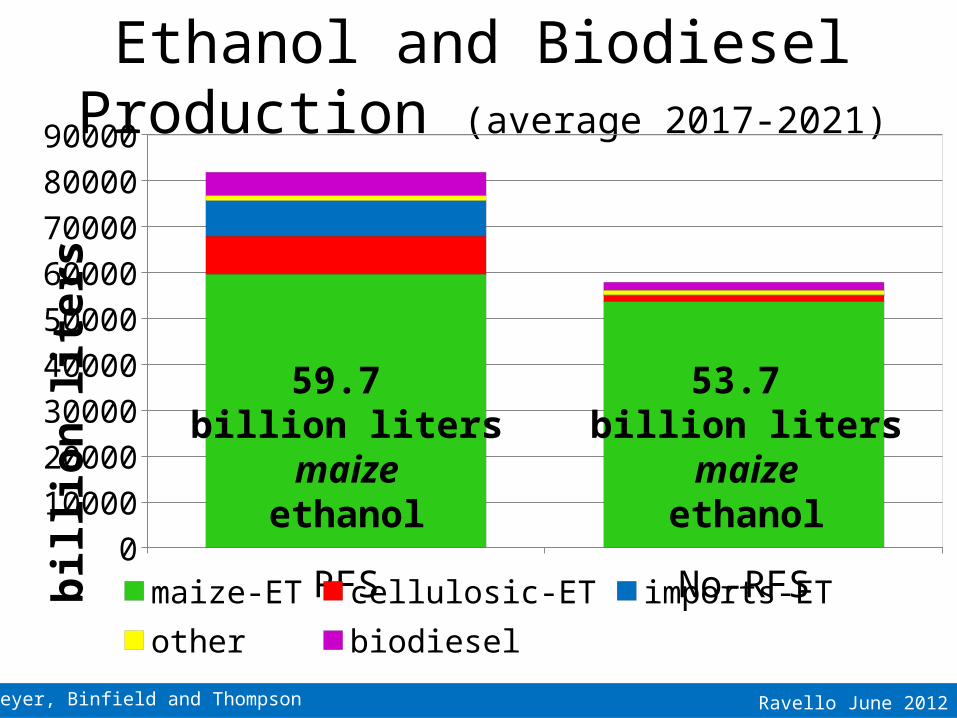
Ethanol and Biodiesel Production (average 2017-2021)
RFS No-RFS0
10000
20000
30000
40000
50000
60000
70000
80000
90000
maize-ET cellulosic-ET imports-ETother biodiesel
bil
lio
n l
ite
rs
53.7 billion litersmaize
ethanol
59.7 billion litersmaize
ethanol
Ravello June 2012Meyer, Binfield and Thompson
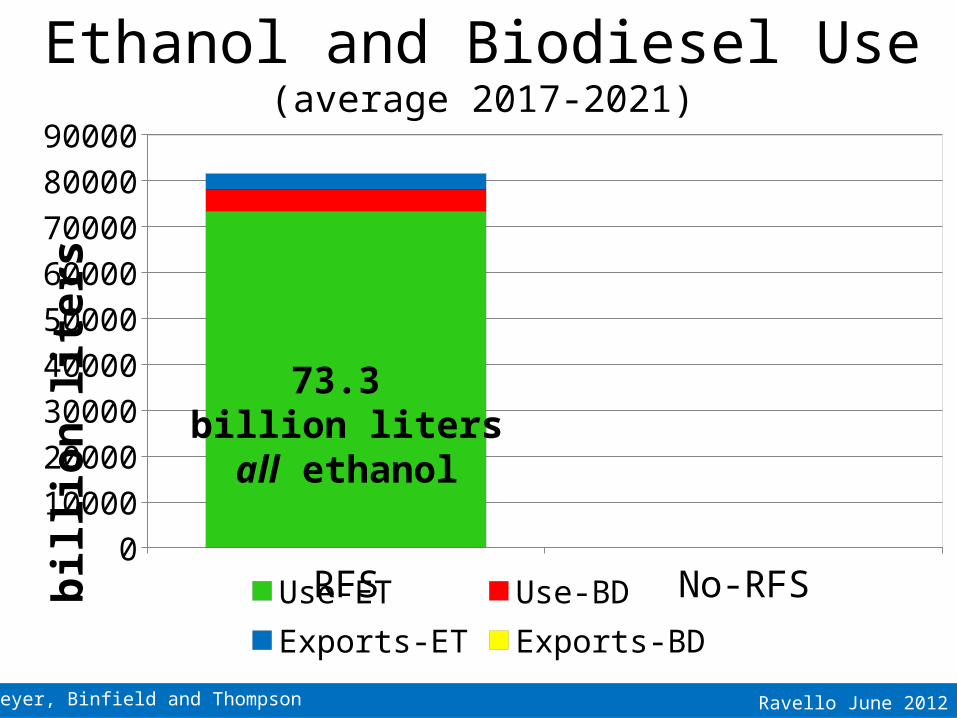
Ethanol and Biodiesel Use(average 2017-2021)
RFS No-RFS0
10000
20000
30000
40000
50000
60000
70000
80000
90000
Use-ET Use-BD Exports-ET Exports-BD
bil
lio
n l
ite
rs
73.3 billion litersall ethanol
Ravello June 2012Meyer, Binfield and Thompson
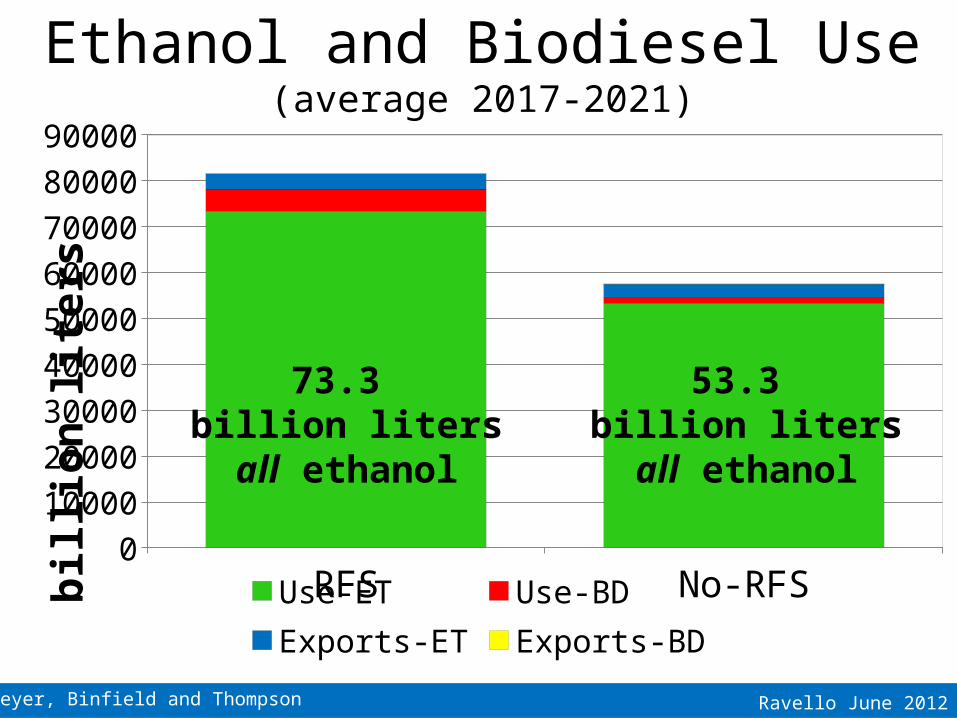
Ethanol and Biodiesel Use(average 2017-2021)
RFS No-RFS0
10000
20000
30000
40000
50000
60000
70000
80000
90000
Use-ET Use-BD Exports-ET Exports-BD
bil
lio
n l
ite
rs
53.3 billion litersall ethanol
73.3 billion litersall ethanol
Ravello June 2012Meyer, Binfield and Thompson
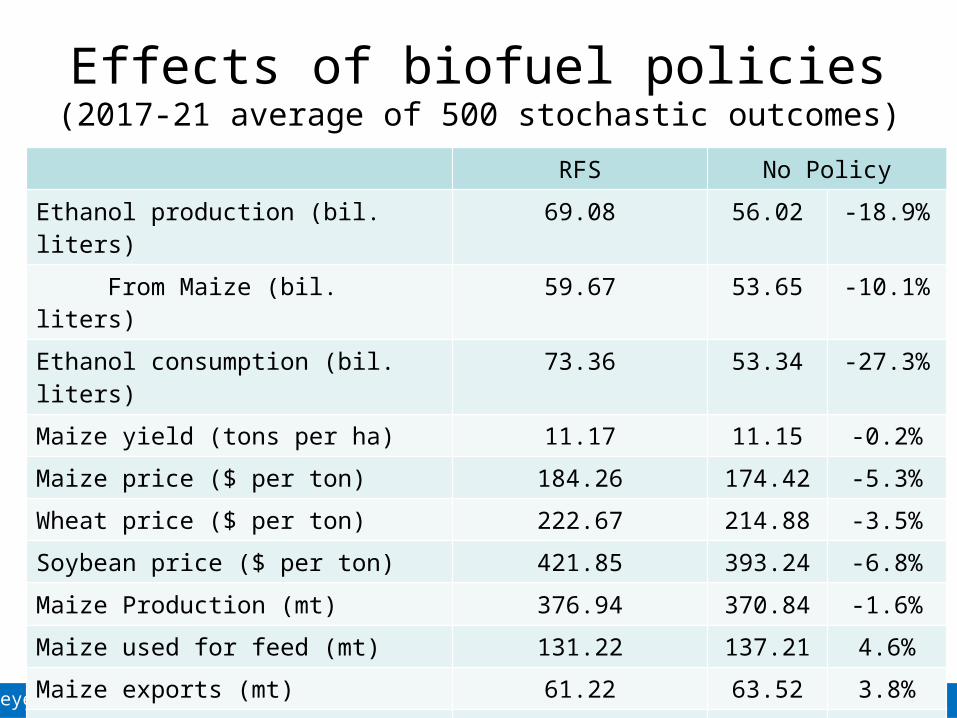
Effects of biofuel policies(2017-21 average of 500 stochastic outcomes)
RFS No Policy
Ethanol production (bil. liters) 69.08 56.02 -18.9%
From Maize (bil. liters) 59.67 53.65 -10.1%
Ethanol consumption (bil. liters) 73.36 53.34 -27.3%
Maize yield (tons per ha) 11.17 11.15 -0.2%
Maize price ($ per ton) 184.26 174.42 -5.3%
Wheat price ($ per ton) 222.67 214.88 -3.5%
Soybean price ($ per ton) 421.85 393.24 -6.8%
Maize Production (mt) 376.94 370.84 -1.6%
Maize used for feed (mt) 131.22 137.21 4.6%
Maize exports (mt) 61.22 63.52 3.8%
Ethanol producer price (cents/liter) 0.54 0.51 -6.1%
Ethanol consumer price (cents/liter) 0.58 0.68 16.2%
Ravello June 2012Meyer, Binfield and Thompson
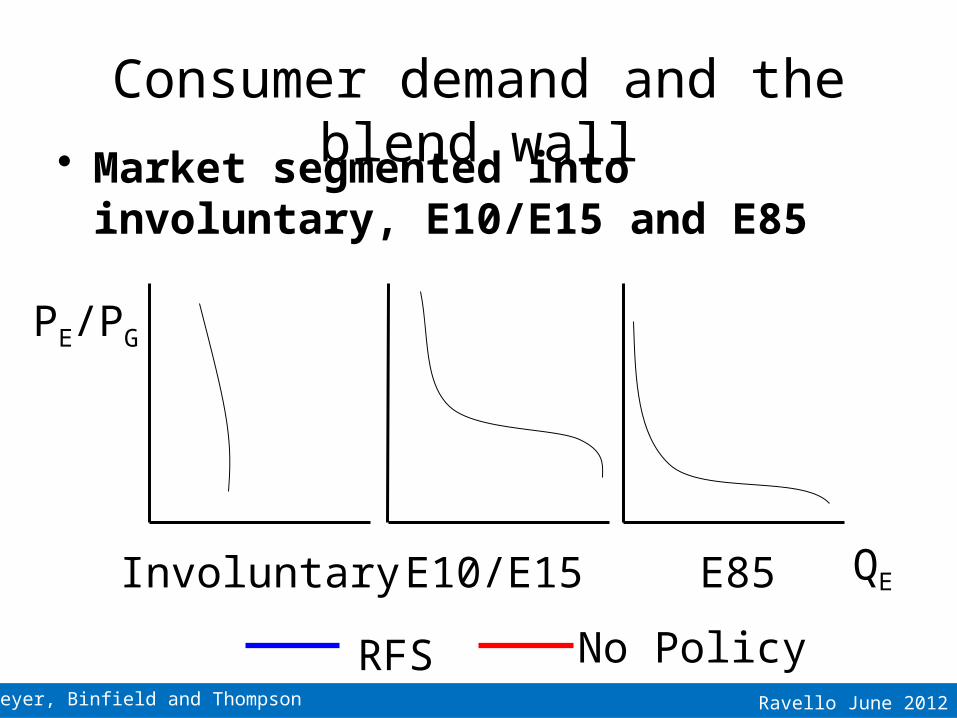
Consumer demand and the blend wall
• Market segmented into involuntary, E10/E15 and E85
Involuntary E10/E15 E85
PE/PG
QE
RFS No Policy
Ravello June 2012Meyer, Binfield and Thompson
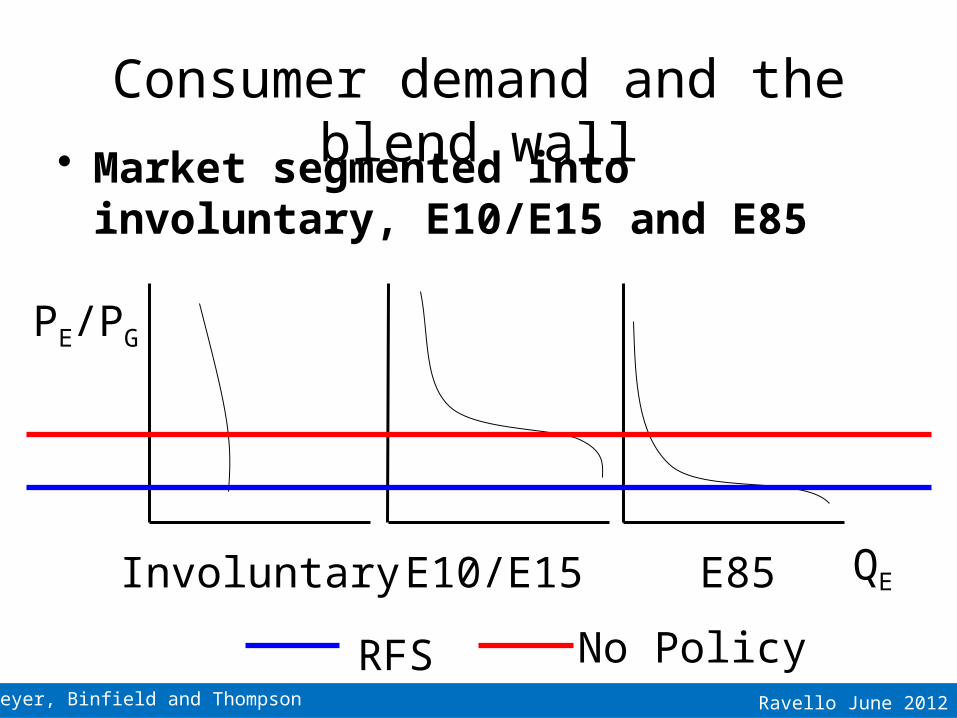
Consumer demand and the blend wall
• Market segmented into involuntary, E10/E15 and E85
Involuntary E10/E15 E85
PE/PG
QE
RFS No Policy
Ravello June 2012Meyer, Binfield and Thompson
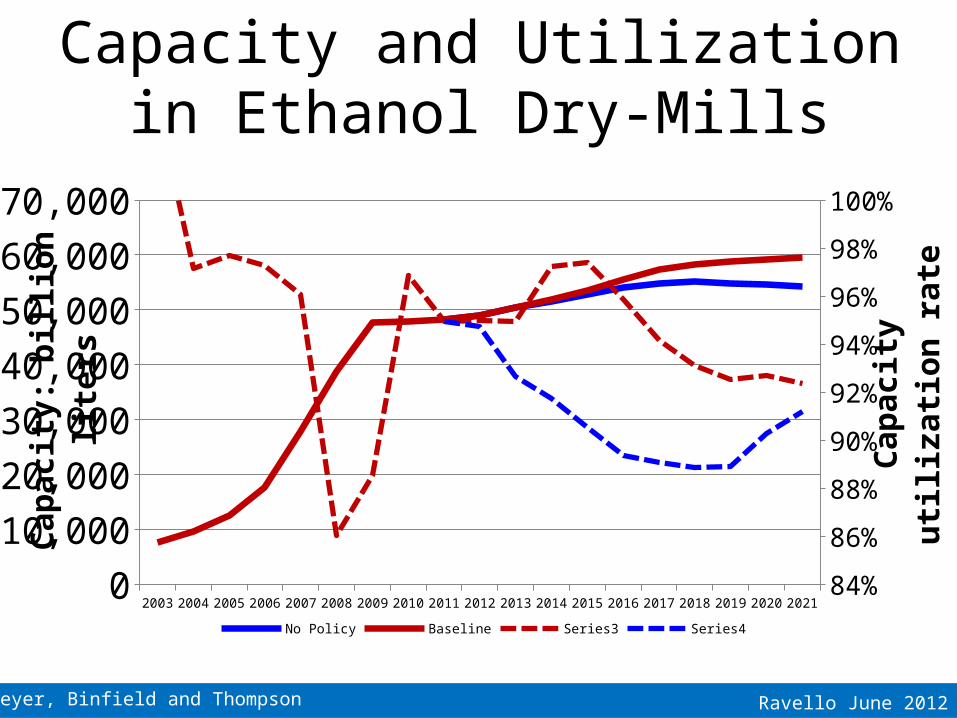
Capacity and Utilization in Ethanol Dry-Mills
2003 2004 2005 2006 2007 2008 2009 2010 2011 2012 2013 2014 2015 2016 2017 2018 2019 2020 20210
10,000
20,000
30,000
40,000
50,000
60,000
70,000
84%
86%
88%
90%
92%
94%
96%
98%
100%
No Policy Baseline Series3 Series4
Ca
pa
cit
y:
bil
lio
n l
ite
rs
Ca
pa
cit
y u
tili
zati
on
ra
te
Ravello June 2012Meyer, Binfield and Thompson
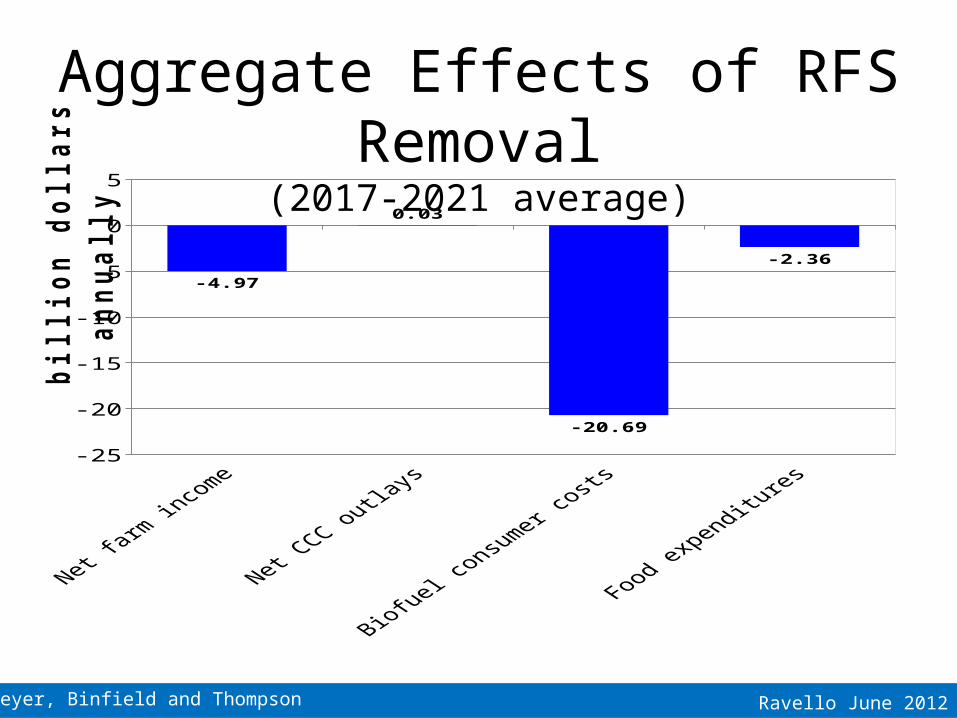
Aggregate Effects of RFS Removal(2017-2021 average)
-25
-20
-15
-10
-5
0
5
-4.97
0.03
-20.69
-2.36
bil
lio
n d
oll
ars
an
nu
all
y
Ravello June 2012Meyer, Binfield and Thompson
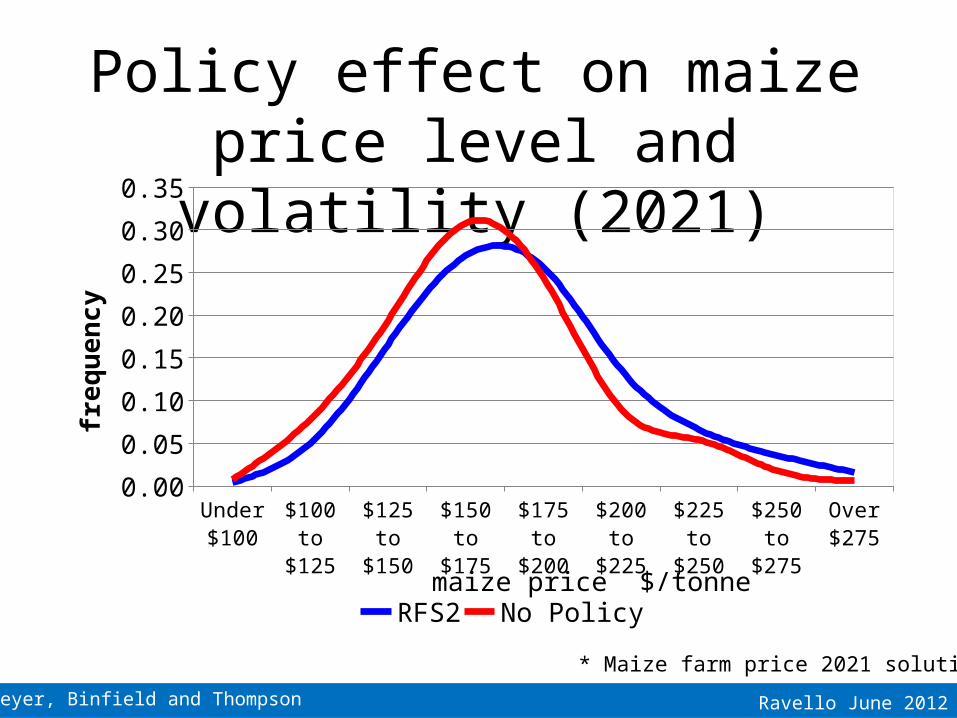
Policy effect on maize price level and volatility (2021)
Under $100
$100 to $125
$125 to $150
$150 to $175
$175 to $200
$200 to $225
$225 to $250
$250 to $275
Over $275
0.00
0.05
0.10
0.15
0.20
0.25
0.30
0.35
RFS2 No Policymaize price $/tonne
fre
qu
en
cy
* Maize farm price 2021 solutions
Ravello June 2012Meyer, Binfield and Thompson
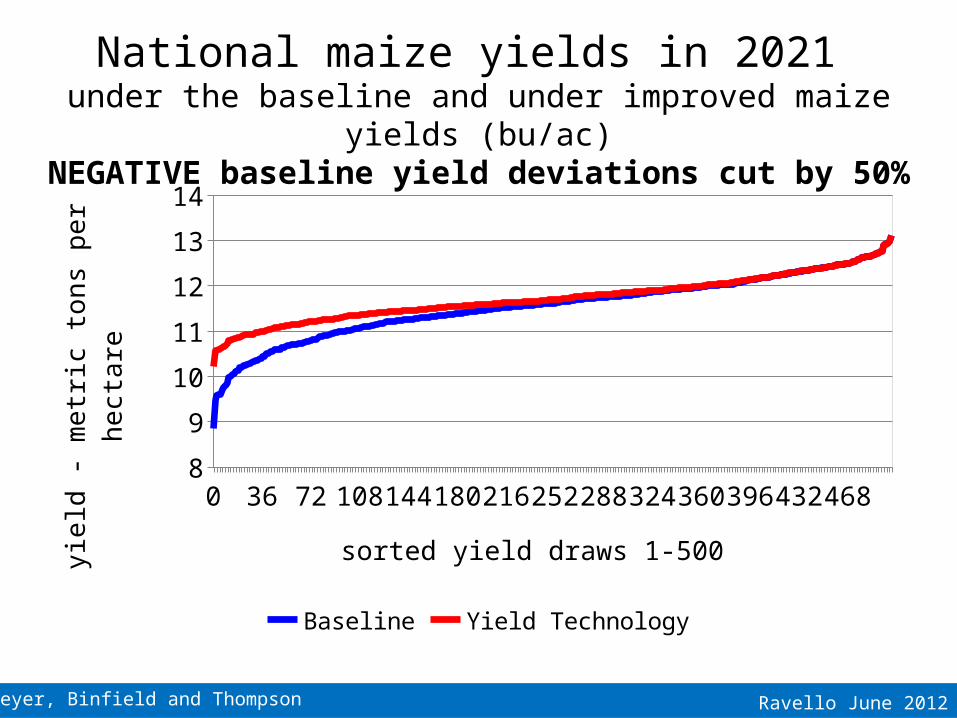
National maize yields in 2021 under the baseline and under improved maize yields (bu/ac)
NEGATIVE baseline yield deviations cut by 50%
0 32 64 96 1281601922242562883203523844164484808
9
10
11
12
13
14
Baseline Yield Technology
sorted yield draws 1-500yie
ld -
me
tric
to
ns
pe
r h
ect
are
Ravello June 2012Meyer, Binfield and Thompson
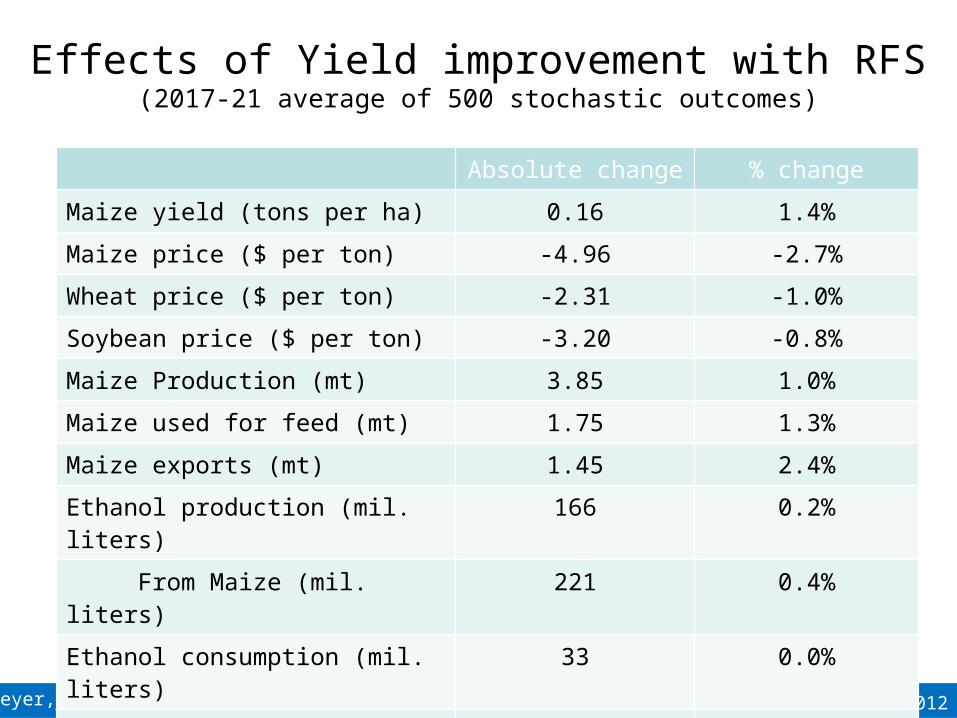
Effects of Yield improvement with RFS(2017-21 average of 500 stochastic outcomes)
Absolute change % change
Maize yield (tons per ha) 0.16 1.4%
Maize price ($ per ton) -4.96 -2.7%
Wheat price ($ per ton) -2.31 -1.0%
Soybean price ($ per ton) -3.20 -0.8%
Maize Production (mt) 3.85 1.0%
Maize used for feed (mt) 1.75 1.3%
Maize exports (mt) 1.45 2.4%
Ethanol production (mil. liters) 166 0.2%
From Maize (mil. liters) 221 0.4%
Ethanol consumption (mil. liters) 33 0.0%
Ethanol producer price (cents/liter) -.01 -1.5%
Ethanol consumer price (cents/liter) -.00 -0.1%
Ravello June 2012Meyer, Binfield and Thompson
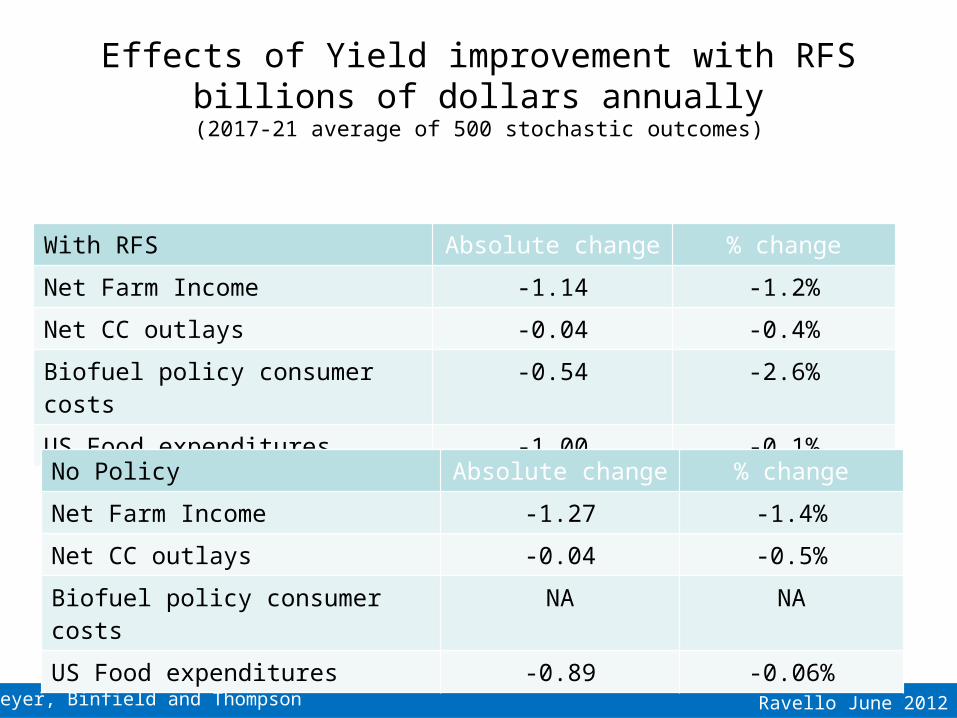
Effects of Yield improvement with RFSbillions of dollars annually
(2017-21 average of 500 stochastic outcomes)
With RFS Absolute change % change
Net Farm Income -1.14 -1.2%
Net CC outlays -0.04 -0.4%
Biofuel policy consumer costs -0.54 -2.6%
US Food expenditures -1.00 -0.1%
No Policy Absolute change % change
Net Farm Income -1.27 -1.4%
Net CC outlays -0.04 -0.5%
Biofuel policy consumer costs NA NA
US Food expenditures -0.89 -0.06%
Ravello June 2012Meyer, Binfield and Thompson
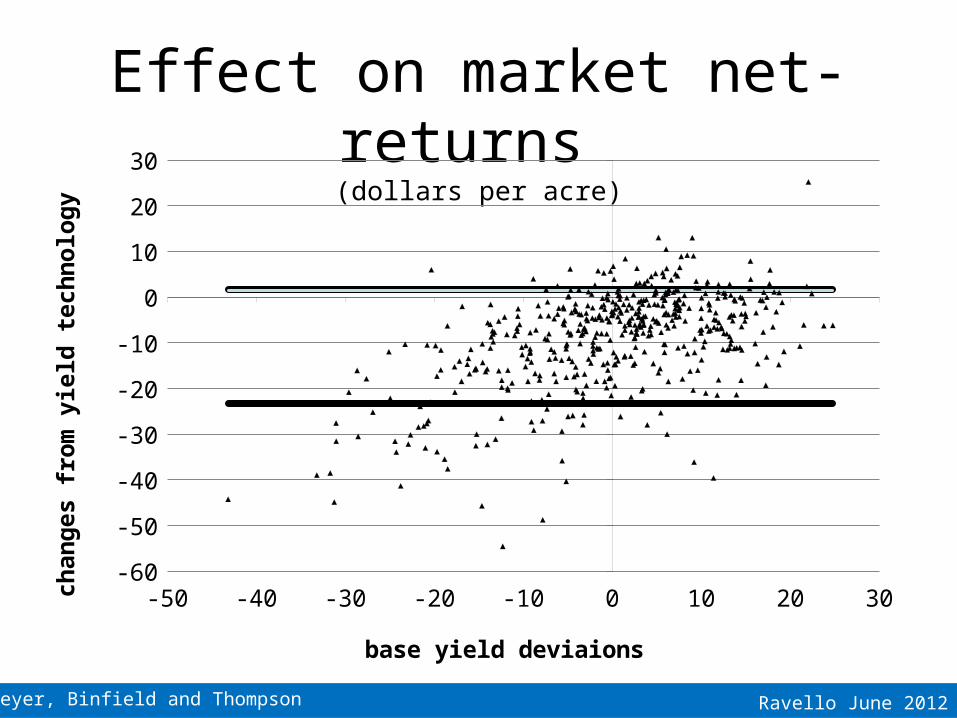
Effect on market net-returns (dollars per acre)
-50 -40 -30 -20 -10 0 10 20 30-60
-50
-40
-30
-20
-10
0
10
20
30
base yield deviaions
chan
ges
fro
m y
ield
tec
hn
olo
gy
Ravello June 2012Meyer, Binfield and Thompson
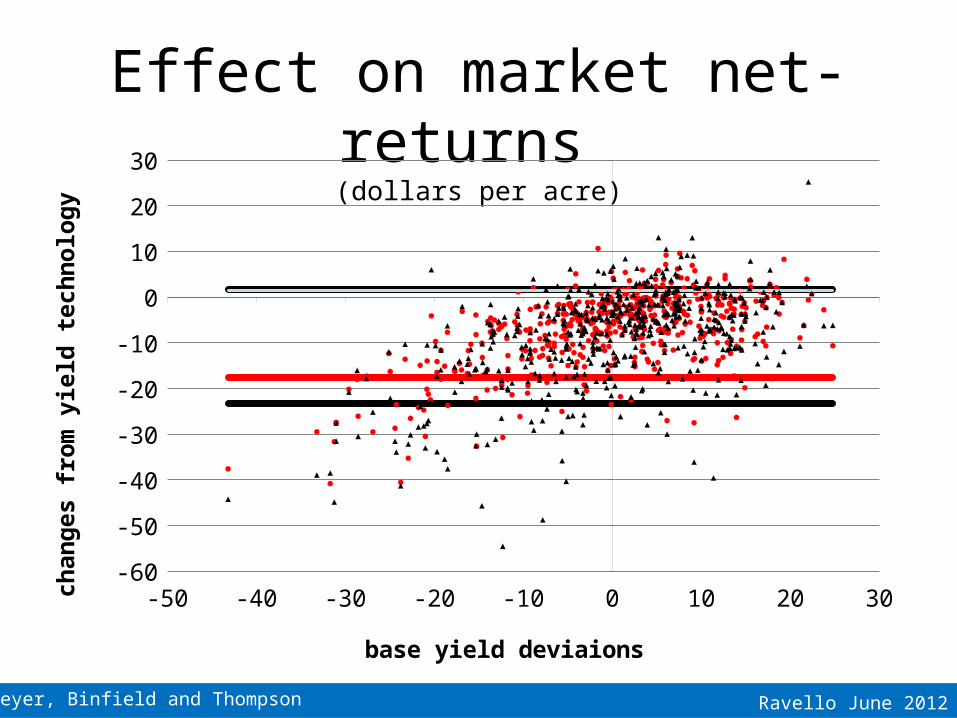
Effect on market net-returns (dollars per acre)
-50 -40 -30 -20 -10 0 10 20 30-60
-50
-40
-30
-20
-10
0
10
20
30
base yield deviaions
chan
ges
fro
m y
ield
tec
hn
olo
gy
Ravello June 2012Meyer, Binfield and Thompson
Conclusions• Policy supports farm income but costs to
consumers of food and fuel are large• US biofuel policy increases maize prices and
may increase price volatility • Short run inelasticity in biofuel demand
means benefits from technology flow to consumers
• The blend wall and production capacity may limit (medium term) demand elasticity even in the absence of policy
Ravello June 2012Meyer, Binfield and Thompson
THANKS!
• To contact Seth Meyer (presentor): [email protected]
• To contact Wyatt Thompson (co-author): [email protected]
• To contact Julian Binfield (co-author): [email protected]
Ravello June 2012Meyer, Binfield and Thompson
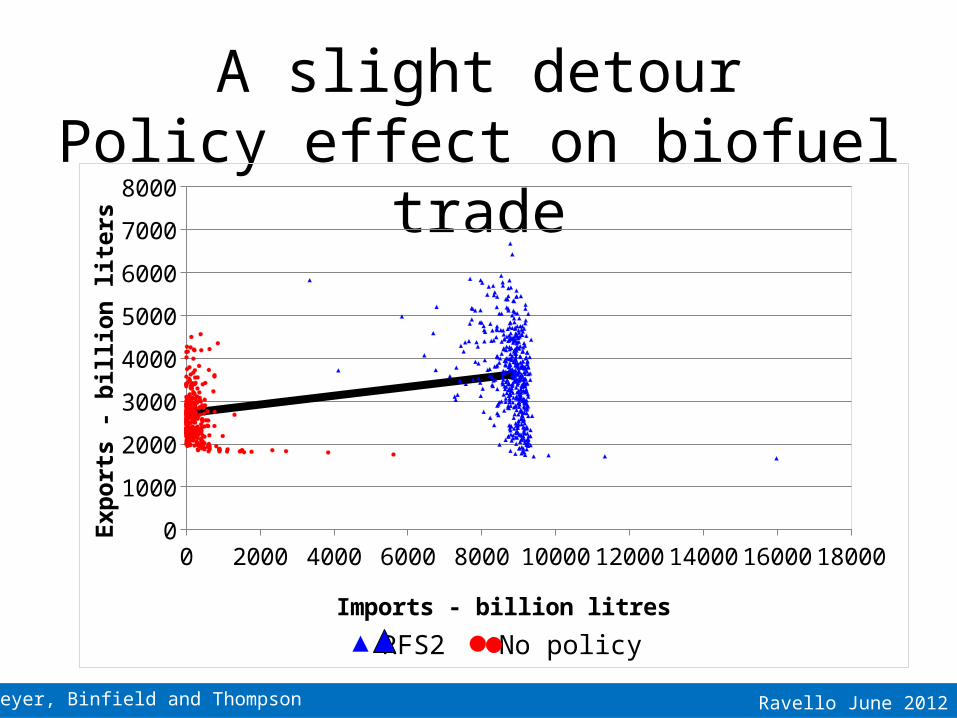
A slight detourPolicy effect on biofuel trade
0 2000 4000 6000 8000 10000 12000 14000 16000 180000
1000
2000
3000
4000
5000
6000
7000
8000
RFS2 No policy
Imports - billion litres
Exp
ort
s -
bil
lio
n l
iter
s
Ravello June 2012Meyer, Binfield and Thompson
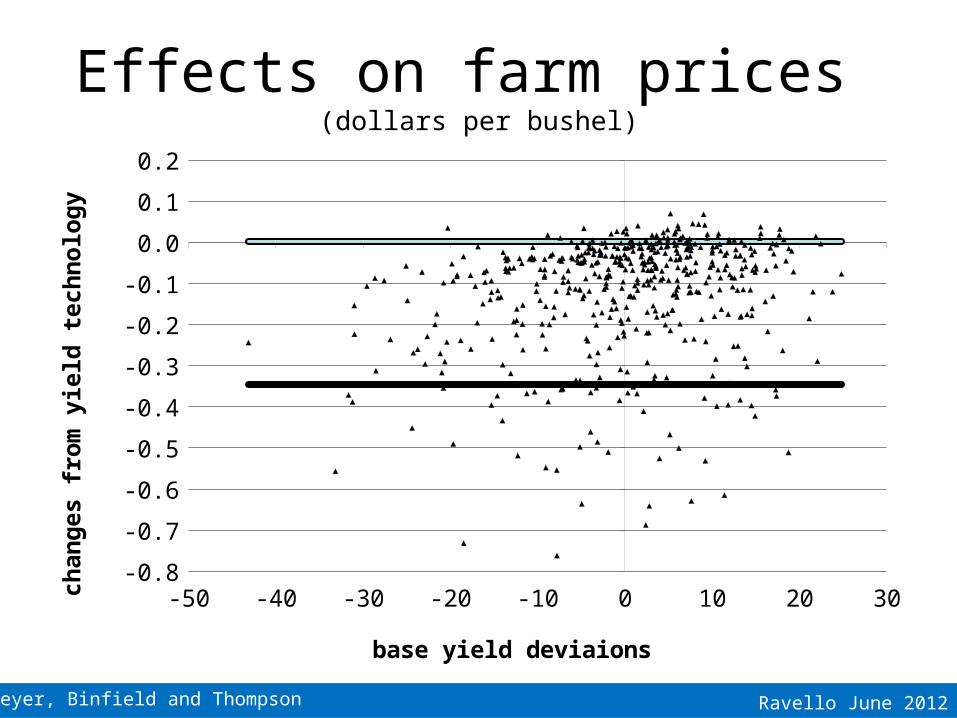
Effects on farm prices (dollars per bushel)
-50 -40 -30 -20 -10 0 10 20 30-0.8
-0.7
-0.6
-0.5
-0.4
-0.3
-0.2
-0.1
0.0
0.1
0.2
base yield deviaions
chan
ges
fro
m y
ield
tec
hn
olo
gy
Ravello June 2012Meyer, Binfield and Thompson
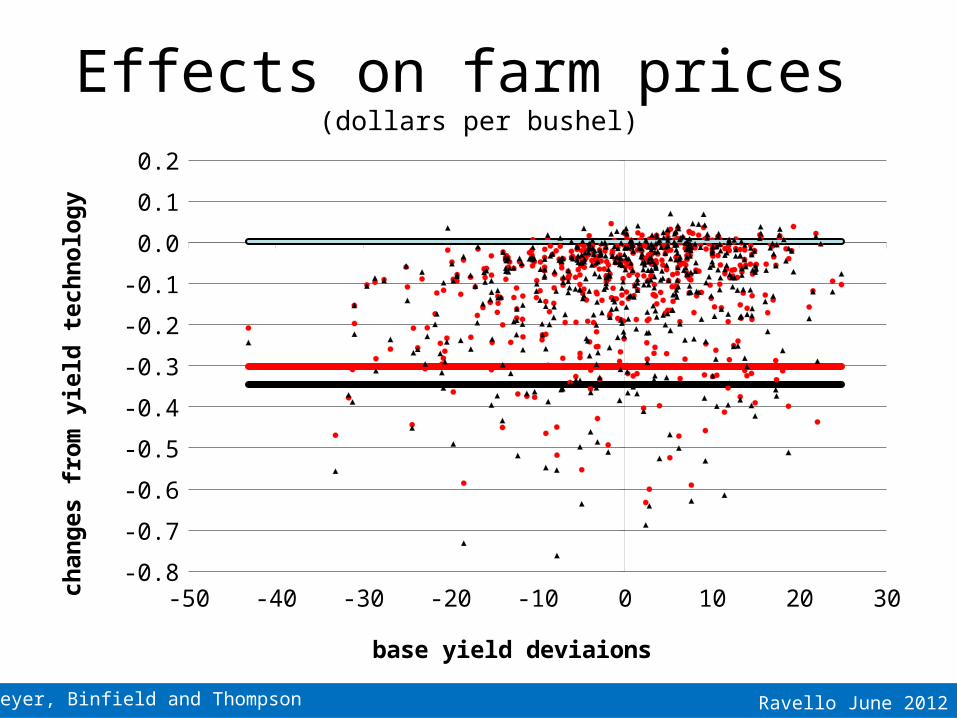
Effects on farm prices (dollars per bushel)
-50 -40 -30 -20 -10 0 10 20 30-0.8
-0.7
-0.6
-0.5
-0.4
-0.3
-0.2
-0.1
0.0
0.1
0.2
base yield deviaions
chan
ges
fro
m y
ield
tec
hn
olo
gy
Ravello June 2012Meyer, Binfield and Thompson
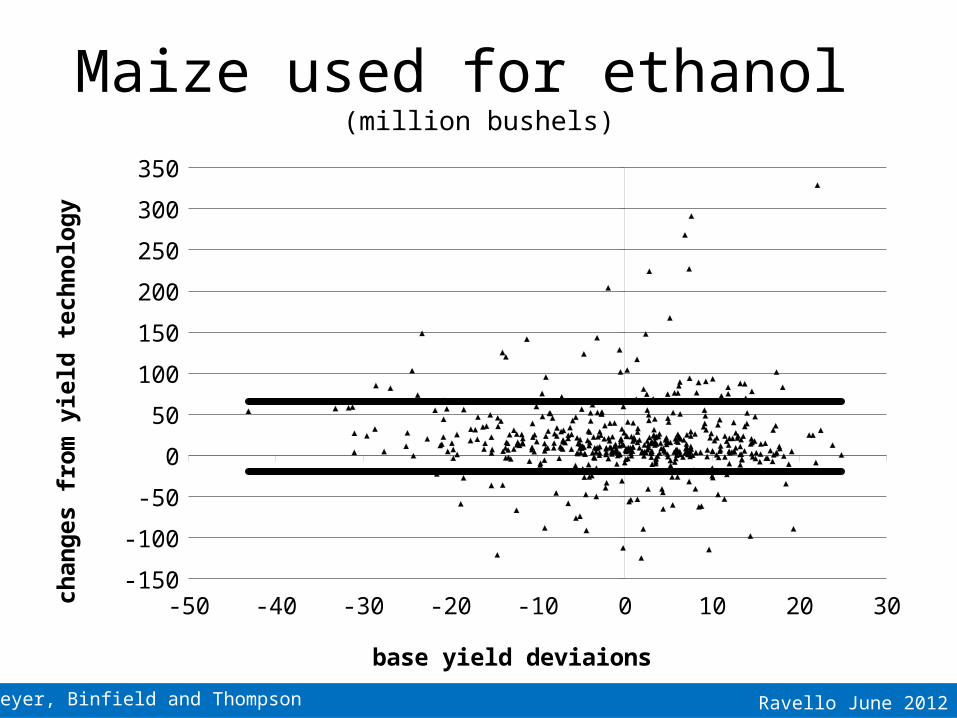
Maize used for ethanol (million bushels)
-50 -40 -30 -20 -10 0 10 20 30-150
-100
-50
0
50
100
150
200
250
300
350
base yield deviaions
chan
ges
fro
m y
ield
tec
hn
olo
gy
Ravello June 2012Meyer, Binfield and Thompson
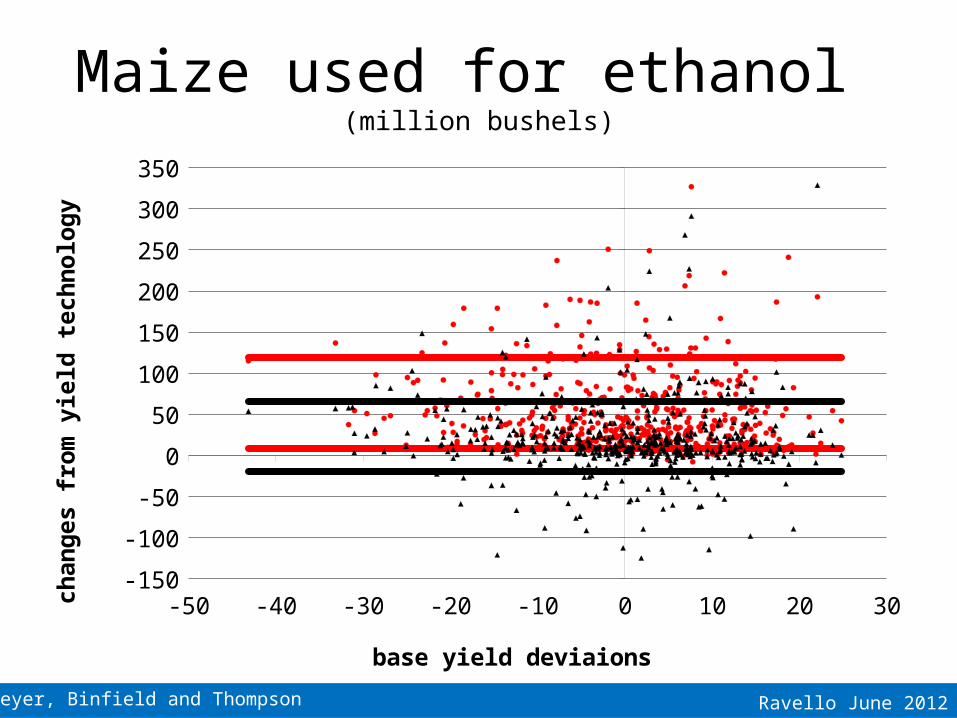
Maize used for ethanol (million bushels)
-50 -40 -30 -20 -10 0 10 20 30-150
-100
-50
0
50
100
150
200
250
300
350
base yield deviaions
chan
ges
fro
m y
ield
tec
hn
olo
gy
Ravello June 2012Meyer, Binfield and Thompson
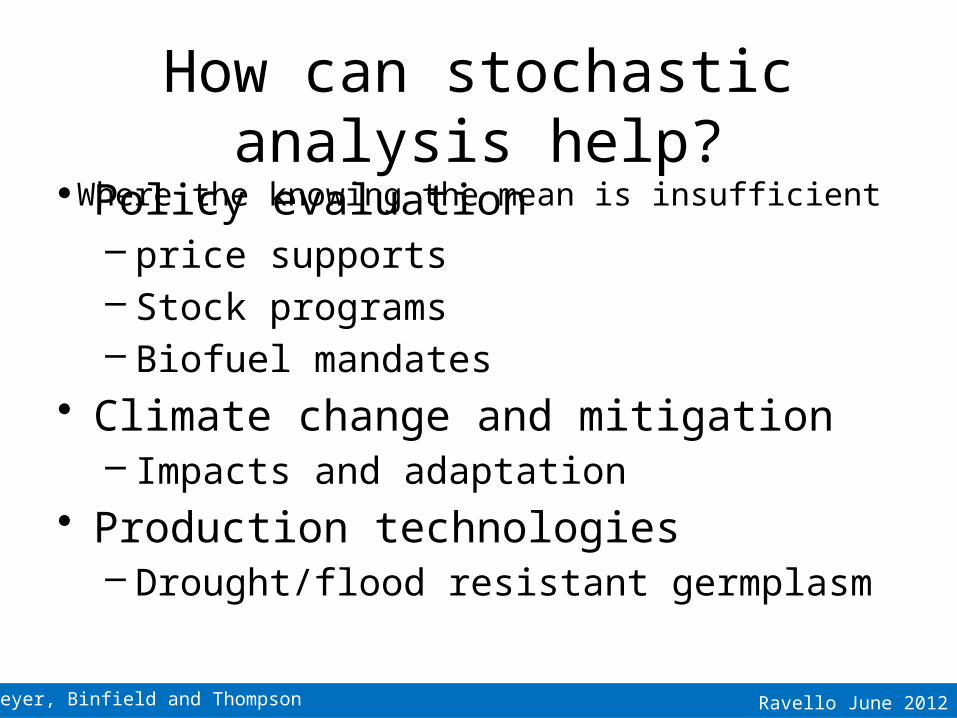
How can stochastic analysis help?Where the knowing the mean is insufficient
• Policy evaluation– price supports– Stock programs– Biofuel mandates
• Climate change and mitigation– Impacts and adaptation
• Production technologies– Drought/flood resistant germplasm
Ravello June 2012Meyer, Binfield and Thompson
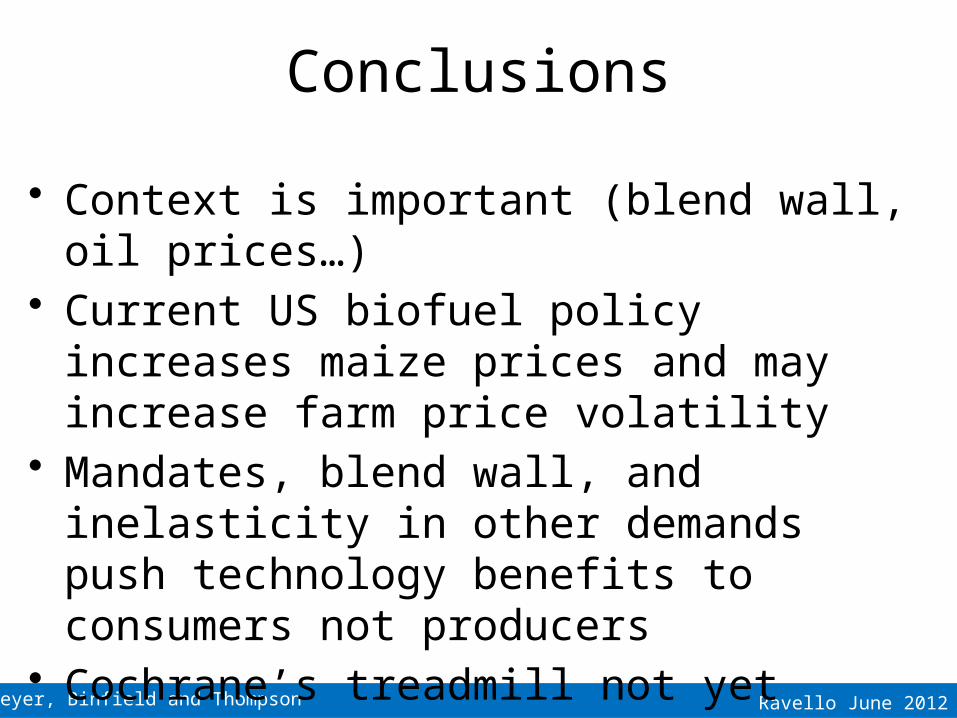
Conclusions
• Context is important (blend wall, oil prices…)• Current US biofuel policy increases maize
prices and may increase farm price volatility• Mandates, blend wall, and inelasticity in other
demands push technology benefits to consumers not producers
• Cochrane’s treadmill not yet stopped?
Ravello June 2012Meyer, Binfield and Thompson
Chart ideas
• Capacity and Capacity Utilization• Maize ethanol net returns. • E85 and E15 use