Embed Size (px)
Citation preview

RAYA HOLDING (RAYA.CA)
Earnings Release: YE2017
1
487.4
623.7
893.5
1,202.3
YE2014
YE2015
YE2016
YE2017
Gross Profit
205.7
235.2
450.3
566.2
YE2014
YE2015
YE2016
YE2017
EBITDA
47.7
101.1
112.8
50.0
YE2014
YE2015
YE2016
YE2017
Net Income
RAYA HOLDING YE2017 Results
Cairo, Egypt March 29th, 2018: Raya Holding (RAYA.CA on the Egyptian Stock Exchange), is an investment conglomerate managing a diversified investment portfolio, announces its consolidated results for YE2017; reporting total consolidated revenues of EGP 6,745.4 million with 18.4% increase over YE2016, gross profit of EGP 1,202.3 million with 34.6% increase over YE2016, EBITDA of EGP 566.2 million with 25.7% increase over YE2016 and net income after tax and minority interest of EGP 50.0 million with 55.6% decrease over YE2016.
YE2017 VS. YE2016
Gross Profit
EGP 1,202.3 M
EBITDA
EGP 566.2 M
Net Income
EGP 50.0 M
4,069.3
4,486.9
5,699.1
6,745.4
YE2014
YE2015
YE2016
YE2017
Revenue
Margin 8.4%
Margin 0.7%
Margin 17.8%
EGP 6,745.4 M
MMmmnMM
RAYA HOLDING (RAYA.CA)
Earnings Release: YE2017
2
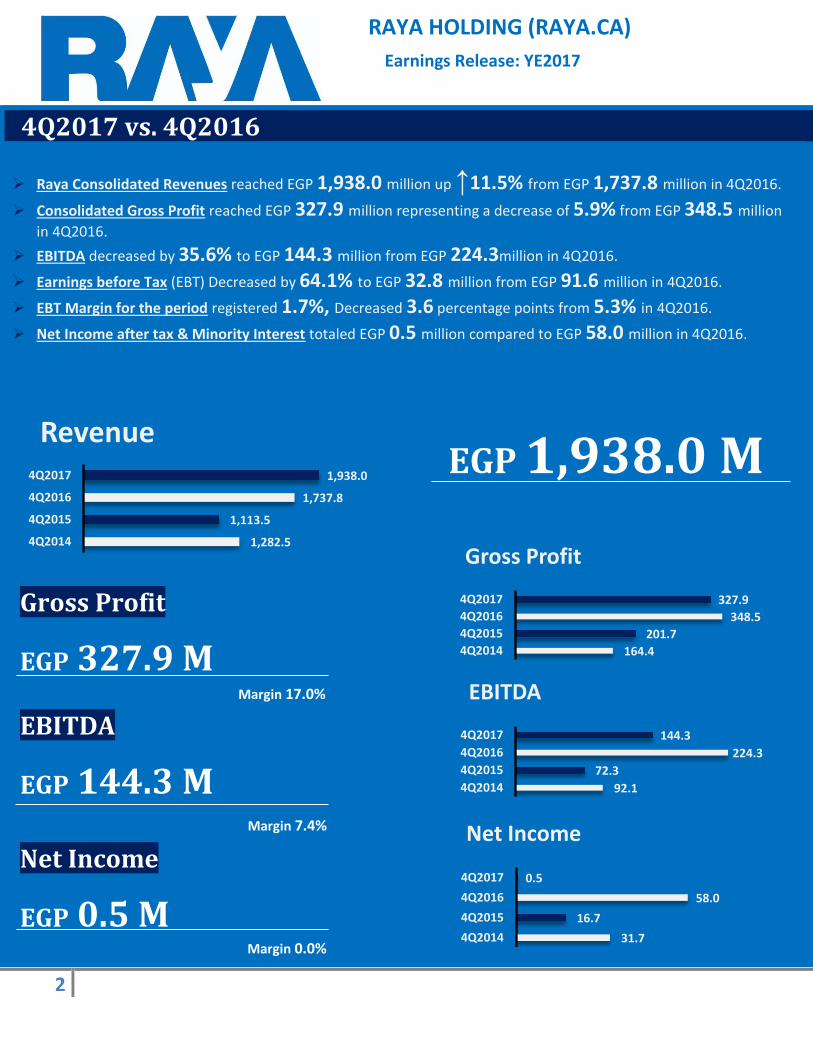
4Q2017 vs. 4Q2016
Raya Consolidated Revenues reached EGP 1,938.0 million up ↑11.5% from EGP 1,737.8 million in 4Q2016.
Consolidated Gross Profit reached EGP 327.9 million representing a decrease of 5.9% from EGP 348.5 million
in 4Q2016.
EBITDA decreased by 35.6% to EGP 144.3 million from EGP 224.3million in 4Q2016.
Earnings before Tax (EBT) Decreased by 64.1% to EGP 32.8 million from EGP 91.6 million in 4Q2016.
EBT Margin for the period registered 1.7%, Decreased 3.6 percentage points from 5.3% in 4Q2016.
Net Income after tax & Minority Interest totaled EGP 0.5 million compared to EGP 58.0 million in 4Q2016.
1,282.5
1,113.5
1,737.8
1,938.0
4Q2014
4Q2015
4Q2016
4Q2017
Revenue
31.7
16.7
58.0
0.5
4Q2014
4Q2015
4Q2016
4Q2017
Net IncomeNet Income
EGP 0.5 M
92.1
72.3
224.3
144.3
4Q2014
4Q2015
4Q2016
4Q2017
EBITDA
Margin 7.4%
164.4
201.7
348.5
327.9
4Q2014
4Q2015
4Q2016
4Q2017
Gross Profit
EGP 1,938.0 M
Gross Profit
EGP 327.9 M
EBITDA
EGP 144.3 M Margin 13.6%
Margin 17.0%
Margin 0.0%

RAYA HOLDING (RAYA.CA)
Earnings Release: YE2017
3
69.5%14.3%
0.3
%
Trade
IT
Contact Center
Smart Buildings
InternationalServices
Ostool
Data Center
BariQ
Restaurants
Manufacturing & Export LOB
Revenue: 227.4M
Gross Profit: 35.1M
Gross Margin: 15.4%
Business Highlights
YE2017 VS. YE2016
Trade LOB
Revenue: 3,781.2M
Gross Profit: 511.3M
Gross Margin: 13.5%
4.5%
2.9% 21.9%
Information Technology LOB
Revenue: 1,329.7M
Gross Profit: 175.9M
Gross Margin: 13.2%
63.2%
1.3% 48.8%
Contact Center LOB
Revenue: 756.2M
Gross Profit: 325.3M
Gross Margin: 43%
52.8%
7.6% 29.9%
Smart Buildings LOB
Revenue: 57.2M
Gross Profit: (12.3M)
Gross Margin: N/A
92.2%
37.0%
International Services LOB
Revenue: 70.1M
Gross Profit: 22.8M
Gross Margin: 32.6%
13.7%
14.7% 107.5%
Data Center LOB
Revenue: 37.3M
Gross Profit: 15.1M
Gross Margin: 40.6%
41.2%
10.6% 11.9%
Ostool
Revenue: 380.6M
Gross Profit: 75.1M
Gross Margin: 19.7%
85.4%
4.8% 49.2%
Bariq
Revenue: 162.4M
Gross Profit: 42.0M
Gross Margin: 25.9%
41.5%
14.2% 8.6%
Restaurants LOB
Revenue: 40.7M
Gross Profit: 11.9M
Gross Margin: 29.4%
120.3%
13.3% 301.5%
Revenue Split YE2016 Revenue Split YE2017
56.1%
19.7%
11.2%
Trade
IT
Contact Center
Smart Buildings
International Services
Ostool
Data Center
BariQ
Restaurants
Manufacturing & Export

RAYA HOLDING (RAYA.CA)
Earnings Release: YE2017
4
Business Highlights 4Q2017 vs. 4Q2016
Information Technology LOB
Revenue: 465.3M
Gross Profit: 53.2M
Gross Margin: 11.4%
105.2%
12.9% 3.9%
Contact Center LOB
Revenue: 201.1M
Gross Profit: 77.4M
Gross Margin: 38.5%
18.3%
17.6% 18.8%
Smart Buildings LOB
Revenue: 17.1M
Gross Loss: (1.2M)
Gross Margin: N/A
72.7%
79.9%
International Services LOB
Revenue: 21.4M
Gross Profit: 5.5M
Gross Margin: 26%
20.9%
17.6% 275.6%
Data Center LOB
Revenue: 8.7M
Gross Profit: 3.1M
Gross Margin: 36.1%
24.7%
12.2
%
6.9%
Revenue Split 4Q2017 Revenue Split 4Q2016
Trade LOB
Revenue: 968.5M
Gross Profit: 146.5M
Gross Margin: 15.1%
20.1%
1.3% 12.6%
50.0%
24.0%
10.4%
Trade
IT
Contact Center
Smart Buildings
International Services
Ostool
Data Center
BariQ
Restaurants
Manufacturing & Export
69.8%13.1%
9.8%
0.4
%
Trade
IT
Contact Center
Smart Buildings
International Services
Ostool
Data Center
BariQ
Restaurants
Restaurants LOB
Revenue: 12.4M
Gross Profit: 0.6M
Gross Margin: 4.9%
91.7%
16% 55.2%
Manufacturing & Export LOB
Revenue: 75.3M
Gross Profit: 12.9M
Gross Margin: 17.1%
Ostool
Revenue: 154.2M
Gross Profit: 16.4M
Gross Margin: 10.6%
175.4%
10.9%
213.5%
Bariq
Revenue: 49.8M
Gross Profit: 13.3M
Gross Margin: 26.8%
34.2%
19.7% 22.7%

RAYA HOLDING (RAYA.CA)
Earnings Release: YE2017
5
Raya's Trade line of
business caters primarily to
the consumer market
through three main
functions; distribution,
retail and maintenance
services for mobile phones,
consumer electronics, and
IT products of various
global brands. Raya Trade
sells directly to the end
consumer through its retail
outlets, distributes through
an extensive network to
wholesalers, and provides
maintenance for mobile
phones and IT products.
Raya is the sole level
3Nokia maintenance in
Egypt servicing 14 countries
in North and East Africa.
3,781.2 3,959.4
511.4 419.6
-
500.0
1,000.0
1,500.0
2,000.0
2,500.0
3,000.0
3,500.0
4,000.0
4,500.0
YE2017 YE2016
Revenue
Gross Profit
968.6
1,212.9
146.5 167.7
-
200.0
400.0
600.0
800.0
1,000.0
1,200.0
1,400.0
4Q2017 4Q2016
Revenue
Gross Profit
43%
6%12%
18%
9%
12% Xerox
Apple
Microsoft
Fujitsu
Canon
Others
Trade Line of Business
EGP million
Raya Trade YE2017 Revenues down by 4.5% from YE2016, and gross profit increased by 21.9% from YE2016. Raya Trade 4Q2017 Revenues down by 20.1% from 4Q2016, and gross profit decreased by 12.6% from 4Q2016.
Handset sales Handset sales decreased by 50% to 1.3M units in 4Q2017 compared to 2.7M units in 4Q2016.
Outlets Numbers of Raya stores increased to reach 50 stores in 4Q2017 compared to 43 stores in 4Q2016.
Mega stores: 12 stores in 4Q2017. Raya Stores: 38 stores in 4Q2017.
Handsets services The number of handsets serviced in 4Q2017 decreased by 13% to 314.6K units compared to 362.5K units in 4Q2016.
IT Product Mix 4Q2017
.

RAYA HOLDING (RAYA.CA)
Earnings Release: YE2017
6
1,329.7
814.7
175.9118.3
-
200.0
400.0
600.0
800.0
1,000.0
1,200.0
1,400.0
YE2017 YE2016
Revenue
Gross ProfitThrough its Information
Technology Line of
Business, Raya provides
businesses with the ideal
mix of technology solutions
to meet the unique
requirements of their
operations, including world-
class technology products,
as well as business solutions
and value-added services.
Raya IT provides services
that fall under three main
categories: Infrastructure,
Business Solutions and
Outsourced Services.
Banking86.3%
Telecommunication1.3%
Commercial1.4%
General Business3.0%
Manufacturing0.0%
Oil & Gas2.3%
Government5.2%
Real Estate0.2%
Other0.3%
Information Technology Line of Business
EGP million
Raya IT YE2017 Revenues increased by 63.2% from YE2016, while gross profit increased by 48.8% from YE2016. Raya IT 4Q2017 Revenues increased by 105.2% from 4Q2016, and gross profit decreased by 3.9% from 4Q2016.
IT Revenue Breakdown – 4Q2017
465.4
226.8
53.2 55.4
-
100.0
200.0
300.0
400.0
500.0
4Q2017 4Q2016
Revenue
Gross Profit

RAYA HOLDING (RAYA.CA)
Earnings Release: YE2017
7
Raya grouped its regional IT
business under Raya
International Services,
serving the regional
markets with a special focus
on Saudi Arabia, Gulf,
Levant, and North Africa
through a resource pool
based in Egypt. Raya
International Services offers
its regional clients an ideal
mix of IT solutions,
including but not limited to
ERP systems, e-government
solutions, software
development services and
technology infrastructure
services. The objective of
this restructuring is to focus
on the promising regional
market, especially Saudi
Arabia which alone
constitutes around 50% of
the whole regional market.
70.1
61.7
22.9
11.0
-
10.0
20.0
30.0
40.0
50.0
60.0
70.0
80.0
YE2017 YE2016
Revenue
Gross Profit
21.4
17.7
5.6
1.5
-
5.0
10.0
15.0
20.0
25.0
4Q2017 4Q2016
Revenue
Gross Profit
International Services
EGP million
Raya International Services YE2017 Revenues up 13.7% from YE2016 and gross profit increased by 107.5% from YE2016.
Raya International Services 4Q2017 Revenues up 20.9% from 4Q2016, and gross profit increased by 275.6% from 4Q2016.
Business on hand: Projects Backlog in 2017 reached USD 2.2 million, while Sales in 4Q2017 reached USD 0.7 million, and Revenue in 4Q2017 reached USD 0.8 million, summing up to Business on Hand of USD 3.4 million.
RAYA HOLDING (RAYA.CA)
Earnings Release: YE2017
8
37.4
26.5
15.2 13.6
-
5.0
10.0
15.0
20.0
25.0
30.0
35.0
40.0
YE2017 YE2016
Revenue
Gross Profit
8.8
7.0
3.2 3.4
-
1.0
2.0
3.0
4.0
5.0
6.0
7.0
8.0
9.0
10.0
4Q2017 4Q2016
Revenue
Gross Profit
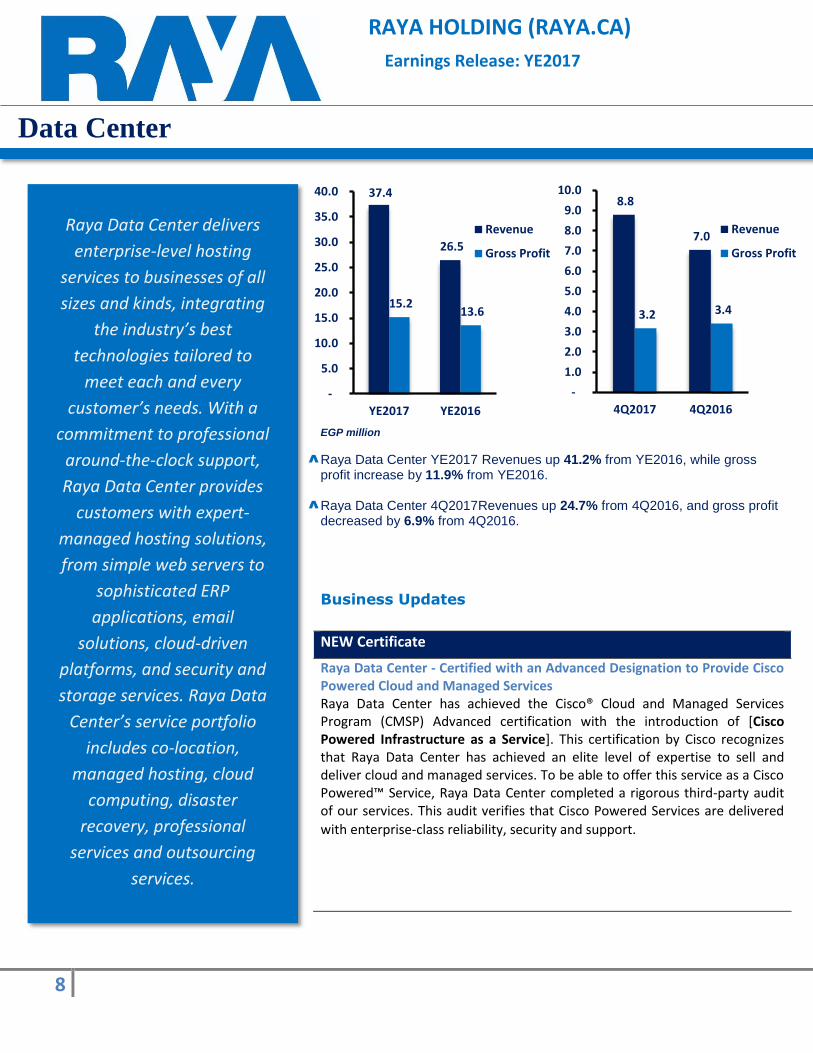
Data Center
EGP million
Raya Data Center YE2017 Revenues up 41.2% from YE2016, while gross profit increase by 11.9% from YE2016. Raya Data Center 4Q2017Revenues up 24.7% from 4Q2016, and gross profit decreased by 6.9% from 4Q2016.
Business Updates
NEW Certificate
Raya Data Center - Certified with an Advanced Designation to Provide Cisco Powered Cloud and Managed Services Raya Data Center has achieved the Cisco® Cloud and Managed Services Program (CMSP) Advanced certification with the introduction of [Cisco Powered Infrastructure as a Service]. This certification by Cisco recognizes that Raya Data Center has achieved an elite level of expertise to sell and deliver cloud and managed services. To be able to offer this service as a Cisco Powered™ Service, Raya Data Center completed a rigorous third-party audit of our services. This audit verifies that Cisco Powered Services are delivered
with enterprise-class reliability, security and support.
Raya Data Center delivers
enterprise-level hosting
services to businesses of all
sizes and kinds, integrating
the industry’s best
technologies tailored to
meet each and every
customer’s needs. With a
commitment to professional
around-the-clock support,
Raya Data Center provides
customers with expert-
managed hosting solutions,
from simple web servers to
sophisticated ERP
applications, email
solutions, cloud-driven
platforms, and security and
storage services. Raya Data
Center’s service portfolio
includes co-location,
managed hosting, cloud
computing, disaster
recovery, professional
services and outsourcing
services.

RAYA HOLDING (RAYA.CA)
Earnings Release: YE2017
9
Raya Contact Center offers
call center services, inside
sales services, as well as
back office BPO services.
Raya Contact Center is
known for its wide coverage
through serving over 50+
countries such as Egypt,
North America and EMEA in
10 different languages
(English, French, German,
Arabic, Spanish Italian,
Dutch, Russian, Ukrainian
and Turkish).
756.3
495.0
325.4
250.4
-
100.0
200.0
300.0
400.0
500.0
600.0
700.0
800.0
YE2017 YE2016
Revenue
Gross Profit
201.1
170.0
77.5 95.5
-
50.0
100.0
150.0
200.0
250.0
4Q2017 4Q2016
Revenue
Gross Profit
77%
23% Offshore Revenue
Local Revenue
Call Center Line of Business
EGP million
Raya Call Centers YE2017 Revenues up 52.8% from YE2016, and gross profit increased by 29.9% from YE2016.
Raya Call Centers 4Q2017 Revenues up 18.3% from 4Q2016, and gross
profit decreased by 18.8% from 4Q2016.
Call Center Revenue mix
Call Center revenue mix in YE2017 represented 23% local revenues and 77% offshore revenues.

RAYA HOLDING (RAYA.CA)
Earnings Release: YE2017
10
57.2
29.8
(12.4)(19.6)
(30.0)
(20.0)
(10.0)
-
10.0
20.0
30.0
40.0
50.0
60.0
70.0
YE2017 YE2016
Revenue
Gross Profit
17.1
9.9
(1.3)
(6.4) (10.0)
(5.0)
-
5.0
10.0
15.0
20.0
4Q2017 4Q2016
Revenue
Gross Profit
Smart Building Line of Business
EGP million
Raya Smart Buildings YE2017 Revenues up 92.2% from YE2016, while gross profit increased by 37% from YE2016. Raya Smart Buildings 4Q2017 Revenues up 72.7% from 4Q2016 while gross profit increased by 79.9% from 4Q2016.
Raya Holding expanded its
investments into the smart
buildings development
market through the
establishment of Raya
Smart Buildings line of
business. The new Line of
Business' strategy is to
develop green & smart
office/commercial building
complexes, leveraging on
Raya's comprehensive and
well-grounded expertise in
IT and infrastructure
industry and following LEED
(Leadership in Energy and
Environment Design)
international green building
certification for energy
savings, water efficiency,
CO2 emissions reduction,
and indoor environmental
quality developed by the
U.S. Green Building Council
(USGBC).

RAYA HOLDING (RAYA.CA)
Earnings Release: YE2017
11
Founded in 2010, Ostool is
well positioned to provide
the most professional and
the largest Land trucking
fleet in Egypt. Ostool has
built an effective system of
transportation logistics and
management. Using
innovative technology,
Ostool could improve the
response time and
coordination of services.
Whether through our safety
standards or impeccable
Fleet maintenance
program, Ostool’s services
aim to provide Consistency
and Reliability
380.7
205.3
75.2 50.4
-
50.0
100.0
150.0
200.0
250.0
300.0
350.0
400.0
YE2017 YE2016
Revenue
Gross Profit
154.2
56.0
16.4 12.0
-
20.0
40.0
60.0
80.0
100.0
120.0
140.0
160.0
180.0
4Q2017 4Q2016
Revenue
Gross Profit
Ostool Line of Business
EGP million
Ostool YE2017 Revenues up 85.4% from YE2016 and gross profit increased by 49.2% from YE2016.
Ostool 4Q2017 Revenues up 175.4% from 4Q2016, and gross profit increased by 36.3% from 4Q2016.
Ostool’s fleet contains 235 trucks by 4Q 2017

RAYA HOLDING (RAYA.CA)
Earnings Release: YE2017
12
Marking the production of post-
consumer recycled polyethylene
terephthalate (PCR PET) pellets
on the Egyptian and the regional
map, Bariq is the first “bottle-to-
bottle” manufacturer in Egypt,
Africa and the Middle East
region, reprocessing post-
consumer bottles into food-
grade PET pellets. Bariq’s pellets
are proudly approved by the U.S.
Food and Drug Administration
(FDA), the European Food Safety
Authority (EFSA) and the
Canadian Health and Safety
Authority. Backed by world-class
technology providers for the
reprocessing market, Bariq
provides high-quality pellets to
major international bottle and
food container producers in
Europe and the United States, as
well as major fiber producers of
100% recycled materials in
Ireland.
49.8
37.1
13.4 17.3
-
10.0
20.0
30.0
40.0
50.0
60.0
4Q2017 4Q2016
Revenue
Gross Profit
162.5
114.8
42.0 46.0
-
20.0
40.0
60.0
80.0
100.0
120.0
140.0
160.0
180.0
YE2017 YE2016
Revenue
Gross Profit
BariQ
EGP million
Bariq YE2017 Revenues up 41.5% from YE2016 and gross profit decreased by 8.6% from YE2016.
Bariq 4Q2017 Revenues up 34.2% from 4Q2016, and gross profit decreased by 22.7% from 4Q2016.

RAYA HOLDING (RAYA.CA)
Earnings Release: YE2017
13
Raya Restaurants was
established in September
2013 with the vision to
build internationally
competitive restaurants
that will be franchised
throughout the MENA
Region, Europe, and the US.
Raya Restaurants aims to
establish itself as the
market leader within the
restaurant sector in Cairo
by offering new restaurant
concepts and maintaining
consistency in the
impeccable service and
superior food products that
it will offer to its diners
Korba Zamalek Heliopolis Mohandessen
Maadi Fifth Settlement Sheikh Zayed (Galleria 40)
40.7
18.5
12.0
3.0
-
5.0
10.0
15.0
20.0
25.0
30.0
35.0
40.0
45.0
YE2017 YE2016
Revenue
Gross Profit
12.4
6.5
0.6 1.4
-
2.0
4.0
6.0
8.0
10.0
12.0
14.0
4Q2017 4Q2016
Revenue
Gross Profit
Sheikh Zayed
(Galleria 40)
Restaurants Line of Business
EGP million
Raya Restaurants YE2017 Revenues up 120.3% from YE2016 and gross profit increased by 301.5% from YE2016.
Raya Restaurants 4Q2017 Revenues up 91.7% from 4Q2016, and gross profit decreased by 16% from 4Q2016.
RAYA HOLDING (RAYA.CA)
Earnings Release: YE2017
14
Raya Holding Investments
Smart Village Raya owns 3.4% from Smart Village co
AAA Raya owns 20% from Allied Arab Assurance Brokerage S.A.E.
Manufacturing & Export Raya owns 100% of Manufacturing & Export LOB.

RAYA HOLDING (RAYA.CA)
Earnings Release: YE2017
15
Revenue up 18.4% The group's consolidated revenues amounted to EGP 6,745.4 million, an 18.4% increase over those of YE2016. Gross profit increased by 34.6% to EGP 1,202.3 million from EGP 893.5 million in comparable period of 2016. Gross profit margin recorded 17.8%, an increase of 2.1 percentage points over YE2016.
SG&A up 38.2% Selling, General & Administrative expenses increased by 38.2% to EGP 734.6 million from EGP 531.3 million in YE2016. Our SG&A to Revenue recorded 10.8% in YE2017. EBITDA up 25.7% EBITDA increased to EGP 566.1 million compared to EGP 450.3 million in YEQ2016, an increase of 25.7% while EBITDA margin recorded 8.4%. Net Finance cost up 78.3% Financial cost recorded EGP 293.7 million, up from EGP 164.6 million in YE2016. Group Net income down 55.6% Earnings after tax and minority interest amounted to EGP 50.0 million compared to EGP 112.8 million in YE2016. Inventory up 40% The inventory increased to reach EGP 971.1 million in YE2017 vs. EGP 693.4 million an increase of 40% compared to YE2016. Cash on hand and at Banks up 40.1% Cash on hand increased by 40.1% in YE2017 to reach EGP 353.5 million vs. EGP 252.2 million in YE2016. Credit Facilities up 47.3% Credit Facilities increased by 47.3% in YE2017 to reach EGP 1,411.4 million from EGP 958.1 million in YE2016. Long Term loans down 11.9% Long terms loans decreased by 11.9% to EGP 249.8 million in YE2016 from EGP 283.6 million in YE2016.
Financial Position

RAYA HOLDING (RAYA.CA)
Earnings Release: YE2017
16
Financial Statements: Income Statement
EGP 000s YE2017 YE2016 4Q2017 4Q2016
Trade Revenues 3,781,217 3,959,405 968,590 1,212,947
IT Revenues 1,329,727 814,741 465,363 226,830
Contact Center Revenues 756,280 495,021 201,144 170,036
Smart Buildings Revenues 57,238 29,786 17,089 9,897
International Services Revenues 70,111 61,686 21,446 17,744
Ostool Revenues 380,692 205,347 154,200 55,990
Data Center Revenues 37,374 26,466 8,785 7,047
Industrial Sector Revenues 162,458 114,791 49,833 37,124
Restaurants Sector Revenues 40,737 18,488 12,444 6,492
Manufacturing & Export Revenues 227,447 - 75,391 -
Others 3,462 2,103 244 935
Intercompany Sales (101,340) (28,672) (36,515) (7,172)
Total Revenue 6,745,403 5,699,162 1,938,014 1,737,870
COGS (5,543,055) (4,805,611) (1,610,083) (1,389,308)
Gross Profit 1,202,348 893,551 327,931 348,562
Gross Profit Margin 17.8% 15.7% 16.9% 20.1%
SG&A (734,687) (531,355) (209,260) (150,263)
EBITDA 566,172 450,301 144,291 224,326
EBITDA Margin 8.4% 7.9% 7.4% 12.9%
Provisions (5,677) (27,501) 2,360 (17,783)
Operating Income 461,985 334,607 121,031 180,428
Net Finance Cost (293,777) (164,683) (91,316) (57,025)
Forex 3,975 3,681 106 (23,697)
Investment and Other Non
Operating Income9,421 23,618 3,012 (8,011)
EBT 181,604 197,223 32,832 91,695
EBT Margin 2.7% 3.5% 1.7% 5.3%
Income Tax (78,380) (79,119) (17,477) (37,965)
Net Income Before Minority 103,224 118,104 15,355 53,729
Minority Interest (53,190) (5,278) (14,878) 4,275
Net Income After Minority 50,035 112,826 477 58,004
Net Income After Minority Margin 0.7% 2.0% 0.02% 3.3%

RAYA HOLDING (RAYA.CA)
Earnings Release: YE2017
17
Financial Statements: Balance Sheet
31-Dec-17 31-Dec-16EGP EGP
Non-Current AssetsFixed Assets 641,172,199 454,602,107 Investments Properties 660,607,312 633,786,684 Projects Under Construction 152,036,852 44,947,041 Intangible Assets 23,783,208 20,841,524 Goodwill 82,078,561 58,950,939 Investments in Associates 46,999,552 42,767,920 Available for Sale Investments 19,605,387 18,605,487 Deffered Income Tax 10,807,339 12,536,943 Total Non-Current Assets 1,637,090,410 1,287,038,645
Current AssetsInventory 971,122,389 693,474,362 Work in Progress 94,266,945 75,700,828 Accounts And Notes Recievable 1,156,211,087 928,442,113 Prepayments And Other Debit Balances 850,587,917 505,215,721 Share Based Compensation 720,000 161,544 Cash on Hand and at Banks 353,557,280 252,252,234 Total Current Assets 3,426,465,618 2,455,246,802 Total Assets 5,063,556,028 3,742,285,447
EquityPaid- in Capital 504,624,835 504,624,835 Legal Reserve 34,203,775 30,657,350 General reserve 41,935,960 41,935,960 Treasury Shares (1,155,316) (1,875,316) Net profit from the sale of Raya Contact center shares 380,346,421 - Foreign Currency Translation Adjustments 5,816,474 (13,920,868) Financial investment valuation reserve available for sale 774,923 - Retained Earnings 250,600,906 169,855,382 Profits for the year after deducting minority interest 50,034,720 112,825,642 Total owners' Equity of Holding Company 1,267,182,698 844,102,985 Minority Interests 201,539,656 18,941,615 Total Equity 1,468,722,354 863,044,600
Non-Current LiabilitiesNotes Payable - Long Term 46,597,827 54,189,198 Long Term Loans 249,895,858 283,678,687 Long Term Liabilities 55,367,042 40,861,611 Total Non-current Liabilities 351,860,727 378,729,496
Current LiabilitiesProvisions 33,424,331 23,183,977 Accounts And Notes Payable 922,203,189 849,282,063 Long Term Loans - Current Portion 150,270,296 112,870,133 Credit Facilities 1,411,455,760 958,186,301 Tax Payable 10,356,261 30,919,722 Accrued Expenses and other Credit Balances 710,978,444 522,001,075 Dividends Payable 4,284,666 4,068,080 Total Current Liabilities 3,242,972,947 2,500,511,351 Total Liabilities 3,594,833,674 2,879,240,847 Total Equity & Liabilities 5,063,556,028 3,742,285,447

RAYA HOLDING (RAYA.CA)
Earnings Release: YE2017
18
DISCLAIMER
This release may contain forward looking statements that constitutes Raya’s beliefs and
expectations about future performance. Except for historical information, any forward
looking statement based on current expectations, assumptions and projections about
future events are subject to certain economic and market risks and uncertainties that
could turn out actual results to differ materially or may not occur.
About RAYA
Headquartered in Cairo, Egypt, yet unrepressed to cover operations in all continents, Raya
Holding is an auspicious investment conglomerate managing a diversified investment
portfolio. As the parent company for ten up-and-coming lines of business, Raya Holding
operates in the fields of information technology, data center outsourcing, contact center,
smart buildings, consumer electronics, social media development, food and beverage, land
transport and PET remanufacturing. Raya, with a group of employees of around 11,426
professionals, provides technological solutions and world-class value-added services.
Listing
• Raya Holding is listed in Egypt Stock Exchange (EGX). RIC: RAYA.CA
Capital Structure
• Authorized Capital: EGP 1,000,000,000
• Issued & Paid-in Capital: EGP 504,624,835 (100,924,967 shares @ EGP 5 per share)
Investor Relations Contacts
Mohamed Sherif Gomaa
Manager
Investments & Investor Relations
Ahmed Yousry Zayed
Analyst
Investments & Investor Relations
Contact Details: Tel : + (202) 38276000
Fax : + (202) 38276001 Email : [email protected]