Embed Size (px)
Citation preview
R AY M O N D D E O L I V E I R A ; A N D Y Z H A N G ; F R A N C E S C A A U D I A
Improving Climate Change Policy

I N D I C ATO R S
E M I S S I O N S S C E N A R I O
C L I M AT E M O D E L
E C O N O M I C C O S T S
C O S T U N C E R TA I N T I E S
Climate Change Science
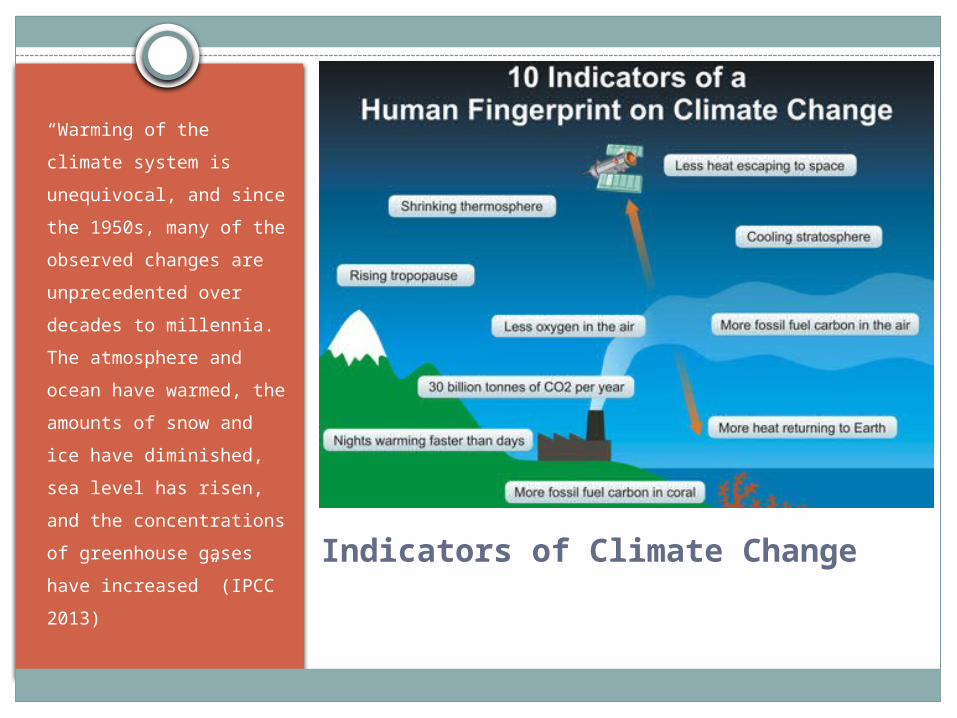
Indicators of Climate Change
“Warming of the climate
system is unequivocal,
and since the 1950s,
many of the observed
changes are
unprecedented over
decades to millennia. The
atmosphere and ocean
have warmed, the
amounts of snow and ice
have diminished, sea
level has risen, and the
concentrations of
greenhouse gases have
increased” (IPCC 2013)
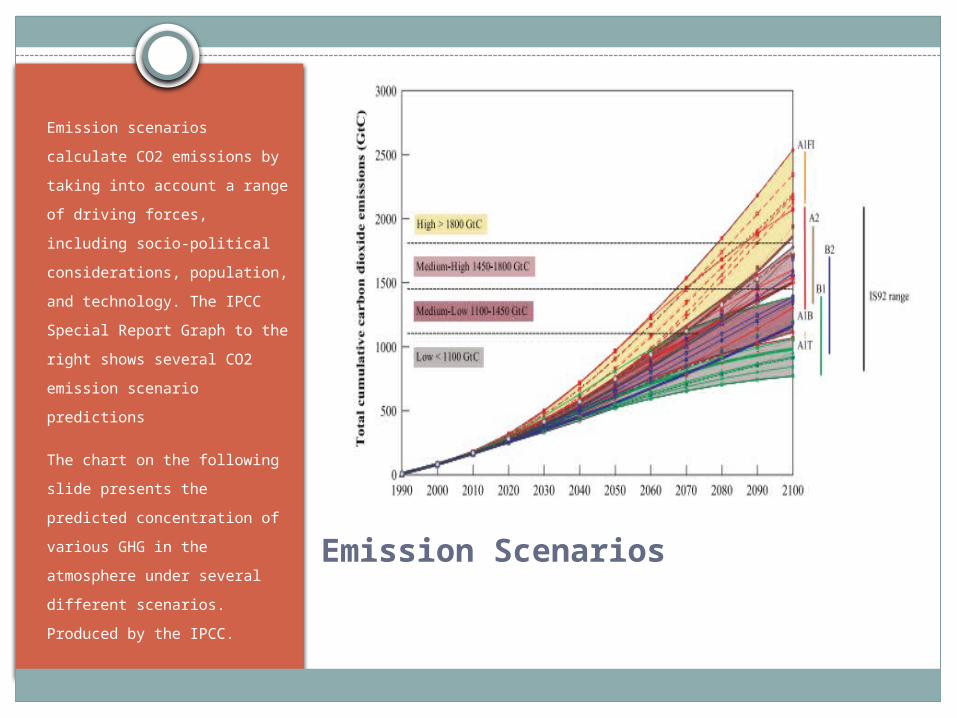
Emission Scenarios
Emission scenarios calculate
CO2 emissions by taking into
account a range of driving
forces, including socio-political
considerations, population,
and technology. The IPCC
Special Report Graph to the
right shows several CO2
emission scenario predictions
The chart on the following
slide presents the predicted
concentration of various GHG
in the atmosphere under
several different scenarios.
Produced by the IPCC.


Climate Model
Calculates atmospheric greenhouse gas
concentrations from emission scenarios
Calculates radiative forcing from
concentrations
Calculates global temperature increase from
radiative forcing

Radiative Forcing
Radiative Forcing (RF)
describes the change in
energy fluxes for one
date relative to a pre-
Industrial date. A
positive RF leads to
surface warming, while
a negative RF leads to
surface cooling.
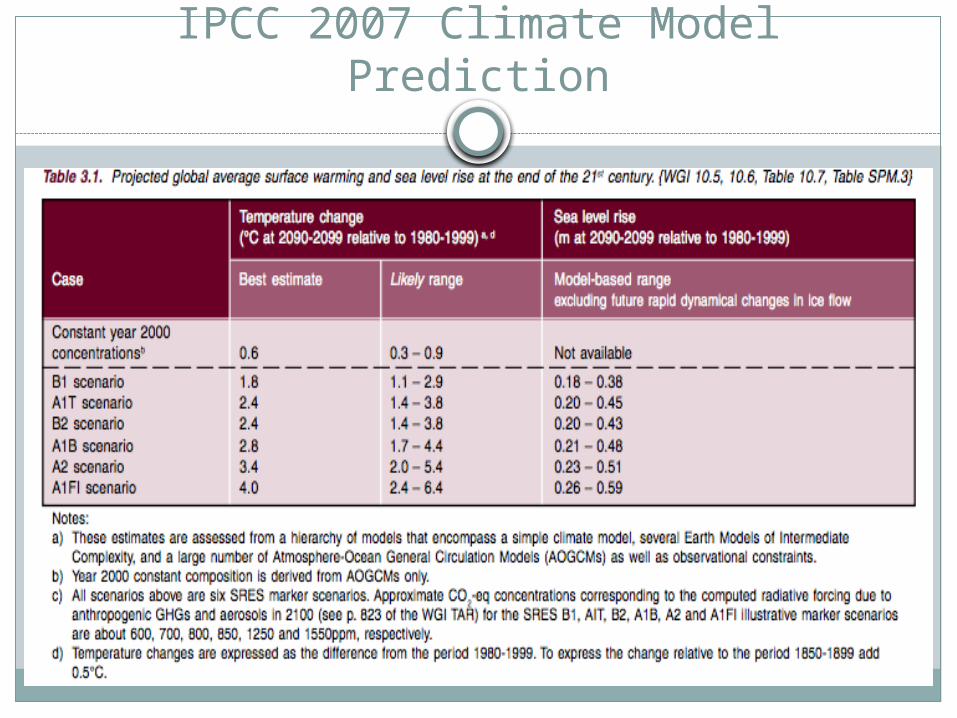
IPCC 2007 Climate Model Prediction

IPCC 2007 Prediction of Climate Change Impacts on Disasters
Key Economic Costs
Uneven impact across geography and demographics
Costs in billions seen in all economic sectors Agriculture – pests, aquifers, droughts and floods
Energy – heating demand increases
Industrial – water and energy price increases
Public and private capital will depreciate from more extreme
disasters
Higher public infrastructure maintenance costs
Lower job security
Cost-Analysis Uncertainty
Lack of quantitative studies for indirect and induced
climate change impacts
Climate Model ambiguity leads to ambiguous
marginal analysis
Uncertain of how high temperatures will rise given an
emissions scenario
Even with current error margins, economic cost of climate
change is likely understated
C O S T A N A LY S I S B I A S
K Y O TO P R O TO C O L
C D M
S C M
J C M
Political Failures
Cost Analysis Bias
Ambiguous abatement benefits leads to
policymakers only accepting monetary cost analysis
Much less consideration for threats such as increased
infections due to ambiguous monetary quantification
Some nations (e.g. U.S. and China) better off than
others (higher infrastructural resilience) from climate
change
U.S. Rejects Kyoto Protocol
The perceived monetized cost vastly dwarfed the perceived monetized benefits for
the U.S.
Even if all parties complied, U.S. perceived itself losing
Therefore, complying to ensure everyone else complied was also not justified in the
U.S. domestic sphere
No Prisoners’ Dilemma, best scenario for binding international agreements
Senate Resolution 98: U.S. will not commit unless developing nations also commit to
abatement within the same time frame, or unless commitment did not weaken
competitiveness
But promoting industrial policy (e.g. production subsidy) is more effective in
increasing competitiveness than weakening environmental policy
Ineffective 1997 Goals
Goals for specific nations were set with recent ‘90s one-off abatements in mind
Germany committed to 8% below 1990 levels by 2012, but was already 10% below at time of
treaty due to reunification
Russia set to 1990 levels by 2012, but was already 30% below due to recent collapse
U.K. subsidized natural gas by 1997, leading to already 5% out of 8% reduction goal while
producing more unregulated methane.
U.S. had no recent one-offs, so a comparable 8% goal would have required
more effort than required of the other nations
Fewer one-off opportunities in the future necessitates higher abatement costs
for all countries

Clean Development Mechanism (CDM)
Kyoto Treaty: committed developed countries can meet their abatement goals by reducing emissions in developing countries through sustainable development projects
Project judged by host country to be sustainable or not Inefficient and rhetorical; less than 1% of projects contribute significantly to
sustainable development Some host countries biased towards national economic welfare (e.g. China)
Most ventures favor pure carbon abatement and sidelines local sustainability South African landfill kept open to generate methane for electricity
generation at the expense of locals’ health & environment (Boyd et. Al. 2009).
Majority of projects centered on countries with low abatement costs (e.g. China) Africa and Middle East receive much less (Boyd et. Al. 2009).
CDM Projects last 5 – 7 years, not long enough to incentivize large infrastructural change (e.g. renewable energy grids)
Post-2012 CDM
Needs to provide long-term stable and transparent market for
investors
Simplify and standardize procedure to reduce transaction costs
and improve transparency for stakeholders
Expand project scale to incentivize both smaller and larger,
sectoral-level projects
Learn from Voluntary Carbon Markets (e.g. Climate Action
Reserve in North America), a source of CDM-related innovation (
Guigon 2010)

EU SCM Alternative
EU proposes new Sectoral Crediting Mechanism (SCM) to
replace CDM
Focuses on sectoral-scale projects
Credits not given to private companies but to governments
(Stoft 2009)
Under UNFCC instead of Kyoto Protocol
Will give CDM more freedom to meet sustainability and abatement
goals through not requiring strict national emission targets

JCM Alternative
Japan replaces CDM with Joint Crediting Mechanism
(JCM) alternative
A national level policy; Japan works with participating
developing countries
More decentralized, broader project coverage, more
empirical validation/verification
Quality of abatement per credit not regulated by UNFCC
G R E E N H O U S E G A S E X T E R N A L I T Y
T R A G E D Y O F T H E G L O B A L C O M M O N S
T H E F R E E - R I D E R I S S U E
I N T E R - T E M P O R A L D E C I S I O N M A K I N G
T E C H N O L O G I C A L G R O W T H T H E O RY
Market Failures

The Greenhouse Gas Externality
Firms consider only direct costs and profit
Indirect pollution costs not paid by producer or consumer
Typical Externalities:
Quality of life
Higher health care costs
Forgone economic opportunities (e.g. tourism)
Climate Change has been an externality
More extreme disasters
Water scarcity
Labor insecurity
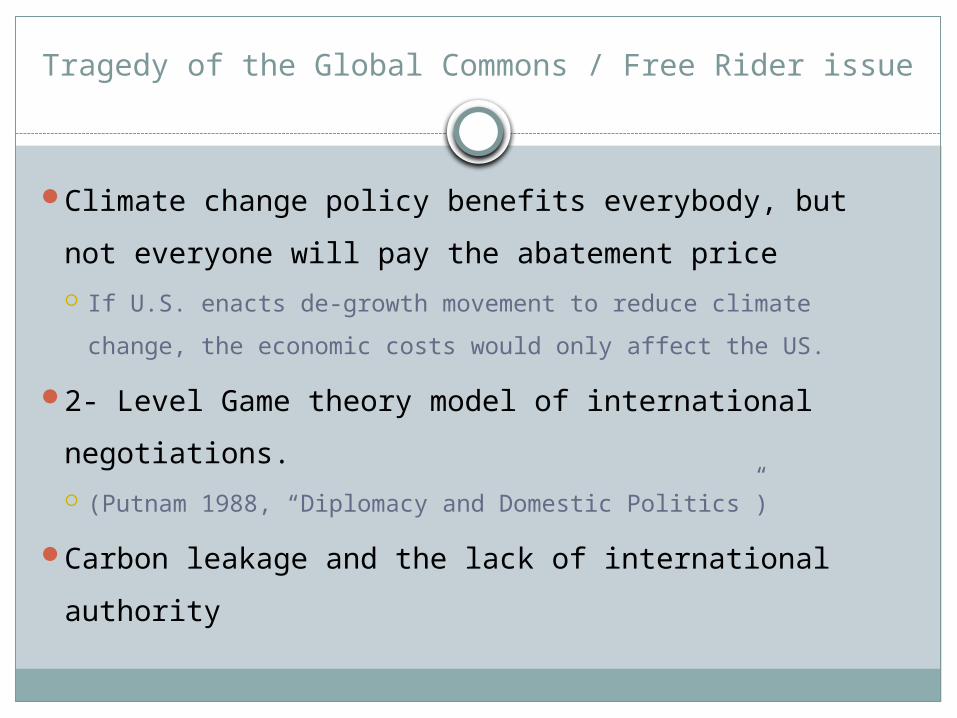
Tragedy of the Global Commons / Free Rider issue
Climate change policy benefits everybody, but not
everyone will pay the abatement price
If U.S. enacts de-growth movement to reduce climate change, the
economic costs would only affect the US.
2- Level Game theory model of international
negotiations.
(Putnam 1988, “Diplomacy and Domestic Politics”)
Carbon leakage and the lack of international authority
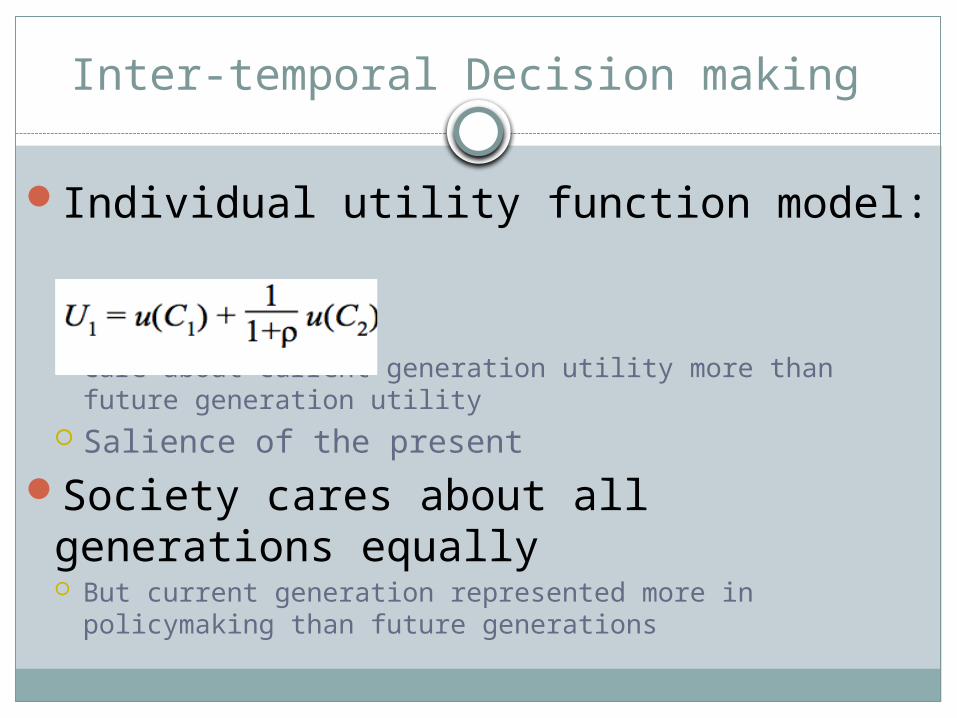
Inter-temporal Decision making
Individual utility function model:
Care about current generation utility more than future generation utility Salience of the present
Society cares about all generations equally But current generation represented more in policymaking than future
generations
M A R G I N A L A N A LY S I S M O D E L
C A P A N D T R A D E
C A R B O N TA X
R E S E A R C H TA X I N C E N T I V E S
Policy Options
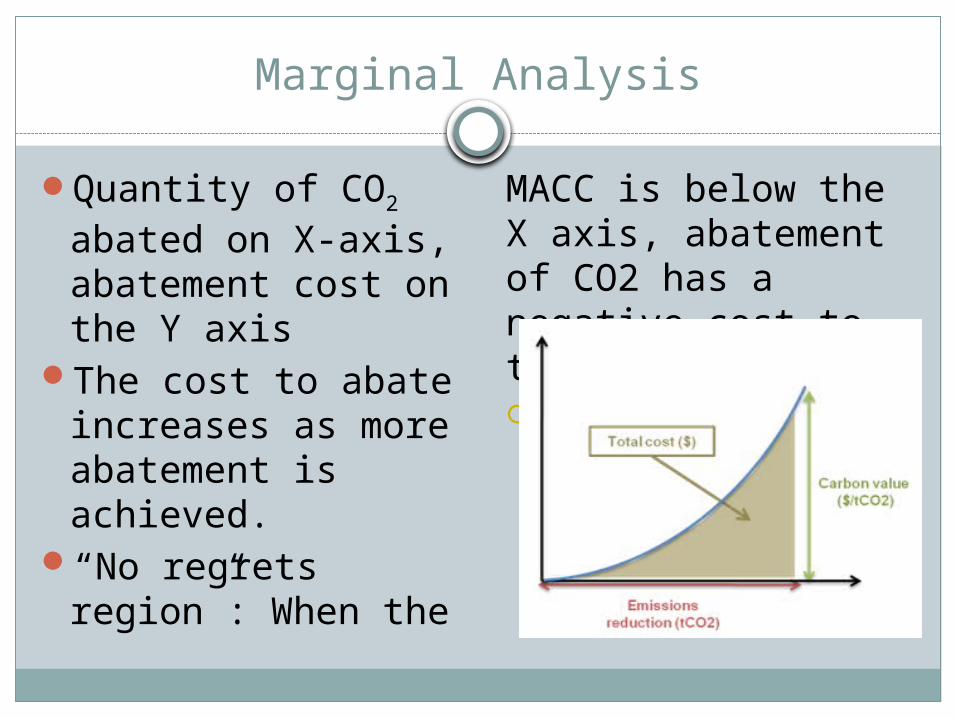
Marginal Analysis
Quantity of CO2 abated on X-axis, abatement cost on the Y axis
The cost to abate increases as more abatement is achieved.
“No regrets region”: When the MACC is below the X axis, abatement of CO2 has a
negative cost to the economy. Building Industry

Marginal Analysis cont.
Optimal abatement quantity represented by the intersection of cost and benefit curve
Differing calculations for MACC depending on climate and economic sensitivity to carbon abatement and different MACC measurement
methods Simplified model frames
climate change policy analysis

Cap and Trade
A limit on emissions is set by a governmental authority
companies are free to trade the unused portion of their limits
Increases emission price
Problems:
1. Shifts right, along the MACC curve. Not socially optimum
2. Effectiveness debated. Emissions grew in EU despite ETS
3. Higher energy cost; increased cost of living
4. Affects export competitiveness
5. Bigger companies can emit more; centralizes emissions
Carbon Tax
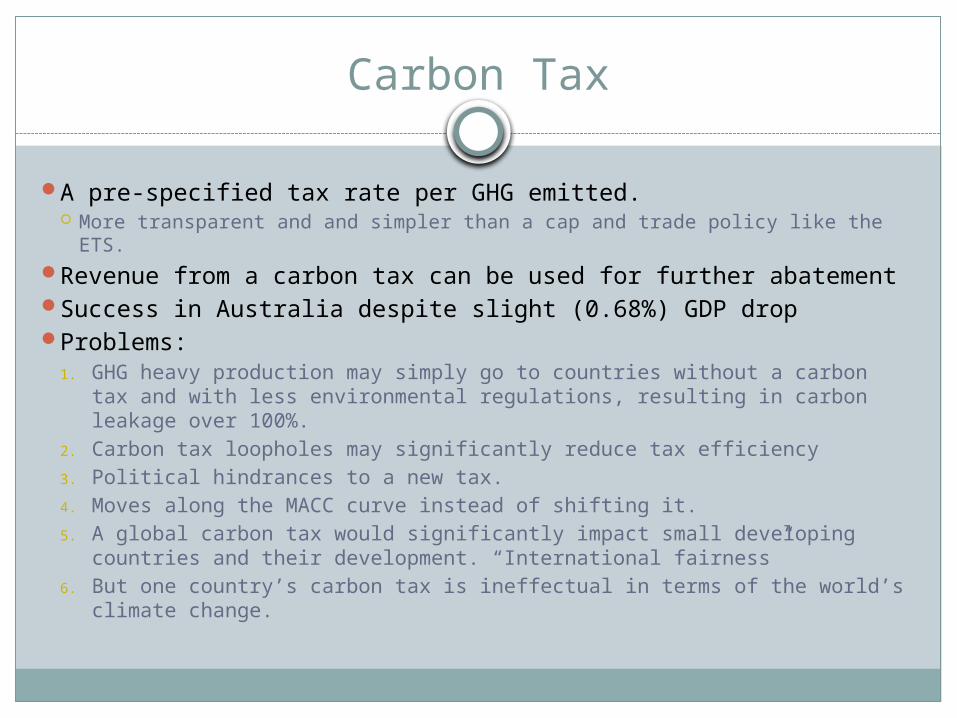
A pre-specified tax rate per GHG emitted. More transparent and and simpler than a cap and trade policy like the ETS.
Revenue from a carbon tax can be used for further abatement Success in Australia despite slight (0.68%) GDP drop Problems:
1. GHG heavy production may simply go to countries without a carbon tax and with less environmental regulations, resulting in carbon leakage over 100%.
2. Carbon tax loopholes may significantly reduce tax efficiency
3. Political hindrances to a new tax.
4. Moves along the MACC curve instead of shifting it.
5. A global carbon tax would significantly impact small developing countries and their development. “International fairness”
6. But one country’s carbon tax is ineffectual in terms of the world’s climate change.

Tax Incentives for Green R&D and innovation
Market amount of R&D implemented is less than socially desirable Market-level R&D is costly, difficult to appropriate, and may spill over to other firms,
countries, and individuals.
The US currently has tax credits for R&D in general, but not for green technology research Tax credits less risky (for firms) than tax reductions on clean tech production; research
may fail but loss taken by government if using tax credits.
South Korea: provides tax credit of 20 percent (30 percent for small and medium-sized companies) for R&D activities in four key areas Electric, hybrid, plug-in or clean diesel vehicles; solar batteries; wind and geothermal
energy; and carbon capture and storage. South Korea ranks first in the green innovation category; tax credits rather than
deductions
Problem: The tax incentives result in patented clean technology.
Developing countries, in where abatement is often most cost effective, do not have access to clean tech. for decades afterwards
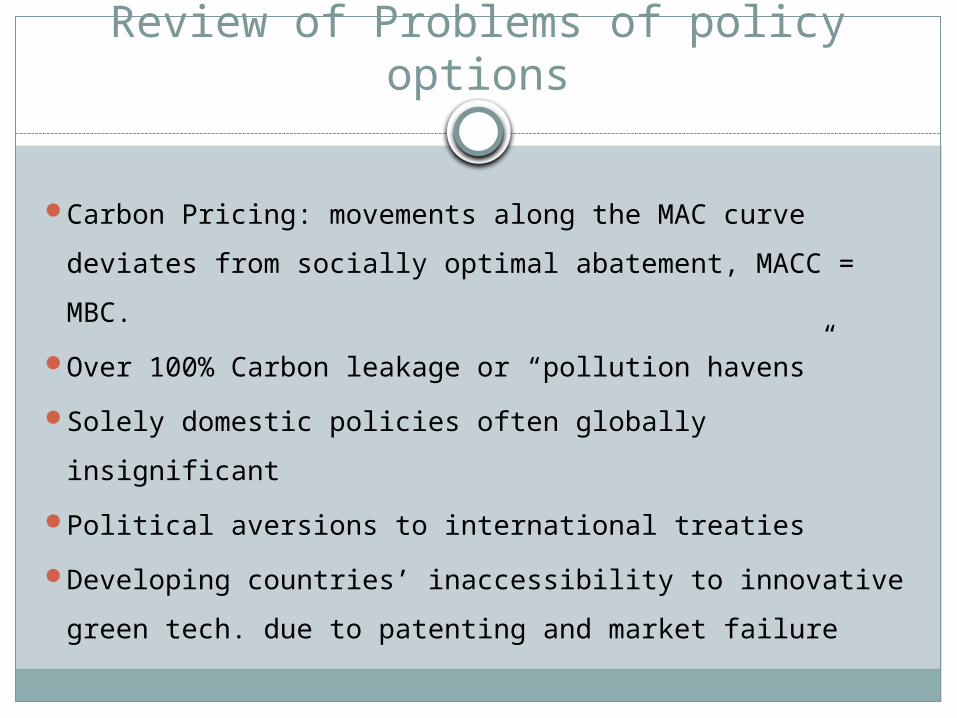
Review of Problems of policy options
Carbon Pricing: movements along the MAC curve
deviates from socially optimal abatement, MACC = MBC.
Over 100% Carbon leakage or “pollution havens”
Solely domestic policies often globally insignificant
Political aversions to international treaties
Developing countries’ inaccessibility to innovative green
tech. due to patenting and market failure
P O L I C Y A I MP O L I C Y T H E O R Y
PA R T 1 : J C MPA R T 2 : A B AT E M E N T R E S E A R C H TA X C R E D I T
P O L I C Y E F F E C T SO B S TA C L E S T O I M P L E M E N TAT I O N
P O L I C Y F L E X I B I L I T Y
Policy Suggestion
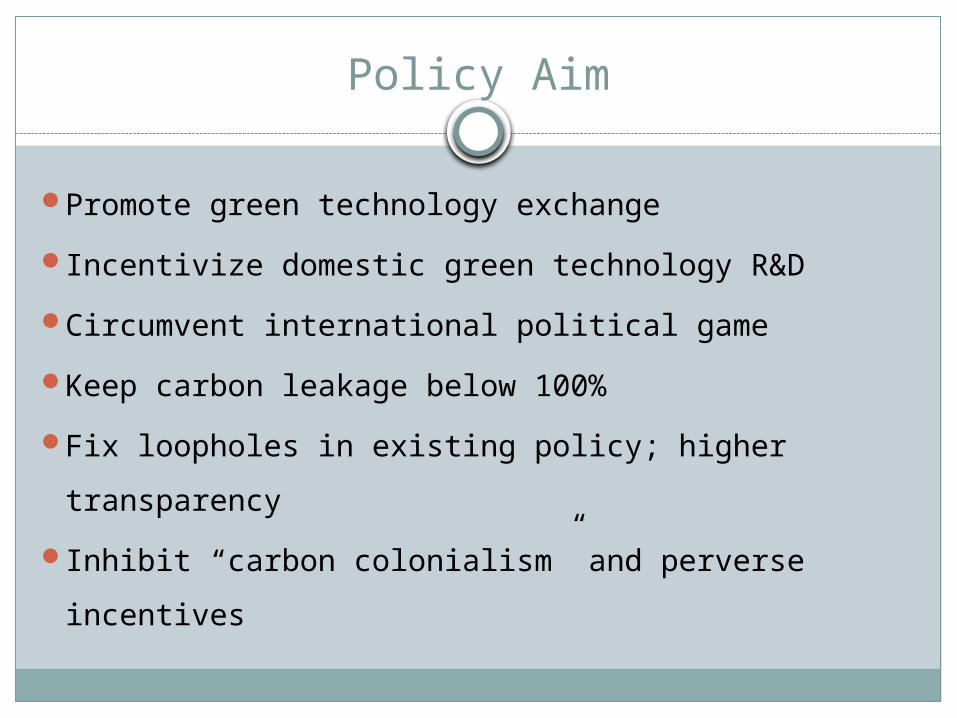
Policy Aim
Promote green technology exchange
Incentivize domestic green technology R&D
Circumvent international political game
Keep carbon leakage below 100%
Fix loopholes in existing policy; higher transparency
Inhibit “carbon colonialism” and perverse incentives

Policy Theory
The MB curve cannot shift
Shifts of MACC are superior to shifts along MACC
Technological growth provides superior shifting
E.g. more efficient carbon capture and sequestration (CCS) tech. & more
efficient photovoltaic cells
Decreases marginal abatement cost at all quantities abated, shifting
MACC downward.
Or increases quantity abated at all costs, shifting MACC right.
Our policy: Incentivize green tech R&D and usage
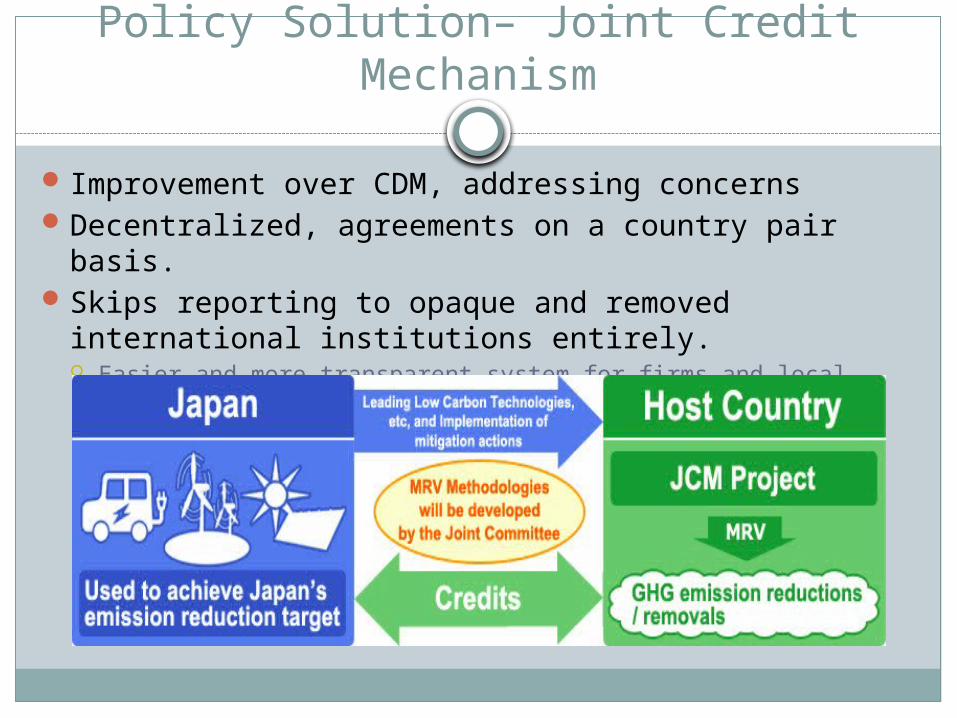
Policy Solution– Joint Credit Mechanism
Improvement over CDM, addressing concernsDecentralized, agreements on a country pair basis.Skips reporting to opaque and removed international institutions
entirely. Easier and more transparent system for firms and local communities

Joint Credit Mechanism potential concerns
1. Some CDM projects have been exploitative or harmful.
1. Industrial agriculture, large scale tree plantations
2. High transaction costs lower abatement efficiency
3. Additionality ambiguity:
1. must measure amount of emissions abated due to project that would
not have been abated under “business as usual” circumstances.
4. Lack of CDM projects in Africa
5. Lack of US international commitment to abatement

Addressing Concerns & Implementation
1. Japan’s model of decentralized JCM allows for local control over what ventures are validated and authorized through the Joint Committee (JC) mechanism.
1. Local authorities can change or modify a hazardous project
2. JC sets rules and guidelines and manages the entire process. Contains representatives from developed and developing country.
2. Circumvents UN processes, thereby reducing transaction and opportunity costs, improving policy efficiency.
3. The JCM “ensures robust methodologies, transparency, and environmental integrity; aims to avoid double-counting with regard to GHG emission reductions or removal” (Japanese Government JCM Presentation)
4. Senate Resolution 98 does not restrict national-level abatement goals. Japan rejected Kyoto Protocol’s commitment goals in favor of more rigorous, self-set commitments. President Obama also has set national goals despite rejecting international treaties.

Further Tax incentives
Current technology can already reduce emissions
One-off clean capital investments in developing countries
E.g. installing N2O filters in existing coal factories
Manufacturing increases, but research?
Solution: tax credits for green technology research
and development
Similar to South Korea
Direct emphasis on research, not just clean tech production
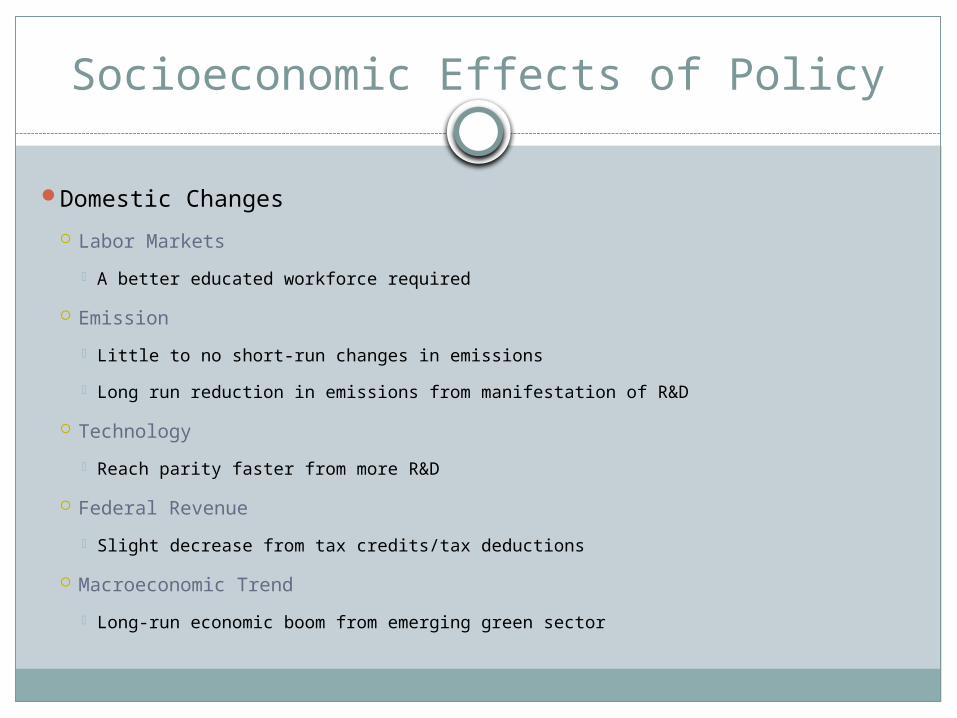
Socioeconomic Effects of Policy
Domestic Changes
Labor Markets
A better educated workforce required
Emission
Little to no short-run changes in emissions
Long run reduction in emissions from manifestation of R&D
Technology
Reach parity faster from more R&D
Federal Revenue
Slight decrease from tax credits/tax deductions
Macroeconomic Trend
Long-run economic boom from emerging green sector
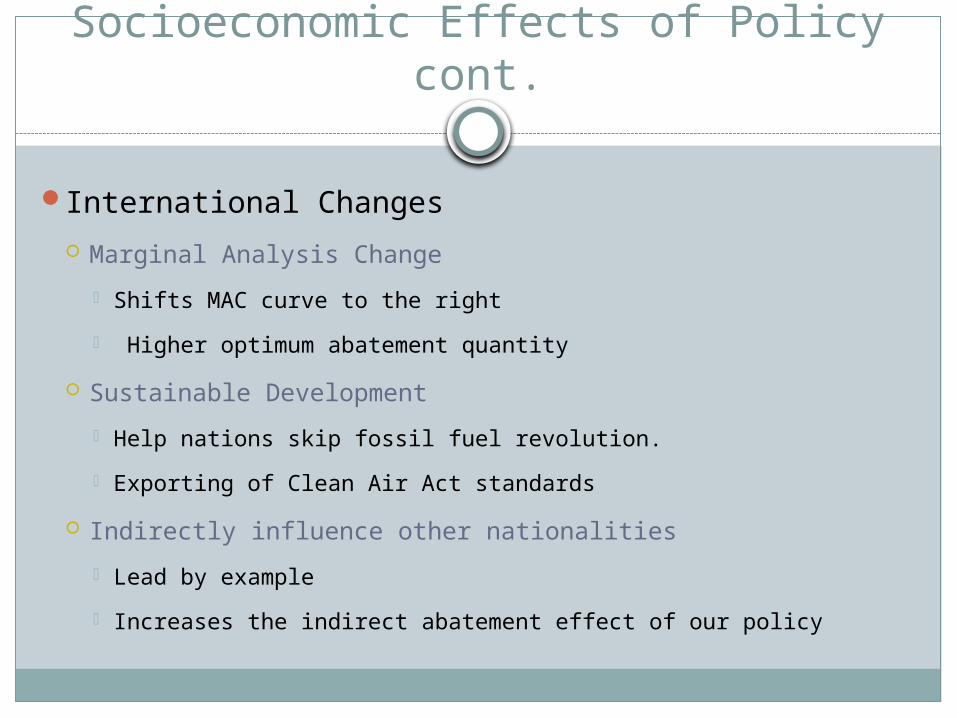
Socioeconomic Effects of Policy cont.
International Changes
Marginal Analysis Change
Shifts MAC curve to the right
Higher optimum abatement quantity
Sustainable Development
Help nations skip fossil fuel revolution.
Exporting of Clean Air Act standards
Indirectly influence other nationalities
Lead by example
Increases the indirect abatement effect of our policy
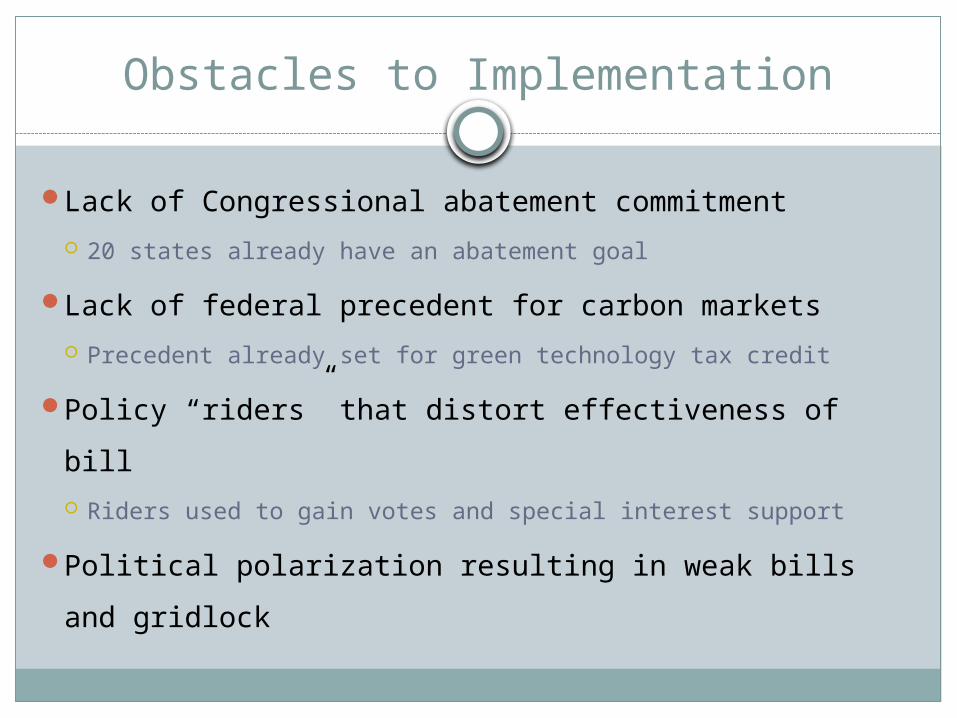
Obstacles to Implementation
Lack of Congressional abatement commitment
20 states already have an abatement goal
Lack of federal precedent for carbon markets
Precedent already set for green technology tax credit
Policy “riders” that distort effectiveness of bill
Riders used to gain votes and special interest support
Political polarization resulting in weak bills and gridlock
Flexibility
Gives U.S. control over which countries to work with
Enables market-distortion techniques to promote other objectives
E.g. allow projects that provide local benefits beyond abatement (such as jobs,
pollution reduction, job training) to earn 2x or 3x the amount of abatement
credits of a pure abatement project.
Linkable to other carbon markets already in place
Percentage of abatement credits from JCM is adjustable
All abatement policies will require an economic cost, but developing
technology and promoting investment will likely cost the least.


![PROFESSIONAL AUDIO SYSTEMSc353616.r16.cf1.rackcdn.com/Biamp_Audia-Nexia_Catalog... · 2015. 7. 1. · AUDIA® [4-6] Biamp’s revolutionary Audia® Digital Audio Platform seamlessly](https://img.pdfslide.net/doc/110x75/5fdaaa49898f6450647cdfc4/professional-audio-systemsc353616r16cf1-2015-7-1-audia-4-6-biampas.jpg)