Embed Size (px)
Citation preview
rban 2010 a n a gem en t la n
U WM P a ter

For more than 55 years, the Vallecitos Water District (VWD)
has not only consistently provided water, but continuously evolved
to meet the burgeoning demands of a population that grew from a
few hundred residents to more than 87,000 today.
In 1955, it was dwindling water supplies that led to the formation of the San Marcos
County Water District to tap into an aqueduct to import water from Northern California
and the Colorado River. As you would imagine, offering this valuable, but limited,
product to a semi-arid desert experiencing accelerated growth in agriculture, business
activities, and residences would have been a challenge under the best of circumstances.
Over time VWD has reinvented itself with a new name, additional services and a
commitment to necessary change that offers customers a safe, reliable product without
an excessive premium price. This philosophy has carried over to today.
Looking to bolster water service reliability, VWD recently completed initiatives that
include upgrading its wastewater recycling facility to double its output and lower
imported water demand for the region. A new, 40-million-gallon water storage tank
was also constructed for service ef� ciency and emergency storage.
Furthermore, VWD has adopted a new sustainability focus, to meet its customers� needs
today without compromising precious natural resources for tomorrow. At its San Marcos
headquarters facility, VWD has erected solar car ports to ease electricity demand from
the California grid and recently completed a sustainable demonstration garden that
further serves as an exceptional example of conservation for the future.
VWD is pleased to provide this 2010 Urban Water Management Plan. Contained in it
are all current and projected water supply demands for the next 25 years, as well as
descriptions of the water recycling, conservation, education and outreach programs
that will shape our water district going forward.
Although this plan is no guarantee to an endless water supply for the future, as proven
time and time again, the Vallecitos Water District will rise up to meet all challenges and
strive to maintain the reliable service and affordability its customers have come to expect.
Message from the General Manager
D e n n i s O . L a m b

Atkins North America, Inc. 9275 Sky Park Court, Suite 200 San Diego, California 92123
Telephone: +1.858.874.1810 Fax: +1.858.514.1001
www.atkinsglobal.com/northamerica
June 7, 2011 Mr. Dennis Lamb General Manager Vallecitos Water District 201 Vallecitos de Oro San Marcos, CA 92069 Subject: Technical Review of the Vallecitos Water District’s 2010 Urban Water
Management Plan Dear Mr. Lamb: Atkins is pleased to have provided a technical review of the District’s draft 2010 Urban Water Management Plan (UWMP) which was prepared by District staff. Having assisted the District with the development of their 2008 Water, Wastewater and Recycled Water Master Plan, Atkins staff are familiar with much of the information needed to complete the UWMP. In addition, our staff are in the process of preparing UWMPs for other agencies. Through that work, we have a thorough understanding of the California UWMP Act and California Department of Water Resources (DWR) guidelines and checklist requirements for preparation of the document. We have attended the DWR’s UWMP Preparation Workshops and sought clarification of the requirements directly from DWR staff. Through April and May of 2011, Atkins worked with District staff and performed a technical review of the Vallecitos draft 2010 UWMP for completeness, consistency, technical accuracy, and format to ensure an organized and dependable planning document that conforms to the DWR requirements. We provided District staff with input and interpretation of the DWR guidelines based on our experience and understanding of those requirements and our suggestions were largely incorporated into the document. We appreciate the opportunity to work closely with the District in the preparation of this important planning document and look forward to its submittal in July. If you have any questions, please do not hesitate to call me at 858.514.1014. Sincerely, Jennifer Duffy, PE Practice Manager, Water Infrastructure
Vallecitos Water District 2010 Urban Water Management Plan Page i
Table of Contents
SECTION PAGE
Section 1 Introduction ........................................................................................... 1-1
1.1 Regulatory Overview .................................................................... 1-5
1.2 Vallecitos Water District Background / Service Area .................. 1-10
1.3 Master Plan & Capital Improvement Program ............................ 1-13
Section 2 Land Use and Water Demand .............................................................. 2-1
2.1 Land Use Database ..................................................................... 2-2
2.2 Water Duty Factors ...................................................................... 2-7
2.3 Water Demand ........................................................................... 2-12
Section 3 Senate Bill X7-7 Compliance .................................................................. 3-1
3.1 Baselines and Targets ................................................................. 3-1
3.2 Regional Alliance Target .............................................................. 3-5
Section 4 Water Supply ......................................................................................... 4-1
4.1 Metropolitan Water District of Southern California Supplies ......... 4-2
4.2 San Diego County Water Authority Supplies ................................ 4-5
4.3 Vallecitos Water District Supplies ............................................... 4-10
Section 5 Water Quality ......................................................................................... 5-1
5.1 Colorado River ............................................................................. 5-1
5.2 The State Water Project ............................................................... 5-4
Section 6 Water Supply Reliability ....................................................................... 6-1
6.1 Normal Water Year Assessment .................................................. 6-1
6.2 Dry Water Year Assessment ........................................................ 6-2

Vallecitos Water District 2010 Urban Water Management Plan Page ii
Section 7 Water Demand Management Measures .............................................. 7-1
7.1 Vallecitos Water District’s History in Conservation ....................... 7-1
7.2 Best Management Practices ........................................................ 7-2
Section 8 Water Recycling .................................................................................... 8-1
8.1 Wastewater System Description, Generation & Treatment .......... 8-2
8.2 Wastewater Disposal and Recycled Water Uses ......................... 8-5
Section 9 Shortage Contingency Plan ................................................................. 9-1
9.1 Catastrophic Water Shortage ....................................................... 9-1
9.2 Drought Management Planning.................................................... 9-3
TABLES
Table 1-1 Coordination with Appropriate Agencies ................................................. 1-9
Table 2-1 Vallecitos Water District Land Use Acreages .......................................... 2-4
Table 2-2 SANDAG Series 12 Growth Forecasts for VWD Study Area .................. 2-7
Table 2-3 Unit Water Demands............................................................................... 2-9
Table 2-4 Water Demands – Actual, 2005 ............................................................ 2-12
Table 2-5 Water Demands – Actual, 2010 ............................................................ 2-13
Table 2-6 Water Deliveries – Projected, 2015 and 2020 ....................................... 2-14
Table 2-7 Water Deliveries – Projected, 2025 and 2030 ....................................... 2-15
Table 2-8 Low-Income Projected Water Demands ............................................... 2-15
Table 3-1 Base Daily per Capita Water Use – 10-Year Range ............................... 3-4
Table 3-2 Base Daily per Capita Water Use – 5-Year Range ................................. 3-5
Table 3-3 Regional Alliance per Capita Daily Water Use Targets ........................... 3-7
Table 4-1 VWD Water Supply – Existing and Planned Sources of Water ............. 4-10
Table 4-2 VWD Water Supply Connections .......................................................... 4-12
Table 4-3 VWD Existing Pump Station Summary ................................................. 4-13
Table 4-4 VWD Existing Reservoir Summary ....................................................... 4-15
Table 4-5 VWD Water Distribution Pipeline Inventory ........................................... 4-16
Table 4-6 Emergency Interagency Connections ................................................... 4-17

Vallecitos Water District 2010 Urban Water Management Plan Page iii
Table 4-7 Concept Future Water Supply Projects ................................................. 4-20
Table 6-1 Normal Year Water Assessment ............................................................. 6-2
Table 6-2 Single Dry Year Water Assessment ........................................................ 6-3
Table 6-3 Multiple Dry Year Water Assessment ..................................................... 6-4
Table 7-1 Previous and Revised BMPs .................................................................. 7-4
Table 7-2 VWD’s Drought Response Restriction Overview .................................... 7-7
Table 8-1 VWD Wastewater Collection and Treatment Volumes ............................ 8-7
Table 9-1 Supply Reliability – Current Water Sources .......................................... 9-10
FIGURES
Figure 1-1 Water Service Area ................................................................................. 1-3
Figure 1-2 Wastewater Service Area ....................................................................... 1-4
Figure 1-3 VWD 2008 Master Plan Water Capital Improvement Program ............. 1-14
Figure 2-1 Vallecitos Water District Existing Land Use ............................................ 2-5
Figure 2-2 Vallecitos Water District Future Land Use .............................................. 2-6
Figure 2-3 Water System Peaking Curves ............................................................. 2-11
Figure 3-1 Regional Alliance Agencies .................................................................... 3-8
Figure 4-1 Existing Water System .......................................................................... 4-11
Figure 4-2 Inter-Agency and Emergency Service Connections .............................. 4-18
Figure 4-3 Carlsbad Seawater Desalinated Water Conveyance ............................ 4-22
Figure 4-4 Escondido Recycled Water Conveyance Alternatives .......................... 4-24
Figure 4-5 VAL 2 Transmission Pipeline ................................................................ 4-26
Figure 8-1 Wastewater Service Area ....................................................................... 8-8
Figure 8-2 VWD Daily Wastewater and Reclamation Flows .................................... 8-9
Vallecitos Water District 2010 Urban Water Management Plan Page iv
Acronyms and Abbreviations
2008 Master Plan Vallecitos Water District 2008 Water, Wastewater and Recycled
Water Master Plan
ACP Asbestos Cement Pipe
Act California Urban Water Management Planning Act
AF Acre-Feet
AFY Acre-Feet per Year
BMP Best Management Practice
cfs Cubic Feet per Second
CII Commercial, Industrial and Institutional
CIP Capital Improvement Program
CMWD Carlsbad Municipal Water District
CSUSM California State University San Marcos
CUWCC California Urban Water Conservation Council
CWC California Water Code
DBP Disinfection Byproduct
DIP Ductile Iron Pipe
du/ac Dwelling Units per Acre
DWR State of California Department of Water Resources
EPA U.S. Environmental Protection Agency
ESP Emergency Storage Project
EWPCF Encina Water Pollution Control Facility
Forum Colorado River Basin Salinity Control Forum
GIS Geographic Information System
GPCD Gallons per Capita per Day
gpd Gallons per Day
gpd/ac Gallons per Day per Acre
gpm Gallons per Minute
HARRF City of Escondido Hale Avenue Resource Recovery Facility
ICP Integrated Contingency Plan

Vallecitos Water District 2010 Urban Water Management Plan Page v
IRP Integrated Water Resources Plan
LAFCO Local Agency Formation Commission
lbs/day Pounds per Day
MCL California Maximum Contaminant Level
MG Million Gallons
MGD Million Gallons per Day
mg/l Milligram per Liter
MOU Memorandum of Understanding Regarding Urban Water
Conservation
MRF Meadowlark Water Reclamation Facility
MWD Metropolitan Water District of Southern California
NTA Northern Tributary Area
OMWD Olivenhain Municipal Water District
Rincon MWD Rincon del Diablo Municipal Water District
SANDAG San Diego Association of Governments
SB7 Senate Bill 7 of the Seventh Extraordinary Session of 2009
SCADA Supervisory Control and Data Acquisition
SDCWA San Diego County Water Authority
SDWA Safe Drinking Water Act
SDWD San Dieguito Water District
TDS Total Dissolved Solids
µg/l Micrograms per Liter
UWMP Urban Water Management Plan
VWD Vallecitos Water District
WSDM Water Surplus and Drought Management
WSDRP San Diego County Water Authority Water Storage and Drought
Response Plan
WTP Water Treatment Plant
Vallecitos Water District 2010 Urban Water Management Plan Page 1-1
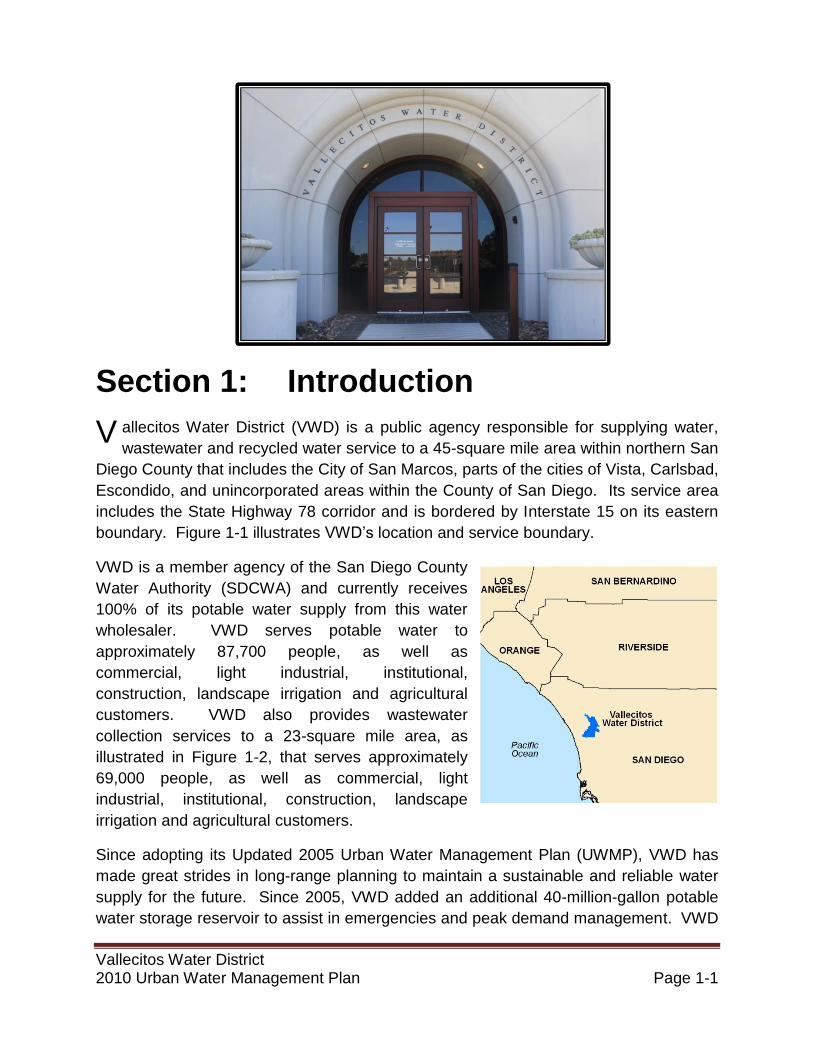
Section 1: Introduction
allecitos Water District (VWD) is a public agency responsible for supplying water,
wastewater and recycled water service to a 45-square mile area within northern San
Diego County that includes the City of San Marcos, parts of the cities of Vista, Carlsbad,
Escondido, and unincorporated areas within the County of San Diego. Its service area
includes the State Highway 78 corridor and is bordered by Interstate 15 on its eastern
boundary. Figure 1-1 illustrates VWD’s location and service boundary.
VWD is a member agency of the San Diego County
Water Authority (SDCWA) and currently receives
100% of its potable water supply from this water
wholesaler. VWD serves potable water to
approximately 87,700 people, as well as
commercial, light industrial, institutional,
construction, landscape irrigation and agricultural
customers. VWD also provides wastewater
collection services to a 23-square mile area, as
illustrated in Figure 1-2, that serves approximately
69,000 people, as well as commercial, light
industrial, institutional, construction, landscape
irrigation and agricultural customers.
Since adopting its Updated 2005 Urban Water Management Plan (UWMP), VWD has
made great strides in long-range planning to maintain a sustainable and reliable water
supply for the future. Since 2005, VWD added an additional 40-million-gallon potable
water storage reservoir to assist in emergencies and peak demand management. VWD
V

Vallecitos Water District 2010 Urban Water Management Plan Page 1-2
also doubled the recycled water output at its Meadowlark Water Reclamation Facility
and implemented aggressive water conservation outreach efforts, which lowered the
overall demand for imported water into the region.
VWD has prepared this 2010 UWMP in accordance with the Urban Water Management
Planning Act (California Water Code §10610 through 10656). This document covers
water demand, supply, quality, reliability, water recycling and Best Management
Practices programs and policies as dictated by California Water Code (CWC)
§10608.36.
This section will provide an overview of the regulatory process of this Urban Water
Management Plan, and will provide background information regarding VWD and its
service area. Further, this section will detail VWD’s master planning process and the
generation of its Capital Improvement Program (CIP).

!"a$
A©
A
6/20/2011 KC SD Z:\Projects\IS\VallecitosWaterDistrict\2010 UWMP\mxd\20411_WaterServiceArea_F1-1.mxd
WATER SERVICE AREAFIGURE 1-1
San Marcos Blvd
Ran
cho S
anta
Fe
Rd
Mission Rd
Tw
in O
aks V
alle
y R
d
Buena Creek Rd
Vista Irrigation District
Carlsbad MWD
Olivenhain MWD
Valley Center MWD
Rincon del Diablo MWD
Rainbow MWD
Deer Springs Rd
SOURCE: LAFCO SOI - Affirmed 08-06-2007VWD GIS Data - 07-17-2008, provided by District
Ü0 1.5
Miles
Old Castle RdGopher Canyon Rd
City ofEscondido
QuesthavenMWD
Vallecitos Water District
2010 Urban Water Management Plan
Legend
VWD Sphere of Influence
VWD Service Area
Sewer Only Service Area
VID Service Area
VID Within VWD SOI

VWD Sphere of Influence
Future Service Area
Sewer Service Area
Northern Tributary Area
VID Within VWD SOI
6/20/2011 KC SD Z:\Projects\IS\VallecitosWaterDistrict\2010 UWMP\mxd\20411_WastewaterServiceArea_F1-2.mxd
!"a$
A©
A
San Marcos Blvd
Mission Rd
Tw
in O
aks V
all e
y R
d
Buena Creek Rd
Ran
cho S
anta
Fe
Rd
SOURCE: LAFCO SOI - Affirmed 08-06-2007VWD GIS Data - 07-17-2008, provided by District
Rancho Santalina
MeadowlarkEstates
EscondidoGolf Course
RacewayBasin
Vista Irrigation District
Carlsbad MWD
Olivenhain MWD
Valley Center MWD
Rincon del Diablo MWD
Rainbow MWD
Deer Springs Rd
San MarcosLandfill
Vallecitos Water District
2010 Urban Water Management Plan
City ofEscondido
Ü0 1.5
Miles
WASTEWATER SERVICE AREAFIGURE 1-2

Vallecitos Water District 2010 Urban Water Management Plan Page 1-5
1.1 Regulatory Overview
The Vallecitos Water District is an independent special district governed by five
representatives voted into office by the local citizens within its service boundary. The
long-term mission of the District is to effectively and efficiently meet the needs of its
service area within the expressed and implied powers provided by law, as stated in its
adopted Mission Statement, below.
“To provide planned, effective, equitable and fiscally sound water and sewer service to its
residential, commercial and institutional customers. Recognizing that its resources are
limited and valuable, the District has made it a priority to preserve and protect these
resources, promoting their conservation and reuse while maintaining a high level of
community awareness so that future generations may continue to be served.”
The following regulations apply to this 2010 UWMP and have dictated its preparation.
1.1.1 California Urban Water Management Planning Act
UWMPs are prepared by California's urban water suppliers to support their long-term
resource planning and ensure adequate water supplies are available to meet existing
and future water demands. The California Urban Water Management Planning Act
(Act) requires every urban water supplier that provides water for municipal services to
more than 3,000 connections or is supplying more than 3,000 acre-feet of water
annually to assess the reliability of its water sources over a 20-year planning horizon
considering normal and dry years. This assessment is to be included in the supplier’s
UWMP, which is to be prepared and adopted every 5 years and submitted to the
Department of Water Resources (DWR). VWD complied with the Act in 2005 with the
adoption of its 2005 UWMP.
DWR’s Guidebook to Assist Urban Water Suppliers to Prepare a 2010 UWMP served
as a blueprint to VWD as it compiled this 2010 UWMP.
Major amendments made to the Act since preparation of the 2005 UWMP include:
CWC §10631.1 requires a plan by retail water suppliers to include water use
projections for single- and multi-family residential housing needed for lower
income and affordable households, to assist with compliance with the existing
requirement under §65589.7 of the Government Code, that suppliers grant a
priority for the provision of service to housing units affordable to lower income
households.
Vallecitos Water District 2010 Urban Water Management Plan Page 1-6
CWC §10621(b) clarifies that every urban water supplier preparing a plan must
give at least 60 days advanced notice to any city or county prior to the public
hearing on the plan within which the supplier provides water supplies to allow for
consultation on the proposed plan.
CWC §10631(j) deems water suppliers that are members of the California Urban
Water Conservation Council (CUWCC) and comply with the Memorandum of
Understanding, as it may be amended, to be in compliance with the requirement
to describe the supplier’s water demand management measures in its UWMP.
CWC §10631.7 required DWR, in consultation with the CUWCC, to convene a
technical panel, no later than January 1, 2009, to provide information and
recommendations to DWR and the Legislature on new demand management
measures, technologies, and approaches. The panel and DWR were to report
the Legislature on their findings no later than January 1, 2010, and each five
years thereafter.
CWC §10633(d) clarifies that the “indirect potable reuse” of recycled water
should be described and quantified in the plan, including a determination
regarding the technical and economic feasibility of serving those uses.
CWC §10644(c) requires DWR to recognize exemplary efforts by water suppliers
by obligating DWR to identify and report to the technical panel, described above
and “exemplary elements” of individual water suppliers’ plans, meaning any
water demand management measures adopted and implemented by specific
urban water suppliers that achieve water savings significantly above the levels
required to meet the conditions of state grant or loan funding.
CWC §10631.5 was amended to address conditions of eligibility for grants or
loans from DWR. DWR will consider whether the urban water supplier has
submitted an updated plan when determining eligibility for funds made available
pursuant to any program administered by the department.
1.1.2 Senate Bill 7 of the Seventh Extraordinary Session
of 2009
In addition to changes in the Act, the state Legislature passed Senate Bill X7-7, referred
to as SB7, on November 10, 2009, which became effective February 3, 2010. This new
law was the water conservation component to the Delta legislation package, and seeks
to achieve a 20 percent statewide reduction in urban per capita water use in California

Vallecitos Water District 2010 Urban Water Management Plan Page 1-7
by December 31, 2020. The law requires each urban retail water supplier to develop
urban water use targets to help meet the 20 percent goal by 2020, an interim water
reduction target by 2015, and incorporate this information into the 2010 UWMP.
Urban water providers such as VWD must include in their 2020 plans the following
information: (1) baseline daily per capita water use; (2) urban water use target; (3)
interim water use target; (4) compliance daily per capita water use, including technical
bases and supporting data for those determinations. An urban retail water supplier may
update its 2020 urban water use target in its 2015 UWMP (CWC §10608.20). Wholesale
water suppliers must include in their UWMPs an assessment of their present and
proposed future measures, programs and policies to help retail agencies achieve their
water use reduction targets (CWC §10608.36.).
A Regional Alliance allows individual urban retail water suppliers to combine their
individual targets into a regional target. An urban retail water supplier is required to
meet either their own or the regional water conservation target in order to comply with
SB7. VWD has entered into a Regional Alliance with Olivenhain Municipal Water
District (OMWD), Rincon del Diablo Municipal Water District (Rincon MWD), and San
Dieguito Water District (SDWD). A copy of the “Cooperative Agreement to Establish
and Carry Out a Regional Alliance in Accordance with Part 2.55 of the California Water
Code” is included in Appendix H.
1.1.3 Senate Bills 610 and 221
CWC §10910 through 10914 and Government Code §65867.5, 66455.3 and 66473.7
(commonly referred to as SB 610 and SB 221) amended state law to improve the link
between information on water supply availability and certain land use decisions made
by cities and counties. SB 610 requires that the water purveyor of the public water
system prepare a water supply assessment to be included in the environmental
documentation of certain large proposed projects. SB 221 requires affirmative written
verification from the water purveyor of the public water system that sufficient water
supplies are available for certain large residential subdivisions of property prior to
approval of the tentative map.
VWD has used documentation from Metropolitan Water District of Southern California
(MWD) and SDCWA in preparing the water supply assessments and written
verifications required under state law in producing this UWMP.
Vallecitos Water District 2010 Urban Water Management Plan Page 1-8
1.1.4 2010 Plan Preparation and Implementation
To adequately demonstrate regional water supply reliability through the next 25 years,
this UWMP quantifies the regional mix of existing and projected local and imported
supplies necessary to meet future demands within VWD’s service area. Although this
UWMP includes specific documentation regarding VWD’s supplies, plans submitted by
wholesalers (SDCWA and MWD) provide further details that contribute to the
diversification and reliability of supplies in the region. VWD’s UWMP will adhere to a
DWR-prepared checklist of items based on the Act that must be addressed in an
agency’s UWMP. This checklist allows an agency to identify where in its UWMP it has
addressed each item. This is included in Appendix I.
Reasonable consistency among the plans of VWD, SDCWA, and MWD is important to
accurately identify the projected supplies available to meet regional demands. In order
to facilitate coordination within VWD’s service area, VWD established its own internal
workgroup and also utilized information from SDCWA’s Urban Water Management Plan
Working Group. This group provided a forum for exchanging demand and local supply
information. SDCWA further coordinated its effort by working with appropriate
wastewater agencies. These agencies helped prepare the water recycling element of its
UWMP, which describes the wastewater treatment requirements and water recycling
potential for the region. In addition, MWD held a Regional Urban Water Management
Plan coordination meeting with its member agencies to discuss and share information
pertaining to demands and supplies within its service areas. The SDCWA further
coordinated with MWD regarding projected needs for imported water deliveries. Finally,
DWR hosted a webinar on November 30, 2010, and a special workshop on March 7,
2011, to review the requirements of the Act.
As stated in Section 1.1.2 above, VWD has formed a Regional Alliance with OMWD,
SDWD, and Rincon MWD pursuant to CWC §10608.28(a), the DWR Guidebook, and
the DWR Methodologies, and has coordinated with these water agencies to report
progress toward achieving water use targets on a regional basis. A copy of the regional
alliance agreement is included in Appendix H.
A draft of the SDCWA’s UWMP, which VWD’s UWMP is largely based on, was
distributed to the SDCWA member agencies on May 6, 2011. The draft UWMP included
water supply projections to satisfy CWC §10631(k).
In accordance with the Act, VWD served 60-day notice to the agencies that have land
use jurisdiction within its service area on April 11, 2011 that its UWMP is under review
and may be revised in concurrence with updated land use information, demand
projections and new legislations. This 60-day notice also stated that a public hearing will

Vallecitos Water District 2010 Urban Water Management Plan Page 1-9
be held on June 15, 2011 to receive comments, questions and suggestions regarding
VWD’s 2010 UWMP, and to discuss VWD’s implementation plan for complying with
SB7. VWD advertised this notice in the local newspaper (North County Times) once per
week for two consecutive weeks prior to the public hearing. Copies of the 60-day
notices are included in Appendix A.
Table 1-1: Coordination with Appropriate Agencies
Coordinating Agencies
Participated in developing the
plan
Contacted for assistance
Sent a copy of the draft Plan
Sent a notice of intention to adopt
San Diego County Water Authority
X X X
Olivenhain Municipal Water District
X X
Rincon del Diablo Municipal Water District
X X
San Dieguito Water District
X X
County of San Diego X X
City of San Marcos X X
City of Vista X X
City of Escondido X X
City of Carlsbad X X
VWD adopted its 2010 UWMP following the public hearing at its regularly-scheduled
Board of Directors meeting on June 15, 2011. A copy of the approved VWD Board
Meeting minutes and the approved and signed Resolution is included in Appendix A.
VWD’s 2010 UWMP will be provided to the agencies that have land use jurisdiction
within its service area no later than 60 days following its submission to DWR. Copies of
these letters of transmittal are included in Appendix B.

Vallecitos Water District 2010 Urban Water Management Plan Page 1-10
Beautiful landmarks, such as Lake San Marcos,
and a temperate climate attract residents to live
within VWD’s service area.
1.2 VALLECITOS WATER DISTRICT
BACKGROUND / SERVICE AREA
VWD was formed on March 12, 1955 as a water-only district by a group of local farmers
who recognized a need for a more substantial water supply than the groundwater found
in the San Marcos and Twin Oaks valleys to serve the area. Originally named the San
Marcos County Water District, VWD was initially established as an independent special
district pursuant to §30000 et seq., Division 12 of the CWC, with the purpose of bringing
outside water into the area through the development and operation of a public water
supply system that tapped Colorado River water. With the passage of a $998,000 bond
issue in 1956, water system construction began. Initially, water deliveries from the
SDCWA to the San Marcos County Water District were handled through the Buena
Colorado Municipal Water District. In 1981, the San Marcos County Water District
became a member of the SDCWA, from which it now receives 100 percent of its potable
water supply. On May 1, 1989, the San Marcos County Water District’s name was
changed to the Vallecitos Water District.
1.2.1 Climate
VWD is located in a semi-arid coastal
desert environment, which is
characteristically Mediterranean with
mild temperatures throughout the year.
Prolonged rain storms are rare. More
than 80 percent of the region’s rainfall
occurs between December and March.
The area typically receives about 10
inches of rainfall annually, with monthly
average temperatures ranging between
a low of 50 degrees and high of 72
degrees.
1.2.2 Demographics
VWD is located in northern San Diego County, bounded by the Olivenhain Municipal
Water District to the south, Carlsbad Municipal Water District to the west, Vista Irrigation

Vallecitos Water District 2010 Urban Water Management Plan Page 1-11
District to the northwest, Rainbow Municipal Water District to the north, Valley Center
Municipal Water District to the northeast, Rincon MWD to the east, and City of
Escondido to the southeast. VWD’s service area includes corridors on two major
freeways. Interstate 15 stretches along VWD’s eastern boundary and State Highway 78
transverses though the middle of its service area.
Of VWD’s 29,115 acres, approximately 7,145 are currently residential. Most of this is
single-family homes, although recent development is trending more toward multi-family
residential. According to the San Diego Association of Governments (SANDAG) 2030
forecast, VWD’s population is projected to increase from 87,700 in 2010, to 109,751 by
the year 2030.
1.2.3 Water Service
VWD serves a 45-square mile potable water service area. VWD has approximately
21,500 water meters that deliver over 15,500 acre-feet per year of potable water.
Currently, VWD delivers water through 323 miles of pipeline and operates 9 pump
stations and 20 potable water storage reservoirs ranging in size from 100,000 gallons to
40 million gallons. VWD’s total operational storage capacity is 121.6 million gallons. In
2010, VWD provided an average of 13.9 MGD of potable water to residential,
commercial, light industrial,
institutional, construction, landscape
irrigation and agricultural uses.
VWD’s Twin Oaks Reservoirs #1 and #2.
Reservoir #2 can hold 40 million gallons
of water and is said to be the largest
prestressed concrete tank in the world.
Inside view of Twin Oaks Reservoir #2
during construction

Vallecitos Water District 2010 Urban Water Management Plan Page 1-12
VWD has 178 miles of sewer pipeline,
which is regularly maintained to
ensure reliable service.
1.2.4 Wastewater and Recycled Water Service
In 1958, an improvement district was formed to finance the construction of a wastewater
collection system. A second improvement district was formed that same year to finance
the construction of a wastewater treatment plant, which was completed in 1961. This
treatment plant, now known as the Meadowlark Water Reclamation Facility (MRF), was
retrofitted in the early 1980’s with upgraded treatment technologies and a wastewater
treatment and recycled water production capacity of up to 2 MGD.
Today, VWD serves a 23-square mile sewer service area that is much smaller in size
than its water service area, as shown in Figure 1-2. This sewer service area can be
expanded to the same size as VWD’s water service area through annexation of these
additional parcels. However, because of its rural nature and land use designations, the
Northern Tributary Area, is an area that is likely to remain on septic systems and
therefore is not likely to be an area where VWD’s wastewater infrastructure will be
expanded to in the future.
VWD has over 19,000 sewer service
connections with 4 lift stations and 178
miles of pipeline. The average wastewater
flow in VWD’s service area is currently 6.8
MGD. This wastewater is conveyed to
either the Encina Water Pollution Control
Facility (EWPCF) or to MRF for treatment.
Expansion of MRF was completed in 2008,
increasing its recycled water production
capacity to 5 MGD. The Carlsbad
Municipal Water District (CMWD) and
Olivenhain Municipal Water District
(OMWD) purchase 4.5 MGD for non-
potable purposes, such as landscape
irrigation.
Although VWD produces up to 5 MGD of
recycled water at MRF and maintains the 54 million-gallon (MG) Mahr Reservoir, VWD
does not maintain a recycled water service area within its sphere of influence. All of the
recycled water produced is sold to the CMWD and the OMWD. CMWD originally
contracted for up to 2.0 MGD during peak summer months, and in 2003, increased that
amount to 3.0 MGD. As part of that agreement, VWD also provides CMWD with 32 MG
of recycled water storage in the Mahr Reservoir. Also in 2003, the OMWD contracted
for up to 1.5 MGD of recycled water and 16 MG of recycled water storage in the Mahr

Vallecitos Water District 2010 Urban Water Management Plan Page 1-13
Reservoir. Excess recycled water is disposed of through a failsafe pipeline that
connects to the ocean outfall at the EWPCF.
1.3 MASTER PLAN & CAPITAL
IMPROVEMENT PROGRAM
The Master Plan and comprehensive Capital Improvement Program (CIP) provide the
VWD with guidelines for reliable service to VWD’s customers well into the future. In
order to accomplish this, VWD’s 2008 Water, Wastewater and Recycled Water Master
Plan (2008 Master Plan) analyzes existing and future land uses, as well as current
water demands and trends. Through use of VWD’s ArcGIS/ArcINFO-based Geographic
Information System (GIS) and WaterGEMS / SewerGEMS hydraulic modeling software,
the 2008 Master Plan evaluates the capacity of the existing water and sewer systems
and specifies improvements necessary to serve existing and future customers. Phasing
of these improvements is based on regional population projections and known plans for
development within VWD’s sphere of influence.
A CIP is then developed to guide VWD in timely and cost-effective investments that
contribute to the sustainability of its infrastructure and the reliability of service to its
customers. CIP projects are prioritized according to how quickly they are needed.
Phase 1 projects represent projects that have commenced or were completed by the
end of 2010. Phase 2 (2011 – 2015) projects represent high priority projects that should
be planned or constructed over the next five years. Lower priority projects are identified
as Phase 3 through 5 projects that would be phased over the following fifteen years
(2016 – 2030).
The 2008 Master Plan identified 13 potable water pipeline projects totaling
approximately 65,480 linear feet, 8 potable water pump station projects that will
increase VWD’s pumping capacity by 17,950 gallons per minute, and 11 storage
projects that will increase VWD’s total potable water storage capacity by 39.67 MG.
The locations of these projects are shown in Figure 1-3. VWD’s total potable water CIP
costs through 2030 are estimated to be $79.8 million and breaks down as follows:
Water Pipeline CIP Total: $18,300,000
Water Pump Station CIP Total: $11,500,000
Water Storage CIP Total: $50,000,000


Vallecitos Water District 2010 Urban Water Management Plan Page 2-1
Section 2: Land Use & Water Demand
and use information is used to characterize existing water use patterns for different
types of land use (single-family residential, multi-family residential, commercial,
industrial, etc.). The Vallecitos Water District (VWD) keeps track of the water use
patterns for each type of land use. These patterns can be expressed in terms of unit
water demands, also known as water duty factors, which represent the average daily
water demands for each type of land use. These are usually expressed in units of
gallons per day per acre (gpd/ac).
Water duty factors are combined with land use data to generate future (typically ultimate
build-out) water demand estimates. With this ultimate build-out demand information
VWD can project the potable water supply quantities that it will need to plan for. VWD
can also model its water distribution system to determine where deficiencies are likely to
occur in the future as demands increase. This eventually leads to the composition of
the comprehensive Capital Improvement Program (CIP).
This section will describe the land use coverage of VWD‟s service area, including a
breakdown of the different land use categories and their respective areas. This section
will then turn to water system planning criteria, including unit water demands and
peaking factors, and how the criteria are used to project future water demands.
L
VWD’s service area

Vallecitos Water District 2010 Urban Water Management Plan Page 2-2
2.1 Land Use Database
VWD‟s service area encompasses approximately 45 square miles and serves the City
of San Marcos, and parts of the cities of Carlsbad, Escondido, Vista and the County of
San Diego. Land uses within this service area are primarily residential with a mix of
agricultural/rural, light industrial and commercial. Land use data is obtained through the
San Diego Association of Governments (SANDAG), which serves as a regional
clearinghouse for land use information in San Diego.
Every two to five years, SANDAG produces a new forecast to incorporate updated data,
changing trends, and new policies. VWD will use two separate SANDAG forecasts in
this Urban Water Management Plan (UWMP). SANDAG‟s 2008 forecast is known as
the 2030 Regional Growth Forecast Update, which is based on the current, adopted
general and community plans of the 18 cities within the region, and the most recent
(June 2006) version of the County‟s General Plan. Related to this growth forecast is
SANDAG‟s Series 11 land use data. The Series 11 data was utilized by VWD to
establish agency-approved land use, except for the areas within the County of San
Diego where SANDAG Series 11 utilized land uses that have not been formally adopted
by the County. In this case, the older 1979 County General Plan is used instead of the
2006 Draft General Plan Amendment data that was used for SANDAG Series 11.
SANDAG‟s 2010 forecast is known as the 2050 Regional Growth Forecast. Related to
this growth forecast is SANDAG‟s Series 12 residential population forecast, which was
utilized by VWD to establish population estimates for this 2010 UWMP. Two key
refinements of the 2050 Regional Growth Forecast include an economic outlook that
factors in the current recession and local jurisdictions‟ general/specific plan updates not
completed at the time of SANDAG‟s last forecast. Based on these updates, SANDAG
population projections are on average about one percent higher than the 2005 UWMP
estimates. Housing unit projections have also increased, with the additional housing
more heavily weighted toward multi-family units in the 2050 Regional Growth Forecast.
The San Diego County Water Authority‟s (SDCWA‟s) 2010 UWMP includes water use
associated with accelerated forecasted residential development in municipal and
industrial demand projections. These housing units were identified by SANDAG in the
course of its regional housing needs assessment, but are not yet included in existing
general land use plans. Because these units are not yet included in local jurisdictions‟
general plans, their projected demands are incorporated at a regional level and not
associated with specific member agencies, including VWD. The demands associated
with accelerated forecasted growth are intended to account for SANDAG‟s land-use
development currently projected to occur between 2035 and 2050, but has the potential
to occur on an accelerated schedule. SANDAG estimates that general plan
Vallecitos Water District 2010 Urban Water Management Plan Page 2-3
amendments, allowing this accelerated residential development, could occur within the
planning horizon of the SDCWA‟s 2010 UWMP.
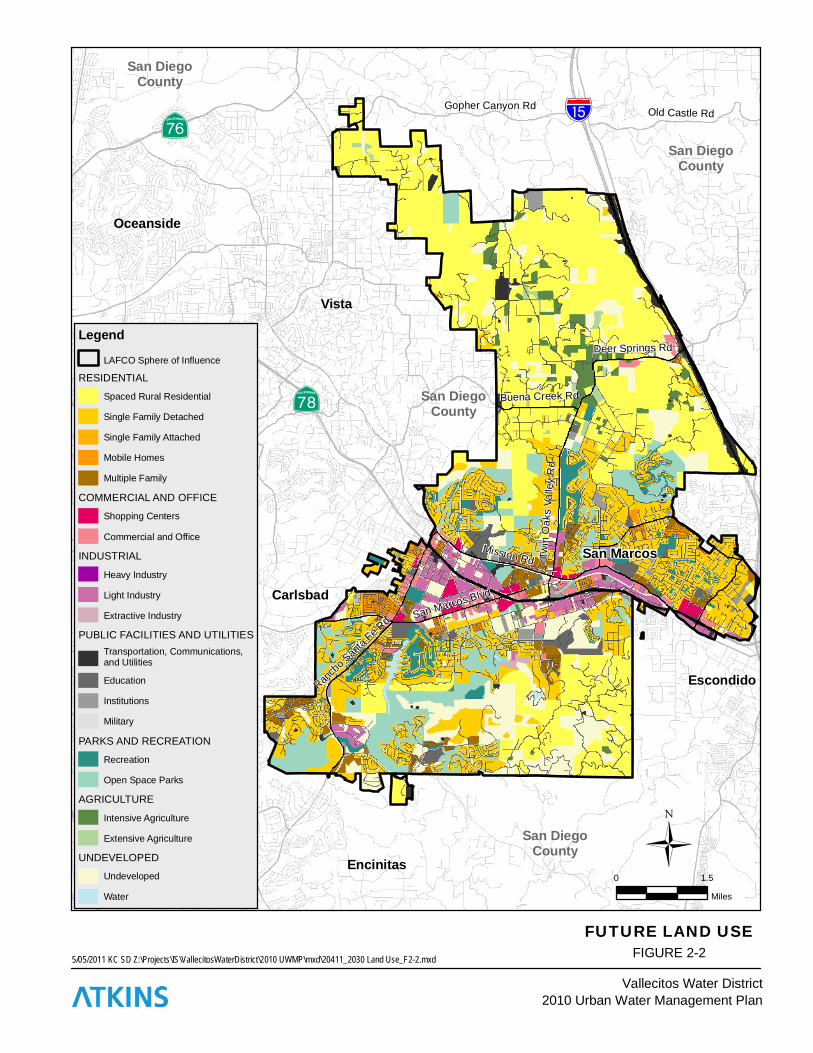
2.1.1 Existing and Planned Land Uses
The existing and planned land use coverage for the study area, as presented in the
SANDAG 2030 Regional Growth Forecast Update and the most recent (June 2006)
version of the County‟s General Plan, are shown in Figures 2-1 and 2-2, respectively.
The land use data for VWD was summarized and categorized to match VWD‟s standard
land use categories. Table 2-1 presents a breakdown of the land uses categories by
acreage for both existing and planned land uses.
Vallecitos Water District 2010 Urban Water Management Plan Page 2-4
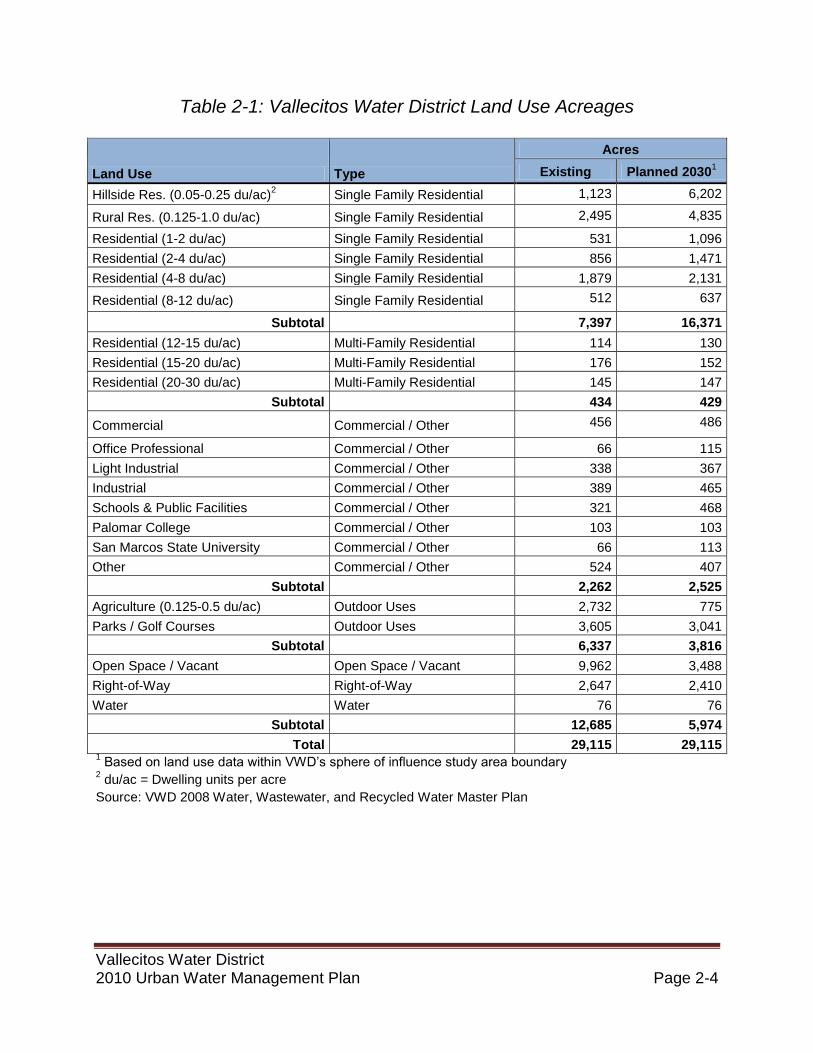
Table 2-1: Vallecitos Water District Land Use Acreages
Land Use Type
Acres
Existing Planned 20301
Hillside Res. (0.05-0.25 du/ac)2 Single Family Residential 1,123 6,202
Rural Res. (0.125-1.0 du/ac) Single Family Residential 2,495 4,835
Residential (1-2 du/ac) Single Family Residential 531 1,096
Residential (2-4 du/ac) Single Family Residential 856 1,471
Residential (4-8 du/ac) Single Family Residential 1,879 2,131
Residential (8-12 du/ac) Single Family Residential 512 637
Subtotal 7,397 16,371
Residential (12-15 du/ac) Multi-Family Residential 114 130
Residential (15-20 du/ac) Multi-Family Residential 176 152
Residential (20-30 du/ac) Multi-Family Residential 145 147
Subtotal 434 429
Commercial Commercial / Other 456 486
Office Professional Commercial / Other 66 115
Light Industrial Commercial / Other 338 367
Industrial Commercial / Other 389 465
Schools & Public Facilities Commercial / Other 321 468
Palomar College Commercial / Other 103 103
San Marcos State University Commercial / Other 66 113
Other Commercial / Other 524 407
Subtotal 2,262 2,525
Agriculture (0.125-0.5 du/ac) Outdoor Uses 2,732 775
Parks / Golf Courses Outdoor Uses 3,605 3,041
Subtotal 6,337 3,816
Open Space / Vacant Open Space / Vacant 9,962 3,488
Right-of-Way Right-of-Way 2,647 2,410
Water Water 76 76
Subtotal 12,685 5,974
Total 29,115 29,115 1 Based on land use data within VWD‟s sphere of influence study area boundary
2 du/ac = Dwelling units per acre
Source: VWD 2008 Water, Wastewater, and Recycled Water Master Plan

5/05/2011 KC SD Z:\Projects\IS\VallecitosWaterDistrict\2010 UWMP\mxd\20411_Existing Land Use_F2-1.mxd
EXISTING LAND USEFIGURE 2-1
Ü
Legend
VWD Sphere of Influence
RESIDENTIAL
Spaced Rural Residential
Single Family Detached
Single Family Attached
Mobile Homes
Multiple Family
COMMERCIAL AND OFFICE
Shopping Centers
Commercial and Office
INDUSTRIAL
Heavy Industry
Light Industry
Extractive Industry
PUBLIC FACILITIES AND UTILITIES
Transportation, Communications, and Utilities
Education
Institutions
Military
PARKS AND RECREATION
Recreation
Open Space Parks
AGRICULTURE
Intensive Agriculture
Extensive Agriculture
UNDEVELOPED
Undeveloped
Water
!"a$
A©
A
San Marcos
San DiegoCounty
San DiegoCounty
San DiegoCounty
Oceanside
Vista
Carlsbad
Encinitas
Escondido
San DiegoCounty
San Marcos Blvd
Mission Rd Tw
in O
aks V
all e
y R
d
Buena Creek Rd
Ran
cho S
anta
Fe
Rd
Deer Springs Rd
0 1.5
Miles
Vallecitos Water District
2010 Urban Water Management Plan
5/05/2011 KC SD Z:\Projects\IS\VallecitosWaterDistrict\2010 UWMP\mxd\20411_2030 Land Use_F2-2.mxd
FUTURE LAND USEFIGURE 2-2
Ü
Legend
LAFCO Sphere of Influence
RESIDENTIAL
Spaced Rural Residential
Single Family Detached
Single Family Attached
Mobile Homes
Multiple Family
COMMERCIAL AND OFFICE
Shopping Centers
Commercial and Office
INDUSTRIAL
Heavy Industry
Light Industry
Extractive Industry
PUBLIC FACILITIES AND UTILITIES
Transportation, Communications, and Utilities
Education
Institutions
Military
PARKS AND RECREATION
Recreation
Open Space Parks
AGRICULTURE
Intensive Agriculture
Extensive Agriculture
UNDEVELOPED
Undeveloped
Water
!"a$
A©
A
San Marcos
San DiegoCounty
San DiegoCounty
San DiegoCounty
Oceanside
Vista
Carlsbad
Encinitas
Escondido
San DiegoCounty
San Marcos Blvd
Mission Rd Tw
in O
aks V
all e
y R
d
Buena Creek Rd
Ran
cho S
anta
Fe
Rd
Deer Springs Rd
0 1.5
Miles
Old Castle RdGopher Canyon Rd
Vallecitos Water District
2010 Urban Water Management Plan

Vallecitos Water District 2010 Urban Water Management Plan Page 2-7
2.1.2 Population Forecast
The SANDAG Series 12 forecasted residential population growth for VWD‟s sphere of
influence, as defined by the Local Agency Formation Commission (LAFCO). These
figures were adjusted according to the results of the 2010 Census for the VWD water
service area. The resulting population forecast is shown in Table 2-2. The data
indicates that the population within the study area will increase by 27.7 percent from
2010 to 2035, at an average rate of 1.1 percent per year.
Table 2-2: SANDAG Series 12 Growth Forecast for VWD Study Area
2010 2015 2020 2025 2030 2035
VWD Water Service Area Population
87,728 96,123 98,001 105,428 109,751 112,007
2.2 Water Duty Factors
2.2.1 Unit Water System Demands
The unit water demands represent the average daily water demands on a per acre
basis for various approved land use categories within VWD. These unit water demands
were created using several sources:
VWD water meter records
Comparisons between VWD water meter records and wastewater flow records
Comparisons to unit water demands utilized in previous VWD master plans
Comparisons to other water service agencies‟ duty factors
Calculating Water Demands for Standard Land Uses
Water unit demands were developed on a per acreage basis based on a detailed
evaluation of actual water use for VWD‟s different land uses. Current demand data was
also compared to previous planning study data, and local agency standards. Table 2-3
presents the VWD 2008 Water, Wastewater and Recycled Water (2008 Master Plan)
unit demand factors and the factors used in the previous planning studies. The
calculation is expressed as:

Vallecitos Water District 2010 Urban Water Management Plan Page 2-8
California State University – San Marcos
(Acres of Base Land Use) x (2008 Unit Demand, Table 2-3) = Gallons per Day (gpd)
Calculating Generation Rates for Mixed Land Uses
Mixed use developments typically blend commercial or office land uses with stacked,
high density residential units. For water use estimation, the uses are additive.
Therefore the calculation adds the base land use totals to the residential totals. For the
residential element, a unit demand rate of 200 gallons per day per unit shall be used.
This demand rate is consistent with the high-density residential land use average duty
factor, on a per unit basis, as measured from VWD‟s water demand data. VWD, at its
discretion, may require higher residential unit rates if deemed appropriate. The
calculation is expressed as:
(Acres of Base Land Use) x (2008 Unit Rate, Table 2-3) + (200 gpd/unit) X (# Units)] = gpd
Calculating Water Demands for Schools and Hotels
Water demands at schools,
including Palomar College and
California State University – San
Marcos, shall initially be
calculated based on the area-
based duty factor given in Table
2-3. These demands shall be
compared to water demands
based on student capacity at a
demand factor of 5 gpd/student.
If the water demand based on
student count is higher
compared to the area-based
demand, VWD may utilize the higher demand figure.
The water demand for hotels and motels with commercial space will be based on the
commercial area-based demand factor for the hotel‟s/motel‟s parcel area, plus 125
gpd/room. This figure is consistent with the hotel/motel demand factor utilized by other
local water purveyors within the County. Without commercial space, only the 125
gpd/room demand factor applies.

Vallecitos Water District 2010 Urban Water Management Plan Page 2-9
Table 2-3: Unit Water Demands
Land Use Category 1991 Master Plan (gpd/ac)
1997 Master Plan (gpd/ac)
2002 Master Plan (gpd/ac)
2008 Master Plan (gpd/ac)
Hillside Res. (0.05-0.25 du/ac) 1,000 1,000 1,000 1,000
Rural Res. (0.125-1.0 du/ac) 1,000 1,000 600 600
Residential (1-2 du/ac) 1,500 1,300 1,200 1,200
Residential (2-4 du/ac) 1,750 1,900 2,100 1,800
Residential (4-6 du/ac) 2,000 1,800 2,200 2,200
Residential (4-8 du/ac) 2,000 1,900 2,400 2,500
Residential (8-12 du/ac) 2,250 2,800 2,500 2,800
Residential (12-15 du/ac) 3,750 3,400 2,800 3,300
Residential (15-20 du/ac) 3,750 3,600 3,200 3,700
Residential (20-30 du/ac) 4,000 3,800 4,100 5,000
Residential (30-40 du/ac) - - - 7,000
Residential (40-50 du/ac) - - - 9,000
Intensive Ag./Res. (0.125-0.5 du/ac) 2,000 2,000 600 1,400
Agriculture/Res. (0.125-0.5 du/ac) 1,000 1,000 700 800
Commercial 1,250 1,200 1,700 1,500
Hotel / Motel - - - 125 gpd/room
Office Professional 1,500 1,500 2,000 1,500
Light Industrial 1,500 1,500 1,800 1,800
Industrial 2,000 2,000 1,000 1,000
Schools & Public Facilities 1,250 1,300 1,400 1,400
Palomar College 2,250 2,300 2,300 1,200
San Marcos State University - 2,300 2,300 1,200
Parks/Golf Courses 1,250 1,300 1,700 1,700
Solid Waste Management 0 0 0 -
Open Space 0 200 200 200
Right-of-Way 0 0 200 200
du/ac = dwelling units per acre
gpd/ac = gallons per day per acre
Source: VWD 2008 Water, Wastewater, and Recycled Water Master Plan

Vallecitos Water District 2010 Urban Water Management Plan Page 2-10
2.2.2 Water System Peaking Factors
Water demands vary throughout the day and throughout the year, being greatest during
the warmer summer months and smallest during the cooler winter months. This
phenomenon is known as “peaking”. The amount of “peaking” is greatly dependent on
the size of the study area (“peaking” amounts become smaller as study areas increase
in size) and the local climate (“peaking” is usually greater inland where temperatures
are higher in summer months). For a system having a size and local climate such as
VWD‟s, the water demand during a hot summer day is approximately 1.9 times greater
than an average day‟s demand. Therefore, VWD‟s district-wide “peaking factor” in this
case is 1.9.
Figure 2-3 displays the peaking factor curves for both maximum day (i.e. the demand
multiplier during a hot summer day vs. an average day) and peak hour (i.e. the demand
multiplier for the highest water usage hour of the year vs. the average day demand)
conditions. For a system of similar size as VWD‟s (a demand of 13.9 MGD), the
maximum day peaking factor is 1.9 and the peak hour factor is 3.1. These
corresponding peaking factors obtained from these curves are multiplied by the average
water demands to determine the maximum day and peak hour demands, respectively.
To size improvements ranging in size from district-wide transmission infrastructure to
individual development projects, VWD uses Figure 2-3 to determine the appropriate
peaking factors. This figure gives the maximum day and peak hour demand curves
utilized in the 2008 Master Plan. The peaking factors used for VWD‟s overall service
area are lower than what would be appropriate for smaller study areas, such as specific
development plans, or an individual pressure zone analysis.

10
Peakin
g F
acto
r
Water System Peaking CurvesFigure 2-3
Vallecitos Water District
2010 Urban Water Management Plan
1
0.1 1 10 100
Average Annual Demand (mgd)
Maximum Day Peak Hour

Vallecitos Water District 2010 Urban Water Management Plan Page 2-12
2.3 Water Demand
Past, current and projected water use in VWD is divided into seven categories:
single-family residential, multi-family residential, commercial, industrial,
institutional and governmental, landscape and agriculture.
2.3.1 Past Water Use
Past water use for VWD was evaluated by examining the monthly metered water
deliveries during 2005. VWD experienced an average day demand of approximately
16.2 MGD during 2005. Table 2-4 summarizes the average demands by water meter
type and by total volume.
Table 2-4: Water Demands – Actual, 2005
Water use sectors # of accounts Average Daily
Demand1
Single-family 16,870 6,734,390
Multi-family 438 1,662,173
Commercial 725 1,455,071
Industrial 118 244,595
Institutional/Governmental 156 515,077
Landscape 687 2,743,318
Agriculture 213 1,988,895
Unaccounted/Unbilled Losses - 859,653
Total 19,207 16,202,172 1In units of gallons per day
2.3.2 Current Water Use
Current water use for VWD was evaluated by examining the monthly metered water
deliveries during the fiscal year ending in 2010. VWD experienced an average day
demand of approximately 14.6 MGD during the fiscal year ending in 2010. It should be
noted that this average day demand figure includes water consumption through
temporary meters, as well as other end delivery facilities that are typically unbilled uses
such as fire hydrant testing or system flushing. Such unbilled losses have been

Vallecitos Water District 2010 Urban Water Management Plan Page 2-13
between 4.5 percent and 6.5 percent of the annual volume of potable water delivered
from the SDCWA since 2002.
VWD serves a predominantly residential community, where nearly 61 percent of the
water use is single-family and multi-family residential. Table 2-5 summarizes the
demands by water meter type and by average daily demand.
Table 2-5: Water Demands – Actual, 2010
Water use sectors # of accounts Average Daily
Demand1
Single-family 18,226 7,754,267
Multi-family 429 953,140
Commercial 749 845,920
Industrial 116 175,080
Institutional/Governmental 109 403,464
Landscape 774 2,644,897
Agriculture 81 1,137,544
Unaccounted/Unbilled Losses - 643,630
Total 20,484 14,557,942 1In units of gallons per day
VWD‟s 2010 average water demand, 14.6 MGD, is substantially less than its 2005
average water demand of 16.2 MGD. In the fiscal year ending in 2007, VWD‟s service
area received an average of 19.5 MGD. However, conservation efforts due to the
drought combined with the recent economic recession have reduced water use by over
25 percent. This includes a 48 percent reduction in agricultural water usage from fiscal
year ending in 2007 to fiscal year ending in 2010.
2.3.3 Projected Water Use
Future water use projections were generated in the 2008 Master Plan through the
planning horizon year 2030. The following steps were utilized in developing the future
water demand projections:
The approved land use coverage and zoning maps were provided by the land
use agencies.

Vallecitos Water District 2010 Urban Water Management Plan Page 2-14
In VWD‟s Geographic Information System (GIS) database, all parcels in VWD‟s
service area were attributed with their approved land use condition and unit water
demands.
Vacant and un-served parcels were assigned likely connection points to the
existing distribution system or were determined to be best served by another
water agency through an exchange agreement.
Ultimate demand projections were then estimated by applying the appropriate
unit water demands to all parcels identified as being served by VWD, or another
agency through an exchange agreement.
2030 Demand Projections were developed by applying the SANDAG „2030
Regional Growth Forecast Update‟ coverage to these ultimate demand
projections.
Tables 2-6 and 2-7 present the projected future average water demands for VWD in 5-
year increments up to the year 2030. Projected water demands for interim years 2015,
2020, and 2025 were estimated based upon SANDAG‟s growth forecasts for VWD. The
ultimate future build-out average water demand projection for VWD is approximately
34.1 MGD.
Table 2-6: Water Deliveries – Projected, 2015 and 2020
Water use sectors
2015 2020
# of accounts
Average Daily Demand
1
# of accounts
Average Daily Demand
1
Single-family 18,741 16,394,371 20,039 18,523,787
Multi-family 429 1,073,070 479 1,193,000
Commercial 742 1,021,065 790 1,196,210
Industrial 120 312,960 124 450,840
Institutional/Governmental 120 447,623 130 491,782
Landscape 744 2,614,513 714 2,584,129
Agriculture 67 1,126,398 62 1,115,252
Unaccounted/Unbilled Losses 1,210,000 1,345,000
Total 20,963 24,200,000 22,338 26,900,000 1In units of gallons per day

Vallecitos Water District 2010 Urban Water Management Plan Page 2-15
Table 2-7: Water Deliveries – Projected, 2025 and 2030
Water use sectors
2025 2030
# of accounts
Average Daily Demand
1
# of accounts
Average Daily Demand
1
Single-family 21,395 20,178,204 22,750 21,737,620
Multi-family 504 1,312,930 529 1,432,860
Commercial 810 1,371,355 830 1,546,500
Industrial 129 588,720 133 726,600
Institutional/Governmental 141 535,941 151 580,100
Landscape 683 2,553,744 653 2,523,360
Agriculture 52 1,104,106 42 1,092,960
Unaccounted/Unbilled Losses 1,455,000 1,560,000
Total 23,714 29,100,000 25,088 31,200,000 1In units of gallons per day
Low-Income Projected Demands
Table 2-8 identifies the projected water use for affordable and lower income residential
housing as identified in the housing elements of the land use agencies that have
jurisdiction within VWD‟s service area.
Table 2-8: Low-Income Projected Water Demands
Low Income Water Demands1 2015 2020 2025 2030
Total Low Income Residential 160,960 178,950 196,940 214,930
Total 160,960 178,950 196,940 214,930 1In units of gallons per day

Vallecitos Water District 2010 Urban Water Management Plan Page 3-1
Section 3: Senate Bill X7-7 Compliance
n November 10, 2009, California Governor Arnold Schwarzenegger signed into law
a comprehensive water package made up of four bills, including Senate Bill X7-7
(SB7). SB7 mandates conservation targets for all urban retail water entities supplying
potable municipal water to more than 3,000 end users or delivering more than 3,000
acre feet of potable water per year to end users. The conservation targets of 10 percent
by 2015 and 20 percent by 2020 on a gallons-per-capita-per-day (gpcd) water use basis
must be complied with in order to be eligible for state water grants and loans. Vallecitos
Water District (VWD) is not subject to agricultural-related provisions of SB7 since VWD
supplies agricultural water to less than 10,000 acres.
This section includes analysis for both VWD baselines and targets, as well as Regional
Alliance targets to meet SB7 mandates for 2015 and 2020. Section 2.55 of the
California Water Code allows agencies to form a Regional Alliance and establish a
regional target to satisfy SB7. The Regional Alliance includes three additional water
agencies, Olivenhain Municipal Water District (OMWD), San Dieguito Water District
(SDWD), and Rincon del Diablo Municipal Water District (Rincon MWD). A
“Cooperative Agreement to Establish and Carry Out a Regional Alliance in Accordance
with Part 2.55 of the California Water Code” is attached in Appendix H.
3.1 Baselines and Targets
In accordance with California Water Code (CWC) §10608.20(b), there are four methods
available to VWD to determine urban water use targets:
1. 80 percent of baseline per capita water usage
2. Per capita daily water use as the sum of
a. 55 gpcd plus dedicated irrigation,
b. the Model Water Efficient Landscape Ordinance water efficiency
equivalent, and
c. Commercial, Industrial, and Institutional (CII) use equivalent to 90 percent
of baseline CII water use by 2020
3. 95 percent of the applicable state hydrological region target as set forth in
California’s draft 20 X 2020 Water Conservation Plan
4. An approach developed by the California Department of Water Resources
(DWR)
O

Vallecitos Water District 2010 Urban Water Management Plan Page 3-2
VWD chose the first method (80 percent of baseline per capita water usage) and
calculated the baseline and target gpcd consistent with guidance provided by the
California DWR and California Urban Water Conservation Council in accordance with
CWC §10608.20(h)(1). The calculation, presented below in Table 3-1, results in a
baseline per capita water usage of 199.2 gpcd. Explanations of the components of the
calculation are as follows:
Fiscal Year End
CWC §10608.20(a)(1) allows water use targets to be determined on either a fiscal year
or calendar year. VWD chose to use its fiscal year,
which starts on July 1 and ends on June 30. “Fiscal
Year End” is defined as the fiscal year ending on June
30 of the stated year.
Distribution System Population
CWC §10608.20(f) requires that population data be determined using federal, state, and
local population reports and projections. VWD used data compiled and reported by the
San Diego Association of Governments (SANDAG) from their Series 12 projections for
fiscal years ending in 1995 through 2010.
Daily System Gross Water Use
CWC §10608.12(g) defines “daily system gross water use” as the total volume of water
entering the distribution system, excluding recycled water, wholesale water sold and
agricultural water, and the net change in water storage. VWD’s sole source of “daily
system gross water use” is imported wholesale water. Million gallons per day (MGD) of
“daily system gross water use” = total water supplied + decrease in water storage –
increase in water storage – agricultural water use.
Average Daily per Capita Water Use
The average daily per capita water use is calculated by dividing the volume of “daily
system gross water use” (in MGD) by the population, then multiplying by 1,000,000 to
convert the figure to gallons.
Average gpcd – 10-Year
Guidance provided in the California DWR’s “Methodologies for Calculating Baseline and
Compliance Urban Per Capita Water Use” (DWR Guidance) requires use of a

Vallecitos Water District 2010 Urban Water Management Plan Page 3-3
continuous 10-year period ended no earlier than December 31, 2004, and no later than
December 31, 2010, to calculate Baseline gpcd. Table 3-1 calculates all possible 10-
year periods over which an average can be used as the baseline. The time frame of
fiscal years ending in 1999 through 2008 yields the greatest average usage at 199.2
gpcd and is therefore selected for VWD’s baseline. Although VWD supplies a
significant amount of recycled water to neighboring agencies, no recycled water is sold
by VWD. Therefore, VWD cannot use the longer 15-year averaging period as allowed
per DWR Guidance.
Target GPCD Reductions
CWC §10608.16 mandates that VWD achieve a 20 percent reduction from baseline
usage by 2020 and an incremental reduction of 10 percent by 2015. VWD has
calculated the 2015 target (90 percent of baseline per capita water usage) at 179.3
gpcd, and the 2020 target (80 percent of baseline per capita water usage) at 159.4
gpcd. These baseline and target figures were developed individually rather than on a
regional basis.
The actual capita daily water use for the fiscal year ending in 2010 is 154.6 gpcd, which
is already below the 2020 target. The current water conservation goals have effectively
provided the reduction necessary to comply with SB7. Best management practices
delineated in Section 7 present VWD’s plan to maintain conservation to ensure that the
demands do not increase again if drought alert levels are decreased and water
awareness wanes.

Vallecitos Water District 2010 Urban Water Management Plan Page 3-4
Table 3-1: Base Daily per Capita Water Use – 10-Year Range
Base period year Distribution System
Population
Daily System Gross Water Use (MGD)
Average Daily per Capita Water Use
(gpcd)
Average gpcd 10-Year
Sequence Year
Fiscal Year End
Year 1 1995 50,149 8.81 175.6
Year 2 1996 51,974 10.06 193.6
Year 3 1997 53,865 10.45 193.9
Year 4 1998 55,825 9.59 171.8
Year 5 1999 57,856 10.73 185.5
Year 6 2000 59,968 12.48 208.1
Year 7 2001 60,481 12.08 199.7
Year 8 2002 64,154 13.33 207.7
Year 9 2003 67,191 13.41 199.6
Year 10 2004 70,668 14.91 211.0
Year 11 2005 75,992 14.30 188.2 195.9
Year 12 2006 79,986 15.30 191.2 195.7
Year 13 2007 82,967 17.29 208.3 197.1
Year 14 2008 85,910 16.55 192.7 199.2
Year 15 2009 86,673 15.53 179.2 198.6
Year 16 2010 87,728 13.56 154.6 193.2
Base Daily per Capita Water Use 199.2
CWC §10608.22 provides that the 2020 target reduction shall be no less than 5 percent
of the capita daily water use for a five-year period ending no earlier than December 31,
2007, and no later than December 31, 2010. Table 3-2 below is presented in
accordance with DWR Guidance and shows the target reduction to 159.3 gpcd exceeds
the reduction using the 5-year calculation.
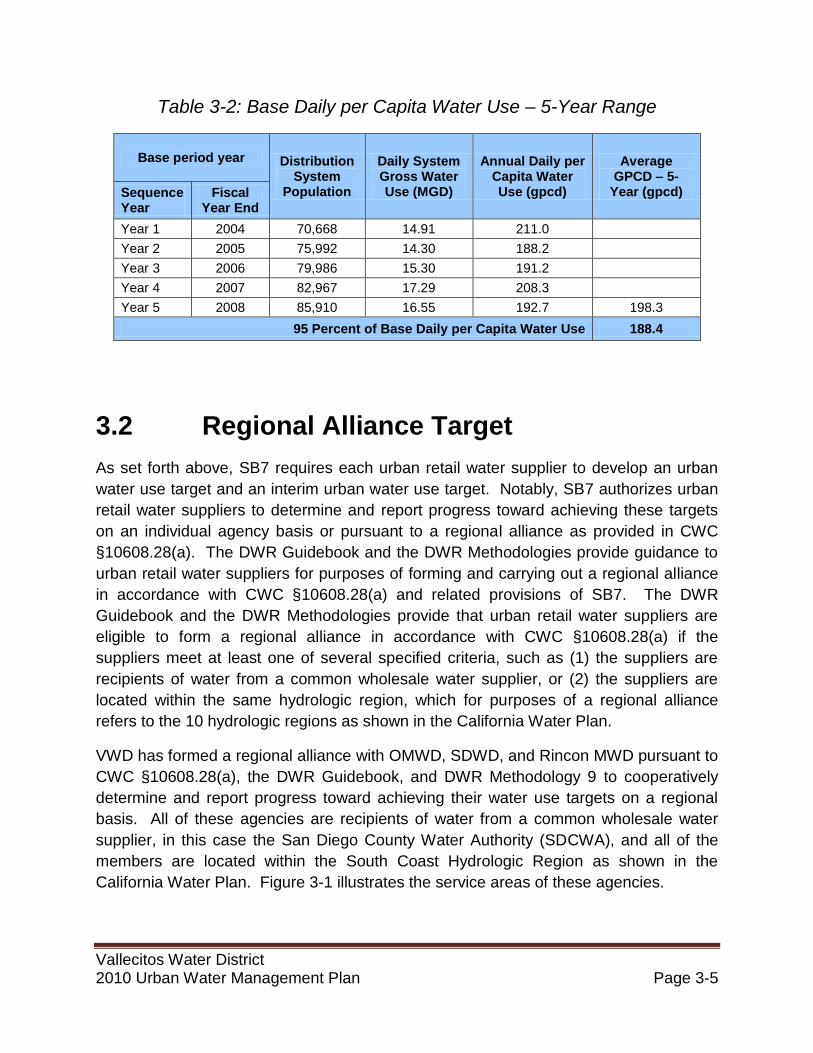
Vallecitos Water District 2010 Urban Water Management Plan Page 3-5
Table 3-2: Base Daily per Capita Water Use – 5-Year Range
Base period year Distribution System
Population
Daily System Gross Water Use (MGD)
Annual Daily per Capita Water Use (gpcd)
Average GPCD – 5-
Year (gpcd) Sequence Year
Fiscal Year End
Year 1 2004 70,668 14.91 211.0
Year 2 2005 75,992 14.30 188.2
Year 3 2006 79,986 15.30 191.2
Year 4 2007 82,967 17.29 208.3
Year 5 2008 85,910 16.55 192.7 198.3
95 Percent of Base Daily per Capita Water Use 188.4
3.2 Regional Alliance Target
As set forth above, SB7 requires each urban retail water supplier to develop an urban
water use target and an interim urban water use target. Notably, SB7 authorizes urban
retail water suppliers to determine and report progress toward achieving these targets
on an individual agency basis or pursuant to a regional alliance as provided in CWC
§10608.28(a). The DWR Guidebook and the DWR Methodologies provide guidance to
urban retail water suppliers for purposes of forming and carrying out a regional alliance
in accordance with CWC §10608.28(a) and related provisions of SB7. The DWR
Guidebook and the DWR Methodologies provide that urban retail water suppliers are
eligible to form a regional alliance in accordance with CWC §10608.28(a) if the
suppliers meet at least one of several specified criteria, such as (1) the suppliers are
recipients of water from a common wholesale water supplier, or (2) the suppliers are
located within the same hydrologic region, which for purposes of a regional alliance
refers to the 10 hydrologic regions as shown in the California Water Plan.
VWD has formed a regional alliance with OMWD, SDWD, and Rincon MWD pursuant to
CWC §10608.28(a), the DWR Guidebook, and DWR Methodology 9 to cooperatively
determine and report progress toward achieving their water use targets on a regional
basis. All of these agencies are recipients of water from a common wholesale water
supplier, in this case the San Diego County Water Authority (SDCWA), and all of the
members are located within the South Coast Hydrologic Region as shown in the
California Water Plan. Figure 3-1 illustrates the service areas of these agencies.

Vallecitos Water District 2010 Urban Water Management Plan Page 3-6
These agencies have entered into a cooperative agreement to establish and carry out a
regional alliance, and they have jointly notified DWR of the formation of their regional
alliance (this agreement is included in Appendix H). In accordance with the DWR
Guidebook and DWR Methodologies, the members have prepared an urban water use
target for the year 2020 and an interim urban water use target for 2015 for the region,
which is further set forth in Table 3-3 below and within each of the other member’s
individual Urban Water Management Plans (UWMPs).
Furthermore, each member of the regional alliance has developed its own urban water
use target for the year 2020 and interim urban water use target for the year 2015, along
with other supporting data and determinations, all of which is included in each member’s
individual UWMP. These individual agency targets were created using Method 1 as set
forth in CWC §10608.20(b)(1). VWD’s individual interim and urban water use targets
are set forth in Section 3.1 above. The regional alliance urban water use and interim
urban water use targets are based on the weighted average, by population, of the
agencies’ individual urban water use and interim urban water use targets.

Vallecitos Water District 2010 Urban Water Management Plan Page 3-7
Table 3-3: Regional Alliance per Capita Daily Water Use Targets
VWD 2015 2020 2025 2030 2035
GPCD Target 179 159 159 159 159
Population Projection 96,123 98,001 105,428 109,751 112,007
20x2020 Demand Target (AF) 19,273 17,454 18,777 19,547 19,949
OMWD 2015 2020 2025 2030 2035
GPCD Target 319 283 283 283 283
Population Projection 66,993 67,987 69,003 71,101 72,095
20x2020 Demand Target (AF) 23,938 21,552 21,874 22,539 22,854
SDWD 2015 2020 2025 2030 2035
GPCD Target 180 160 160 160 160
Population Projection 40,515 41,870 44,271 45,531 46,425
20x2020 Demand Target (AF) 8,147 7,484 7,913 8,138 8,298
Rincon MWD 2015 2020 2025 2030 2035
GPCD Target 239 213 213 213 213
Population Projection 29,212 30,984 32,289 34,576 35,634
20x2020 Demand Target (AF) 7,820 7,392 7,704 8,250 8,502
REGIONAL ALLIANCE 2015 2020 2025 2030 2035
GPCD Target 227 201 201 201 201
Population Projection 232,843 238,842 250,991 260,959 266,161
20x2020 Demand Target (AF) 59,178 53,882 56,268 58,474 59,603

Vallecitos Water District 2010 Urban Water Management Plan Page 3-8
Figure 3-1: Regional Alliance Agencies

Vallecitos Water District 2010 Urban Water Management Plan Page 4-1
Section 4: Water Supply
Ince its formation in 1955, the Vallecitos Water District (VWD) has received 100
percent of its water supply from the San Diego County Water Authority (SDCWA), of
which it is one of 24 member agencies. The SDCWA, in turn, obtains most of its water
from the Metropolitan Water District of Southern California (MWD), which obtains its
water from the Sacramento-San Joaquin Delta in Northern California via the State
Water Project, and from the Colorado River via the Colorado River Aqueduct. VWD is
fully aware how uncertain these water supplies have become in the last few years and
has investigated opportunities to develop local resources. VWD’s 2007 Integrated
Water Resources Plan (IRP) analyzed several local water supply alternatives to
supplement its existing SDCWA water supply, including seawater desalination, recycled
water purchasing, treated water purchases from other agencies and groundwater
feasibility.
This section describes MWD and the SDCWA and their respective water supply
resources. VWD’s own potable water and recycled water distribution systems are also
discussed. And finally, this section discusses local water supply alternatives that
VWD’s IRP recommended for further study.
S
Colorado River (Photo courtesy of the Metropolitan Water District of Southern California)

Vallecitos Water District 2010 Urban Water Management Plan Page 4-2
4.1 Metropolitan Water District of Southern
California Supplies
4.1.1 MWD Description
MWD was formed in 1928 to develop, store, and distribute supplemental water to
Southern California for domestic and municipal use. It serves approximately 19 million
people in Ventura, Los Angeles, Orange, San Bernardino, Riverside and San Diego
counties. In terms of area, MWD’s service area boundary encompasses a 70-mile strip
of the Southern California coastal plain, extending from Oxnard south to the Mexican
border. Close to half of the water used in this 5,200-square-mile region is supplied by
MWD, and about 90 percent of the population receives at least some water from MWD.
VWD receives this water via the SDCWA.
Section 135 of the Metropolitan Act grants member agencies preferential rights to MWD
water. The rights are determined by each agency’s total historic payments to MWD
from property taxes, readiness-to-serve charges and other minor revenue. However,
revenue resulting from the purchase of MWD water is excluded. SDCWA has a
preferential right to purchase 17.47 percent of MWD’s water based on historic
payments, although it purchased about 21 percent of MWD’s available supply in fiscal
year 2010.
MWD’s 2010 Regional Urban Water Management Plan (UWMP) presented its supply
availability at the regional level. This report stated that reliable water supplies could be
provided to the SDCWA in normal years and a single dry year. In multiple dry years,
however, the SDCWA could experience shortages.
4.1.2 MWD Supplies
MWD supplies Southern California from two sources: the 224-mile Colorado River
Aqueduct and the 444-mile California Aqueduct. In order to meet challenges such as
dry weather patterns and regulatory pumping restrictions that may limit these supplies,
MWD’s strategy also includes utilizing its various storage programs that save excess
water during wet years for dry-year use.
Colorado River aqueduct

Vallecitos Water District 2010 Urban Water Management Plan Page 4-3
Colorado River
MWD was originally formed to import water
from the Colorado River. During the 1930s,
MWD built the Colorado River Aqueduct,
and member agencies first received this
water in 1941. The structure, running from
Lake Havasu on the Arizona/California
border to Lake Mathews in Riverside
County, has the capacity to deliver up to
1.25 million acre-feet per year (AFY).
MWD currently receives a Colorado River
supply of 550,000 AFY of California’s
apportionment of 4.4 million AFY. Through the 2003 Quantification Settlement
Agreement and related agreements among Imperial Irrigation District, the Coachella
Valley Water District, State of California, Department of Interior, MWD, and the
SDCWA, a plan was formalized on how California will implement water transfers and
supply programs that allow California to live within the state’s 4.4 million AFY
apportionment of Colorado River water. This agreement, which is in effect for 45 years
(and up to 75 years), resolved longstanding disputes regarding Colorado River water
use among the agencies, and established a baseline water use for the Coachella Valley
Water District, Imperial Irrigation District, and MWD. This permitted the implementation
of a variety of water conservation and transfer agreements, including the SDCWA’s
transfer agreement with the Imperial Irrigation District.
MWD has relied on cooperative transfer programs and storage programs to increase its
Colorado River water deliveries beyond its basic apportionment. More information
regarding reliability issues, environmental considerations, and the Quantification
Settlement Agreement’s potential to affect VWD supplies can be found in the Water
Supply sections of MWD’s 2010 Regional UWMP and SDCWA’s 2010 UWMP.
Colorado River Aqueduct

Vallecitos Water District 2010 Urban Water Management Plan Page 4-4
State Water Project
The State Water Project is owned by the State of California and is operated by the
Department of Water Resources (DWR). MWD is entitled to take about 48 percent of
available State Water Project through its Long-Term State Water Project Supply
Contract. The project stretches more than 600 miles, from Lake Oroville in the north to
Lake Perris in the south. Water is stored at Lake Oroville and released when needed
into the Feather River, which flows into the Sacramento River and to the Sacramento-
San Joaquin River Delta. The Delta
is the largest estuary on the United
States’ west coast and is home to an
agricultural industry, recreation and
fishing, and provides the means by
which to deliver water from Northern
California to the south. In the south
Delta, water is diverted into the State
Water Project’s Banks Pumping
Plant, where it is lifted into the 444-
mile-long California Aqueduct. Some
of this water flows into the South Bay
Aqueduct to serve areas in Alameda
and Santa Clara counties. The remainder flows southward to cities and farms in Central
and Southern California. In the winter, when demands are lower, water is stored at the
San Luis Reservoir located south of the Delta. State Water Project facilities provide
drinking water to 23 million Californians and 755,000 acres of irrigated farmland.
In recent years, actions taken to protect the ecosystem of the Bay-Delta have placed
additional restrictions on State Water Project operations. These actions may affect
water delivery projections from the State Water Project.
Sacramento-San Joaquin River Delta
California Aqueduct

Vallecitos Water District 2010 Urban Water Management Plan Page 4-5
MWD State Water Project supply projections are based on DWR’s Draft 2009 State
Water Project Delivery Reliability Report for current and future conditions, taking into
consideration restrictions on State Water Project and Central Valley Project operations.
Under the reliability report, delivery estimates for current conditions are 7 percent under
a single dry-year condition, which is the equivalent of 134,000 AFY, and 60 percent
under long-term average conditions, which is equivalent to 1.15 million AFY. For dry
hydrologic conditions and regulatory restrictions, MWD developed additional supplies
from Central Valley storage and transfer programs.
MWD’s future projections indicate the State Water Project target for a dry year (based
on 1977 hydrology) is 522,000 AFY in 2015, 601,000 AFY in 2020 and 651,000 AFY in
2025. Projections from MWD’s 2010 Regional Urban Water Management Plan estimate
a State Water Project supply range of between 609,000 and 610,000 AFY for the 2030-
2035 period.
More information regarding reliability issues, environmental considerations, and any
other potential challenges possibly affecting the VWD supplies from the State Water
Project can be found in the Water Supply sections of MWD’s 2010 Regional Urban
Water Management Plan and SDCWA’s 2010 Urban Water Management Plan.
4.2 San Diego County Water Authority
Supplies
4.2.1 SDCWA Description
The SDCWA was established pursuant to legislation adopted by the California State
Legislature in 1943 to provide a supplemental supply of water as the region’s civilian
and military population expanded and local resources became insufficient to meet the
region’s water-supply needs. Before 1947, the San Diego region relied on local surface
water runoff in normal and wet weather years and on groundwater pumped from local
aquifers during dry years when stream flows were reduced. In 1947, water began to be
imported from the Colorado River via a single pipeline that connected to MWD’s
Colorado River Aqueduct.
Since 1950, the SDCWA became more reliant on imported water supplies from MWD to
meet the needs of its member agencies. After experiencing severe shortages from
MWD during the 1987-1992 drought, the SDCWA began aggressively pursuing actions
to diversify the region’s supply sources. These include the Water Conservation and
Vallecitos Water District 2010 Urban Water Management Plan Page 4-6
Transfer Agreement with the Imperial Irrigation District in 1998, the lining of the All-
American and Coachella Canals, the purchase of a water supply from the Carlsbad
Desalination Project, planning efforts for a new regional desalination project located on
Camp Pendleton, and feasibility evaluation of a bi-national seawater desalination project
in Rosarito, Mexico.
4.2.2 SDCWA Supplies
Imported water supplies are delivered to the SDCWA member agencies through a
system of large-diameter pipelines, pumping stations, and reservoirs. The pipelines that
deliver supplies from MWD are divided into two aqueduct alignments, both of which
originate at Lake Skinner in southern Riverside County and run in a north to south
direction through the SDCWA service area. MWD’s ownership of these pipelines
extends to a “delivery point” six miles into San Diego County. From there, Pipelines 1
and 2 comprise the First Aqueduct, which reaches from the delivery point to the San
Vicente Reservoir. These two pipelines share five common tunnels and operate as a
single unit to provide 180 cubic feet per second (cfs) of conveyance capacity. Pipelines
3, 4, and 5 form the Second Aqueduct. These pipelines, which are located several
miles to the west of the First Aqueduct, have delivery point capacities as follows:
Pipeline 3 provides 280 cfs; Pipeline 4 provides 470 cfs; and Pipeline 5 provides 500
cfs.
The SDCWA has also focused on developing local and alternate water supplies. In
1993, the SDCWA completed a Water Resources Plan and updated it in 1997 to
emphasize the development of local supplies and core water transfers. The SDCWA’s
2010 UWMP identified additional water supply strategies. These projects are discussed
in further detail below.
SDCWA-Imperial Irrigation District Water Conservation and Transfer Agreement
From 1998 to 2003, the SDCWA entered into a series of agreements to obtain a portion
of the Imperial Irrigation District’s allocation of Colorado River water.
On April 29, 1998, the SDCWA entered into a Water Conservation and Transfer
Agreement with the Imperial Irrigation District for the long-term transfer of
conserved Colorado River water to San Diego County.
On October 10, 2003, this agreement was amended to lessen environmental
impacts due to the water transfer and to be consistent with the terms and
conditions of the 2003 Quantification Settlement Agreement.

Vallecitos Water District 2010 Urban Water Management Plan Page 4-7
Also on October 10, 2003, SDCWA entered into a water exchange agreement
with MWD to transport this water from the Colorado River to San Diego County.
Under the agreement, MWD takes delivery of the transfer water though the
Colorado River Aqueduct. In exchange, MWD delivers to the SDCWA a like
quantity and quality of water.
The series of agreements resulted in the SDCWA initially receiving 10,000 AFY of water
from the Imperial Irrigation District in 2003, with the volume increasing annually until it
reaches 200,000 AFY in 2021. In 2010, the SDCWA received 70,000 acre-feet (AF) of
water. The initial term of the transfer agreement is 45 years, with a provision that either
agency may extend the agreement for an additional 30-year term.
More information regarding the project’s cost and financing, the Quantification
Settlement Agreement or other related contracts can be found in the Water Supply
sections of MWD’s 2010 Regional Urban Water Management Plan and SDCWA’s 2010
Urban Water Management Plan.
All-American Canal and Coachella Canal Lining Projects
As part of the 2003 Quantification Settlement Agreement, the SDCWA contracted for
77,700 AFY of conserved water from projects that lined portions of the All-American and
Coachella Canals. Deliveries of conserved water from the Coachella Canal reached the
region in 2007 and deliveries from the All-American Canal reached the region in 2010.
The project reduced the loss of water that
occurred through seepage, and the
conserved water is now delivered to the
SDCWA.
The Coachella Canal project constructed a
37-mile long parallel canal adjacent to the
existing Coachella Canal. The lining of the
All-American Canal project constructed a
concrete-lined canal parallel to the 24 miles
of the existing All-American Canal. The
combined conserved water from both
projects will provide the San Diego region
with an additional 8.5 million acre-feet over the 110-year life of the agreement.
The October 10, 2003 exchange agreement between the SDCWA and MWD provides
for the delivery of conserved water from the canal lining projects. SDCWA pays MWD
Coachella Canal lining project

Vallecitos Water District 2010 Urban Water Management Plan Page 4-8
SDCWA’s Twin Oaks Valley Water Treatment Plant
applicable wheeling rates. In the exchange agreement, MWD will deliver the canal
lining water for the entire 110-year term of the Allocation Agreement.
More information on the cost and financing, contracts and other information related to
All-American Canal and Coachella Canal Lining Projects can be found in the Water
Supply sections of MWD’s 2010 Regional Urban Water Management Plan and
SDCWA’s 2010 Urban Water Management Plan.
Carlsbad Seawater Desalination Facility
To continue to diversify its future water resource portfolio, the SDCWA identified
seawater desalination as a potential supply for meeting future demands. The SDCWA is
pursuing the purchase of water supply from the Carlsbad Desalination Facility; a fully-
permitted, private desalination project at the Encina Power Station site in the City of
Carlsbad. The project is being proposed to be constructed and fully-funded by a private
company known as Poseidon Resources Corporation.
When complete, the project will provide a highly reliable local supply of 56,000 AFY of
supply for the region, available in both normal and dry hydrologic conditions. A 54-inch
pipeline will be constructed to convey product water from the desalination plant 10.5
miles east to the SDCWA’s Second Aqueduct. The water will then
be conveyed 5 miles north to the SDCWA’s Twin
Oaks Valley Water Treatment Plant facility,

Vallecitos Water District 2010 Urban Water Management Plan Page 4-9
where it will be blended with treated imported water and subsequently distributed into
SDCWA’s existing aqueduct system.
Under the terms and conditions of the draft agreement between the SDCWA and
Poseidon Resources Corporation, the SDCWA would purchase the entire output of
56,000 AFY from the project at a price based on the cost of production. A preliminary
September 2010 unit cost estimate was $1,600 per AF. The project is expected to be
completed and online by early 2016.
More information on cost and financing, contracts, and other information related to the
Carlsbad Seawater Desalination Facility can be found in the Section 4 of the SDCWA’s
2010 UWMP.
Other Seawater Desalination Efforts
In June 2009, the SDCWA, in collaboration with the Marine Corps Base at Camp
Pendleton, completed a feasibility study for a potential 50 to 150 MGD seawater
desalination project on Camp Pendleton. The feasibility study provided an analysis on
new facilities, environmental and permitting requirements, cost estimates, and
implementation issues.
At a special meeting in May 2009, the SDCWA Board approved funding in the amount
of $5.72 million to conduct further planning work for this project, including seawater
intake analysis, hydrogeological and marine environment studies, and studies on
product water conveyance and integration for the Camp Pendleton project. These
studies are expected to be underway by early 2011 and completed by the end of 2012.
Results from the studies will be incorporated into the SDCWA’s 2012 Regional Water
Facilities Optimization and Master Plan Update. The earliest online date of a potential
Camp Pendleton desalination project is 2020.
The SDCWA is also participating with U.S. and Mexican agencies in a bi-national review
of potential water management and water supply programs that could benefit Colorado
River water users of both countries. As part of this effort, a bi-national workgroup
formed to study potential new water supplies, recommended the evaluation and
preliminary design of an initial 25 MGD (expandable to 50 MGD) seawater desalination
plant that would be located at Rosarito Beach in Baja California, Mexico. U.S. water
agencies, including the SDCWA, MWD, Southern Nevada Water Authority, and the
Central Arizona Water Conservation District, have collaborated to fund a feasibility
evaluation and preliminary design of the plant. The SDCWA agreed to administer the
consultant selection process and serve as project manager for the project.

Vallecitos Water District 2010 Urban Water Management Plan Page 4-10
Currently, the Rosarito Beach Desalination Project is considered a conceptual-level
project. If built, product water from the plant would be available to both U.S. and
Mexican water users. For U.S. water users, the water could be delivered either directly
to the San Diego region, using a cross-border pipeline, or possibly by exchange, with
Mexican users taking delivery of the product water and leaving an equivalent amount of
Colorado River water available for U.S. users.
4.3 Vallecitos Water District Supplies
VWD is committed to providing a reliable and fiscally sound water supply to its
customers. VWD forecasts that continued growth in population and economic activity
within its service area will lead to increased water demands relative to current
conditions, and the need for additional water supplies to serve these demands.
4.3.1 Current Sources of Supply
VWD obtains 100 percent of its water supply from the SDCWA, of which it is one of 24
member agencies. VWD anticipates relying on the SDCWA for 100 percent of its water
supply in the foreseeable future, as shown in Table 4-1. VWD receives water from the
SDCWA through five potable water connections (turnouts) to the SDCWA aqueduct
system as shown in Figure 4-1. Table 4-2 lists the location, capacity, and the average
annual delivery to VWD for each connection.
Table 4-1: VWD Water Supply – Existing and Planned Sources of Water
Wholesale Sources Contracted
Volume (2010)1
20151 2020
1 2025
1 2030
1
San Diego County Water Authority
16,308 27,109 30,134 32,598 34,951
1In units of acre-feet per year

900Tres Amigos
1059
1608San Marcos
Mountain
North1228
North1228
North1228
1608Coggan
1235Deer Springs
1500PalosVista
1028Twin Oaks
920Richland
855
1530Coronado
Hills1115
1320
1530San Elijo
877Las Posas
622Zone
815Meadowlark
664686
1125
1275La Cienega 1380
1071
1567Wulff
*
*
’
’
’
’
’
’ ’
’
’
’
’
’
’
’
’
’
’
’
MOUNTAIN BELLE
NORTH
DEER SPRINGS #1
TWIN OAKS #1& #2
COGGAN
N TWIN OAKS #2
WULFF #1
PALOS VISTA
RICHLAND #1 & #2PALOMAR
CORONADO HILLS #1
VIA VERA CRUZ
DOUBLE PEAK
SAGE CANYON
MEADOWLARK #1 & #2 SCHOOLHOUSE
N TWIN OAKS #1
!"a$
A©
A
6/20/2011 KC SD Z:\Projects\IS\VallecitosWaterDistrict\UWMP\mxd\20411_ExistingSystem_W_Fig_4-1.mxd
San Marcos Blvd
Ran
cho
Santa
Fe
Rd
Mission Rd
Tw
in O
aks V
al le
y R
d
Buena Creek Rd
Vista Irrigation District
Carlsbad MWD
Olivenhain MWD
Valley Center MWD
Rincon del Diablo MWD
Rainbow MWD
Deer S
prings
Rd
SOURCE: LAFCO SOI - Affirmed 08-06-2007VWD GIS Data - 07-17-2008, provided by District
Ü0 1.5
Miles
Old Castle RdGopher Canyon Rd
EXISTING WATER SYSTEMFIGURE 4-1
Reservoir’
* Future Zone
Legend
VWD Sphere of Influence
SDCWA Flow Control Facility#
Vallecitos Water District
2010 Urban Water Management Plan
City of Escondido

Vallecitos Water District 2010 Urban Water Management Plan Page 4-12
Table 4-2: VWD Water Supply Connections
Connection Location
Capacity
2010 Average
Delivery to VWD
(cfs)1 (MGD)
2 (gpm)
3 (MGD)
VAL 2 First Aqueduct 12 8 200 0.3
VAL 7 Second Aqueduct, south edge of VWD 40 26 1,800 2.5
VAL 8
Second Aqueduct, off North County
Distribution Pipeline, northwest corner of
VWD
11 7 200 0.3
VAL 9 Second Aqueduct, center of VWD, south of
Twin Oaks Diversion Structure 30 19 1,400 2.0
VAL 10 Second Aqueduct, north-center of VWD,
north of Twin Oaks Diversion Structure 60 39 6,100 8.8
Total 9,700 13.9
Source: VWD 2010 Monthly Operations Report 1 cfs = cubic feet per second
2 MGD = million gallons per day
3 gpm = gallons per minute
4.3.2 Vallecitos Water District’s Water System
Today, VWD serves a 45-square mile potable water service area with a population of
approximately 87,700 people. VWD has approximately 21,500 meters that deliver over
15,500 acre-feet per year of potable water to a mix of residential, commercial, industrial,
and agricultural customers.
VWD operates and maintains 26 pressure zones to serve customers with appropriate
system pressures. The varied topography of VWD dictates a wide range of pressure
zones ranging from a 622-foot hydraulic grade to a 1608-foot hydraulic grade. Their
approximate boundaries are shown in Figure 4-1. These pressure zones are supplied
from the SDCWA connections through a network of pump stations, reservoirs, and
pressure reducing stations. Pressure zones within VWD are named by the downstream
valve setting or base elevation of the tank. The Northern Pressure Zones primarily
receive water from the VAL 8 and VAL 10 connections. The Central Pressure Zones
primarily receive water from the 1028 Twin Oaks Reservoirs via VAL 10 and two large
pressure reducing stations, and can also receive water from the VAL 9 and VAL 2
connections. The Southern Pressure Zones primarily receive water from the VAL 7
connection.

Vallecitos Water District 2010 Urban Water Management Plan Page 4-13
Pump Stations
VWD currently operates nine pump stations (including the Meadowlark Hydropneumatic
Pump Station), which all feed directly to storage tanks in the system. Table 4-3
summarizes the hydraulic grade line and operational capacity at each existing pump
station. The operational capacity is defined as the capacity of the pump station with the
largest pump out of service.
Table 4-3: VWD Existing Pump Station Summary
Source: VWD 2008 Water, Wastewater, and Recycled Water Master Plan
Pump Station
Hydraulic Grade (ft) Operational Capacity
From To gpm MGD
Northern Pump Stations
Deer Springs 1028 1235 1,550 2.23
North Twin Oaks 1028 1330 2,000 2.88
Wulff 1235 1567 1,000 1.44
Coggan 1028 1608 4,000 5.76
Central Pump Stations
Palos Vista 920 1500 3,375 4.86
South Lake 920 1530 2,200 3.17
Southern Pump Stations
Meadowlark Hydro 815 930 470 0.68
Schoolhouse 877 1115 2,100 3.02
Double Peak 1115 1530 1,050 1.51

Vallecitos Water District 2010 Urban Water Management Plan Page 4-14
Reservoirs
Reservoirs serve four critical
water storage needs: operational
storage for daily use; fire flow
storage; and both in-zone
emergency storage and storage
during aqueduct shutdowns. VWD
operates and maintains 20
potable water reservoirs, which
are listed in Table 4-4. This table
includes the size, age, and floor
elevation for each reservoir. The
total existing storage capacity for
VWD’s potable water system is
121.6 million gallons (MG).
VWD’s Double Peak Reservoir

Vallecitos Water District 2010 Urban Water Management Plan Page 4-15
Table 4-4: VWD Existing Reservoir Summary
Pressure Zone
Facility ID (Name)
Year
Built
Height
(ft)
Diameter
(ft)
Capacity
(MG) Elevation Name
Northern Reservoirs
900 Tres Amigos Mountain Belle 1996 24 134 2.5
1028 Twin Oaks Twin Oaks Reservoir #1 2000 38 388 33.0
Twin Oaks Reservoir #2 2007 38 432 40.0
1228 North 1228 North 1977 40 74 1.3
1235 Deer Springs Deer Spring 1961 32 55 0.6
1330 North Twin
Oaks
North Twin Oaks
Reservoir #1 1961 32 55 0.6
North Twin Oaks
Reservoir #2 2007 32 138 3.6
1567 Wulff Wulff 1961 24 26 0.1
1608 Coggan Coggan 1977 40 74 1.3
Total North 82.9
Central Reservoirs
920 Richland
Richland #1 1961 32 82 1.3
Richland #2 1981 30 200 7.0
Palomar 1989 32 120 2.7
Via Vera Cruz 1987 30 200 7.0
1500 Palos Vista Palos Vista 1991 33 143 4.0
Total Central 22.0
Southern Reservoirs
815 Meadowlark Meadowlark #1 1961 32 82 1.3
Meadowlark #2 1979 32 120 2.7
877 Las Posas Sage Canyon 2001 38 129 3.7
1115 1115 Schoolhouse 2001 32 116 2.5
1530 Coronado Hills Coronado Hills 1981 36 110 2.6
Double Peak 2006 36 135 3.9
Total South 16.6
Total 121.6
Source: VWD 2008 Water, Wastewater, and Recycled Water Master Plan

Vallecitos Water District 2010 Urban Water Management Plan Page 4-16
Distribution System Pipelines
VWD maintains over 323 miles of water pipelines ranging in size from 4-inches to 48-
inches in diameter. Table 4-5 includes an inventory of material types, sizes and range
of age by material. In general, the pipelines are predominantly asbestos cement pipe
(ACP) and ductile iron pipe (DIP), and the majority of VWD’s system has been installed
since the 1960s and thus should have many years of remaining functionality based on
the expected useful life of the pipe materials.
Table 4-5: VWD Water Distribution Pipeline Inventory
Pipe
Type
Lineal Diameter Pipe Length by Decade
Feet Min Max Unknown 1950s 1960s 1970s 1980s 1990s 2000s
ACP 937,084 4 30 44 118,082 151,781 190,154 232,625 241,487 2,913
DIP 500,546 4 48 18,540 0 58 0 43 23,701 458,204
Steel,
Cement
Mortar
Lined and
Coated
380,841 4 48 0 32,804 59,675 49,615 62,752 119,450 56,545
Steel,
Cement
spiral-
wrapped
6,306 8 14 0 6,153 0 0 0 0 154
Total 1,824,778 -- -- 18,584 157,039 211,514 239,769 295,420 384,638 517,815
Source: VWD 2008 Water, Wastewater, and Recycled Water Master Plan
Interagency Service Agreements
VWD provides potable water to the Olivenhain Municipal Water District (OMWD) and
the Carlsbad Municipal Water District (CMWD) from its SDCWA connection at VAL 7.
This service is provided through an interagency service agreement entitled,
“Construction of a Water Transmission and Storage System – Questhaven Pipeline”,
dated July 1, 1978 and its supplement dated September 1979, in which VWD is
designated as the lead agency. The locations of these interconnections are numbered
1 and 4, as shown on Figure 4-2.
By agreement, the OMWD capacity is limited to 6.47 MGD and the CMWD connection
capacity is limited to 8.61 MGD.

Vallecitos Water District 2010 Urban Water Management Plan Page 4-17
Emergency Connections
VWD has a total of 15 inter-agency service connections to neighboring water districts,
including the interagency service connections to OMWD and CMWD as previously
discussed. The remaining 13 are available to VWD only under emergency conditions.
VWD has emergency connections with the CMWD (1), Vista Irrigation District (8), the
City of Escondido (1), Rincon del Diablo Municipal Water District (1), Rainbow Water
District (1), and OMWD (1), as shown on Figure 4-2. These connections, listed below in
Table 4-6, are limited in their ability to deliver flows, and would be used for short term
outages within VWD or the neighboring agency.
Table 4-6: Emergency Interagency Connections
Reference
& Location
(see
Figure 4-2) Name
Size
(in)
Service to
Pressure
Zone
Approx.
Flow Rate
(gpm) System
Connecting
Agency
2 Melrose/Carlsbad Crosstie 8 VWD CMWD 815 900
3 Escondido Pump Connection 8 EWD VWD 920 1,000
5 San Elijo Hills Pump
Connection
8 OMWD VWD 877 2,000
6 Rincon del Diablo Crosstie 8 VWD Rincon 920 900
7 Rainbow Crosstie 8 VWD RMWD 900 1,800
8 Rees & El Norte VID Crosstie 8 VWD/VID VID/VWD 920 450
9 Mulberry Crosstie 6 VWD VID 920 900
10 Linda Vista/VID Crosstie
(Stone Gate PRV)
6 VWD VID 920 450
11 S. Santa Fe Crosstie 8 VWD VID 920 450
12 Capalina Crosstie 8 VWD VID 920 450
13 Ormsby Crosstie 8 VWD VID 900 450
14 Nordahl Crosstie 12 VWD VID 920 N/A
15 Knobhill/Center St Crosstie N/A VWD VID 920 N/A
Source: VWD 2008 Water, Wastewater, and Recycled Water Master Plan

ORMSBY
RAINBOW
MULBERRY
LINDA VISTA/VID
TRI-AGENCIES PIPELINE
SECONDAQUEDUCT
NORTH COUNTYDISTRIBUTION PIPELINE
CROSSOVER PIPELINE
FIRSTAQUEDUCT
!(
!(!(
!(
!(!(13 7
9
6
!(3
8
1415!(
10!(
!(1 2
!(
!(!(12
11
Gopher Canyon RdOld Castle Rd
Deer Sprin
gs R
d
Buena Creek Rd
Tw
in O
aks V
al le
y R
d
Ran
cho S
anta
Fe Rd
San Marcos Blvd
Mission Rd
Melrose Ave
Alga Rd
!(
4 5!(
ESCONDIDO PUMP
REES & EL NORTE VID
NORDAHL
KNOBHILL/CENTER ST
RINCONDEL DIABLO
S SANTA FE/VID
CAPALINA
SAN ELIJO HILLS PUMP
CMWD
OMWD
MELROSE/CARLSBAD
!"a$
A©
A
Vista Irrigation District
Carlsbad MWD
Olivenhain MWD
Valley Center MWD
Rincon del Diablo MWD
Rainbow MWD
Ü0 1.5
Miles
City ofEscondido
QuesthavenMWD
Legend
VWD Sphere of Influence
VWD Service Area
SDCWA Suppy Pipeline
!(
6/20/2011 KC SD Z:\Projects\IS\VallecitosWaterDistrict\UWMP\mxd\20411_Interconnects_Fig4-2.mxd
SOURCE: LAFCO SOI - Affirmed 08-06-2007VWD GIS Data - 07-17-2008, provided by District
Interconnect Point
INTER-AGENCY ANDEMERGENCY SERVICE CONNECTIONS
FIGURE 4-2
Vallecitos Water District
2010 Urban Water Management Plan

Vallecitos Water District 2010 Urban Water Management Plan Page 4-19
4.3.3 Recycled Water
Although VWD produces up to 5 MGD of recycled water at the Meadowlark Water
Reclamation Facility (MRF) and maintains the 54 million-gallon (MG) Mahr Reservoir,
VWD does not maintain a recycled water service area within its sphere of influence. All
of the recycled water produced at MRF is sold to the CMWD and the OMWD. CMWD
originally contracted for up to 2.0 MGD during peak summer months, and in 2003,
increased that amount to 3.0 MGD. As part of that agreement, VWD also provides
CMWD with 32 MG of recycled water storage in the Mahr Reservoir. Also in 2003, the
OMWD contracted for up to 1.5 MGD of recycled water and 16 MG of recycled water
storage in the Mahr Reservoir. Excess recycled water produced at MRF is disposed of
through a failsafe pipeline that connects to the ocean outfall at the Encina Water
Pollution Control Facility (EWPCF).
4.3.4 Supply Alternatives
VWD’s IRP identified several water supply alternatives. This section details those
improvements that the IRP recommended for further study, including:
1. Seawater Desalination
2. Recycled Water Purchases from the City of Escondido
3. Expanded Transmission Capacity from VAL 2 Connection
4. Treated Water Purchases from the Escondido-Vista Water Treatment Plant
5. Treated Water Purchases from the Olivenhain Water Treatment Plant
6. Treated Water Purchases from the City of Oceanside’s Weese Water Treatment
Plant
Table 4-7 summarizes the water supplies that could be realized from each of these
alternatives and possible constraints. It is important to note that all of these alternatives
are considered concept-phase only and are not required to meet VWD’s demands
discussed in Section 2.

Vallecitos Water District 2010 Urban Water Management Plan Page 4-20
Table 4-7: Concept Future Water Supply Projects
Project Name Projected Start Date
Projected Completion
Date
Potential Project
Constraints
Normal-Year
Supply1
Single-Dry Year
Supply1
Multiple-Dry Year Supply
1
Seawater Desalination
2
11/13/09 2016
Private financing issues; Likely to be acquired by the SDCWA
7,500 7,500 7,500
Recycled Water Purchases from Escondido
Not Specified
Not Specified
Not cost-effective and low water yield
477 477 477
Expanded Capacity from VAL 2
Not Specified
Not Specified
Not likely to occur due to cost; Would not produce a new local water supply
8,000 Not
Determined Not
Determined
Water Purchases from Escondido-Vista Treatment Plant
Not Specified
Not Specified
Not likely to occur due to cost; Would not produce a new local water supply
3,500 to 8,500
Not Determined
Not Determined
Water Purchases from Olivenhain Treatment Plant
Not Specified
Not Specified
Not likely to occur due to cost; Would not produce a new local water supply
3,550 to 5,500
Not Determined
Not Determined
Water Purchases from Oceanside’s Treatment Plant
Not Specified
Not Specified
Not likely to occur due to cost; Would not produce a new local water supply
325 to 9,800
Not Determined
Not Determined
1In units of acre-feet per year
2Also being considered for acquisition by the SDCWA (see page 4-8)
Seawater Desalination
VWD has signed a water purchase agreement with Poseidon Resources Corporation to
obtain up to 7,500 AFY of treated water from the proposed Carlsbad Seawater
Desalination Facility, and may be interested in increasing this amount if possible. At
7,500 AFY, desalinated water would make up approximately 35 percent of VWD’s
supply at current demand levels. VWD anticipates receiving delivery of this supply at its
existing VAL 9 connection, as shown in Figure 4-3.
The purchase price for the desalinated water would be set at or below the purchase
price of treated water from the SDCWA. As a new local water supply independent of
the imported water delivery system, seawater desalination would provide a highly
reliable addition to VWD’s supply portfolio. This supply would be available during
droughts, during an emergency event that may lead to the failure of the SDCWA

Vallecitos Water District 2010 Urban Water Management Plan Page 4-21
Carlsbad State Beach -
Located adjacent to the proposed
Carlsbad Seawater Desalination Facility
aqueduct pipelines, or during other prolonged reductions in imported water deliveries.
This would increase VWD’s supply reliability during drought and emergency conditions.
As stated in Section 4.2.2, the
SDCWA is considering purchase of
the entire 56,000 AFY desalinated
water supply from the Carlsbad
Seawater Desalination Facility.
VWD has requested a direct
connection to the desalinated water
distribution main next to its VAL 9
turnout if this were to occur. This
could allow VWD to take water from
the desalination plant directly as an
alternative water supply. Seawater
desalination offers the advantage of
being a highly reliable supply and
immune from the effects of
prolonged drought and SDCWA
aqueduct shutdowns.

VAL 9
VAL 2
VAL 10
VAL 8
#VAL 7
TRI-AGENCIES PIPELINE
SECONDAQUEDUCT
NORTH COUNTYDISTRIBUTION PIPELINE
CROSSOVER PIPELINE
FIRSTAQUEDUCT
#
#
#
#
!"a$
A©
A
6/20/2011 KC SD Z:\Projects\IS\VallecitosWaterDistrict\UWMP\mxd\20411_DesalConvy_F4-3.mxd
San Marcos Blvd
Ran
cho S
anta
Fe
Rd
Mission Rd
Tw
in O
aks V
al le
y R
d
Buena Creek Rd
Vista Irrigation District
Carlsbad MWD
Olivenhain MWD
Valley Center MWD
Rincon del Diablo MWD
Rainbow MWD
Deer Sprin
gs Rd
SOURCE: LAFCO SOI - Affirmed 08-06-2007VWD GIS Data - 07-17-2008, provided by District
Old Castle RdGopher Canyon Rd
City ofEscondido
QuesthavenMWD
Ü0 1.5
Miles
CARLSBADSEAWATER DESALINATED
WATER CONVEYANCEFIGURE 4-3
Legend
VWD Service Area
VWD Sphere of Influence
Desal Conveyance Pipeline
SDCWA Supply Pipeline
Flow Control Facility#
Vallecitos Water District
2010 Urban Water Management Plan

Vallecitos Water District 2010 Urban Water Management Plan Page 4-23
Recycled Water Purchases from the City of Escondido
To offset potable water use, VWD could potentially purchase recycled water from the
City of Escondido’s Hale Avenue Resource Recovery Facility (HARRF), an 18.0-MGD
treatment facility located in the southwest section of Escondido, and construct facilities
to deliver this water to customers within the VWD service area. HARRF currently
produces 4.0 MGD of tertiary treated recycled water for landscape and industrial use.
There are sufficient potential uses and customers within Escondido and the Rincon del
Diablo Municipal Water District service areas for the recycled water.
Escondido’s 2005 Urban Water Management Plan states: “The City’s inland location
and accessibility to both agriculture and urban users provides an excellent opportunity
to expand recycled water deliveries to customers adjacent to Escondido as well as
downstream.” Escondido plans to expand the plant incrementally to increase
production as customer demand increases in future years and is currently conducting a
pilot study to improve the dissolved mineral quality of the recycled water.
Escondido’s recycled water distribution system extends from a 16-inch pipeline in North
Broadway, to a 12-inch pipeline in Country Club Lane. The 12-inch line extends west
under Interstate 15 to just north of El Norte Parkway, and to the VWD boundary.
Pumping and additional storage may be required to distribute the recycled water within
the VWD service area, depending on the location of the customers and volume of
recycled water served. Figure 4-4 illustrates possible routes for extending recycled
water service to portions of VWD’s service area. Several parks and schools could be
served by extending the recycled water system along Borden Road and south on
Woodland Parkway. Approximately 500 AFY of recycled water demand was identified.
Recycled water purchases from Escondido offer the advantage of being a highly reliable
supply and immune from the effects of prolonged drought and SDCWA aqueduct
shutdowns.

!(
!(
!(!(
!(
!(!(
!(
!(
!(
!(
!(
!(
!(
!(!(!(!(
!(
!(!(
!(
!(
!(
!(
!(
!(
!(
!(!(
!(
!(
!(!(!(
!(!(
!(
!(!(
!(
!(
!(
!(
!(
!(!(
!(
!(
!(
!(
!(
!(
!(
!(
!(
!(!(
!(
!(!(!(
!(
!(
!(
!(
!(
!(
!(
!(!(
!(
!(!(
!(
!(!(
!(
!(
!(
!(
!(
!(
!(
!(!(
!(
!(
!(
!(!(
!(!(
!(
!(!(
!(!(
!(
!(
!(!(!(
!(
!(!(
!(!(
!(
!(
!(
!(
!(!(
!(
!(
!(!(!(
!(
!(
!(
!(!(
!(!(
!(
!(
!(
!(
!(
!(
!(
!(
!(
!(
!(
!(!(!(
!(
!(
!(
!(
!(
!(!(!(
!(!(
!(
!(
!(
!(
!(
!(
!(!(
!(
!(
!(!(
!(
!(
!(!(
!(!(
!(
!(
!(!(
!(
!(
!(
!(
!(
!(
!( !(
!(
!(
!(
!(!(!(
!(!(
!(!(
!(
!(
!(!(
!(!(!(
!(!(
!(!(
!(!(
!(
!"a$
A©
East Mission Road
Borden Road
El Norte Parkway
Woo
dlan
d Pa
rkw
ay
Woodl an
d H
eights Glen
Country Club Lane
Borden Road
Rose Ranch Road
East La Cienaga Road
Nor
th T
wi n
Oak
s Va
lley
Roa
d
Community Church
San Marcos UnifiedSchool District
San Marcos UnifiedSchool District
San Marcos UnifiedSchool District
WoodlandPark
North CountyCemetery District
Twin Oaks County Club
EscondidoHighlands
5/09/2011 Z:\Projects\IS\VallecitosWaterDistrict\uwmp\20411_Meters4RecycledWater_F4-4.mxd
Irrigation Meters
!( <10 AFY (2007/2008)
!( 10-20 AFY (2007/2008)
!( >20 AFY (2007/2008)
Existing Recycled Water Main
Recycled Segment A (3.38 Miles)
Recycled Segment B (2.75 Miles)
Recycled Segment C (2.74 Miles)
VWD Sphere of Influence Boundary
!"a$
!"a$
A©
A
0 1,500FeetSCALE IN FEET
ÜESCONDIDO RECYCLED WATERCONVEYANCE ALTERNATIVES
FIGURE 4-4
Vallecitos Water District2010 Urban Water Management Plan

Vallecitos Water District 2010 Urban Water Management Plan Page 4-25
Expanded Transmission Capacity from VAL 2 Connection
Under this alternative, VWD would expand its transmission capacity from its VAL 2
connection, which is its lone connection to the SDCWA First Aqueduct. This project
would not provide new supply to VWD, but could help improve operational flexibility and
reliability during SDCWA Second Aqueduct service outages.
The existing transmission pipeline has a diameter of 18-inches and extends
approximately 12,500 feet from the VAL 2 connection in the City of Escondido to the
eastern portion of VWD’s 920 Zone. The pipeline diameter and hydraulic conditions
result in a delivery capacity to the 920 Zone of approximately 10 to 11 cfs (4,500 to
5,000 gpm). The facility is shown in Figure 4-5.
Replacing the 18-inch diameter pipeline with a new 24-inch diameter pipeline would
double the transmission capacity to approximately 22 cfs (10,000 gpm). The current
VAL 2 connection, rated at 12 cfs (5,500 gpm), would need to be expanded to 22 cfs
(10,000 gpm) to match the delivery capacity of the new 24-inch transmission pipeline.
Absorbing this much flow into the 920 Zone would likely require VWD to construct a
pumping station facility to transfer water from the 920 Zone to the 1028 Zone. The
combination of the expanded transmission capacity from the SDCWA First Aqueduct
and the ability to move water out of the 920 Zone into the 1028 Zone would allow VWD
to operate independent of the SDCWA Second Aqueduct for days or weeks at a time,
depending on seasonal demand conditions.

VAL 9
VAL 2
VAL 10
VAL 8
#VAL 7
TRI-AGENCIES PIPELINE
SECONDAQUEDUCT
NORTH COUNTYDISTRIBUTION PIPELINE
CROSSOVER PIPELINE
FIRSTAQUEDUCT
#
#
#
#
!"a$
A©
A
5/09/2011 KC SD Z:\Projects\IS\VallecitosWaterDistrict\UWMP\mxd\20411_VAL2_TransPL_F4-5.mxd
San Marcos Blvd
Ran
cho S
anta
Fe
Rd
Mission Rd Tw
in O
aks V
alle
y R
d
Buena Creek Rd
Vista Irrigation District
Carlsbad MWD
Olivenhain MWD
Valley Center MWD
Rincon del Diablo MWD
Rainbow MWD
Deer Sprin
gs Rd
SOURCE: LAFCO SOI - Affirmed 08-06-2007VWD GIS Data - 07-17-2008, provided by District
Old Castle RdGopher Canyon Rd
City ofEscondido
QuesthavenMWD
Ü0 1.5
Miles
VAL 2 TRANSMISSIONPIPELINEFIGURE 4-5
Legend
VWD Service Area
VWD Sphere of Influence
SDCWA Supply Pipeline
VAL2 Transmission Pipeline
Flow Control Facility#
Vallecitos Water District
2010 Urban Water Management Plan

Vallecitos Water District 2010 Urban Water Management Plan Page 4-27
Treated Water Purchases from the Escondido-Vista Water Treatment Plant
Under this alternative, VWD would arrange to purchase treated water from the
Escondido-Vista Water Treatment Plant (WTP), for delivery to VWD via the Vista Flume.
These facilities are owned and operated by the City of Escondido and the Vista
Irrigation District. Within this alternative are scenarios relative to whether VWD obtains
capacity rights in the treatment and delivery facilities, as described below:
Surplus Purchases without Capacity Rights: The simplest scenario would be
where VWD does not purchase capacity rights in either the Escondido-Vista
WTP or the Vista Flume, but merely purchases surplus flows of treated water as
may be available. VWD would construct permanent facilities to allow for delivery
from the Vista Flume into its 920 Zone. Pumping may be required. This scenario
would be of limited reliability benefit to VWD, in that absent capacity rights it
could not count on water being available when needed, such as during an
aqueduct shutdown. This scenario might be considered simply on the merits of
its costs in comparison to VWD’s treated water purchases from the SDCWA.
Purchases with Capacity Rights in the Vista Flume or in both the Vista
Flume and the Escondido-Vista WTP: The other scenario would be where
VWD worked with the Vista Irrigation District or with both the Vista Irrigation
District and the City of Escondido to obtain capacity rights in the Vista Flume or
in both the Vista Flume and the Escondido-Vista WTP. This would provide VWD
with the assurance of a reliable supply as long as raw imported water remained
available to the Escondido-Vista WTP.
A logical third variation would be where VWD also obtained capacity rights to the City of
Escondido and Vista Irrigation District’s raw water storage at Lake Henshaw, Lake
Wolford, and Lake Dixon, and possibly to their associated water rights for diversion,
storage, and use of local waters of the San Luis Rey River. These water rights and
storage reservoirs provide their owners with the additional reliability benefit of being
available to deliver water to the Escondido-Vista WTP even during a total interruption of
imported water deliveries from the SDCWA. However, the City of Escondido and Vista
Irrigation District have advised VWD that they are not interested in considering making
these rights available to entities outside their service areas.
This alternative would not provide a new local water supply, but would provide for an
increment of treated water supply independent of the SDCWA’s treated water
aqueducts.

Vallecitos Water District 2010 Urban Water Management Plan Page 4-28
Treated Water Purchases from the Olivenhain Water Treatment Plant
Under this alternative, VWD would arrange to purchase treated water from the
Olivenhain WTP for delivery via the existing Vallecitos-Carlsbad-Olivenhain Tri-
Agencies Pipeline. This capacity could help improve operational flexibility and reliability
during SDCWA First and Second Aqueduct service outages. The Olivenhain WTP is
owned and operated by the OMWD. Within this alternative are two scenarios relative to
whether VWD obtains capacity rights in the treatment plant, as described below:
Surplus Purchases without Capacity Rights: The simplest variation would be
where VWD does not purchase capacity rights in the Olivenhain WTP, but merely
purchases surplus flows of treated water as may be available. This variation
would be of limited reliability benefit to VWD in that absent capacity rights, it
could not count on water being available when needed, such as during an
aqueduct shutdown. This project variation might be considered simply on the
merits of its costs in comparison to VWD’s treated water purchases from the
SDCWA.
Purchases with Capacity Rights in the Olivenhain WTP: This variation would
be where VWD worked with OMWD to obtain capacity rights in the Olivenhain
WTP. This would provide VWD with the assurance of reliable supply as long as
raw imported water remained available to the Olivenhain WTP.
This alternative would not provide a new local water supply, but would provide for an
increment of treated water supply independent of the SDCWA’s treated water
aqueducts.
Treated Water Purchases from the City of Oceanside’s Weese Water Treatment Plant
Under this alternative, VWD would arrange to purchase treated water from the City of
Oceanside’s Weese WTP, for delivery via VWD’s existing VAL 8 connection on the
North County Distribution Pipeline. Within this alternative are two scenarios relative to
whether VWD obtains capacity rights in the treatment plant.
Surplus Purchases without Capacity Rights: The simplest variation would be
where VWD does not purchase capacity rights in the Weese WTP, but merely
purchases surplus flows of treated water as may be available. Existing
interconnect facilities allow for a maximum delivery at VWD’s VAL 8 connection
of up to 11 cfs (5,000 gpm), but in practice deliveries are limited to the
approximately 0.3 MGD (200 gpm) average daily demand of the 900 Zone. VWD

Vallecitos Water District 2010 Urban Water Management Plan Page 4-29
would need to construct a pump station to allow additional deliveries at the VAL 8
connection. This variation would be of limited reliability benefit to VWD, in that
absent capacity rights in the Weese WTP it could not count on water being
available when needed, such as during an aqueduct shutdown. This project
variation might be considered simply on the merits of its costs in comparison to
VWD’s treated water purchases from the SDCWA.
Purchases with Capacity Rights in Weese WTP: The next variation would be
where VWD worked with the City of Oceanside to obtain capacity rights in the
Weese WTP. This would provide VWD with the assurance of reliable supply as
long as raw imported water remained available to the Weese WTP.
This alternative would not provide a new local water supply, but would provide for an
increment of treated water supply independent of the SDCWA’s treated water
aqueducts.
4.3.5 Groundwater Feasibility
Historically, local groundwater supplies have not been used by VWD due to
questionable quantity and relatively poor quality. In 1996, a draft groundwater feasibility
analysis was performed for VWD to determine the quantity and quality of groundwater
potentially available for use as a local groundwater supply source.
The draft groundwater feasibility analysis determined that the volume of water stored in
the fractured bedrock aquifer beneath the VWD service area likely ranges between
97,000 and 389,000 acre-feet. The estimated volume of water stored in the combined
alluvium and residuum units likely ranges between 9,700 and 38,600 acre-feet.
Groundwater yields for wells would likely be small, averaging about 114 gallons per
minute.
Groundwater quality in the aquifer is characterized by moderately high levels of total
dissolved solids and occurrences of relatively high concentrations of bicarbonate,
sodium, chloride and nitrate. The groundwater would require treatment prior to
introduction into VWD’s potable water distribution system.
The draft groundwater feasibility analysis concluded that the storage capacity of the
alluvium and residuum is too small to be considered as a long-term source, although the
fractured bedrock aquifer may be considered further as a possible source. However,
the expected yields from wells in the VWD service area, combined with the water quality
issues that would need to be resolved, would not be likely to produce groundwater at an

Vallecitos Water District 2010 Urban Water Management Plan Page 4-30
economically viable rate even in the short-term. Therefore, groundwater is not a
planned source of water available to VWD.

Vallecitos Water District 2010 Urban Water Management Plan Page 5-1
Section 5: Water Quality
he California Urban Water Management Planning Act (Act) requires that
the 2010 Urban Water Management Plan (UWMP) include information,
to the extent practicable, on the quality of existing supply sources and the
manner in which water quality affects water supply reliability. It is the
responsibility of the Vallecitos Water District (VWD) is to protect the water
quality of the water entering its distribution system to report water quality
information to its customers and the regulatory agencies.
The potable water received by VWD from the San Diego County Water Authority
(SDCWA) is a blend from the Colorado River delivered via the Colorado River
Aqueduct, and from the Northern California’s Bay-Delta via the State Water Project.
This water is treated to meet stringent state and federal drinking water standards prior
to entering VWD’s distribution system. However, source water of degraded quality will
make it increasingly expensive and difficult to meet these standards.
This section summarizes water quality issues associated with supplies serving the San
Diego region. Information on Colorado River Aqueduct and the State Water Project
supplies came in part from Metropolitan Water District of Southern California’s (MWD’s)
2010 Regional UWMP.
5.1 Colorado River
The Colorado River is one of the two primary sources of VWD’s imported water supply.
High salinity levels, uranium, and perchlorate contamination represent the primary areas
of concern with the quality of Colorado River supplies. Managing the watershed of the
Colorado River has been the most effective method for controlling these elements of
concern.
5.1.1 Salinity
The salts in the Colorado River System are indigenous and pervasive, mostly resulting
from saline sediments in the basin that were deposited in prehistoric marine
environments. They are easily eroded, dissolved, and transported into the river system.
Agricultural development and water diversions over the past 50 years increase the
already high naturally occurring levels of Total Dissolved Solids (TDS).
T

Vallecitos Water District 2010 Urban Water Management Plan Page 5-2
The Colorado River Aqueduct
Water imported via the Colorado River
Aqueduct has a TDS averaging around 650
milligrams per liter (mg/l) during normal water
years. During the high water flows of 1983–
1986, salinity levels in the Colorado River
Aqueduct dropped to a historic low of 525 mg/l.
However, during the 1987–1990 drought,
higher salinity levels returned. During an
extreme drought, Colorado River Aqueduct
supplies could exceed 900 mg/l. High TDS in
water supplies leads to high TDS in
wastewater, which lowers the usefulness of
the water and increases the cost of recycled water. In addition to the link between
water supply and water quality, high levels of TDS in water supplies can damage water
delivery systems and home appliances.
To reduce the effects of high TDS levels on water supply reliability, MWD approved a
highly successful Salinity Management Policy in April 1999. One of the policy goals is
to blend Colorado River supplies with lower-salinity water from the State Water Project
to achieve delivered water salinity levels of less than 500 mg/l of TDS. In addition to
fostering interstate cooperation on this issue, the seven Colorado River basin states
formed the Colorado River Basin Salinity Control Forum (Forum). To lower TDS levels
in Colorado River supplies, the Forum develops programs designed to prevent a portion
of the abundant salt supply from moving into the river system. The Colorado River
Basin Salinity Control Program targets the interception and control of non-point sources,
such as surface runoff, as well as wastewater and saline hot springs.
5.1.2 Perchlorate
Perchlorate is used as the main component in solid rocket propellant, and it can also be
found in some types of munitions and fireworks. Perchlorate and other perchlorate salts
are readily soluble in water, dissociating into the perchlorate ion, which does not readily
interact with the soil matrix or degrade in the environment. The primary human health
concern related to perchlorate is its effects on the thyroid. Perchlorate has been
detected at low levels in MWD’s Colorado River Aqueduct water supply.
Because of the growing concerns over perchlorate levels in drinking water, MWD
adopted a Perchlorate Action Plan in 2002. As of December 2004, the amount of

Vallecitos Water District 2010 Urban Water Management Plan Page 5-3
perchlorate entering the Colorado River system has been reduced from approximately
1,000 pounds per day (lbs/day) to less than 90 lbs/day.
5.1.3 Uranium
Naturally occurring uranium has always been present in Colorado River water and has
always been under the California Maximum Contaminant Level (MCL) of 20 picocuries
per liter. The risks to water quality have primarily come from upstream mining in Moab,
Utah and other potential mining sites in the west. Currently the U.S. Department of
Energy is working to remove and dispose of mine tailings and improve groundwater
quality on the Colorado River Watershed near Moab. The expected completion of this
cleanup is between 2019 and 2025. Current levels are below MCL and can be treated
by regional water treatment plants.
5.1.4 Nutrients
The Colorado River system has historically been low in nutrients, but nutrients are still a
concern with population growth in the watershed. MWD is involved with upstream
entities along the lower Colorado River to enhance wastewater management to control
nutrient loading, especially phosphorus. The Colorado River’s low nutrient level has
been important for blending with State Water Project water to reduce the nutrient level
delivered to retail agencies.
5.1.5 Arsenic
Arsenic is another naturally occurring element that is being monitored by drinking water
agencies. The state detection level for purposes of reporting is 2 micrograms per liter
(μg/l), and the MCL for domestic water supplies is 10 μg/l. Between 2001 and 2008,
arsenic levels in Colorado River water have ranged from “not detected” to 3.5 μg/l.
Increasing coagulant doses at water treatment plants reduces arsenic levels for retail
deliveries.
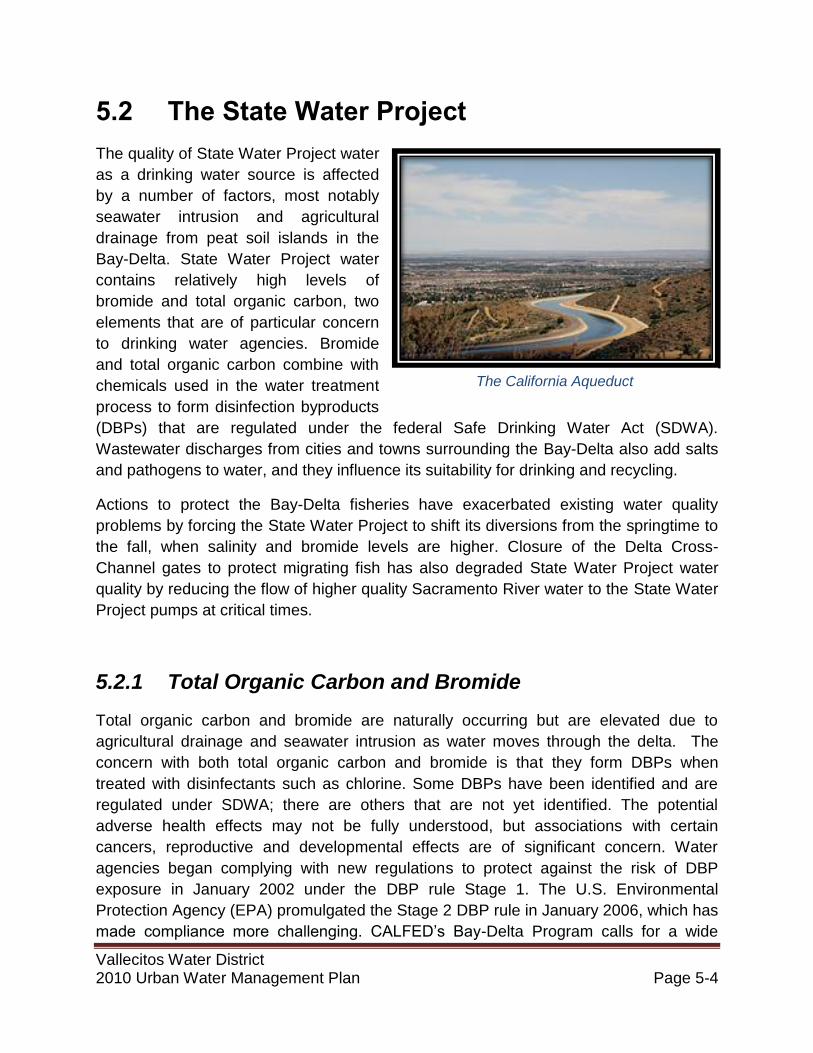
Vallecitos Water District 2010 Urban Water Management Plan Page 5-4
5.2 The State Water Project
The quality of State Water Project water
as a drinking water source is affected
by a number of factors, most notably
seawater intrusion and agricultural
drainage from peat soil islands in the
Bay-Delta. State Water Project water
contains relatively high levels of
bromide and total organic carbon, two
elements that are of particular concern
to drinking water agencies. Bromide
and total organic carbon combine with
chemicals used in the water treatment
process to form disinfection byproducts
(DBPs) that are regulated under the federal Safe Drinking Water Act (SDWA).
Wastewater discharges from cities and towns surrounding the Bay-Delta also add salts
and pathogens to water, and they influence its suitability for drinking and recycling.
Actions to protect the Bay-Delta fisheries have exacerbated existing water quality
problems by forcing the State Water Project to shift its diversions from the springtime to
the fall, when salinity and bromide levels are higher. Closure of the Delta Cross-
Channel gates to protect migrating fish has also degraded State Water Project water
quality by reducing the flow of higher quality Sacramento River water to the State Water
Project pumps at critical times.
5.2.1 Total Organic Carbon and Bromide
Total organic carbon and bromide are naturally occurring but are elevated due to
agricultural drainage and seawater intrusion as water moves through the delta. The
concern with both total organic carbon and bromide is that they form DBPs when
treated with disinfectants such as chlorine. Some DBPs have been identified and are
regulated under SDWA; there are others that are not yet identified. The potential
adverse health effects may not be fully understood, but associations with certain
cancers, reproductive and developmental effects are of significant concern. Water
agencies began complying with new regulations to protect against the risk of DBP
exposure in January 2002 under the DBP rule Stage 1. The U.S. Environmental
Protection Agency (EPA) promulgated the Stage 2 DBP rule in January 2006, which has
made compliance more challenging. CALFED’s Bay-Delta Program calls for a wide
The California Aqueduct

Vallecitos Water District 2010 Urban Water Management Plan Page 5-5
array of actions to improve Bay-Delta water quality and to control these elements of
concern in the drinking water supply.
5.2.2 Nutrients
State Water Project supplies have significantly higher nutrient levels over the Colorado
River supplies. Elevated levels of nutrients can increase nuisance algal and aquatic
weed growth, which in turn affects taste and odor in product water and can reduce filter
run times at water treatment plants. Nutrient rich soils in the Delta, agricultural drainage,
and wastewater discharges are primary sources of nutrient loading to the State Water
Project. Water agencies receiving State Water Project water have been engaged in
efforts to minimize the effects of nutrient loading from upstream wastewater plants.
Taste and odor complaints due to Delta nutrients are dependent on the blend of
imported water delivered through MWD. MWD has developed a program to provide
early warning of algae-related problems, taste, and odor events to best manage water
quality in the system.
5.2.3 Salinity
Water supplies from the State Water Project have significantly lower TDS levels than
the Colorado River, averaging 250 mg/l in water supplied through the East Branch and
325 mg/l on the West Branch. Because of this lower salinity, MWD blends State Water
Project water with high salinity Colorado River Aqueduct water to reduce the salinity
levels of delivered water. However, both the volume and the TDS levels of State Water
Project water can vary significantly in response to hydrologic conditions in the
Sacramento–San Joaquin watersheds.
The TDS levels of State Water Project water can also vary widely over short periods of
time. These variations reflect seasonal and tidal flow patterns, and they pose an
additional problem to blending as a management tool to lower the higher TDS from the
Colorado River Aqueduct supply. For example, in the 1977 drought, the salinity of State
Water Project water reaching MWD increased to 430 mg/l, and supplies became limited.
During this same event, the salinity of the Colorado River Aqueduct water exceeded
700 mg/l. Under similar circumstances, MWD’s 500 mg/l salinity goal could only be
achieved by reducing imported water from the Colorado River Aqueduct. Thus, it may
not be possible to maintain both salinity standards and water supply reliability unless
salinity levels of source supplies can be reduced.

Vallecitos Water District 2010 Urban Water Management Plan Page 5-6
The CALFED Bay-Delta Program’s Environmental Impact Statement/Environmental
Impact Report, Technical Appendix, July 2000 Water Quality Program Plan, identified
salinity targets that are consistent with TDS objectives in Article 19 of the State Water
Project Water Service Contract. These include a ten-year average of 220 mg/l and a
maximum monthly average of 440 mg/l. These objectives were set in the 1960s when
MWD expected to obtain a greater proportion of its total supplies from the State Water
Project. Because of reductions in expected State Water Project deliveries, MWD’s
Board believes that this standard is no longer appropriate, so it has adopted a
statement of needs from the Bay-Delta. Under the drinking water quality and salinity
targets element, the Board states its need “to meet Metropolitan’s 500 mg/l salinity-by
blending objective in a cost-effective manner while minimizing resource losses and
ensuring the viability of recycling and groundwater management programs.”
5.2.4 Arsenic
Between 2001 and 2008, arsenic levels in State Water Project water have ranged from
“not detected” to 4.0 μg/l. Increasing coagulant doses at water treatment plants can
reduce arsenic levels for retail deliveries. Groundwater storage programs in the State
Water Project appear to provide the greatest risk of arsenic contamination; therefore, a
pilot arsenic treatment facility has been installed to evaluate effective removal of arsenic
at the storage site.

Vallecitos Water District 2010 Urban Water Management Plan Page 6-1
Section 6: Water Supply Reliability nder the California Urban Water Management Planning Act (Act), all Urban Water
Management Plans (UWMPs) must include an assessment of the reliability of their
water supplies. The water supply and demand assessment must compare the total
projected water use with the projected water supply, in 5-year increments, through the
next 20 years. This section presents a comparison of the water demands and supplies
within the Vallecitos Water District’s (VWD’s) service area, and assesses supply versus
demand during normal years, single dry water years, and multiple dry water years.
VWD imports 100 percent of its potable water supply from the San Diego County Water
Authority (SDCWA). Though VWD is guided by its 2008 Water, Wastewater and
Recycled Water Master Plan (2008 Master Plan) to assure future reliable water
supplies, it is dependent on the water supply abilities of its wholesaler, the SDCWA.
According to the SDCWA’s 2010 UWMP, the SDCWA anticipates meeting all future
demands of its member agencies in normal and single dry-year scenarios. However,
some level of shortage could potentially be experienced during the multiple dry-year
scenarios. Strategies to address these deficiencies, including SDCWA’s Carryover
Storage Program and Dry-Year Transfer Program, are discussed in Section 9.
6.1 Normal Water Year Assessment
Table 6-1 shows the normal year assessment comparing the 2008 Master Plan
projected water demands for VWD through the year 2030 with the target demands
necessary to meet Senate Bill X7-7 (SB7) supply objectives. Please note that VWD’s
actual capita daily water use for the fiscal year ending in 2010 is 154.6 gpcd, which is
already below the 2020 target. And although the 2008 Master Plan projects significant
increases in demand, these estimates may not reflect actual demands at those times.
U

Vallecitos Water District 2010 Urban Water Management Plan Page 6-2
Artist rendering of the proposed SDCWA
seawater desalination project in Carlsbad, CA
The “SB X7-7 Compliant Supply” quantities given in Table 6-1 are consistent with VWD’s
per capita daily water use targets for the years 2015, 2020, 2025 and 2030. In order to
meet SB7 supply objectives, the demand projections given in the 2008 Master Plan
must be reduced with additional conservation by 19.3 percent in 2015, 32.9 percent in
2020, 33.6 percent in 2025, and 35.6 percent in 2030.
Table 6-1: Normal Year Water Assessment
2015
1 2020
1 2025
1 2030
1
Demand from the 2008 Master Plan2 24,200,000 26,900,000 29,100,000 31,200,000
SB X7-7 Compliant Supply3 17,204,622 15,580,837 16,761,852 17,449,216
Agricultural Water2 1,126,398 1,115,252 1,104,106 1,092,960
Unaccounted/Unbilled Water Losses2 1,210,000 1,345,000 1,455,000 1,560,000
Total Supply from SDCWA4 19,541,020 18,041,089 19,320,958 20,102,176
Additional Conservation Required5 4,658,980 8,858,911 9,779,042 11,097,824
1In units of gallons per day
2As given in Tables 2-6 and 2-7 (see Section 2)
3Equals the VWD target per capita water usage * the population in VWD’s service area (see Section 3)
4Equals the sum of the SB X7-7 Compliant Supply, Agricultural Water and Unaccounted Water Losses
5Equals the difference of the Demand from the 2008 Master Plan and the Total Supply from SDCWA
6.2 Dry Water Year Assessment
In addition to a normal water-year, an
assessment is required to compare the
total water supply available to VWD with
the total projected water use under
single dry year and multiple dry years
over the next 20 years, in 5-year
increments. The SDCWA’s assessment
includes existing and planned supplies
from the Imperial Irrigation District
transfer, canal lining projects and
seawater desalination, which are
considered “drought-proof” supplies.
With the previous years leading up to
the single dry-year being wet or
average hydrologic conditions, MWD

Vallecitos Water District 2010 Urban Water Management Plan Page 6-3
should have adequate supplies in storage to cover potential shortfalls in core supplies to
its member agencies. Therefore, there would be no reason for allocation.
SDCWA estimated dry-year demands in 5-year increments from 2015 through 2030.
According to models used during preparation of the SDCWA’s 2010 UWMP, water
demand is expected to increase in the dry years above normal-year demands by 5.9
percent in 2015, by 6.0 percent in 2020, by 6.8 percent in 2025, and by 7.1 percent in
2030.
Table 6-2 shows VWD’s single dry-year assessment in five-year increments through the
year 2030. The “SB X7-7 Compliant Supply” figures in this table were increased by the
percentages given in the above paragraph from the “SB X7-7 Compliant Supply” figures
given in Table 6-1.
Table 6-2: Single Dry Year Water Assessment
2015
1 2020
1 2025
1 2030
1
SB X7-7 Compliant Supply2 18,212,670 16,521,399 17,907,476 18,680,570
Agricultural Water3 1,126,398 1,115,252 1,104,106 1,092,960
Unaccounted/Unbilled Water Losses3 1,210,000 1,345,000 1,455,000 1,560,000
Total Supply from SDCWA4 20,549,068 18,981,651 20,466,582 21,333,530
1In units of gallons per day
2From Table 6-1 plus the single dry-year supply increase over normal year supply per the SDCWA
3As given in Tables 2-6 and 2-7 (see Section 2)
4Equals the sum of the SB X7-7 Compliant Supply, Agricultural Water and Unaccounted Water Losses
If MWD, SDCWA and VWD supplies are developed as planned, along with achievement
of SB7 retail conservation targets, then no shortages are anticipated within VWD’s
service area in a single dry-year through 2030.
Similar to the single dry-year assessment, SDCWA estimated multiple dry-year
demands in 5-year increments from 2015 through 2030. According to models used
during preparation of the SDCWA’s 2010 UWMP, water demand is expected to increase
in the dry years above normal-year demands as follows:
4.3 percent in 2016
6.7 percent in 2017
10.3 percent in 2018
5.6 percent in 2021
7.9 percent in 2022

Vallecitos Water District 2010 Urban Water Management Plan Page 6-4
11.3 percent in 2023
6.2 percent in 2026
8.7 percent in 2027
12.4 percent in 2028
6.3 percent in 2031
9.1 percent in 2032
12.5 percent in 2033
Table 6-3 shows VWD’s multiple dry water year assessments in 5-year increments
through the year 2030.
Table 6-3: Multiple Dry Year Water Assessment
20151 2020
1 2025
1 2030
1
Multiple-dry year
first year supply
SB X7-7 Compliant Supply2 17,609,973 16,703,354 17,943,139 18,629,942
Agricultural Water3 1,126,398 1,115,252 1,104,106 1,092,960
Unaccounted/Unbilled Water Losses
3
1,210,000 1,345,000 1,455,000 1,560,000
Total Supply from SDCWA4 19,946,371 19,163,606 20,502,245 21,282,902
Multiple-dry year
second year supply
SB X7-7 Compliant Supply2 17,660,040 17,323,587 18,510,740 19,188,432
Agricultural Water3 1,126,398 1,115,252 1,104,106 1,092,960
Unaccounted/Unbilled Water Losses
3
1,210,000 1,345,000 1,455,000 1,560,000
Total Supply from SDCWA4 19,996,438 19,783,839 21,069,846 21,841,392
Multiple-dry year
third year supply
SB X7-7 Compliant Supply2 17,905,252 18,129,777 19,304,542 19,863,137
Agricultural Water3 1,126,398 1,115,252 1,104,106 1,092,960
Unaccounted/Unbilled Water Losses
3
1,210,000 1,345,000 1,455,000 1,560,000
Total Supply from SDCWA4 20,241,650 20,590,029 21,863,648 22,516,097
1In units of gallons per day
2From Table 6-1 plus the multiple dry-year supply increase over normal year supply per the SDCWA
3As given in Tables 2-6 and 2-7 (see Section 2)
4Equals the sum of the SB X7-7 Compliant Supply, Agricultural Water and Unaccounted Water Losses

Vallecitos Water District 2010 Urban Water Management Plan Page 6-5
The SDCWA’s assessment of its water supply reliability showed that it would meet
demands under single dry conditions through the year 2035. However, as shown in
Tables 9-3 through 9-6 of the Water Authority’s 2010 UWMP under multiple dry year
conditions, these tables present potential water supply shortages of varying degrees
over the 25-year planning horizon. If these shortfalls occur as projected, additional
conservation measures will be necessary to balance supply against the regional
demands in the SDCWA’s service area. Section 9.5 of the SDCWA’s 2010 UWMP
describes its additional planned supply projects.
VWD continues to work closely with the SDCWA and MWD for future water supply
planning. These agencies have determined that they will be able to meet their projected
demands through 2035, which include potable water demands for VWD. Based on the
information provided by MWD and the SDCWA, the water supply available to VWD is
considered to be reliable.
If MWD, SDCWA and VWD supplies are developed as planned, along with achievement
of SB7 retail conservation targets, then no shortages are anticipated within VWD’s
service area in multiple dry-year events through 2030.
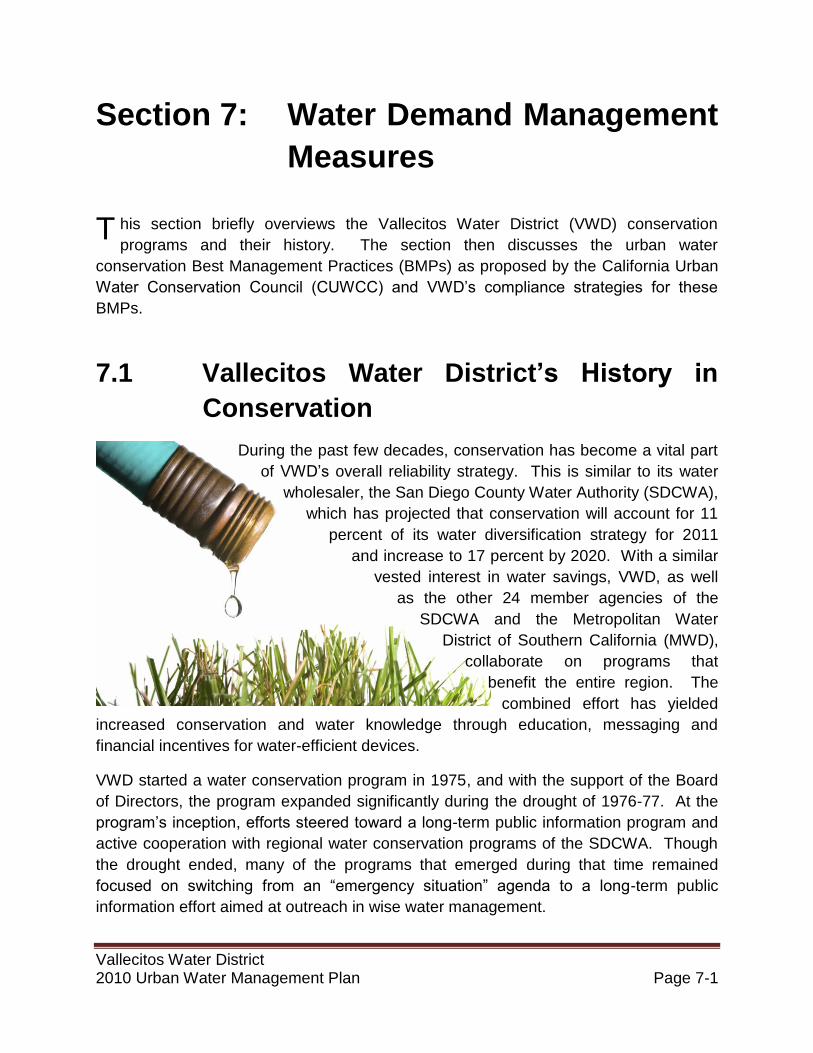
Vallecitos Water District 2010 Urban Water Management Plan Page 7-1
Section 7: Water Demand Management
Measures
his section briefly overviews the Vallecitos Water District (VWD) conservation
programs and their history. The section then discusses the urban water
conservation Best Management Practices (BMPs) as proposed by the California Urban
Water Conservation Council (CUWCC) and VWD’s compliance strategies for these
BMPs.
7.1 Vallecitos Water District’s History in
Conservation
During the past few decades, conservation has become a vital part
of VWD’s overall reliability strategy. This is similar to its water
wholesaler, the San Diego County Water Authority (SDCWA),
which has projected that conservation will account for 11
percent of its water diversification strategy for 2011
and increase to 17 percent by 2020. With a similar
vested interest in water savings, VWD, as well
as the other 24 member agencies of the
SDCWA and the Metropolitan Water
District of Southern California (MWD),
collaborate on programs that
benefit the entire region. The
combined effort has yielded
increased conservation and water knowledge through education, messaging and
financial incentives for water-efficient devices.
VWD started a water conservation program in 1975, and with the support of the Board
of Directors, the program expanded significantly during the drought of 1976-77. At the
program’s inception, efforts steered toward a long-term public information program and
active cooperation with regional water conservation programs of the SDCWA. Though
the drought ended, many of the programs that emerged during that time remained
focused on switching from an “emergency situation” agenda to a long-term public
information effort aimed at outreach in wise water management.
T

Vallecitos Water District 2010 Urban Water Management Plan Page 7-2
Through the addition of a Water Conservation Supervisor and Resources Assistant, the
framework of a long-term conservation program continued to serve as a backdrop for
the next major drought of 1987-1992. With the additional staff and a clear
understanding of the importance of conservation, VWD aggressively revamped the
conservation program and developed a variety of innovative and effective approaches
to demand management. VWD reaffirmed its commitment to conservation and became
one of the original signatories to the “Memorandum of Understanding Regarding Urban
Water Conservation” (MOU) in California on September 16, 1991. The CUWCC, of
which VWD is a long-time member, emerged from the MOU, as well as urban water
conservation practices known as the BMPs, which are aimed at reducing California’s
long-term urban water demands.
To assist in achieving goals set by the CUWCC, the structure of VWD’s conservation
department was later changed to include a Public Information / Conservation Supervisor
and two Public Information Representatives.
As conservation and public information go hand in hand, all members of the
conservation department now have the responsibility for water conservation programs
and related outreach. This proved to be extremely valuable in 2009 when two dry winter
seasons and judicial pumping restrictions to the region left reservoir levels severely
drained. This forced the SDCWA to cut supplies to its member agencies and resulted in
a supply reduction to VWD customers of approximately 10 percent. As a result, the
VWD Board of Directors declared a Level 2 drought alert, prompting mandatory water-
use restrictions for all VWD customers. Through aggressive and innovative
conservation outreach in 2009 and 2010, and by successfully implementing the BMPs,
VWD water usage was consistently below the wholesaler’s allotment.
7.2 Best Management Practices
VWD has adopted 13 of the CUWCC’s 14 comprehensive BMPs as a framework for its
water conservation program. In 2007, however, the CUWCC actively pursued updates
to the MOU and BMPs. VWD actively participated on the BMP revision committees to
draft revised BMPs. In June 2010, the CUWCC formally reorganized their 14 BMPs into
five categories. The first two categories, Operations Practices and Education, have
been classified as “Foundational BMPs” and are considered to be essential water
conservation activities that all agencies should implement. The three remaining
categories, Public Outreach / Residential; Commercial, Industrial and Institutional (CII);
and Landscape, have been classified as “Programmatic BMPs”. VWD’s compliance

Vallecitos Water District 2010 Urban Water Management Plan Page 7-3
strategies and history with these five BMP categories are detailed later in the section,
and the most recent annual report submitted to the CUWCC is included in Appendix G.
In order to track the effectiveness of the BMPs implemented during the 2009 – 2010
drought, VWD created a monthly report that compared the cumulative municipal and
industrial demand and agricultural demand against the allotment that was given to VWD
by its wholesaler, the SDCWA. The report also tracked monthly water production,
rainfall, and number of water meters in service to document how weather and customer
growth impacted water usage for the month. If usage approached the allotment, staff
could implement extra outreach measures to notify customers of necessary actions
needed to reduce usage. More information regarding VWD’s water use reduction
determination is included in Appendix F.
Signatory agencies are required to comply with the new CUWCC BMPs through 2015.
After 2015, the BMPs sunset and compliance with Senate Bill X7-7 is required for all
retail water agencies. Table 7-1 shows the reorganization of the BMPs.

Vallecitos Water District 2010 Urban Water Management Plan Page 7-4
Table 7-1: Previous and Revised BMPs
Previous BMP Number and Name Revised BMP Number and Category
1. Water Survey Programs for Single-Family &
Multi-Family Residential Customers
3. Public Outreach / Residential;
Programmatic
2. Residential Plumbing Retrofit 3. Public Outreach / Residential;
Programmatic
3. System Water Audits, Leak Detection and
Repair
1. Operations Practices; Foundational
4. Metering with Commodity Rates For All New
Connections & Retrofit of Existing Connections
1. Operations Practices; Foundational
5. Large Landscape Conservation Programs and
Incentives
5. Landscape; Programmatic
6. High-Efficiency Clothes Washing Machine
Financial incentive Programs
3. Public Outreach / Residential;
Programmatic
7. Public Information Programs 2. Education; Foundational
8. School Education Programs 2. Education; Foundational
9. Conservation Programs for Commercial,
Industrial, and Institutional Accounts
4. Commercial, Industrial and
Institutional; Programmatic
10. Wholesale Agency Assistance Programs 1. Operations Practices; Foundational
11. Retail Conservation Pricing 1. Operations Practices; Foundational
12. Conservation Coordinator 1. Operations Practices; Foundational
13. Water Waste Prohibition 1. Operations Practices; Foundational
14. Residential Ultra-Low Flush Toilets
Replacements
3. Public Outreach / Residential;
Programmatic

Vallecitos Water District 2010 Urban Water Management Plan Page 7-5
Dry winters and judicial pumping restrictions caused reservoir levels
to drop, prompting VWD to declare a Level 2 Drought Alert in July of 2009.
(Photos of Lake Oroville reservoir, which supplies water to San Diego).
7.2.1 Foundational BMPs
BMP Category 1 - Operations Practices
Water Waste Prohibitions
All water agencies are required to administer a strategy – an adopted ordinance or
terms of service – to meet water waste prevention. For compliance, VWD has adopted
Ordinance No. 162, which is included in Appendix G. This Drought Response
Conservation Program is patterned after the conservation actions of its water
wholesaler (SDCWA) and establishes regulations to be implemented during times of
declared water shortages or emergencies to conserve water. This ordinance
establishes four levels of drought response with corresponding actions to be
implemented in times of shortage or emergency, with increasing restriction on water use
in response to worsening drought or emergency conditions, and decreasing available
supplies.
Level 1 – Drought Watch:
With this alert, VWD will increase
public outreach and take action to
encourage voluntary conservation
practices.
Level 2 – Drought Alert: With this alert, VWD will implement mandatory
conservation practices to reduce water use by up to 20 percent. These practices
include limiting landscape irrigation and repairing leaks within 72 hours of
notification.
2005
2009

Vallecitos Water District 2010 Urban Water Management Plan Page 7-6
Level 3 – Drought Critical: With this alert, VWD will implement mandatory
conservation practices to reduce water use by up to 40 percent. Additional
conservation practices include the prohibition of filling pools or fountains and
washing vehicles and require repair of leaks within 48 hours of notification. With
minor exceptions, no new potable water services will be allowed during a Level 3
Drought alert.
Level 4 – Drought Emergency: With this alert, VWD will implement mandatory
conservation practices to reduce water use above 40 percent in order for VWD to
have adequate supplies to meet anticipated demands. Additional conservation
practices include prohibited landscape irrigation, excluding commercial growers
or nurseries, and the repair of leaks within 24 hours of notification.
Table 7-2 provides a summary of the conservation practices required at the four stages
of drought conditions.

Vallecitos Water District 2010 Urban Water Management Plan Page 7-7
Table 7-2: VWD’s Drought Response Restriction Overview
LEVEL 1 - DROUGHT WATCH Conservation Practices
All customers shall comply with the following drought measures:
Stop washing down paved surfaces (except to alleviate sanitary hazards). Includes sidewalks, driveways, parking lots, tennis courts, or patios.
Stop water waste from inefficient landscape irrigation.
Irrigate landscapes before 10 a.m. and after 6 p.m.
Use a hand-held hose with a shut-off nozzle or bucket to irrigate landscaped areas that are not watered by an automatic system.
Use re-circulated water to operate ornamental fountains.
Wash vehicles using a bucket and hand-held hose with shut-off nozzle, high pressure / low volume wash system, or at a commercial site that re-circulated water on-site.
Serve and refill water in restaurants only upon request. Offer hotel guests the option of not laundering towels and linens daily.
Repair all water leaks within five days of notification by VWD.
Use recycled or non-potable water for construction purposes.
LEVEL 2 – DROUGHT ALERT Conservation Practices
All customers shall comply with Level 1 drought measures, as well as the following:
Residential and commercial landscape irrigation will be limited to no more than three unassigned days.
Irrigation using sprinklers will be limited to no more than 10 minutes per watering station per day (Systems using water-efficient devices are excluded).
All leaks must be repaired within 72 hours of notification by VWD.
Stop operation of ornamental fountains unless re-circulated water is used.
LEVEL 3 – DROUGHT CRITICAL Conservation Practices
All customers shall comply with Levels 1 and 2 drought measures, as well as the following:
Residential and commercial landscape irrigation will be limited to two assigned days per week and no more than once a week from November through May (excludes commercial growers and nurseries).
Stop refilling ornamental lakes or ponds, except to sustain aquatic life.
Stop refilling pools or spas.
Stop washing vehicles except at commercial car washes that recirculate water.
Repair all leaks within 48 hours of notification by VWD.
With minor exceptions, no new potable water service shall be provided.
LEVEL 4 – DROUGHT EMERGENCY Conservation Practices
All customers shall comply with Levels 1, 2 and 3 drought measures, as well as the following:
Stop all landscape irrigation, and other outdoor watering for residential and commercial customers (excludes commercial growers and nurseries).
Repair all leaks within 24 hours of notification by VWD.

Vallecitos Water District 2010 Urban Water Management Plan Page 7-8
In the event that supply interruptions were caused by a major failure or other related
situation, a Water Emergency would declare severe restrictions. This could result in a
mandatory water reduction beyond 40 percent. In this case, the General Manager has
the authority to declare a reduction beyond measures detailed in Ordinance No. 162.
Administrative fines can be levied for each violation of a provision of the ordinance as
follows:
$100 fine for first violation
$200 fine for second violation if it occurred within one year of the prior violation
$500 fine for each additional violation if it occurred within one year of the prior
violation
Enforcement for further violations increases in severity and may include
installation of a flow-restricting device in the meter, imprisonment, a fine up to
$1,000, and/or discontinuing service to the property where the violation occurred.
Water Loss Control
The goals of modern water loss control methods include both an increase in water use
efficiency in the utility operations and proper economic valuation of water losses to
support water loss control activities. Agencies are expected to use the AWWA Free
Water Audit Software (“AWWA Software”) to complete their standard water audit and
water balance. Instrumental to VWD complying with this BMP is a host of programs
targeted at averting unbilled water loss before they happen. These programs include:
Water Audits: Monthly water audits that compare total water sales with water
acquisitions to determine the amount of unaccounted water. Regular audits allow
VWD to develop new programs to enhance water loss reduction as needed.
Leak Detection: VWD’s distribution system is constantly monitored for leaks by
a centralized control system, electric leak detection devices and visual
inspections.
Water System Improvements: A state-of-the-art telemetry room uses a
computerized Supervisory Control and Data Acquisition (SCADA) system to
monitor water flow more efficiently. Routine and preventative maintenance is
performed on the entire delivery system.
Meter Maintenance and Replacement Program: Meters within VWD are
replaced every 15 years to prevent malfunction and leakage.

Vallecitos Water District 2010 Urban Water Management Plan Page 7-9
Prosecution for Water Theft: VWD personnel continually monitor for water theft
and prosecute as necessary.
Water Loss Billing: Whenever possible, the parties responsible for water loss
(for example, damages fire hydrants, dig-ins, etc.) are billed for the cost of
required repairs and for all water lost.
Metering with Commodity
Some of the requirements associated with meeting this BMP are including meters for all
new service connections; establishing a program to retrofit existing unmetered
connections; reading meters and billing customers by volume of use; billing intervals of
no greater than bi-monthly; performing at least five meter readings for every 12-month
period; and preparing a written plan that includes a census of all meters by size, type,
year installed, and customers served. Also included are barrier identifications to
retrofitting mixed commercial accounts with dedicated meters and conducting feasibility
studies to assess the merits of a program to provide incentives to switch mixed-use
accounts dedicated to irrigation meters.
Metering of all water use and billing by volume has long been the standard practice at
VWD. As directed by the BMP, all new and existing water service connections are
metered. For large parcels and commercial developments, separate, dedicated
irrigation meters are placed where needed. Customers are billed based on monthly
reads and according to “Tier Ranges” adopted by VWD on July 1, 2003. The “Tier
Ranges” are divided into three step pricing tiers with separate use requirements for
residential, irrigation, agriculture, and commercial / industrial, in an effort to promote
conservation by charging a higher rate for each incremental use of water.
Retail Conservation Pricing
This aspect of BMP Category 1 promotes water conserving retail water rate structures.
When creating a rate case, professional judgments are made to determine whether
costs are accounted to a variable or fixed cost center by the staff of the agency. The
final water rate case is an accumulation of all the decisions and judgments made by
staff and supplemented by the financial projections leading an agency to establish its
final water rate recommendation. The BMP is not intended to supplant this process, but
rather to reinforce the need for water agencies to establish a strong nexus between
volume-related system costs and volumetric commodity rates.
VWD customers are billed based on monthly reads and according to “Tier Ranges”
adopted on July 1, 2003. The “Tier Ranges” are divided into three step pricing tiers with

Vallecitos Water District 2010 Urban Water Management Plan Page 7-10
VWD Public Information Representative
educates students about rainwater harvesting
at VWD’s sustainable
demonstration garden.
separate use requirements for residential, irrigation, agriculture, and commercial /
industrial. This is an effort to meet this BMP and promote conservation and wise water
use by charging a higher rate for each incremental use of water. VWD currently offers a
financial incentive for customers who practice exceptional water conservation. These
customers, called “Frugal Users”, use 5 units or less of water per billing cycle and
receive a 20 percent discount on their “Ready-to-Serve” charge and their sewer charge.
BMP Category 2 - Education
This BMP has been established for water
agencies to reach younger water users at
an early age and enforce the need to
engage in water conservation as a life-
long behavior. Some targets associated
with achieving success include
implementing a school education program
to promote water conservation and water
conservation-related benefits through
instructional assistance, educational
materials, and classroom presentations
that identify urban, agricultural, and
environmental issues and conditions in
the local watershed. Educational
materials shall meet the state education
framework requirements and grade-appropriate materials shall be distributed. Also,
when mutually beneficial, the water wholesale agency may operate all or part of the
education program. For such cases it may be beneficial for the retail agency to assume
responsibility for CUWCC reporting of this BMP; under this arrangement, a water
wholesale agency may aggregate all or portions of the reporting and coverage
requirements of the retail agencies joining into the mutual consent.
The VWD Education Program is designed to meet BMP requirements and establish
standards adopted by the California State Board of Education in October, 1998.
Implemented in conjunction with the SDCWA, the presentations are designed to
increase water knowledge among VWD’s most impressionable users. The VWD
Education Program includes:
Kindergarten – In-class presentation to bring the science of the water cycle
together with an effort to personalize the student’s scientific knowledge of the
role of water.

Vallecitos Water District 2010 Urban Water Management Plan Page 7-11
VWD covers the cost for the “Splash Science Mobile Lab” to make visits to area schools.
First Grade – In-class presentation to help students comprehend the role of
water in essential industries and introduce water conservation.
Second Grade – Through a partnership with the City of San Marcos, VWD
covers the cost to transport students to Jack’s Pond Park and Nature Center
where they are exposed to nature by having hands-on time with native plant
exhibits. They also listen to a presentation on the importance of water in the
ecosystem and the development of human settlements.
Fourth Grade – In-class presentation and “water awareness calendar” poster
contest to deepen the student’s understanding of the water cycle.
Kindergarten through Fifth Grade – VWD covers the cost for the San Diego
County Office of Education’s “Green Machine” to be brought directly to the
classroom. This hands-on agricultural program teaches the students about how
they get their food and explores the journey from “seed to table” by explaining
soil science, integrated pest management and the water cycle.
Fourth through Sixth Grade – VWD
covers the cost for the “Splash
Science Mobile Lab” to make visits to
area schools. This self-contained
mobile laboratory is offered through
the San Diego County Office of
Education. It provides a hands-on
experience where students learn
about water by using cooperative
learning skills, microscopes with live
specimens, chemistry experiments,
and state-of-the-art computers.
VWD has also partnered with the
City of San Marcos to help create a conservation barn at Jack’s Pond Park to
educate fourth through sixth grade students on various environmental topics.
Inside the barn are seven rooms that each has a specific educational theme,
such as wildlife and habitats; native plants, and the water cycle. There are also
many hands-on displays, such as microscopes for examining life in the pond and
an interactive wastewater treatment plant model (newspaper article included in
Appendix C).

Vallecitos Water District 2010 Urban Water Management Plan Page 7-12
VWD has partnered with the
City of San Marcos to create a
conservation barn to educate
fourth through sixth grade students
on various environmental topics.
Photos of conservation barn (above)
and two of the educational rooms
(right and below).
Seventh through Twelfth Grade – VWD outreaches to older students in a
variety of ways, including:
In-class presentations on requested topics for middle schools and high
schools.
VWD covers the cost to transport students to VWD’s Meadowlark Water
Reclamation Facility (MRF) for facility tours to learn about wastewater
treatment and recycling.
VWD participates in the San Marcos Unified School District’s annual
Wellness Policy Fair by setting up a booth to discuss water issues with the
high school students.
Throughout the year, VWD partners with local schools on a variety of
special projects. As an example, in 2009 VWD provided plants for

Vallecitos Water District 2010 Urban Water Management Plan Page 7-13
VWD’s sustainable demonstration garden
features these solar-powered ornamental
water features that operate using
collected rainwater.
students to install to create a native plant demonstration garden at San
Marcos Middle School (newspaper article included in Appendix C). In
2010, VWD utilized San Marcos High School Future Farmers of America
students to help install a sustainable demonstration garden in front of
VWD’s administration building.
In-class presentations are currently under development for high school
students, such as “Careers in the Water Industry”, “Cost of Water”, “Water
Bill of Rights”, and the classroom activity, “Value of Water”.
Private Schools – Smaller private schools and home schools within VWD’s
service area are each invited to a special two-day Splash Science Mobile Lab
event at Jack’s Pond Park. The City of San Marcos’ Jack’s Pond Park and
Nature Center is opened in conjunction with the Splash Science Mobile Lab
event, and the Nature Center’s Director offers nature walks discussing storm
water issues, local flora and fauna, and water allocation topics.
Colleges – Although not a
requirement of this BMP, VWD
also works with local colleges to
help educate students about the
importance of water conservation.
VWD participates in an annual
environmental fair at Palomar
College, and in 2010, VWD
partnered with the college to
create the sustainable demonstration
garden which now graces the front
of VWD’s administration building.
Environmental architecture and design
students designed the garden, which includes native plants, and a 2,500-gallon-
capacity rainwater collection system that supplies water to solar-powered
ornamental water features. One of the water features includes a casted bronze
hand depicting the value of water, which was created by Palomar College’s
sculpture and foundry departments (newspaper article included in Appendix C).

Vallecitos Water District 2010 Urban Water Management Plan Page 7-14
In honor of Earth Day, VWD also participates with the “Earth Day through the
Arts”, which is a community event held on the campus of California State
University San Marcos (CSUSM), by manning a booth at the event. The event is
sponsored by the CSUSM’s Art and Lecture series and the City of San Marcos.
Some of the festivities include eco-friendly art exhibits and a fashion show
sporting garments made from recycled and repurposed items. This partnership
allows VWD the opportunity to encourage water conservation and sustainability
and to showcase the importance of Earth Day.
7.2.2 Programmatic BMPs
BMP Category 3: Public Outreach / Residential
Public Outreach
The primary basis for this BMP is to use public information programs as an effective tool
to inform customers about the need for water conservation and ways they can
conserve, and to influence customer behavior to conserve. The program should include,
when possible, but should not be limited to, providing speakers to employees, creating
social marketing elements that are designed to change attitudes to influence behavior;
using paid and public service advertising; using bill inserts; providing information on
customers’ bills showing use for the last billing period compared to the same period the
year before; providing public information to promote water conservation measures and
shaping water conservation messages; training stakeholders outside the utility staff in
water conservation priorities and techniques and coordinating with other government
agencies, industry groups, public interest groups and the media.
Through a three-person dedicated staff, VWD meets this BMP requirement through a
variety of programs and strategically targeted communication. This includes internal and
external, in-house produced periodicals such as a quarterly “Splash!” newsletter mailed
to all customers, use of VWD’s website located at www.vwd.org, a Speaker’s Bureau
covering a range of topics, and an employee newsletter. Also critical to outreach
success are visibility at community events, press releases, brochures, paid newspaper
advertisements, bill inserts and bill messages, free water-wise workshops, promotional
events, displays, open house events, the Lending Library, classroom presentations,
field trips for area schools, and facility tours. Some specific recent examples include
paid newspaper advertisements and bill messages to remind people to conserve during
the recent drought, school presentations covering water history and demonstrating
water conservation techniques, as well as conservation advice available online at

Vallecitos Water District 2010 Urban Water Management Plan Page 7-15
VWD’s website. VWD has also started using other forms of communications such as
automated phone calls, movie theater ads and social networking sites, such as
Facebook. The recently installed sustainable demonstration garden is another avenue
that opens communication dialogue with customers to discuss ways to reduce outdoor
water use.
VWD’s outreach is directed to reach the diverse social, cultural, and economic elements
of the population within the service area. This is accomplished by mailing the quarterly
newsletter to all residents within our service area, instead of limiting distribution to
actual water customers. Brochures and bill inserts are periodically mailed to VWD
customers informing them of current water conditions. To assist our Spanish speaking
customers, many of VWD’s outreach materials are printed in Spanish and VWD’s
website contains a link which can convert the website text into Spanish. (See Appendix
C for examples of outreach materials).
Residential
Residential water users throughout California depend on a reliable and safe supply of
water for their homes. This BMP is designed to establish the best and most proven
water conservation methods and measures that residents, working in conjunction with
water agencies, can implement. The practices will encourage homeowners, multi-family
property owners, and tenants to increase water use efficiency and reliability. As
required by the BMP, retail water agencies will implement water-use efficiency through
residential assistance programs such as landscape surveys, and water-efficient
appliance and fixture rebates and incentives*.
In meeting this BMP, VWD participates in a free water audit program to encourage
water savings. As fifty to seventy percent of the water used in San Diego County is
used on landscaping, customers can see significant savings by having an audit
performed on their property. Audits assist customers by offering instrumental ways to
save water in their own homes by reviewing landscaping irrigation systems as well as
inspecting indoor and outdoor plumbing fixtures for leaks. VWD staff may suggest
outdoor irrigation adjustments according to season and soil moisture composition, as
well as recommend proper lawn maintenance and tips on low-water-use landscaping.
Once complete, an educational packet with information about other water conservation
programs is also offered. Also available for distribution are free faucet aerators, low-
flow showerheads and booklets outlining effective irrigation practices, drought-tolerant
plant selections, and simple tips to reduce water waste indoors and outdoors.

Vallecitos Water District 2010 Urban Water Management Plan Page 7-16
2009 VWD California Friendly
Landscape Contest winner
To further encourage customers to reduce
outdoor water use, VWD participates in a
regional landscape contest to award
customers whose yards best exhibit the
beauty of low-water gardening. Contest
winners receive a gift certificate to a local
nursery and are recognized at an award
ceremony and/or at a VWD Board meeting.
In addition, in 2010 VWD implemented an
innovative promotion where VWD field
crews distributed letters of recognition along
with donated gift cards from local
businesses to reward customers for being
leaders in the community by having an exceptionally beautiful water-efficient front yard
(see newspaper article in Appendix C).
*Rebates and incentives are dependent upon funding by VWD’s wholesalers (SDCWA and MWD).
BMP Category 4: Commercial, Industrial and Institutional (CII)
Commercial, industrial, and institutional (CII) usage make up a large percentage of total
water demand for California. CII water use varies dramatically between business
sectors within a water agency’s territory. The goal is to implement comprehensive yet
flexible BMPs, allowing each water agency to tailor the implementation of each practice
to fit local needs and opportunities. The end result is a practice that is successful and
will produce the greatest amount of cost-effective water savings.
Through collaboration with SDCWA’s CII Program, VWD meets BMP Category 4
requirements through a rebate program* that offers CII customers financial incentives to
migrate to water-efficient equipment. Participants also benefit long-term, experiencing
savings in water, wastewater and energy costs. VWD’s CII offerings have included
partial reimbursement for pre-rinse spray valves, ultra-low flush toilets, urinals
(waterless models included), water brooms, single-load high-efficiency washers, cooling
tower conductivity controllers, multi-load high-efficiency washers, and weather-based
irrigation controllers. The CII program is regularly promoted through VWD’s website,
mailings, bill inserts, letters, display ads, articles and newsletters.
*Rebates are dependent upon funding by VWD’s wholesalers (SDCWA and MWD).

Vallecitos Water District 2010 Urban Water Management Plan Page 7-17
VWD’s audit program shows customers
how to have a water-wise garden
that can be lush and beautiful.
BMP Category 5: Landscape
Irrigation accounts for a large portion of urban water use in California. This water use
varies dramatically depending on water pricing and availability, plant choice, geographic
locations, seasonal conditions, and the level of commitment to sound water efficiency
practices. The goal of this BMP is that irrigators, with assistance from the water agency,
will achieve a higher level of water use efficiency consistent with the actual irrigation
needs of the plant materials. Reaching this goal would reduce overall demands for
water, reduce demands during the peak summer months, and still result in a healthy
and vibrant landscape for California.
VWD meets this BMP with its own in-
house audit program and a partnership
with the Mission Resource Conservation
District to provide audits at no charge to
VWD customers. For small residential or
commercial properties, VWD has an in-
house certified landscape irrigation
auditor who conducts the landscape
audits. On larger properties, such as
homeowners associations or agricultural
users, Mission Resources Conservation
District is hired to conduct a more
extensive audit.
Regardless of the size of the property, all
audits include a face-to-face meeting where a walkthrough is performed to identify type
of plants, irrigation system design, equipment problems and scheduling. This is
completed with the goal of providing cost-effective opportunities at the property – from
simple repairs to new ways to schedule irrigation. On large property audits, the audit
concludes with a detailed report of graphs and charts showing a sample of the
landscaped area, plant material identification, hyrdozoning, weather data and water
savings potential.

Vallecitos Water District 2010 Urban Water Management Plan Page 8-1
Meadowlark Water Reclamation
Facility
Section 8: Water Recycling
ue to limited supplies, the Vallecitos Water
District’s (VWD’s) commitment to water
conservation and sustainability has significantly
increased over the last 5 years and is
demonstrated by its successful water recycling
efforts.
Recycled water is wastewater that has undergone tertiary treatment so that it can be
used for irrigation or other non-potable uses. To produce recycled water, secondary
treated effluent undergoes filtration and chlorination. Up to 5 million gallons per day
(MGD) of wastewater is treated at VWD’s Meadowlark Water Reclamation Facility
(MRF), with an average of around 3.5 MGD being recycled for use in landscaping at
parks, schools, golf courses, flower fields and municipalities. Wastewater that is not
recycled at MRF is sent to the Encina Water Pollution Control Facility (EWPCF), a
regional facility owned jointly by six public agencies, where it is treated and reclaimed or
discharged to the ocean.
By purifying wastewater and recycling water for reuse at MRF, VWD has been effective
at reducing the overall regional demand for imported water, which is essential as the
San Diego region has few local sources of water and therefore must import most of its
water from hundreds of miles away. Imported water sources are potentially subject to
drought and emergency outages during catastrophes such as major earthquakes.
To meet current and future water needs, the San Diego region must diversify its sources
of water and increase its use of locally produced water. Recycled water is an important
piece of the puzzle in solving the region’s long-term water reliability needs. By taking a
proactive role in producing recycled water, VWD has continued to increase and offset
San Diego's need to import water, continually improving our quality of life.
This section describes VWD’s wastewater system, as well as how the wastewater is
generated, collected and treated. Further, this section details how the wastewater is
disposed of or recycled, and how VWD encourages water recycling.
D

Vallecitos Water District 2010 Urban Water Management Plan Page 8-2
8.1 Wastewater System Description,
Generation & Treatment
VWD’s existing system includes a
wastewater collection system, wastewater
treatment facility and water reclamation
facility. VWD has approximately 19,678
sewer connections. The existing wastewater
collection system is composed of treatment
facilities, major conveyance facilities, gravity
mains, trunk sewers, lift stations, siphons and
force mains. An average of 6.8 MGD of
wastewater is collected by VWD’s
conveyance system, which consists of more
than 178 miles of pipeline ranging in size
from 4-inch pipe to the 54-inch section of the land outfall. VWD operates four lift
stations with pumping capacities ranging from 100 gallons per minute (gpm) to over
2,000 gpm. This collection system conveys the wastewater for treatment to either MRF
or EWPCF.
VWD’s 23-square mile sewer service area is divided between two principal drainage
basins which are named based on the treatment facility which serves it. The treatment
facilities used by VWD are the regionally owned EWPCF located on the coast in
Carlsbad, and MRF located in the southwestern portion of VWD’s service area. A third
drainage basin is located in the northern part of VWD that naturally drains away from
the existing collection system and is referred to as the Northern Tributary Area (NTA).
The NTA is entirely made up of rural residential and agricultural land uses, and is
served by on-site septic systems or by a neighboring agency. Land uses within the
NTA are not planned to change in character and as such it is assumed that on-site
septic systems will continue to service this area.
8.1.1 Meadowlark Water Reclamation Facility
MRF is located in the City of Carlsbad in the southwestern portion of VWD’s service
area and treats wastewater to meet recycled water standards in accordance with State
of California Title 22 requirements and under the provisions of Waste Discharge Permit
R9-2007-0018 issued by the State of California Regional Water Quality Control Board
Questhaven sewer lift station

Vallecitos Water District 2010 Urban Water Management Plan Page 8-3
Meadowlark Water Reclamation Facility
54-million-gallon Mahr Reservoir
for Region 9. It was originally built in 1958
as a 0.25 MGD secondary treatment
plant, and expanded to a 2 MGD, tertiary
treatment facility in 1982. Capacity was
re-rated in 1996 to 2.25 MGD.
The plant underwent construction in 2005
to increase capacity to 5 MGD. This was
completed in 2008 and added preliminary
treatment (grinders/augers) to remove
large debris and primary treatment
(settling basins) to allow greater removal
of solids. The existing fixed-film biological
process, which utilized Rotating Biological
Contactors, was removed and replaced with roughing filters, which is a more efficient
fixed-film biological process. Activated sludge, another biological process, was also
added, which entailed adding aeration basins along with Return Activated Sludge and
Waste Activated Sludge.
Currently, recycled water (up to 5 MGD) from MRF that is sold under contract to the City
of Carlsbad (Carlsbad) and the Olivenhain Municipal Water District (OMWD) is
transported through VWD’s 24-inch recycled water pipeline that provides additional
points of service to both Carlsbad and OMWD. Carlsbad is contracted to purchase a
minimum of 2 MGD December through March and 3 MGD the remainder of the year.
OMWD is contracted to purchase up to 1.5 million gallons year-round, provided
adequate effluent is available.
Surplus water is stored in VWD’s 54-million-
gallon Mahr Reservoir, which is located just
south of MRF. If necessary, water from both
MRF and the Mahr Reservoir can be sent
through VWD’s “Failsafe” pipeline to the
EWPCF for disposal into the ocean. Currently,
the MRF basin produces 0.65 MGD for recycling
and the remaining wastewater is pumped from
the Encina basin. MRF does not have the
capacity capacity to treat solids. All solid material is
sent to the EWPCF via VWD’s land outfall.

Vallecitos Water District 2010 Urban Water Management Plan Page 8-4
Encina Water Pollution
Control Facility
8.1.2 Encina Water Pollution
Control Facility
The EWPCF, which was built in the mid-1960s, is
located on the coast in Carlsbad and is a regional
facility owned jointly by six public agencies: VWD, the
cities of Carlsbad, Vista and Encinitas, the Buena
Sanitation District and the Leucadia Wastewater
District. VWD owns about 24 percent of the facility and
has the ability to send up to 10.5 million gallons a day
of solids and 7.54 million gallons per day of liquids to
the EWPCF. Average current flows to the EWPCF are
approximately 3.54 MGD.
The facility provides wastewater treatment services to
approximately 300,000 North San Diego County
residents. The EWPCF is a 43.3 MGD activated sludge
treatment facility (average influent flow is around 23.3 MGD). The facility is primarily a
secondary treatment and disposal facility. Treated wastewater from the EWPCF is sent
through an ocean outfall extended along the ocean floor and transported about 1½
miles into the ocean on the coast in Carlsbad at about a depth of 150 feet. A small
portion of the EWPCF’s treated wastewater is diverted to various reclamation facilities,
which are detailed further in this section.
8.1.3 Participation in a Regional Recycled Water Plan
In addition to being actively involved in producing recycled water, VWD is also currently
a member of the North San Diego County Regional Recycled Water Project. This group
of eleven North County water and wastewater agencies has joined together to
investigate opportunities for expanded use of recycled water within North San Diego
County and document their efforts in a Facility Plan Report, which will be used to pursue
local, State and Federal funding. This planning study:
• Compares recycled water supplies with projected demands
• Investigates seasonal and daily storage opportunities
• Considers regulatory requirements and basin objectives
• Develops regional concepts to expand the use of recycled water
• Identifies regional facilities and concept-level costs
• Prepares a Recycled Water Facility Plan

Vallecitos Water District 2010 Urban Water Management Plan Page 8-5
The final Facility Plan Report is scheduled to be produced by August of 2011.
8.1.4 WateReuse Association Membership
The San Diego Regional Chapter of the WateReuse Association was founded in 2000
to support the ever-increasing focus on water recycling to supplement and diversify the
San Diego region's water supplies. Members of the San Diego Regional Chapter
include recycled water purveyors, recycled water customers, regulatory agencies,
engineering and consulting firms, equipment vendors, as well as interested individuals
from the community at large. The mission of the San Diego Regional Chapter of the
WateReuse Association is to provide a forum for the exchange of information to
promote the beneficial use of recycled water in the San Diego region. VWD is an active
member of the California WateReuse Association.
8.2 Wastewater Disposal and Recycled
Water Uses
8.2.1 Recycled Water Currently Being Used
VWD currently has the ability to recycle up to 74 percent of its wastewater by utilizing its
Lift Station No. 1 on San Marcos Boulevard to redirect wastewater that would normally
be sent to the EWPCF to the MRF instead. All of the recycled water produced at MRF
is sold under contract to the City of Carlsbad and OMWD. Carlsbad purchases up to 3
MGD and OMWD purchases up to 1.5 MGD. With the exception of the on-site irrigation
at MRF, VWD currently does not sell its recycled water to customers within its service
area. At this time, it is not cost-effective to install the recycled water infrastructure and
to pump the recycled water to areas that could use it within VWD’s service area.
VWD is also a member of the regional EWPCF and sends an average of 3.54 MGD of
wastewater to this facility for treatment. The EWPCF has the ability to treat up to 43.3
MGD, but currently treats an average of 23.3 MGD of wastewater from its 6 member
agencies, a small portion of which is recycled as described below:
The EWPCF produces about 1 MGD of recycled water onsite. This water is used
in the plant and reduces the costs for potable water. Recycled water uses

Vallecitos Water District 2010 Urban Water Management Plan Page 8-6
Treated water storage tank at
Carlsbad Water Recycling Facility
include: equipment wash down, cogeneration engine cooling; odor reduction and
landscape irrigation.
Two reclamation plants also currently treat secondary effluent from the EWPCF:
The Leucadia Wastewater District pipes treated secondary effluent from the
EWPCF to their Gafner Water Reclamation Facility. This facility presently
produces 86 million gallons of recycled water per year (0.25 MGD), but has the
capacity to produce up to 350 million gallons per year (approx. 1 MGD).
Presently, this water is sold to the City of Carlsbad, who acts as the retailer and
sells it to the La Costa Resort & Spa Golf Course for irrigation purposes.
The second reclamation facility is
the Carlsbad Water Recycling
Facility, which is located adjacent to
to the EWPCF but is owned by the
Carlsbad Municipal Water District.
Up to 4 MGD of secondary effluent
from the EWPCF is diverted from
the ocean outfall and delivered to
this facility. On average, 2 MGD is
treated at this facility. The treated
water is then supplied to the City of
Carlsbad. The City of Carlsbad has about 78 miles of recycled distribution
pipeline, which supplies 357 recycled-use sites.
8.2.2 Potential Uses of Recycled Water
Table 8-1 below shows the past, current and projected average wastewater collection
and treatment volumes for VWD’s service area. These include areas within VWD’s
service area that may or may not be expanded to, such as the Northern Tributary Area.
Table 8-1 also shows breaks-down VWD’s average wastewater volume between that
which meets recycled water standards and that which is typically treated to secondary
level and disposed of through the EWPCF ocean outfall.
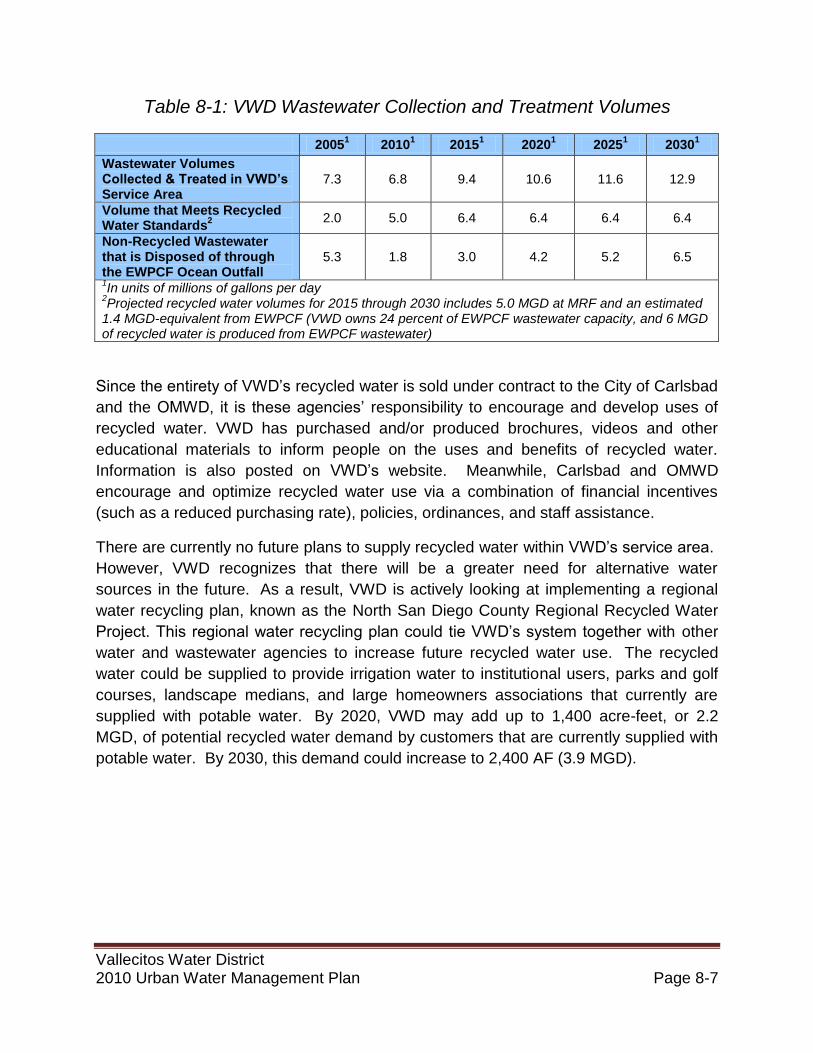
Vallecitos Water District 2010 Urban Water Management Plan Page 8-7
Table 8-1: VWD Wastewater Collection and Treatment Volumes
20051 2010
1 2015
1 2020
1 2025
1 2030
1
Wastewater Volumes Collected & Treated in VWD’s Service Area
7.3 6.8 9.4 10.6 11.6 12.9
Volume that Meets Recycled Water Standards
2
2.0 5.0 6.4 6.4 6.4 6.4
Non-Recycled Wastewater that is Disposed of through the EWPCF Ocean Outfall
5.3 1.8 3.0 4.2 5.2 6.5
1In units of millions of gallons per day
2Projected recycled water volumes for 2015 through 2030 includes 5.0 MGD at MRF and an estimated
1.4 MGD-equivalent from EWPCF (VWD owns 24 percent of EWPCF wastewater capacity, and 6 MGD of recycled water is produced from EWPCF wastewater)
Since the entirety of VWD’s recycled water is sold under contract to the City of Carlsbad
and the OMWD, it is these agencies’ responsibility to encourage and develop uses of
recycled water. VWD has purchased and/or produced brochures, videos and other
educational materials to inform people on the uses and benefits of recycled water.
Information is also posted on VWD’s website. Meanwhile, Carlsbad and OMWD
encourage and optimize recycled water use via a combination of financial incentives
(such as a reduced purchasing rate), policies, ordinances, and staff assistance.
There are currently no future plans to supply recycled water within VWD’s service area.
However, VWD recognizes that there will be a greater need for alternative water
sources in the future. As a result, VWD is actively looking at implementing a regional
water recycling plan, known as the North San Diego County Regional Recycled Water
Project. This regional water recycling plan could tie VWD’s system together with other
water and wastewater agencies to increase future recycled water use. The recycled
water could be supplied to provide irrigation water to institutional users, parks and golf
courses, landscape medians, and large homeowners associations that currently are
supplied with potable water. By 2020, VWD may add up to 1,400 acre-feet, or 2.2
MGD, of potential recycled water demand by customers that are currently supplied with
potable water. By 2030, this demand could increase to 2,400 AF (3.9 MGD).

VWD Sphere of Influence
Future Service Area
Sewer Service Area
Northern Tributary Area
VID Within VWD SOI
6/20/2011 KC SD Z:\Projects\IS\VallecitosWaterDistrict\2010 UWMP\mxd\20411_WastewaterServiceArea_F8-1.mxd
!"a$
A©
A
San Marcos Blvd
Mission Rd
Tw
in O
aks V
all e
y R
d
Buena Creek Rd
Ran
cho S
anta
Fe
Rd
SOURCE: LAFCO SOI - Affirmed 08-06-2007VWD GIS Data - 07-17-2008, provided by District
Rancho Santalina
MeadowlarkEstates
EscondidoGolf Course
RacewayBasin
Vista Irrigation District
Carlsbad MWD
Olivenhain MWD
Valley Center MWD
Rincon del Diablo MWD
Rainbow MWD
Deer Springs Rd
San MarcosLandfill
Vallecitos Water District
2010 Urban Water Management Plan
City ofEscondido
Ü0 1.5
Miles
WASTEWATER SERVICE AREAFIGURE 8-1

Vallecitos Water District 2010 Urban Water Management Plan Page 8-9
Figure 8-2: VWD Daily Wastewater and Reclamation Flows
(Maximum wastewater flow that can be generated in service area is 12.5 MGD)
Wastewater flow and reclamation is described below:
Encina Water
Pollution Control Facility (EWPCF)
Secondary effluent Reclaimed
sold to Leucadia and used
Wastewater District onsite
for reclamation Secondary
effluent sold to
City of Carlsbad
for reclamation
Reclaimed water
sold to
City of Carlsbad
Meadowlark Water
Reclamation Facility (MRF)
Reclaimed water
sold to
City of Carlsbad Reclaimed water
sold to Olivenhain
Municipal Water
District
Up to 7.5 MGD Up to 5.0 MGD
Up to 1.0 MGD
Up to 4.0 MGD
1.0 MGD Up to 3.0 MGD Up to 1.5 MGD
Small quantity
used on site
Maximum Flow – 12.5 MGD
2010 Flow – 6.8 MGD
Note: Based on VWD’s 2010 average daily wastewater flow of 6.8 MGD and MRF’s recycling capacity of 5 MGD, up to 74% of the wastewater generated in
VWD’s service area can currently be recycled. (5 MGD ÷ 6.8 MGD = 74%)
By factoring in the wastewater that can be recycled at the EWPCF,
this percentage can further increase.

Vallecitos Water District 2010 Urban Water Management Plan Page 9-1
Section 9: Shortage Contingency Plan
he Vallecitos Water District (VWD) adheres to regulatory standards requiring that
urban water agencies conduct a water shortage contingency analysis as a part of
their 2010 Urban Water Management Plans (UWMPs). As an agency that is 100
percent reliant on water supplied by the San Diego County Water Authority (SDCWA),
the VWD UWMP is based on the SDCWA’s analysis and addresses supply shortages
due to catastrophe, drought, or other situations.
This section addresses the SDCWA’s plans to address catastrophic water shortage
events. It then discusses strategies utilized by the Metropolitan Water District of
Southern California (MWD), the SDCWA and VWD to manage supply shortfalls during a
drought period and increase water supply reliability. Finally, this section provides a brief
analysis of the impacts of such strategies on VWD’s revenues and expenditures, and
estimates the minimum water supplies available over the next three years.
9.1 Catastrophic Water Shortage
A catastrophic water shortage occurs when a disaster, such as earthquake, results in
insufficient available water to meet the region’s needs or eliminates access to imported
water supplies. For increased reliability, VWD subscribes to SDCWA’s Integrated
Contingency Plan (ICP) and Emergency Storage Program (ESP). Both were developed
to protect public health and safety and to potentially limit economic damage that could
occur from a severe shortage of water supplies.
9.1.1 Integrated Contingency Plan
SDCWA’s ICP provides information necessary to respond to an emergency that causes
severe damage to SDCWA’s water distribution system or impedes SDCWA’s ability to
provide reliable service to its member agencies. The ICP describes the situations and
incidents that will trigger the activation of SDCWA’s ICP and Emergency Operations
Center. It also provides direction and strategies for responding to a crisis. SDCWA’s
ICP includes:
Authorities, policies, and procedures associated with emergency response
activities
T

Vallecitos Water District 2010 Urban Water Management Plan Page 9-2
Olivenhain Dam
Emergency Operations Center activities, including activation and deactivation
guidelines
Multi-agency and multi-jurisdictional coordination, particularly between SDCWA,
its member agencies, and MWD in accordance with Standardized Emergency
Management System and National Incident Management System guidelines
Incident Command System management and organization and emergency
staffing required to assist in mitigating any significant emergency or disaster
Mutual Aid Agreement and covenants that outline the terms and conditions under
which mutual aid assistance will be provided
Hazard specific action plans and Incident Command System position checklists
In addition, the plan uses a step-by-step approach to emergency response planning by
providing tools such as resource and information lists, personnel rosters, pertinent
policies and procedures, and reference materials.
9.1.2 Emergency Storage Program (ESP)
In June 1998, the SDCWA Board authorized implementation of the ESP to reduce the
risk of potential catastrophic damage that could result from a prolonged interruption of
imported water due to earthquake, drought, or other disasters. The ESP is a system of
reservoirs, pipelines and other facilities that will work together to store and move water
around the county in the event of a natural disaster. The ESP will provide, when
complete, up to six months of emergency water storage in the San Diego region.
The ESP facilities are located throughout San Diego County and are being constructed
in phases. Construction of the first facilities began in 2000. The initial ESP phase
included construction of the 318-foot-high Olivenhain Dam and accompanying
Olivenhain Reservoir, which together added 24,300 acre-feet (AF) of emergency
storage for the region. Raising the height
of the San Vicente Dam is the last major
component of the ESP and should be
completed by 2012. The raised dam will
add an additional 117 feet, making it the
tallest dam raise in the United States and
will allow for an additional 52,000 AF or
emergency storage, as well as 100,000 AF
of carryover storage. When completed, the
ESP will provide 90,100 AF of stored water
for emergency purposes to meet San Diego

Vallecitos Water District 2010 Urban Water Management Plan Page 9-3
County’s needs through at least 2030. The SDCWA Board of Directors may also
authorize that supplies from the ESP be used in a prolonged drought or other water
shortage situation where imported and local supplies do not meet 75 percent of the
SDCWA’s member agencies’ municipal and industrial demands.
For information on the SDCWA’s methodology for calculating the allocation of ESP
supplies to member agencies in a prolonged outage situation without imported supplies,
see Section 11 of the SDCWA’s UWMP.
9.2 Drought Management Planning
VWD has planned for potential water shortages through coordination with SDCWA.
SDCWA’s Water Storage and Drought Response Plan (WSDRP), which serves as the
region’s guiding shortage management document, most recently highlights the actions
taken during the 2007-2010 storage period to manage supply shortfalls and contains
information on the SDCWA’s dry-year supplies.
Following the major drought in California between 1987 and 1992 that led to severe
water supply shortages throughout the state, SDCWA and its member agencies
aggressively developed plans to minimize the impact of potential shortages. In 2006,
SDCWA’s Board adopted the WSDRP to serve as a comprehensive plan in the event
that the region faced supply shortages due to drought or other water shortage
conditions.
The WSDRP was developed by SDCWA in coordination with its member agencies to
provide a balanced, flexible, systematic approach to identifying regional actions
necessary to reduce the impacts from shortages. It includes all aspects of drought
planning, from steps to avoid rationing, to drought response stages, allocation
methodology, pricing, and a communication strategy. Multiple actions are identified to
manage shortage situations, including both supply augmentation measures and
demand reductions up to 50 percent in water supply. Conservation savings is an
essential component of meeting the need for water in time when available supplies are
limited.
For more information on SDCWA’s WSDRP, see Section 11 of SDCWA’s UWMP.

Vallecitos Water District 2010 Urban Water Management Plan Page 9-4
Increased pumping restrictions at the
Harvey O. Banks pumping plant in the Bay-Delta
have attributed to supply shortages in
Southern California.
9.2.1 Summary of 2007-2011 Shortage Period Management
Actions
The last water shortage affecting VWD
can be attributed to constrained
supplies in 2007 tied to increased
restrictions on State Water Project
pumping due to the Bay-Delta
environmental considerations. The
Colorado River was also in the midst
of a prolonged multi-year drought that
began in 2000. In April 2007, MWD
notified its member agencies that it
expected challenges in meeting
demands due to insufficient imported
water supplies from the State Water
Project and the Colorado River. In
order to meet demands, MWD
announced that it would implement
shortage-related actions consistent with its Water Surplus and Drought Management
(WSDM) Plan, including a need to draw upon its storage to meet expected 2007
demands. MWD adopted its WSDM Plan in 1999 as guidance for managing regional
water supplies during both surplus and shortage situations. The MWD announcement
that it would need to draw upon its storage to meet demands is what triggered
implementation of the SDCWA’s WSDRP.
The SDCWA began to implement a series of response measures identified in its
WSDRP to reduce potential shortage impacts, starting with a call for voluntary
conservation, and securing dry-year water transfers and storage programs for the
region. As dry conditions persisted into 2009, the SDCWA and its member agencies
intensified their drought response activities.
In April 2009, MWD’s Board of Directors voted to allocate urban water deliveries in fiscal
year 2010 for the first time in decades to its member agencies. In turn, the SDCWA
allocated water deliveries to its member agencies using the supply allocation
methodology contained in the WSDRP. The SDCWA’s long-term strategy to improve
water supply reliability by diversifying the region’s water supply portfolio helped offset
some of the required cutbacks from MWD. However, voluntary conservation turned to
mandatory water use restrictions in many areas throughout SDCWA’s service area. On
May 6, 2009, the VWD Board authorized moving to Drought Response Level 2 and

Vallecitos Water District 2010 Urban Water Management Plan Page 9-5
The San Vicente Dam raising project is just
one way the SDCWA is increasing water
storage for the future.
required customer demand reduction of at least 10 percent in order to meet the
SDCWA’s demand allocation.
Residences and businesses responded to the call for conservation, and urban water
use fell throughout San Diego County. At the end of fiscal year 2010, VWD only utilized
83.8 percent of its municipal and industrial allotment from the SDCWA, which saved the
region 2,949 acre-feet of potable water. Although hydrologic conditions began to
improve, 2010 storage reserves remained low and allocations continued into early 2011
to help restore storage reserves. More information regarding VWD’s water use
reduction determination is included in Appendix F.
9.2.2 SDCWA Dry-Year Supplies and Carryover Storage
The SDCWA’s dry-year supplies and carryover storage are an important component of
managing potential shortages within the region and for increasing supply reliability for
the region. The dry-year supplies assist in minimizing or reducing potential supply
shortages from MWD. Through the last five years, the SDCWA developed a carryover
storage program to more effectively manage supplies. This includes in-region surface
storage currently in member agency
reservoirs and increasing capacity
through the raising of San Vicente Dam,
which should be completed by 2012.
The SDCWA also currently has an out-
of-region groundwater-banking program
in the California central valley. Through
such efforts, SDCWA can store water
available during wet periods for use by
member agencies such as VWD during
times of shortage. The SDCWA also
implemented a dry-year transfer program
during the last shortage period and
successfully acquired and utilized dry-
year transfer supplies in 2009.
SDCWA Carryover Storage Program
The carryover storage program provides water for the region in the case of a supply
shortage, such as during a drought. The SDCWA has identified three main needs for
carryover storage:
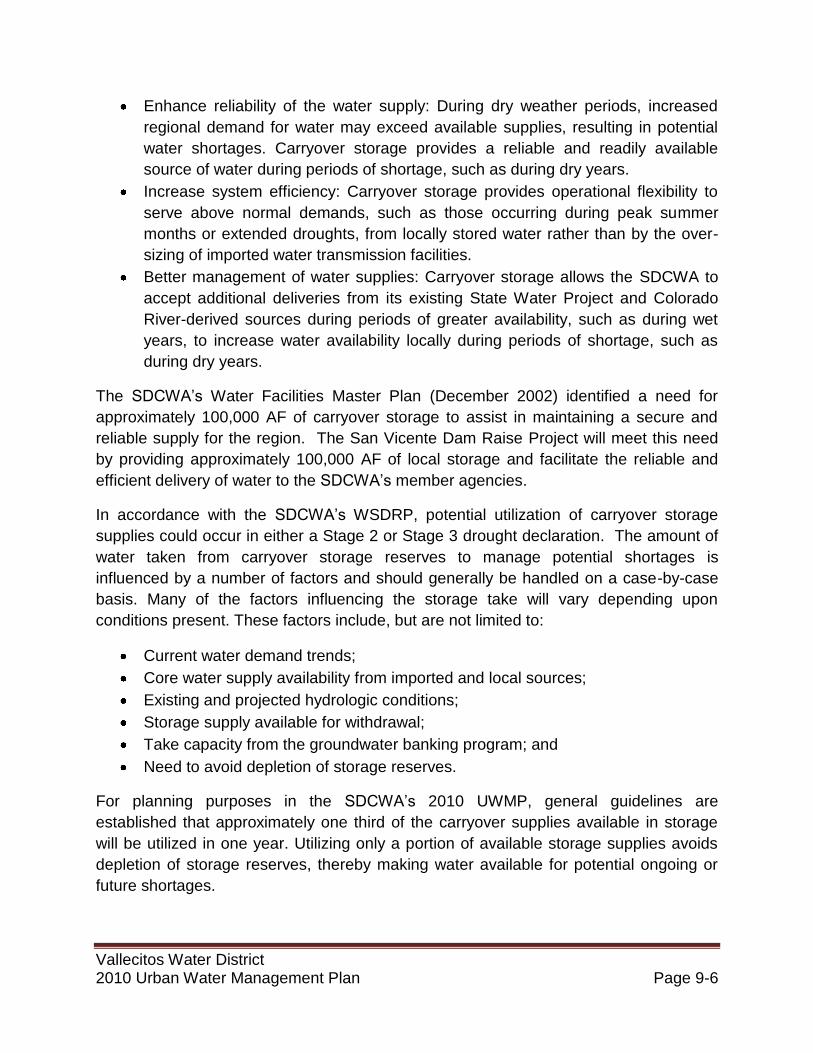
Vallecitos Water District 2010 Urban Water Management Plan Page 9-6
Enhance reliability of the water supply: During dry weather periods, increased
regional demand for water may exceed available supplies, resulting in potential
water shortages. Carryover storage provides a reliable and readily available
source of water during periods of shortage, such as during dry years.
Increase system efficiency: Carryover storage provides operational flexibility to
serve above normal demands, such as those occurring during peak summer
months or extended droughts, from locally stored water rather than by the over-
sizing of imported water transmission facilities.
Better management of water supplies: Carryover storage allows the SDCWA to
accept additional deliveries from its existing State Water Project and Colorado
River-derived sources during periods of greater availability, such as during wet
years, to increase water availability locally during periods of shortage, such as
during dry years.
The SDCWA’s Water Facilities Master Plan (December 2002) identified a need for
approximately 100,000 AF of carryover storage to assist in maintaining a secure and
reliable supply for the region. The San Vicente Dam Raise Project will meet this need
by providing approximately 100,000 AF of local storage and facilitate the reliable and
efficient delivery of water to the SDCWA’s member agencies.
In accordance with the SDCWA’s WSDRP, potential utilization of carryover storage
supplies could occur in either a Stage 2 or Stage 3 drought declaration. The amount of
water taken from carryover storage reserves to manage potential shortages is
influenced by a number of factors and should generally be handled on a case-by-case
basis. Many of the factors influencing the storage take will vary depending upon
conditions present. These factors include, but are not limited to:
Current water demand trends;
Core water supply availability from imported and local sources;
Existing and projected hydrologic conditions;
Storage supply available for withdrawal;
Take capacity from the groundwater banking program; and
Need to avoid depletion of storage reserves.
For planning purposes in the SDCWA’s 2010 UWMP, general guidelines are
established that approximately one third of the carryover supplies available in storage
will be utilized in one year. Utilizing only a portion of available storage supplies avoids
depletion of storage reserves, thereby making water available for potential ongoing or
future shortages.

Vallecitos Water District 2010 Urban Water Management Plan Page 9-7
The Sacramento-San Joaquin Delta is
California’s single largest source of water, and
supplies water to the State Water Project system.
For more information on the SDCWA carryover storage program, see Section 11 of the
SDCWA UWMP.
SDCWA Dry-Year Transfer Program
To ensure adequate water supplies in the face of continued drought conditions (2007-
2010) and regulatory constraints, and as part of SDCWA’s WSDRP, the SDCWA
developed a plan to secure one-time
water transfer agreements, which
could lay the foundation for long-term
agreements. Although transfers of
water supplies through the Delta may
be subject to curtailments during
certain periods due to operation of the
pumps in the State Water Project
system, the SDCWA pursued
opportunities as supply options in the
event that Colorado River surplus was
suspended or dry-year conditions
continued. The supply could also
hedge against shortfalls resulting
from the reduced State Water Project
allocation.
In 2009, SDCWA acquired 20,000 AF of water under a one-year transfer agreement
with Placer County Water Agency in Northern California to lessen the impact of water
supply reductions to the San Diego region. The transfer eased the region’s transition
from voluntary conservation to mandatory water use restrictions by keeping regional
water savings target for the year at a manageable level. In 2010, the SDCWA actively
sought water transfer options, however, due to the changed conditions of the SDCWA’s
water demands, which have significantly dropped since MWD enacted Level 2 of its
Water Supply Allocation Plan in July 2009, as well as the expense required to obtain the
necessary approvals and agreements, and the comparatively higher cost of the
supplies, the SDCWA Board approved not exercising its call rights to the 2010 dry-year
transfer with the South Feather Water and Power Agency. The SDCWA Board also
decided to end its pilot program efforts between San Juan Water District, Santa Clara
Valley Water District and the SDCWA for calendar year 2010 and continue it over to
2011.
For more information on the SDCWA dry year transfer program, see Section 11 of the
SDCWA UWMP.

Vallecitos Water District 2010 Urban Water Management Plan Page 9-8
9.2.3 Model Drought Response Conservation Ordinance
In March 2008, the SDCWA’s Board approved for release a Model Drought Response
Conservation Program Ordinance (Model Drought Ordinance) for use by VWD and
other member agencies in updating their existing ordinances. The Model Drought
Ordinance was developed with input from the member agencies to provide regional
consistency during periods of shortages. The Department of Water Resources’s 2008
Updated Urban Drought Guidebook was also utilized as a reference document for
preparation of the Model Drought Ordinance. It identifies four drought response levels
that contain water-use restrictions to help achieve demand reduction during temporary
shortages. The restrictions become more stringent at each successive level to obtain
necessary savings and delay economic impact until higher levels. The Model Drought
Ordinance served as a model to VWD in updating its Drought Response Conservation
Program (Ordinance No. 162). See Section 7.2 and Appendix E regarding water
conservation practices, requirements and water waste prohibitions involved in VWD’s
four drought response levels within its Drought Response Conservation Program.
9.2.4 Penalties for Excessive Water Use
Penalty rates may be used by the SDCWA to encourage conservation and reduce
demand during a drought or other water supply shortage. If MWD allocates imported
water supplies to the SDCWA, MWD can impose surcharges (penalty pricing) on water
consumption in excess of the SDCWA’s allocation. SDCWA’s Implementing Resolution
provides for pass through to VWD of any penalties levied by MWD on SDCWA for
exceeding its annual allocation. Penalties can be assessed on a pro rata basis to VWD
if it should exceed allocations, and only if the SDCWA exceeds its allocation from MWD.
SDCWA may compensate for increased costs or reduced water sales by adjusting
water rates in succeeding years.
Rates may also be adjusted based on any other allocation program implemented by
SDCWA as determined necessary. SDCWA may also reduce the amount of water it
allocates to VWD or any other member agency should it fail to adopt or implement water
use restrictions.
VWD’s Drought Response Conservation Program (Ordinance No. 162) includes a
section indicating fines and penalties that may be levied for water waste violations. A
copy of VWD Ordinance No. 162 is included in Appendix E. These penalties include:
$100 for a first violation

Vallecitos Water District 2010 Urban Water Management Plan Page 9-9
$200 for a second violation of any provision of the ordinance within one year of
the prior violation
$500 for each additional violation of this ordinance within one year of the prior
violation
Violation of a provision of this ordinance is subject to enforcement through
installation of a flow-restricting device in the meter
For any subsequent violations within a period that a Water Conservation Stage is in
effect, the Board would conduct a hearing and may, in its discretion, order either (1) an
installation of a flow restrictor, or (2) the discontinuance of service, each for such a
period of time that the Board deems appropriate under the circumstances. Vallecitos
Water District shall, at least 10 days before the date set for the hearing, mail a written
notice of the hearing.
Furthermore, penalties also exist in Ordinance No. 162 to prosecute each violation as a
misdemeanor punishable by imprisonment in the county jail for not more that 30 days
and/or by a fine not exceeding $1,000. Additionally, willful violations of the mandatory
conservation measures and water use restrictions as set forth during Stage 4 may be
enforced by discontinuing service to the property at which the violation occurs, as
provided by California Water Code §346.
9.2.5 Revenue & Expenditure Impacts
Although VWD maintains financial reserves, it is possible that additional costs
associated with demand reduction could negatively affect VWD’s short-term financial
situation. Approximately 80 percent of VWD’s fixed costs are shared between all water
customers via a monthly ready-to-serve charge. This charge, which varies depending
on meter size, recovers water system infrastructure and equipment repairs and
maintenance, meter reading, billing, engineering, safety and administration. VWD may
compensate for increased costs or reduced water sales by adjusting water rates in
succeeding years.
Water conservation is a well-established practice in ensuring that there will be a reliable
water supply in the future for the increasing population and commerce within VWD’s
service area. However, conservation occasionally suffers from the perception that it
reduces revenues. Over the long-term, conservation measures actually serve to defer
or limit rate increases by reducing VWD’s need for other, more expensive supplies and
increased infrastructure. Conservation programs also reduce imported water demand
that in turn allows the SDCWA to purchase less of MWD’s more expensive Tier 2 water.

Vallecitos Water District 2010 Urban Water Management Plan Page 9-10
Tier 2 water is more expensive since it represents MWD’s cost to develop additional
supplies.
9.2.6 Minimum Water Supply Available over Next Three
Years
In accordance with the California Urban Water Management Planning Act, agencies are
required to estimate the minimum water supply available during each of the next three
years, based on the driest three-year historic sequence. To determine the minimum
supplies potentially available to VWD, the same assumptions contained in the multi dry-
year analysis in Section 6.2 were used. Table 9-1 contains the minimum estimated
supplies.
Table 9-1: Supply Reliability – Current Water Sources
Water supply sources
Average / Normal
Water Year Supply
Multiple Dry Water Year Supply
Year 2012 Year 2013 Year 2014 San Diego County Water Authority 14,557,942 14,275,903 14,977,762 15,537,933
Percent of normal year: 100 98.1 102.9 106.7 1In units gallons per day
It should be noted that based on current supply and storage conditions statewide, VWD
is not currently forecasting this supply scenario. However, if sufficient supplies from the
SDCWA are not available to meet demand projections, then VWD shall increase the
drought response level described in Section 7.2.1 to prohibit water waste and reduce
demands to meet available supplies.
60-day notices to all affected land use agencies that the Vallecitos Water District has
jurisdiction within that the Vallecitos Water District intends to review and update its 2005
Urban Water Management Plan pursuant to California Water Code Section 10610-
10610.4, and is scheduling a public hearing for 6 p.m. on June 15, 2011.
Resolution of the Board of Directors of the Vallecitos Water District adopting the 2010
Urban Water management Plan as described in the California Water Code Section
10640 et seq.
Minutes from the June 15, 2011 Vallecitos Water District regular meeting of the Board of
Directors showing that a public hearing was held to review the method for determining
an urban water use target, and to allow community input and consideration of economic
impacts regarding the target implementation plan; and to adopt the Vallecitos Water
District 2010 Urban Water Management Plan update subsequent to the public hearing.

Letters of transmittal to the California Department of Water Resources, the California
State Library, and all affected land use agencies that the Vallecitos Water District has
jurisdiction within providing them with the Vallecitos Water District 2010 Urban Water
Management Plan update within 30 days of its adoption.
Printout from the Vallecitos Water District website at www.vwd.org showing a link to the
Vallecitos Water District 2010 Urban Water Management Plan update that can be
accessed by members of the public for review within 30 days of submission of this plan
to the California Department of Water Resources.

Article in October 19, 2010 edition of the San Diego Union Tribune, by Michael Breier.
Sustainable garden now open at water district
Article in July 26, 2010 edition of the North County Times. San Marcos: Water district
plants seeds of conservation
Article in April 25, 2009 edition of the North County Times, by Andrea Moss. San
Marcos: Teacher, students create native-plant garden at their school
Article in The Coast News. Water district rewards customers
Article in March 20, 2009 edition of the San Diego Union Tribune, by Linda Lou. Old
barn is new conservation center
Article in April 4, 2009 edition of the North County Times, by Andrea Moss. San
Marcos: Conservation barn is latest addition to nature center
Article in October 16, 2010 edition of the San Diego Union Tribune, by Michael Breier.
Water District’s new garden open for viewing
Spring 2010 edition of the Vallecitos Water District’s “Splash!” publication for its
ratepayers and general public
Fall 2010 edition of the Vallecitos Water District’s “Between the Pipes” publication for
the Vallecitos Water District employees
Printouts from the Vallecitos Water District website at www.vwd.org in both English and
Spanish showing links to information and different services that the Vallecitos Water
District provides
Vallecitos Water District brochure titled, “What Happened to our Water Supplies?”

E-mail correspondence between the Vallecitos Water District and the San Diego County
Water Authority providing water use projections for the Vallecitos Water District through
2035.

Ordinance No. 162 – An Ordinance of the Board of Directors of the Vallecitos Water
District Repealing Ordinance No. 159 and Adopting a Drought Response Conservation
Program. Passed, approved and adopted on May 6th, 2009.

Graph showing the Vallecitos Water District municipal and industrial (M&I) water
demand reduction from its water allotment during fiscal year 2010/2011.
Graph showing the Vallecitos Water District special agricultural water rate (SAWR)
water demand reduction from its water allotment during fiscal year 2010/2011.
Graph showing the Vallecitos Water District interim agricultural water program (IAWP)
water demand reduction from its water allotment during fiscal year 2010/2011.
Worksheets showing the Vallecitos Water District monthly water demands for M&I,
SAWR and IAWP uses, comparing the Vallecitos Water District’s M&I water demand
versus its M&I water allotment, and giving a cumulative water conservation percentage
for the Vallecitos Water District against its water allotment for fiscal years 2009/2010
and 2010/2011.
Graph comparing the Vallecitos Water District water production for the month of April
from 2002 to 2011.
Graph comparing the rainfall for the month of April in the Vallecitos Water District from
2002 to 2011.
Graph comparing the Vallecitos Water District total water meters in service for the
month of April from 2002 to 2011.

Vallecitos Water District 2009 and 2010 report to the California Urban Water
Conservation Council estimating water conservation savings.
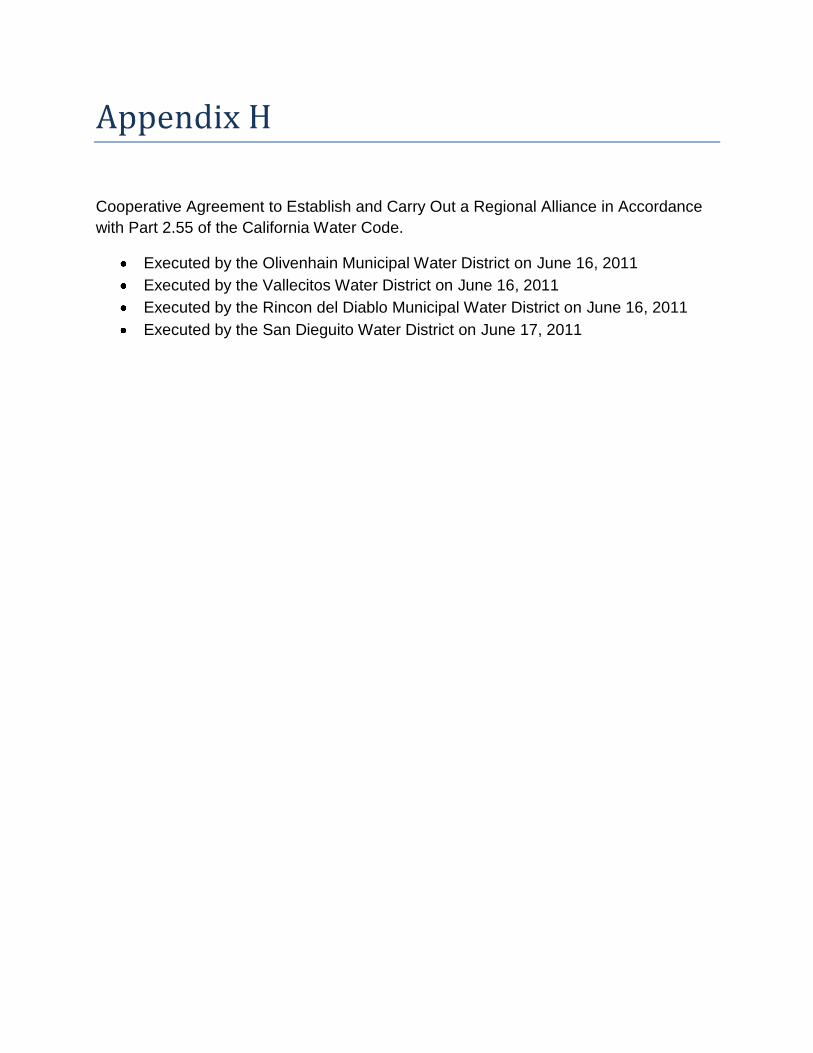
Cooperative Agreement to Establish and Carry Out a Regional Alliance in Accordance
with Part 2.55 of the California Water Code.
Executed by the Olivenhain Municipal Water District on June 16, 2011
Executed by the Vallecitos Water District on June 16, 2011
Executed by the Rincon del Diablo Municipal Water District on June 16, 2011
Executed by the San Dieguito Water District on June 17, 2011

Table I-2 – Urban Water Management Plan checklist; completed by VWD to identify the
sections in the VWD 2010 Urban Water Management Plan that address the checklist
items. Table I-2 is taken from the California Department of Water Resources’
Guidebook to Assist Urban Water Suppliers to Prepare a 2010 Urban Water
Management Plan, dated March 2011. This guidebook can be found online at
http://www.water.ca.gov/urbanwatermanagement/docs/2010FinalUWMPGuidebook.pdf


![SUTRA [ S ustainable U rban TRA nsportation ]](https://img.pdfslide.net/doc/110x75/56815145550346895dbf66ee/sutra-s-ustainable-u-rban-tra-nsportation-.jpg)