Embed Size (px)
Citation preview

Netflix
Comcast
Dish
ECHELON INSIGHTS
1
RBS SAMPLING FOR EFFICIENT AND ACCURATE TARGETING OF TRUE VOTERS
Patrick Ruffini May 19, 2017
1

HOW CAN WE USE VOTER FILES FOR ELECTION SURVEYS?

ECHELON INSIGHTS
• Random Digital Dial (RDD) is still the predominant sampling mode for academic or media polls about politics, while campaign pollsters predominantly use registration-based sampling (RBS).
• To screen for likely voters, RDD relies on respondent self-assessments of voting behavior. This is problematic for election polling as it does not assure a representative sample of likely voters.
• Survey respondents over-report their likelihood to vote.
• Self-reported likelihood to vote often bears little relationship to whether someone will actually turn out.
• Respondents both “flake-out” and “flake-in” when it comes to actually voting.
• Actual vote history from a voter file is a better predictor of voting, explaining more about whether a respondent will vote than self-assessment (Aida/Rogers).
3
Research Synthesis
TRADITIONAL LIKELY VOTER SCREENS ARE IN TROUBLE

ECHELON INSIGHTS
Hypothesis: Polling error as a result of inaccurate self-reported likelihood to vote will occur when:
1. There are large disparities between the number of people who say they will vote in a survey and those who actually will. (Most prone to happening in low turnout elections, less so in Presidential elections.)
2. The preferences of non-voters (who nonetheless tell pollsters they will vote) differ substantially from those of true voters.
4
Research Synthesis
WHEN ARE WE MOST VULNERABLE?

ECHELON INSIGHTS
• Low-turnout elections: Local elections, primaries/caucuses
• 2016 Iowa Caucus — Final Polls: Trump +4.7%, Cruz +3.3% (RCP)
• Midterm elections
• 5.3% error in competitive 2014 U.S. Senate elections
• 3.0% error in competitive 2014 U.S. gubernatorial elections
5
Research Synthesis
WHEN ARE WE MOST VULNERABLE?

ECHELON INSIGHTS
A mismatch between the survey universe and actual turnout explains 70% of the shift in pre-election 2014 polling to final outcome in GOP direction, with the remaining 30% (or 3 points) explained by shifts in voter attitudes between September and the election.
6
Research Synthesis
THE GOOD NEWS FROM PEW’S POST-2014 STUDY: THE POLLS ARE RIGHT (WHEN WE KNOW WHO VOTES)
Measure Result Net Shift to GOP
September Survey of RVs Democrats +4 -
September Survey (True Voters Only) Republicans +3 +7
Post-Election Wave (True Voters Only) Republicans +6 +3
Final Result Republicans +6 +0

ECHELON INSIGHTS
From Barber, Mann, Monson & Patterson: “Online Polls and Registration-Based Sampling: A New Method for Pre-Election Polling”
• Use of Turnout Scores: Turnout models (built using logistic regression or random forest techniques) blend past vote history and demographic factors to give a probabilistic 0-1 score that a voter will actually vote. More refined than crude definitions like “Voted in 2014” or “Midterm Dropoff” voter.
• PPS Sampling Based on Turnout Scores: Probability proportionate-to-size sampling is to ensure an eventual survey sample that resembles the correct distribution of voters in the electorate along the likelihood-to-turnout spectrum.
7
Research Synthesis
USING TURNOUT SCORES AS A SAMPLING CRITERION

USING VOTER FILES

THERE IS A BELIEF THAT, FAR OUT FROM AN ELECTION, WE CAN’T KNOW WHAT TURNOUT WILL LOOK LIKE…

ECHELON INSIGHTS
• We generally know what overall turnout rates will be, within a few percentage points. Midterm and Presidential turnout rates have been stable for decades.
10
Using Voter Files
ACTUALLY, TURNOUT RATES ARE STABLE OVER TIME

ECHELON INSIGHTS
• The stability and predictability of turnout holds true at the individual level.
• Across all validated 2016 voters we modeled:
• 51.81% had >90% probability of voting
• 63.49% had >80% probability of voting
• 85.37% had >50% probability of voting
• When using a voter file with turnout scores, researchers can use these as population targets to ensure they have a survey with the right mix of high and low propensity voters.
11
Using Voter Files
AT THE INDIVIDUAL LEVEL, WHO VOTES IS KNOWABLE

ECHELON INSIGHTS
• Different elections will result in different participation patterns. In each case, the researcher can model the likelihood that a voter will participate in the given election, then balance or weight their sample according to different groups of high or low turnout voters (voters with a 90% or more chance of voting, for instance).
12
Using Voter Files
BALANCING SAMPLES BY TURNOUT SCORESVirginia Turnout Score Distribution, 2016 & 2017
ECHELON INSIGHTS
• Two approaches to likely voter models
• Cut-Off: All voters below a certain threshold probability of voting are excluded from the likely voter universe. Outcomes are very sensitive to the threshold chosen (Pew, 2016) and can be overly restrictive.
• Probabilistic: Many “unlikely” voters end up voting, and we must take into account the chance they will vote. The correct likely voter model will include the right mix of “likely” and “unlikely” voters based on the observed ratio of these voters previous elections — and not exclude unlikely voters entirely. Easiest to implement in RBS surveys when past vote history is available.
13
Using Voter Files
LIKELY VOTER MODELS: PROBABILISTIC VS. “CUT-OFF”

ECHELON INSIGHTS
Data Prep
1. Build a turnout model, predicting on the most directly comparable election.
2. Run a simulated election with these scores and get a list of predicted voters. Example code:
SQL: SELECT turnout_score, (CASE WHEN turnout_score > RANDOM() THEN 1 ELSE 0 END) as simulated_vote FROM voters WHERE simulated_vote = 1
R: voters$random <- runif(nrow(voters)); voters$simulated_vote <- 0; voters$simulated_vote[voters$score > voters$random] <- 1; predicted_voters <- voters[voters$simulated_vote == 1]
3. Create turnout score bins and assign frequencies based on predicted voters (e.g. 0 to 0.5 = 15%, 0.9 > 1 = 52% etc.)
14
Using Voter Files
USING VOTER FILES & TURNOUT SCORES: STEP BY STEPSurvey Work
4. Ensure a sample properly balanced between low-scoring and high-scoring voters, taking into account historic response amongst different groups.
5. With the survey data, weight to the known population characteristics of the registered electorate.
6. Then, using binned turnout score proportions from Step 3, weight to the likely electorate.

ECHELON INSIGHTS
• Because the likely voter model is probabilistic, we can adjust weighting to reflect higher or lower turnout scenarios, with specific total turnout numbers in mind.
• No observations are discarded when projecting lower turnout. Weights are simply adjusted, preserving the robustness of the original dataset.
15
Using Voter Files
BONUS FEATURE: MULTIPLE TURNOUT SCENARIOSTurnout Scores in Georgia: 2016 vs. 2018
2018
2016

ECHELON INSIGHTS
Step by Step
• Turnout scores vary something like exponentially when moving from low to high turnout situations and vice versa (e.g. the change will be heaviest amongst low-turnout voters).
• To project higher or lower turnout, you can an exponential equation on individual turnout scores (e.g. x ^ 1.1 for lower turnout, x ^ 0.9 for higher turnout)
• Recalculate frequencies within each turnout bin and adjust weighting.
16
Using Voter Files
BONUS FEATURE: MULTIPLE TURNOUT SCENARIOSTurnout Scores in Georgia: 2016 vs. 2018
2018
2016

CASE STUDY: SOUTH CAROLINA GOP PRIMARY 2016

ECHELON INSIGHTS
• Survey conducted Thursday and Friday nights before Saturday’s primary, N=935
• Broad sampling criteria: Only those who intended to instead vote in the Democratic primary were screened out. (The primary was open.)
• Four weighting scenarios: Traditional Demographic-based & Demographics + Turnout Scores at 600K, 685K (primary scenario), and 800K turnout.
• Our goals
1. Assess the performance of self-assessed likelihood to vote vs. voter-file based approaches as a predictor of turnout
2. Construct multiple scenarios based on varying turnout assumptions — in an environment where turnout was rising well above 2012 levels in ways that altered the electoral calculus.
18
Case Study: South Carolina GOP Primary 2016
OVERVIEW

ECHELON INSIGHTS
• Trump led Rubio (in our main scenario) by 11%. He won the primary by 10%.
• Traditional weighting uninformed by turnout scores had a slightly higher Trump lead (+12%).
• Our turnout scenarios ranged from 600k (2012-like) to 800k. Our main scenario was based on a turnout of 685k, and actual turnout was 730k.
19
Case Study: South Carolina GOP Primary 2016
RESULTS

ECHELON INSIGHTS
• Meaningful differences emerged in candidate choice across likelihood to turn out. Trump held a 17% advantage amongst the lowest turnout group vs. just 6% with the highest turnout group.
• But these trends were not enough to change the eventual winner of the GOP primary under any turnout scenario. Trump led across all groups.
20
Case Study: South Carolina GOP Primary 2016
TURNOUT SCORES VS. CANDIDATE CHOICE

ECHELON INSIGHTS
• Of 935 respondents sampled from the South Carolina voter file, 915 were matched back to a record on the post-2016 voter file. Further analysis is of these matched records.
• 80% actually voted in the primary.
• But self-assessed likelihood to vote was much higher.
• 88% said they were 10/10 in their likelihood to vote
• The average self-assessed turnout response was 9.48 / 10!
21
Case Study: South Carolina GOP Primary 2016
VOTE VALIDATION
ECHELON INSIGHTS
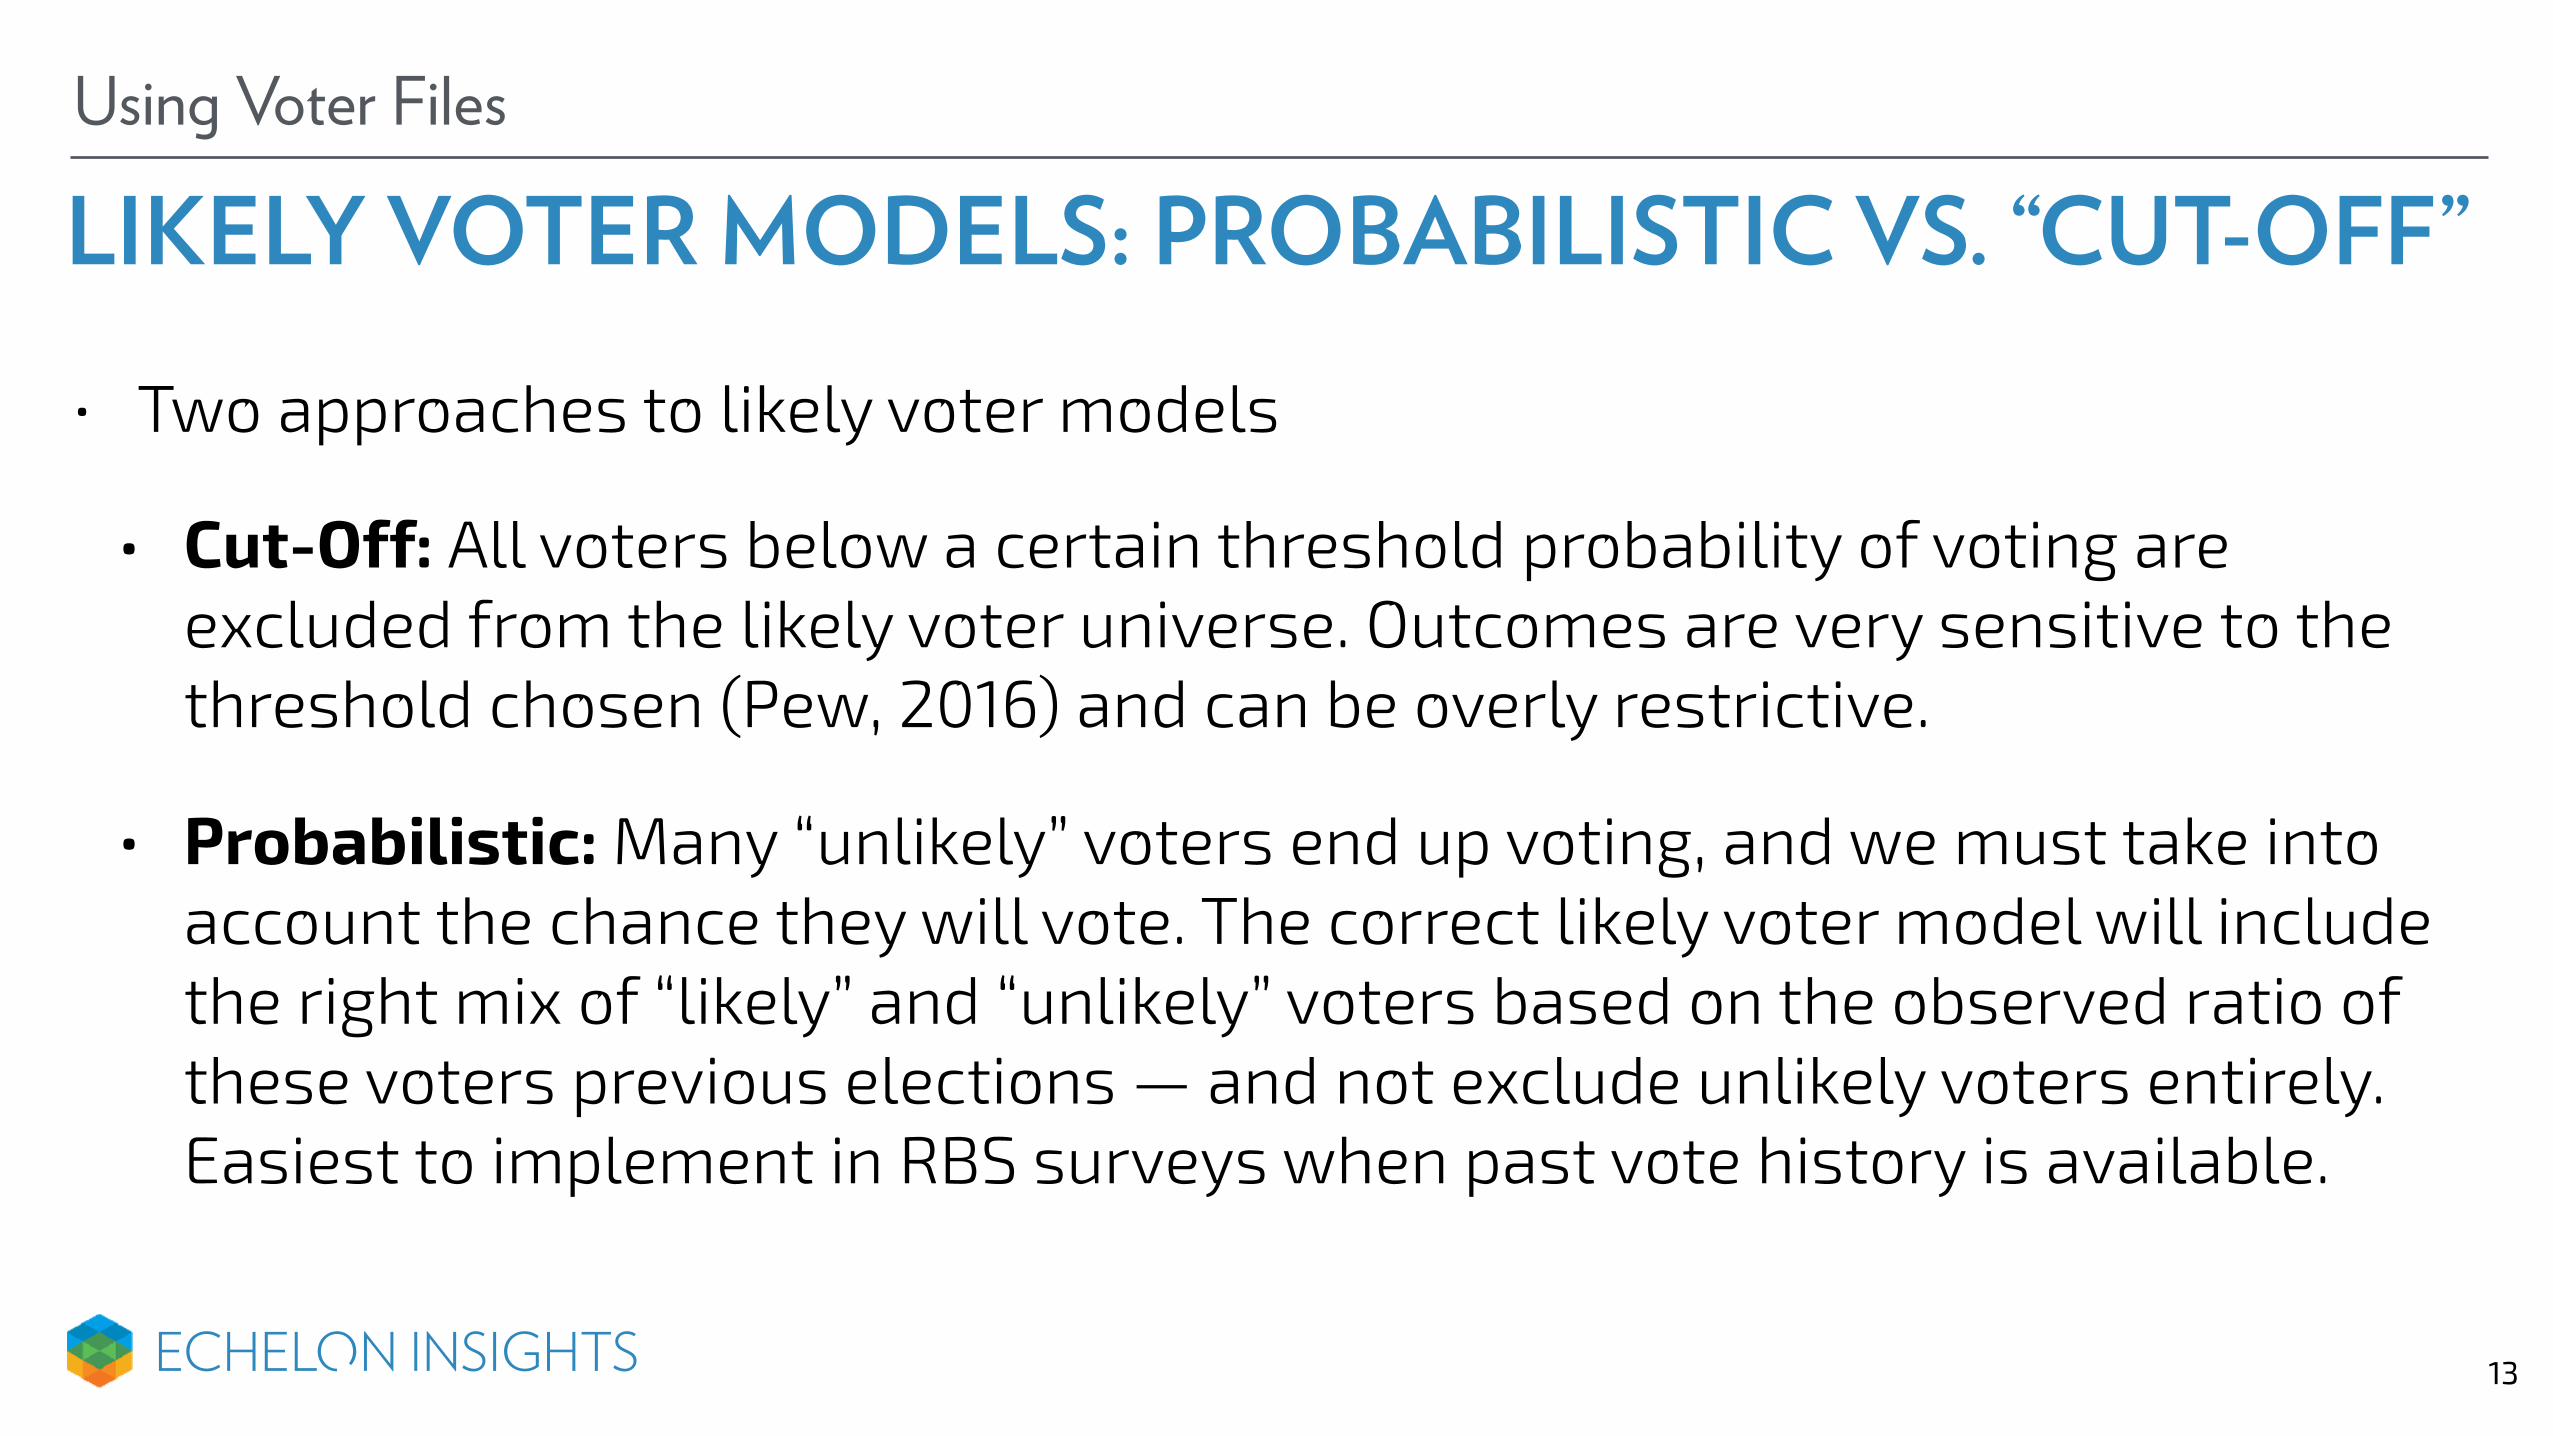
• Self-assessed likelihood to vote conveyed little useful information. 83% of 10/10s voted, but there was no correlation from 1 to 9 on the scale to actual turnout.
• By contrast, voter file turnout scores showed a positive correlation with turnout, and are better able to differentiate the respondents based on turnout propensity.
22
Case Study: South Carolina GOP Primary 2016
VOTER FILE TURNOUT SCORES MORE INFORMATIVE AND ACCURATE THAN SELF-ASSESSMENTS

BUT WHAT IF MODELS BASED ON PAST ELECTIONS DON’T PREDICT FUTURE OUTCOMES?
ECHELON INSIGHTS 24
Predicting Future Turnout
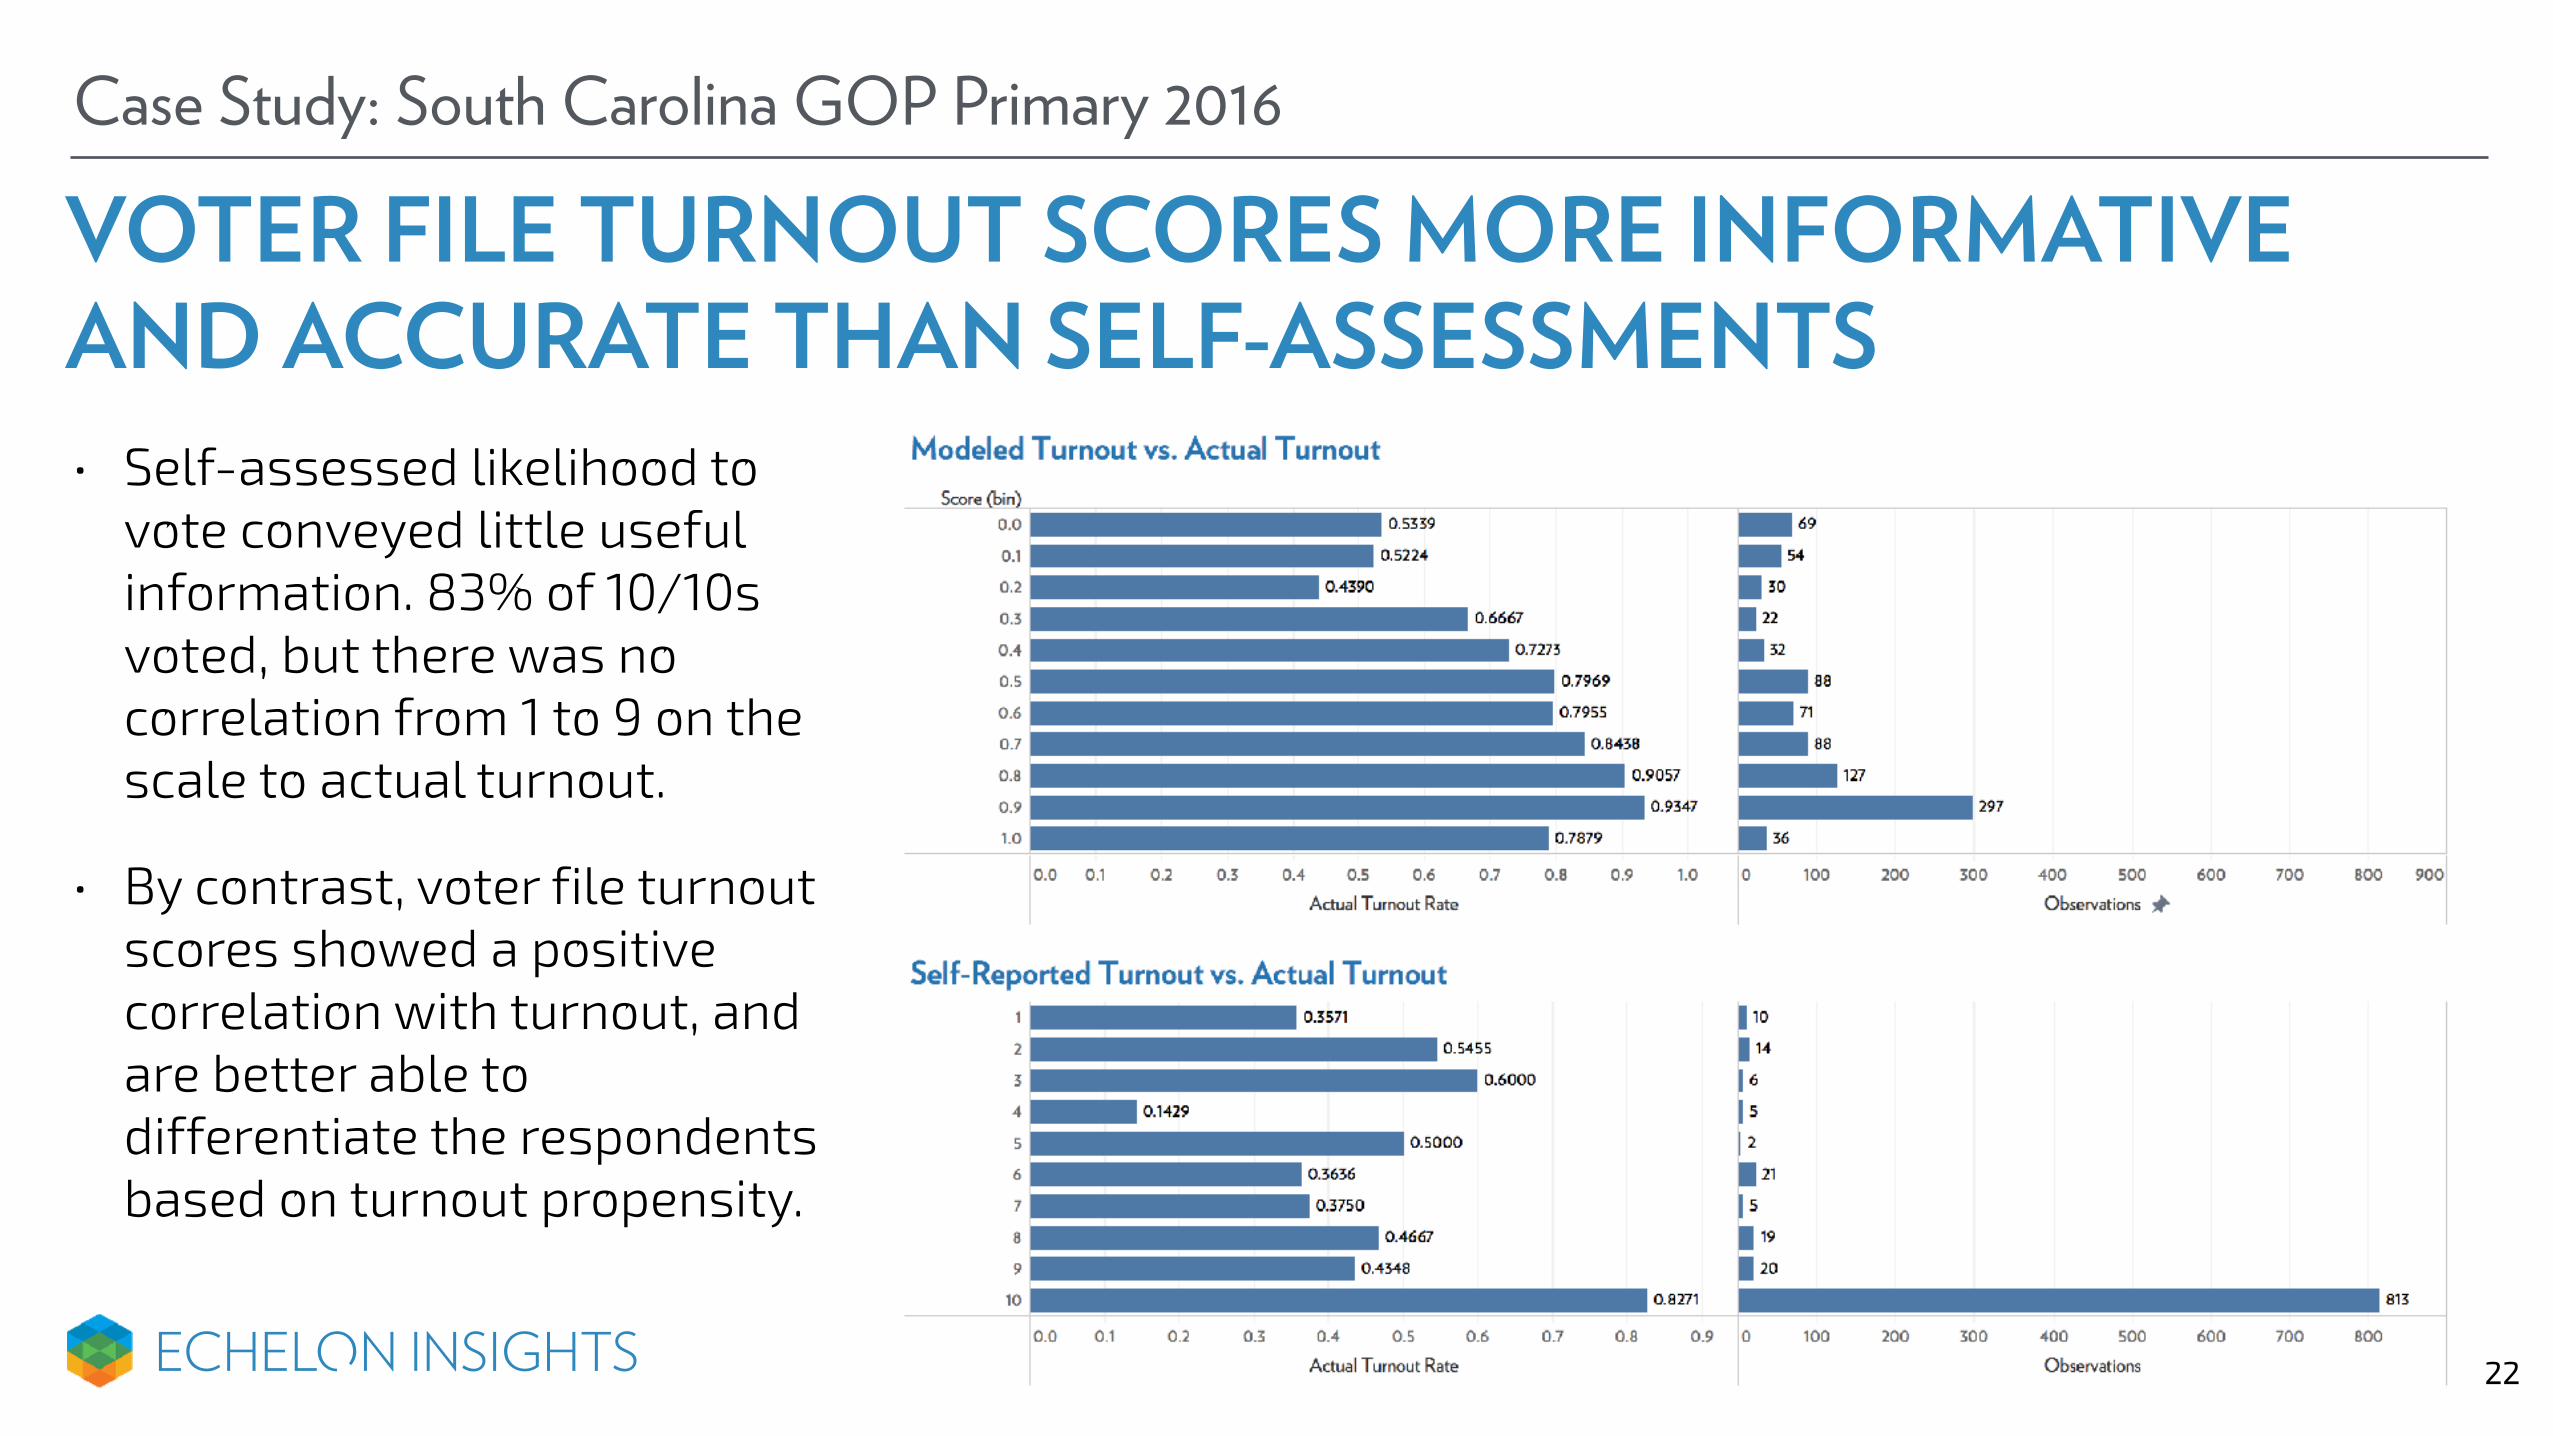
IN 2016, ACTUAL TURNOUT VARIED FROM TURNOUT MODELS BASED ON RACE• Across the battleground
states, white voter turnout was 5.5% above expected levels, while African Americans, the most loyal Democratic voter bloc, came in 6.8% below.
• Higher Asian and Latino turnout only partially offset the impact of declines in black turnout.
2016 Voter Turnout as a Percentage of Expected Levels

ECHELON INSIGHTS 25
Predicting Future Turnout
GA-6: MODELED VS. ACTUAL VS. MODELED TURNOUT BY PARTY
• In April 18th’s first round in Georgia’s 6th, high Democratic turnout created an electorate 3 to 4 points more favorable to them than a normal midterm election.
GA-6 Special Election Turnout vs. Expected Midterm Turnout, by Party
Dem
GOP
Independent

ECHELON INSIGHTS 26
The Midterms

Make smart choices.