Embed Size (px)
Citation preview

December 2000
by
Ronald S. HarichandranProfessor and Chairperson
and
M. Imad BaiyasiGraduate Student
Repair of Corrosion-Damaged Columnsusing FRP Wraps
Department of Civil and Environmental EngineeringMichigan State University
East Lansing, MI 48824-1226
Phone: (517) 355-5107Fax: (517) 432-1827
E-Mail: [email protected]://www.egr.msu.edu/~harichan

Form DOT F 1700.7 (8-72)
Technical Report Documentation Page 1. Report No.
Research Report RC-1386 2. Government Accession No. 3. Recipient’s Catalog No.
4. Title and Subtitle Repair of Corrosion-Damaged Columns using FRP Wraps
5. Report Date December 21, 2000
7. Author(s)
Ronald S. Harichandran, Ph.D., P.E. M. Imad Baiyasi, Ph.D.
6. Performing Organization Code
9. Performing Organization Name and Address
Michigan State University Department of Civil and Environmental Engineering East Lansing, MI 48824-1226
8. Performing Org Report No.
RC-1386
12. Sponsoring Agency Name and Address
Michigan Department of Transportation Construction and Technology Division P.O. Box 30049 Lansing, MI 48909
10. Work Unit No. (TRAIS)
11. Contract/Grant No.
15. Supplementary Notes 13. Type of Report & Period Covered
1/15/97 – 7/15/00
14. Sponsoring Agency Code
16. Abstract
Experiments were conducted to assess the effects of using fiber reinforced polymer (FRP) wraps with fibers oriented in the hoop direction for rehabilitating corrosion-damaged columns. Issues that were explored are: (1) freeze-thaw durability of concrete square and cylindrical specimens wrapped with glass and carbon FRP and subjected to an internal expansive force; (2) effect of wrapping on the rate of corrosion in an accelerated corrosion test; (3) effect of freeze-thaw and wet-dry cycles on the properties of FRP panels; (4) impact resistant of FRP panels supported on a concrete substrate; (5) effect of high temperature on wraps; and (6) field installation of wraps on corrosion-damaged bridge columns.
The results of the freeze-thaw experiment indicate that freeze-thaw cycles have no statistically significant effect on the compressive strength of glass and carbon wrapped specimens. For round specimens, glass and carbon wraps increased the strength by a factor of about 2.3 and 2.6, respectively. For square specimens, glass and carbon wraps increased the strength by a factor of 1.4-1.5. Freeze-thaw conditioning generally reduced the longitudinal failure strain of wrapped specimens.
The results of the accelerated corrosion experiment indicate that wrapping reduced the corrosion depth in the reinforcing bars by 46% to 59% after 190 days of testing. Both glass and carbon wraps are equally effective in slowing down corrosion.
Freeze-thaw and wet-dry conditioning had no detrimental effect on carbon FRP panels other than a 28% and 36% reduction, respectively, in the ultimate strain. Glass FRP panels showed 21% and 20% reductions in ultimate strength and ultimate strain due to freeze-thaw conditioning, and 18% and 20% reductions in ultimate strength and ultimate strain due to wet-dry conditioning. The results of tension tests on carbon panels were somewhat unreliable. Better grip fixtures should be used for future testing.
Both glass and carbon FRP panels did not display any significant damage due to the impact test. At temperatures in excess of 200°C the epoxy in the FRPs burn and evaporate and the individual plies of wraps
unravel. Hence the wraps become ineffective at such high temperatures unless effective insulation is provided. It is evident from the experimental study conducted that both carbon and glass wrap systems are sufficiently resistant
to freeze-thaw cycles and reduce the corrosion rate by about the same rate. Therefore, three layers of glass wrap or two layers of carbon wrap may be used to repair Michigan bridge columns.
17. Key Words
18. Distribution Statement No restrictions. This document is available to the public through the Michigan Department of Transportation.
19. Security Classification (report) Unclassified
20. Security Classification (Page) Unclassified
21. No of Pages 22. Price

Executive Summary
Repair of Corrosion-Damaged Columns Using FRP Wraps
Many bridge columns in Michigan are damaged by chloride contamination resulting in
the corrosion of the steel reinforcement, and swelling and spalling of the concrete and use of the
bridges is typically continued. This in itself may not be a serious problem since most columns in
Michigan are over-designed and the loss of strength is not a significant issue. However, the lack
of any method to minimize or prevent corrosion of the steel results in continued deterioration and
unsightly columns. Polymer composite (also known as fiber-reinforced polymer or FRP) jackets
offer a possible remedy to this problem. They offer a rapid repair technique with the potential to
enhance the long-term durability and compression strength of damaged columns due to the
confinement that is provided when fibers are oriented in the hoop direction. Fibers oriented in the
vertical direction can enhance the bending strength.
Experiments were conducted to assess the effects of using FRP wraps with fibers oriented
in the hoop direction for rehabilitating corrosion-damaged columns. Issues that were explored
are: (1) freeze-thaw durability of concrete square and cylindrical specimens wrapped with glass
and carbon FRP and subjected to an internal expansive force; (2) effect of wrapping on the rate
of corrosion in an accelerated corrosion test; (3) effect of freeze-thaw and wet-dry cycles on the
properties of FRP panels; (4) impact resistant of FRP panels supported on a concrete substrate;
(5) effect of high temperature on wraps; and (6) field installation of wraps on corrosion-damaged
bridge columns.
i

The results of the freeze-thaw experiment indicate that freeze-thaw cycles have no
statistically significant effect on the compressive strength of glass and carbon wrapped
specimens. For round specimens, glass and carbon wraps increased the strength by a factor of
about 2.3 and 2.6, respectively. For square specimens, glass and carbon wraps increased the
strength by a factor of 1.4-1.5. Freeze-thaw conditioning generally reduced the longitudinal
failure strain of wrapped specimens.
The square wrapped specimens had lower compressive strength compared to the round
specimens, even though the cross sectional area of the square prisms is higher than that of the
round cylinders. This is due to the reduced confinement provided by the wraps for square cross
sections and stress concentrations that develop at the corners. Wrapped square prisms always
failed by rupture of the wrap at a corner. A reduction of approximately 30% to 40% in failure
stress was noted between round and square wrapped specimens.
The results of the accelerated corrosion experiment indicate that wrapping reduced the
corrosion depth in the reinforcing bars by 46% to 59% after 190 days of testing. Both glass and
carbon wraps are equally effective in slowing down corrosion. Although unbonded wraps do
reduce stress concentrations in the FRP, they are less effective in reducing the corrosion rate than
the bonded wraps. It is postulated that this is due to the ingress of water along the unbonded
FRP-concrete interface.
Wrap strains for bonded specimens with both types of wraps tend to level off with time
indicating that corrosion slows down significantly after some time. One explanation could be that
the stress concentration near the anodes in the bonded wraps is more effective in containing the
corrosion-induced crack and reducing the corrosion rate. The slip of unbonded wraps and the
ii

resulting redistribution of strain along the entire wrap may be less effective at containing the
large corrosion-induced crack near the anodes.
Freeze-thaw conditioning had little effect on the effective stiffness (modulus × thickness)
of glass FRP panels. Although the effective stiffness of carbon panels showed an apparent
increase due to freeze-thaw conditioning, re-testing indicated that this observation was
unreliable. The ultimate strength per unit width per layer of glass FRP decreased by 21% and the
decrease was significant at the 95% level. The change in the ultimate strength of carbon was not
significant at the 95% level. Ultimate strains decreased by 20% and 28% for glass and carbon
panels, respectively, and these decreases were significant at the 95% level.
Wet-dry conditioning had no effect on the effective stiffness of glass panels. As with
freeze-thaw conditioning, the effective stiffness of carbon panels showed an apparent increase
due to wet-dry conditioning, but re-testing indicated that this observation was unreliable. The
ultimate strength per unit width per layer of glass FRP decreased by 18% and the decrease was
significant at the 95% level. The change in the strength of carbon was not significant at the 95%
level. Ultimate strains decreased by 20% and 36% for glass and carbon panels, respectively, and
these decreases were significant at the 95% level.
The panel test results are somewhat unreliable for the very thin carbon specimens. Also,
many of the specimens broke at the grips. Better grip fixtures should be used for future tests.
Both glass and carbon FRP panels did not display any significant damage due to the
impact test. Minor interlaminar debonding was visible on the glass panels, which are somewhat
transparent, at the point of impact. Interlaminar debonding could not be observed on the carbon
FRP panels because they are opaque.
iii

At temperatures in excess of 200°C the epoxy in the FRPs burn and evaporate and the
individual plies of wraps unravel. Hence the wraps become ineffective at such high temperatures
unless effective insulation is provided.
It is evident from the experimental study conducted that both carbon and glass wrap
systems are sufficiently resistant to freeze-thaw cycles and reduce the corrosion rate by about the
same rate. Therefore, three layers of glass wrap or two layers of carbon wrap may be used to
repair Michigan bridge columns. Reducing the number of layers may also be feasible, but it is
not possible to provide any recommendation about this without additional studies.
The preferred wrap system will most likely depend on the material and installation cost
rather than performance issues. However, it should be noted that many studies indicate strength
degradation of glass FRP in an alkaline and/or humid environment under elevated temperature.
Thus in regions with long periods of hot and humid conditions, carbon FRP may be preferable to
glass FRP.
It is also recommended that a non-destructive technique or coring be used every ten years
to monitor the condition of the concrete inside the wrap.
iv

TABLE OF CONTENTS
CHAPTER 1: INTRODUCTION AND LITERATURE REVIEW
1.1 INTRODUCTION ...................................................................................................1 1.2 PROJECT OBJECTIVES ........................................................................................3 1.3 LITERATURE REVIEW ........................................................................................4 1.3.1 Fiber Reinforced Polymers (FRP) for Infrastructure ..................................... 4 1.3.1.1 Fibers .................................................................................................. 4 1.3.1.2 Matrices ............................................................................................. 6 1.3.2 Durability of Concrete ..................................................................................... 7 1.3.3 Environmental Effects on FRP Composites ................................................... 8 1.3.4 Corrosion of Reinforcing Steel ..................................................................... 12 1.3.4.1 Factors Affecting Corrosion ............................................................ 13 1.3.4.2 Volume Expansion Due to Corrosion of Steel ............................... 15 1.3.4.3 Localized Corrosion ........................................................................ 16 1.3.5 Mechanical Properties of FRPs ..................................................................... 17 1.3.5.1 Stress Corrosion and Stress Rupture ............................................... 17 1.3.6 Effect of Confinement ................................................................................... 18 1.3.7 Repair of Corrosion Damaged Columns Using FRP ................................... 24 1.3.8 Effect of Fire and High Temperature on FRPs ............................................. 27 CHAPTER 2: DESCRIPTION OF EXPERIMENTS
2.1 STIFFNESS AND STRENGTH OF GLASS AND CARBON FRP’S .................. 29 2.2 STRAIN EXPECTED IN WRAPS DUE TO CORROSION .................................. 30 2.3 FREEZE-THAW TEST ............................................................................................ 31
2.3.1 Mold Fabrication ........................................................................................... 33 2.3.2 Bristar Calibration ......................................................................................... 34 2.3.3 Chloride Content ........................................................................................... 37 2.3.4 Strain Gage Placement .................................................................................. 38 2.3.5 Compression Testing ..................................................................................... 40
2.4 ACCELERATED CORROSION .............................................................................. 42 2.4.1 Corrosion Prior to Wrapping ........................................................................ 45 2.4.2 Construction of the Corrosion Tank and Appurtenances ............................. 47 2.4.3 Monitoring Progress of Corrosion During Test .........................................48 2.4.4 Corrosion Test Matrix ................................................................................52
2.5 FREEZE-THAW AND WET-DRY CYCLING OF FRP PANELS .....................53 2.6 IMPACT TEST ......................................................................................................53 2.7 HIGH TEMPERATURE TEST .............................................................................54
v

CHAPTER 3: DATA COLLECTION AND ANALYSIS OF RESULTS
3.1 FREEZE-THAW TEST .........................................................................................57 3.1.1 Strain Gage Readings .................................................................................... 57 3.1.2 Results of Compression Testing ................................................................... 69 3.1.3 Statistical Analysis ........................................................................................ 80 3.1.4 Effect of Sustained Loads on Freeze-Thaw Durability of Wraps .............87
3.1.5 Comparison of Measured and Predicted Compression Strength ...............87 3.2 ACCELERATED CORROSION...........................................................................88 3.2.1 Mass Loss Results ......................................................................................88 3.2.2 Statistical Analysis .....................................................................................93
3.2.3 Strain Measurements ..................................................................................95 3.3 EFFECT OF FREEZE-THAW AND WET-DRY CYCLING ON THE
PROPERTIES OF FRP PANELS ........................................................................100 3.4 IMPACT TEST ....................................................................................................106 3.5 BEHAVIOR AT VERY HIGH TEMPERATURE .............................................106 CHAPTER 4: SUMMARY, CONCLUSIONS, AND RECOMMENDATIONS 4.1 FREEZE-THAW TEST .......................................................................................107 4.2 ACCELERATED CORROSION TEST ..............................................................109 4.3 EFFECT OF FREEZE-THAW AND WET-DRY CYCLES ON FRP
PANELS ..............................................................................................................110 4.4 BEHAVIOR UNDER IMPACT AND HIGH TEMPERATURE .......................111 4.5 RECOMMENDATION FOR FIELD INSTALLATION ....................................111 4.6 REPAIR COSTS ..................................................................................................112 CHAPTER 5: FIELD INSTALLATION AND FUTURE STUDIES 5.1 CORROSION MONITORING OF FIELD COLUMNS .....................................113 5.2 RESULTS OF FIELD MONITORING ...............................................................119 5.3 CALCULATION OF CORROSION RATE .......................................................119 REFERENCES ............................................................................ 121
APPENDIXES
APPENDIX A: Aerospace Corporation’s FRP Panel Durability Data ............................125 APPENDIX B: Properties of Individual Test Specimens ................................................127 APPENDIX C: Calculation Details .................................................................................131 B.1 Strain in Column Wrap After 10 Years ...................................................131 B.2 Confining Pressure and Strain in Steel Jacket .........................................132 APPENDIX D: Specimen, Bar and Gage Numbering .....................................................134 APPENDIX E: Concrete Mix Ratios and the 28-Day Strength .......................................136
vi

APPENDIX F: ASTM G1 Specifications ........................................................................137 APPENDIX G: Corrosion Probe Manufacturer’s Data ...................................................143 APPENDIX H: Provisions for Field Installation .............................................................151
vii

LIST OF TABLES
Table 1.1 Capillary porosity of Portland cement paste as a function of water/cement ratio and the degree of hydration ...........................................7
Table 2.1 Vender recommended and measured wrap properties for a single layer ...30
Table 2.2 Volume expansion for some rust products .................................................30
Table 2.3 Strain in column wrap due to steel corrosion after 10 years ......................31
Table 2.4 Freeze-thaw laboratory test matrix ............................................................33
Table 2.5 Internal pressure generated by corrosion for wrap strain of 0.531% .........35
Table 2.6 Corrosion level required in two bars to induce a strain of 0.531% in the wrap ....................................................................................44
Table 2.7 Number of wrapped and unwrapped specimens in corrosion groups ........46
Table 2.8 Accelerated corrosion laboratory test matrix .............................................53
Table 3.1 Ductility enhancement under compression for wrapped specimens ..........81 Table 3.2 Freeze-thaw summary data ........................................................................82 Table 3.3 Results of hypothesis tests (95%) on specimens exposed to
freeze-thaw cycles ......................................................................................83
Table 3.4 Comparison of measured and predicted confined compression strength .......................................................................................................88
Table 3.5 Mass loss and average corrosion depth for specimens exposed to 130 days of accelerated corrosion ..............................................................91
Table 3.6 Mass loss and average corrosion depth for specimens exposed to 190 days of accelerated corrosion ..............................................................92
Table 3.7 Results of hypothesis tests (95%) on specimens exposed to accelerated corrosion .................................................................................94
Table 3.8 Mean properties per layer for unconditioned and conditioned FRP panels ...............................................................................................101
Table 3.9 Outcome of 95%-level significance tests for μcontrol −μF/T .......................101
Table 3.10 Outcome of 95%-level significance tests for μcontrol −μwet-dry ...................101
Table 3.11 Properties per layer of FRP panels from additional tests and re-tests .....104
Table 4.1 Estimated material and installation cost for Tyfo-S glass and MBrace carbon wrap systems ..................................................................112
Table 5.1 Initial weight of corrosion bars installed in field columns ......................114
Table 5.2 Dial readings for corrosion probes installed in field columns .................119
viii

LIST OF FIGURES
Fig. 1.1 Load vs. deflection curve for glass FRP composite specimens subjected to 300 cycles of freezing and thawing .........................................9
Fig. 1.2 Expansion and cracking of concrete due to corrosion of the embedded steel ...........................................................................................15
Fig. 1.3 Reduction of tensile strength of E-glass fibers under sustained loads .......17
Fig. 1.4 Stress/strain curves for confined and unconfined concrete ........................19
Fig. 1.5 Stress-strain curves for A36 steel, E-glass and carbon fibers ....................20
Fig. 1.6 Illustration of effectively confined area of a rectangular cross section .....23
Fig. 2.1 Prism mold used for freeze-thaw test specimens .......................................33
Fig. 2.2 Cylindrical mold used for freeze-thaw test specimens ..............................34
Fig. 2.3 Strain in steel tube for water/Bristar ratio of 400g/1000g .........................36 Fig. 2.4 Strain in steel tube for water/Bristar ratio of 500g/1000g .........................36 Fig. 2.5 Strain measurement instrument and switch box ........................................40
Fig. 2.6 Capping fixture ..........................................................................................41
Fig. 2.7 New compressometer .................................................................................41
Fig. 2.8 Wiring diagram for accelerated corrosion specimens ................................43
Fig. 2.9 Severely corroded specimens prior to patching .........................................46
Fig. 2.10 Patching of the severely corroded specimens ............................................47 Fig. 2.11 Corrosion tank ............................................................................................48
Fig. 2.12 Corrosion specimens in the tank ................................................................48
Fig. 2.13 Sample X-ray taken in the beginning of the accelerated corrosion test .....50
Fig. 2.14 Sample X-ray taken after 90 days of accelerated corrosion test ................50
Fig. 2.15 Sample X-ray taken after 105 days of accelerated corrosion test ..............51
Fig. 2.16 Reinforcing bars after removal from a corrosion specimen .......................51
Fig. 2.17 Impact testing machine ..............................................................................55
Fig. 3.1 Hoop strains in glass wrap of round control specimen #3 before correcting for thermal contraction of dummy FRP panel ..........................59
Fig. 3.2 Hoop strains in glass wrap of square control specimen #7 before correcting for thermal contraction of dummy FRP panel ..........................59
Fig. 3.3 Hoop strains in carbon wrap of round control specimen #11 before correcting for thermal contraction of dummy FRP panel ..........................60
ix

Fig. 3.4 Hoop strains in carbon wrap of square control specimen #15 before correcting for thermal contraction of dummy FRP panel ..........................60
Fig. 3.5 Hoop strains in glass wrap of round specimen #1 during freeze-thaw cycles ......................................................................................61
Fig. 3.6 Hoop strains in glass wrap of round specimen #2 during freeze-thaw cycles ......................................................................................61
Fig. 3.7 Hoop strains in glass wrap of control round specimen #3 .........................62
Fig. 3.8 Hoop strains in glass wrap, round specimen #4 during freeze-thaw cycles ......................................................................................62
Fig. 3.9 Hoop strains in glass wrap, square specimen #5 during freeze-thaw cycles ......................................................................................63
Fig. 3.10 Hoop strains in glass wrap, square specimen #6 during freeze-thaw cycles ......................................................................................63
Fig. 3.11 Hoop strains in glass wrap of control square specimen #7 ........................64
Fig. 3.12 Hoop strains in glass wrap of square specimen #8 during freeze-thaw cycles ......................................................................................64
Fig. 3.13 Hoop strains in carbon wrap of round specimen #9 during freeze-thaw cycles ......................................................................................65
Fig. 3.14 Hoop strains in carbon wrap of round specimen #10 during freeze-thaw cycles ......................................................................................65
Fig. 3.15 Hoop strains in carbon wrap of control round specimen #11 ....................66 Fig. 3.16 Hoop strains in carbon wrap of round specimen #12 during
freeze-thaw cycles ......................................................................................66
Fig. 3.17 Hoop strains in carbon wrap of square specimen #13 during freeze-thaw cycles ......................................................................................67
Fig. 3.18 Hoop strains in carbon wrap of square specimen #14 during freeze-thaw cycles ......................................................................................67
Fig. 3.19 Hoop strains in carbon wrap of control square specimen #15 ...................68
Fig. 3.20 Hoop strains in carbon wrap of square specimen #16 during freeze-thaw cycles ..........................................................................68
Fig. 3.21 Compressive stress-strain curves for plain, round, control specimens ......71
Fig. 3.22 Compressive stress-strain curves for plain, round specimens subjected to 150 freeze-thaw cycles ..........................................................71
Fig. 3.23 Compressive stress-strain curves for plain, round specimens subjected to 300 freeze-thaw cycles ..........................................................72
Fig. 3.24 Compressive stress-strain curves and tensile hoop strain for glass-wrapped, round, control specimens ..................................................72
x

Fig. 3.25 Compressive stress-strain curves for glass-wrapped, round specimens subjected to 150 freeze-thaw cycles .........................................73
Fig. 3.26 Compressive stress-strain curves and tensile hoop strain for glass-wrapped, round specimens subjected to 300 freeze-thaw cycles .....73
Fig. 3.27 Compressive stress-strain curves and tensile hoop strain for glass-wrapped, square, control specimens .................................................74
Fig. 3.28 Compressive stress-strain curves for glass-wrapped, square specimens subjected to 150 freeze-thaw cycles .........................................74
Fig. 3.29 Compressive stress-strain curves and tensile hoop strain for glass-wrapped, square specimens subjected to 300 freeze-thaw cycles ....75
Fig. 3.30 Compressive stress-strain curves and tensile hoop strain for carbon-wrapped, round, control specimens ...............................................75
Fig. 3.31 Compressive stress-strain curves for carbon-wrapped, round specimens subjected to 150 freeze-thaw cycles .........................................76
Fig. 3.32 Compressive stress-strain curves and tensile hoop strain for carbon- wrapped, round specimens subjected to 300 freeze-thaw cycles ...............76
Fig. 3.33 Compressive stress-strain curves and tensile hoop strain for carbon-wrapped, square, control specimens ..............................................77
Fig. 3.34 Compressive stress-strain curves for carbon-wrapped, square specimens subjected to 150 freeze-thaw cycles .........................................77
Fig. 3.35 Compressive stress-strain curves and tensile hoop strain for carbon- wrapped, square specimens subjected to 300 freeze-thaw cycles ..............78
Fig. 3.36 Failure modes for square specimens under compression testing ...............78
Fig. 3.37 Failure modes for round specimens under compression testing ................79
Fig. 3.38 Average compressive strength of round glass-wrapped specimens ...........84
Fig. 3.39 Average compressive strength of round carbon-wrapped specimens ........85
Fig. 3.40 Average compressive strength of square glass-wrapped specimens ..........85
Fig. 3.41 Average compressive strength of square carbon-wrapped specimens .......86
Fig. 3.42 Average compressive strength of round plain specimens ..........................86
Fig. 3.43 Average corrosion depths due to accelerated corrosion ............................90 Fig. 3.44 Hoop strains in bonded, glass-wrapped specimens ....................................97
Fig. 3.45 Hoop strains in unbonded, glass-wrapped specimens ................................97
Fig. 3.46 Hoop strains in bonded, carbon-wrapped specimens .................................98
Fig. 3.47 Hoop strains in unbonded, carbon-wrapped specimens .............................98
Fig. 3.48 Hoop strains in glass and carbon-wrapped specimens, gages at the anodes ...............................................................................................99
xi

xii
Fig. 3.49 New carbon sample and re-test of carbon sample subjected to wet-dry conditioning ................................................................................104
Fig. 3.50 New carbon sample and re-test of carbon sample exposed to freeze-thaw ...............................................................................................105
Fig. 3.51 Re-test of glass sample subjected to freeze-thaw ....................................105
Fig. 5.1 Column condition before surface repairs .................................................115
Fig. 5.2 Column condition after surface repairs ....................................................115
Fig. 5.3 Corrosion probe and reinforcing bars for monitoring mass loss ..............116
Fig. 5.4 Field installation of glass wrap to selected columns ................................116
Fig. 5.5 Field installation of carbon wrap to selected columns .............................117 Fig. 5.6 Completed installation of glass and carbon wraps ...................................117
Fig. 5.7 Control (far left), carbon-wrapped (left) and glass-wrapped (right) columns under westbound overpass (S09) ...............................................118
Fig. 5.8 Control (far right), carbon-wrapped (right) and glass-wrapped (left) columns under eastbound overpass (S10) ................................................118

Chapter 1 Introduction and Literature Review
1.1 Introduction
Retrofitting bridge columns with jackets encasing the concrete has been undertaken
extensively in the West Coast, primarily for seismic rehabilitation. Steel jackets have been used
for the most part, but are expensive to install and require several days for each column. The use
of fiber reinforced polymers (FRP) wraps also has been developed and numerous columns have
been retrofitted with different kinds of wraps. FRP wraps can be installed quickly (four to six
columns per day), with minimal interruption to traffic flow. FRP wraps can be made of low-cost
glass fiber, medium-cost aramid (also known as Kevlar) fiber, or high-cost high- performance
carbon fiber, and polyester, vinyl ester or epoxy resins can be used as a matrix. Hexcel Fyfe Co.
(Del Mar, Calif.) is the first composite fabricator to install a field demonstration with the
California Department of Transportation, but other suppliers such as XXsys Technologies Inc.,
C. C. Myers Inc., Master Builders Inc., Mitsubishi Corporation, and Hardcore DuPont
Composites L.L.C. also are performing field installations now.
The Pennsylvania Department of Transportation selected the Tyfo-S fiber wrap system
(by Fyfe Company) for a concrete-column repair project on Interstate 84 in Scranton (Tarricone
1995). The New York State Department of Transportation used FRP wraps on six severely
deteriorated concrete columns of the Court Street Bridge (Tioga County) in the summer of 1998
to protect against failures and to improve their durability in a cost effective manner. Six suppliers
of FRP column wraps participated in this project (Alampalli et al. 1999). In California numerous
columns have been wrapped with the Tyfo-S fiber wrap system, and XXsys
1

Technologies’filament winding for the bridges under the jurisdiction of the California
Department of Transportation. This was done mainly for seismic strengthening. XXsys
Technologies in conjunction with the Utah Department of Transportation used its composite
wrapping system in 1996 to strengthen and extend the useful life of an existing bridge. The
bridge had deteriorated from the effects of more than thirty years of corrosion of the steel
reinforcing bars. Structural Preservation Systems of Baltimore, Maryland has used carbon wraps
in 1997 to strengthen parking garage columns in Charleston, South Carolina.
While advanced composite materials are relatively expensive, labor costs are
approximately 30% less than for conventional strengthening methods primarily because of the
light weight of the materials. The quick turnaround and the reduced labor costs associated with
FRP have reduced the overall cost making its use attractive for rehabilitation and strengthening
of concrete infrastructure.
Four types of FRP jackets are currently available:
• Composite fabrics: The fabrics must be thoroughly saturated usually with two-part resin
during installation and are cured at room temperature. The mechanical properties of the final
product are somewhat variable. The Tyfo™ S Fiberwrap System by Fyfe Company is of this
type.
• Prepregnated composite fabrics (Prepregs): Prepregs are pre-impregnated, usually with an
epoxy resin, which results in good control over the mechanical properties of the final prod-
uct. However, most prepregs must be stored in cold storage before installation, and need to
be thermally cured after installation. For column applications, thermal curing can be achieved
using heating blankets. There are few commercial carbon fiber prepregs, such as MBrace and
REPLARK marketed by Master Builders and Mitsubishi respectively, that may be air cured.
2

• Filament winding: Jackets are produced by winding a continuous composite fiber onto the
resin coated column. Typically automated winding equipment is used and the jacket is heat
cured. XXsys Technolgies has retrofitted several columns in the West Coast using this
technology.
• Precured shells: Precured jackets are formed around a mandrel of the diameter matching the
column to be jacketed, typically using a multi-axial, stitched, nonwoven E-glass fiber fabric.
The jackets have an axial slit that allows them to be opened and placed around a column for
installation. Field crews install the jacket by first spraying a urethane adhesive onto the
column. Two workers can then snap on a 132 kg, 1.2 m tall by 1.2 m diameter jacket
segment. The adhesive and jacket installations are repeated to obtain three to five plies of
composite, with the axial slit in each additional ply being staggered from that of the previous
ply to avoid overlap. The whole multi-layer jacket system is bound to the column while the
adhesive cures, creating an efficient, labor-saving system. As an alternative to the 3600
bands, smaller arc segments can be installed by gluing each segment around the column with
sufficient overlap. The smaller arc segments are easier to package and ship.
All of the jacketing systems described above are acceptable, and the advantage of one
over another would depend on their performance in Michigan’s harsh climate, their cost and their
availability. Precured shells are presently available only for circular columns.
1.2 Project Objectives
The main objective of this project was to investigate the suitability of using glass and carbon
FRP wraps to repair concrete columns damaged by corrosion in Michigan. The following issues
were investigated:
3
• Strength loss of wrapped columns subjected to expansive forces, due to freezing and
thawing.
• Strains in FRP wraps during freeze-thaw conditioning.
• Increased strength of concrete due to confinement provided by wraps.
• Magnitude of confining pressure generated by wraps due to corrosion.
• Localization of strains in wraps bonded to the concrete near reinforcing bars and the merit of
using unbonded wraps.
• Reduction in corrosion rate due to the use of FRP wraps.
1.3 Literature Review
1.3.1 Fiber Reinforced Polymers (FRP) for Infrastructure
Newly developed composite materials have been used recently in civil engineering
structures because of their superior mechanical properties as well as their resistance to aggressive
environmental conditions. In general composites can be defined as a combination of two or
more materials, that are insoluble into one another, without chemical interaction such that the
properties of the combination is better than the individual constituents (De Wilde 1988). Fiber
reinforced polymers are made of two constituent materials: polymer fibers and polymer matrices.
1.3.1.1 Fibers
Fibers have the largest volume and are the load-carrying element of FRP composites.
Proper selection of the amount, type and orientation results in a composite with the desired
mechanical properties.
• Glass fibers: These are widely used. Molten glass can be drawn into fine continuous
filaments. These can be fabricated into continuous fibers, chopped strands, woven fabrics
4

and milled fibers. The strength of glass fiber is highly dependent on the form in which the
fibers are used. Continuous fibers have the highest strength and chopped fibers have the
lowest strength. The average tensile strength for freshly drawn glass fibers may exceed 3500
MPa. Surface flaws tend to reduce this value to between 1750-2100 MPa. The internal
structure of a glass fiber is a three dimensional network of different atoms. They behave in a
linearly elastic manner until failure (Mallik 1993). Glass fibers are available in a variety of
forms suited for different applications. The most common type is E-glass (which was initially
developed for use in electrical applications). Other types of glass fibers that are used include
S-glass (which has approximately 25% greater tensile strength than E-glass but is more
expensive), C-glass (which was developed for application in corrosive environments), D-
glass (which has lower density and dielectric constant than the other types of glass fibers),
AR-glass (alkali resistant), and ECR-glass (modified E-glass which provides improved acid
resistance).
• Carbon and graphite fibers: The difference between carbon and graphite is in the molecular
structure. In carbon, the bonding between layers is weak, so it has two-dimensional ordering.
Graphite is formed from carbon atoms, which are arranged in crystallographical parallel
planes of regular hexagons. Carbon fibers are commercially available in three basic forms:
long and continuous tow, chopped (6-50 mm long), and milled (30-300mm long). Carbon
fiber can also be woven into two-dimensional fabrics of various styles. Graphite fibers are
mainly considered in high strength composite applications. They show very high specific
strength and stiffness. Graphite has a higher tensile modulus than carbon. Generally, as the
modulus of elasticity increases, ultimate load and elongation decreases. Therefore, high
modulus graphite fibers exhibit a lower strain at failure than high strength carbon. The tensile
5

strength and the modulus of elasticity of graphite and carbon are not temperature dependent.
These fibers behave elastically to failure and are highly resistant to aggressive environment.
Their diameter is in the range of 5 to 10 microns.
• Aramid fibers: Made from aromatic polyamides, these have the lowest specific gravity and
highest specific tensile strength among all type of fibers (Mallik 1993). Due to its high
tensile strength and modulus of elasticity, aramid was the first organic fiber to be used as a
reinforcing fiber.
1.3.1.2 Matrices
The matrix is considered the secondary material in FRPs. Its major roles are transferring
stresses between the fibers and protecting fibers against the environmental and mechanical
conditions. The importance of the matrix in a composite is its effect on interlaminar and in-plane
shear strengths. It also provides support against buckling of the fibers under compressive loads.
Polymer matrices are divided into two categories:
• Thermoplastic Polymers: Individual molecules are in a linear structural form. Weak
secondary bond holds these molecules together. Heat or pressure temporarily breaks the
bonds, which causes movement between the molecules. After cooling, the molecules set into
their new position. Thermoplastics have higher impact strength, fracture and microcracking
resistance compared to thermosetting polymers. Examples of thermoplastic polymers include
nylon and polyethylene.
• Thermosetting Polymers: Also known as resin. The molecules are joined together by cross-
links, which leads to a more stable three-dimensional form that can not be reshaped by heat
6

or pressure. Epoxy, polyester, and vinyl ester are the most common types of thermosetting
polymers (Malek and Saadatmanesh 1996).
1.3.2 Durability of Concrete
Concrete is a porous material consisting of cement, water, fine and coarse aggregates and,
possibly, admixtures. Cement and water react to form a hardened paste binding together the
coarse and the fine aggregates. Voids are left in the originally water-filled space between the
cement grains, which are not filled with the hydration products of the chemical reactions. These
voids are known as capillary pores. They range in size from approximately 5 nm to 1 mm.
Capillary forces in such small volumes play an important role in the durability characteristics of
concrete.
The capillary pore volume is a function of two parameters: the water/cement ratio of the
paste, and degree of hydration of the cement (Pigeon and Pleau 1988). Table 1.1 gives the
approximate capillary porosity of Portland cement paste as a function of the water/cement ratio
and the degree of hydration. The water/cement ratio and the degree of hydration also have an
influence on the average size of capillary pores. The average size decreases significantly with
the degree of hydration, and the number of very large pores decreases significantly with lower
water/cement ratios.
Table 1.1. Capillary porosity of Portland cement paste as a function of the water/cement ratio and the degree of hydration
Water/cement ratio (by mass)
Capillary Porosity (% volume)
At 50% hydration At 75% hydration
0.4 31 18
0.5 39 28
0.6 46 36
7

Cement paste also contains a significant volume of smaller pores that are called gel pores.
The hydrants have a very large specific surface area, which is covered with a few layers of
absorbed water. The gel pores correspond to the surface occupied by this absorbed water. Unless
the temperature is high or the relative humidity is very low, the gel pores are always filled with
water because the forces that bind water to the surfaces of the hydrates are strong.
When ice forms in the pores, a 9% increase in the volume of water takes place when
water changes from liquid to solid. This volume expansion and the flow of water, as it is forced
out of the pores, cause tensile stress to be generated in the paste. This is the basic cause of
damage to concrete due to freezing.
When concrete is air entrained, which is achieved by adding admixtures to the mix, a
very large number of closely spaced air voids develop. If these air voids are sufficiently close,
the pressure generated by the flow of water out of the pores does not cause any damage and
water can freeze in these voids without generating internal pressures in the concrete (Pigeon and
Pleau 1988).
1.3.3 Environmental Effects on FRP Composites
Environmental factors such as extreme temperature fluctuation and water absorption can
adversely affect the behavior of some polymer composite material. Water absorption reduces the
strength and stiffness of some polymeric composites by as much as 30%, compared to dry
material. Water absorption breaks down the interface between the reinforcing fiber and resin
matrix leading to loss of strength and rigidity. Cycles of freezing and thawing tend to magnify
8

the effect of water absorption (Gomez and Casto 1996). The strength loss in glass FRP due to
300 cycles of freezing and thawing is depicted in Figure 1.1
Figure 1.1 Load vs. deflection curve for glass FRP composite specimens subjected to 300 cycles of freezing and thawing (reproduced from Gomez and Casto 1996)
While several studies have been conducted on the strength of columns wrapped with
FRPs, studies on durability under harsh environmental conditions such as freeze-thaw, exposure
to chloride, and degradation from exposure to ultraviolet light are much fewer. Questions related
to durability under harsh environmental conditions are extremely important in Michigan, and it is
important to provide answers to these questions based on laboratory research prior to field instal-
lation.
Chajes et al. (1994) investigated the durability of several composite systems externally
attached to concrete beams. One set of beams was exposed to cycles of freezing and thawing, the
second set was exposed to cycles of wetting and drying, while the third set was unconditioned.
9

Their results indicated that flexural strength was lost due to a degradation of the bond between
the concrete and the external reinforcement. Degradation of the composite material was not
reported.
Sen et al. (1993) investigated the durability concrete beams pretensioned with
glass/epoxy FRP subjected to cycles of wetting and drying. Several specimens were initially
cracked to simulate pile-driving damage. Their results indicated extensive damage in the glass
FRP, leading to an unacceptable level of strength loss.
Gomez and Casto (1996) studied the effect of chloride and freeze-thaw on two pultruded
fiberglass all-composite systems. Both systems used glass fibers, but one used a vinyl ester resin
while the other used a polyester resin. Samples were exposed to freeze-thaw cycles while
immersed in a 2% sodium chloride and water solution. Their results indicated a loss of 22-32%
in the flexural strength and stiffness of the composite materials.
Fyfe et al. (1996) studied the effect of prolonged (1000 hours) exposure of the Tyfo™ S
System to ozone, salt water immersion, fresh water immersion, alkaline soil burial, high
temperature, low temperature, and Weatherometer aging. All tests were performed according to
ASTM standards, but only on the composite material, not on wrapped concrete specimens. In
general, no serious degradation was observed due to prolonged exposure. However, a
fundamental limitation of this study is that the environmental conditions were not cycled, and
hence durability against cyclic freeze-thaw and chloride immersion cannot be assessed.
Toutanji and Balaguru (1998) studied the effect of wet-dry and freeze-thaw conditions on
the performance of concrete columns wrapped with two layers of carbon and two layers of glass
FRP composites. Three types of FRP wraps were used; two types of carbon and one glass.
Twenty four concrete specimens (76 mm diameter and 305 mm long cylinders) were divided into
10

three groups. Each goup consisted of eight specimens: six confined (two with each type of the
FRP sheets) and two unconfined. The first group was used as virgin samples and the second was
exposed to wet-dry cycling and the third group was exposed to freeze-thaw cycling. Three
hundred wet-dry and freeze-thaw cycles were performed in a salt water solution. CFRP
experienced no reduction in strength or ductility due to wet-dry exposure, whereas samples with
GFRP experienced reduction of 10% and 20% in strength and ductility, respectively. In the case
of freeze-thaw exposure, both CFRP and GFRP wrapped specimens experienced reductions in
strength and ductility. Strength losses were 28% and 19% for glass and carbon, respectively.
Ductility losses were 65% and 30% for glass and carbon, respectively. The specimens subjected
to freeze-thaw cycling also exihibited more catastrophic brittle failure as compared with the
unconditioned and the wet-dry conditioned specimens.
Rivera and Karbhari (1999) conducted tests on concrete cylinders wrapped with glass and
carbon FRP after subjecting them to 201 freeze-thaw cycles (between 22.5o C and -20 o C). Three
layers of carbon fabric and seven layers of glass fabric were used. Wrapped specimens subjected
to freeze-thaw cycling showed increased stiffness and strength and more catastrophic failure
compared to control specimens under ambient temperature. In order to isolate the effects of
temperature from those of excessive moisture absorption, thawing was in air.
Murphy et al. (1999) investigated the effects of alkali exposure on the performance of
glass fiber reinforced composites. Glass fiber reinforced vinylester coupons (two, four and six
layers) were placed in solutions with pH and salt content predicted by leaching out the concrete
itself, new concrete (28 days) and old concrete (ten years). In addition, a cementitious extract
was prepared by collecting the solution that formed after settling of the aggregates (while
preparing the new concrete). The starting pH level was approximately 12 and dropped to 8.5 in
11
about 60-80 days for the new and old concrete solutions. For the cementitious extract solution,
the pH dropped to 8.5 in about 250 days. The strength was degraded by 17 to 32% over a period
of one year. The coupons placed in the cementitious extract was degraded the most (32%)
indicating that reduction in strength cannot be attributed to pH levels alone, but rather to a
combination of alkaline salts from concrete and the pH levels present.
Almusallam et al. (2000) conducted tests on concrete specimens wrapped with three
layers of bi-directional glass FRP. Each group of specimens contained three GFRP wrapped
specimens and three unwrapped specimens. It was concluded that the compressive strength of
wrapped cylinders subjected to alkaline solution and alkaline solution at elevated temperature
(60 οC) exhibited lower increase in strength than the other groups. The increase in strength was
about 23% compared to 54% for wrapped specimens at room temperature.
The Aerospace Corporation (Los Angeles, California) conducted extensive FRP panel
durability testing on various wrap systems (Steckel 2000). For the glass and carbon systems used
in this research study, they concluded that carbon panels are not affected by conditioning while
glass panels showed strength and strain reduction of up to 35% and 15% - 20% under 10,000
hours of humidity and salt water (or alkaline solution) exposures, respectively. It should be noted
that these conditions were not cycled. Only 20 freeze-thaw cycles were conducted and those had
no effect on the FRP panels was noted. Appendix A shows the results obtained by of the
Aerospace Corporation for glass and carbon FRP panels, respectively.
1.3.4 Corrosion of Reinforcing Steel
Corrosion is a natural process and is a result of the inherent tendency of metals to revert
to their more stable compounds, usually oxides. Most metals are found in nature in the form of
12

various chemical compounds called ores. In the refining process, energy is added to the ore, to
produce the metal. It is this same energy that provides the driving force causing the metal to
revert back to the more stable compound.
Corrosion of the reinforcement reduces strength, durability, and service life of the reinforced
concrete structure. As the reinforcement corrodes, it expands causing cracking of concrete and
spalling.
An ASTM-sponsored study (Guttman and Sereda 1968) found the corrosion rate in steel
exposed to air at various locations varied from 0.033 to 0.058 mm per year in Cleveland to 0.030
to 0.043 mm per year in Ottawa. For a #25 bar, these translate to 5.3% to 9.1% in Cleveland and
5.0% to 6.7% in Ottawa in 10 years. Similar rates have been observed in Michigan steel bridges
(McCrum 1994).
1.3.4.1 Factors Affecting Corrosion
The presence of chlorides, temperature, relative humidity, cover depth, and concrete
quality are the major factors affecting the rate of corrosion.
Chlorides can come from several sources. They can be cast into the concrete to promote
rapid hardening or they can diffuse from the outside. Chlorides can diffuse into concrete as a
result of sea salt spray and deicing salt. Chloride contamination of bridge columns resulting from
winter maintenance chloride (deicing salt) applications results in the continuing deterioration of
the steel reinforcement, which in turn causes bursting forces emanating from the steel location
outward to the periphery of the columns.
13

Minimum concrete cover and low quality of concrete (high water/cement ratio) decrease
the time needed for chlorides to reach the reinforcement. The time for corrosion to start will
therefore be decreased and the rate of corrosion will increase (Allen 1995).
Environmental conditions such as ambient temperature and relative humidity also affect
corrosion. The concentration of free chloride ions in the pore water increases with temperature.
In addition, corrosion reactions occur at a much faster rate with an increase in temperature. The
corrosion rate of steel was found to vary linearly with temperature. The corrosion rates at 40o C
was found to be almost double that at 0 o C (Lopez et al 1993).
Concrete is alkaline. It contains microscopic pores with high concentrations of soluble
calcium, sodium and potassium oxides. These oxides form hydroxides, which are highly alkaline
when water is added. This alkaline condition leads to a passive layer forming on the steel
surface in the form of a dense, impenetrable film, which if fully established and maintained,
prevents further corrosion of the steel. Chlorides act as catalysts to promote corrosion. When
there is sufficent chloride concentration at the reinforcing bar surface to break down the passive
layer of oxide on the steel, the corrosion process proceeds quickly.
Brockenbrough et al. (1985) conducted tests on stacks of Cor-Ten A steel and carbon
steel compressed together with spring washers and exposed (to the atmosphere) at Monroeville,
Pennsylvania and Kure Beach, North Carolina. The stacks clamped at low pressures (21.5 and
43.5 kPa) showed large increase in thickness because of corrosion product pressure after five and
a half years of exposure. In addition, it was concluded that there is an initial pressure threshold of
about 1035 to 1380 kPa above which the rate of corrosion is extremely small and no significant
expansion due to corrosion product pressure takes place.
14

1.3.4.2 Volume Expansion Due to Corrosion of Steel
Corrosion of steel is an electrochemical process. The electrochemical potentials to form
the corrosion cells may be generated when cells are formed due to differences in concentration of
dissolved ion in the vicinity of steel, such as alkalies, chlorides, and oxygen. As a result, some
parts of the metal become anodic and the others cathodic. The fundamental chemical changes
occurring at the anodic and cathodic areas are as follows (see Fig. 1.2-a).
Anode: Fe 2e - + Fe 2+
Cathode: ½ O2 + H 2 O + 2 e - 2 (OH) –
(a) (b)
Figure 1.2. Expansion and cracking of concrete due to corrosion of the embedded steel (reproduced from Mehta 1996)
The transformation of metallic iron to rust can result in increases in volume of up to
600% (Mehta 1996), depending on the final rust form (see Fig. 1.2-b). Since the presence of
15
both air and water is required for the corrosion activity to continue, column wrapping may
provide adequate confinement that would minimize the entry of air and water, thereby slowing
down the continuation of corrosion.
1.3.4.3 Localized Corrosion
Corrosion of steel reinforcement inside bridge columns is not uniform. It is dependent on
the location of cracks and surface exposure (i.e. salt contact due to deicing of roads). Further, the
volume expansion due to corrosion is localized near the reinforcement bars. This may exert
strains on the wrap at localized areas. All or most of the metal loss occurs at discrete areas
(Fontana 1986).
Pitting corrosion is highly localized corrosion occurring on a metal surface. Pitting is
commonly observed on surfaces with little or no general corrosion. Pitting typically occurs as a
process of local anodic dissolution where metal loss is exacerbated by the presence of a small
anode and a large cathode.
Crevice corrosion is another form of localized corrosion which may occur in small areas
of stagnant solution in crevices, joints and under corrosion deposits. Crevice corrosion is the
localized corrosive attack that occurs as a result of the occluded cell that forms under a crevice
on the metal surface. To prevent this type of corrosion, it is recommended that crevices be closed
with non-absorbent materials or a barrier to prevent moisture penetration into the crevice be
incorporated.
16
1.3.5 Mechanical Properties of FRPs
Many FRPs have tensile strengths that exceed the strength of steel, but their stiffness is
generally lower than that of steel. When loaded along the fiber direction they behave essentially
linearly until fracture, and are therefore brittle by nature.
1.3.5.1 Stress Corrosion and Stress Rupture
The average ultimate tensile strength of freshly drawn glass fibers may exceed 3500
MPa. However, surface flaws tend to reduce the tensile strength to values in the range of 1750 to
2100 MPa. Strength degradation is increased as the surface flaws grow under cyclic loads. This
is one of the major disadvantages of using glass fibers in applications where fatigue may be an
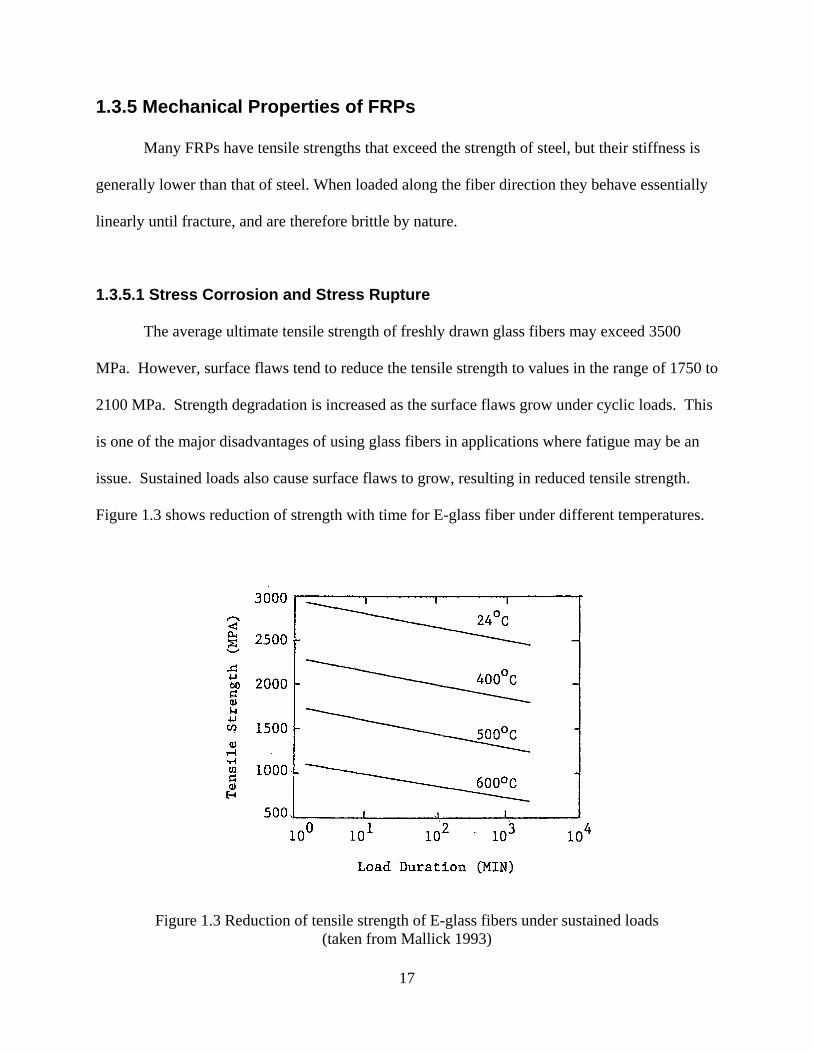
issue. Sustained loads also cause surface flaws to grow, resulting in reduced tensile strength.
Figure 1.3 shows reduction of strength with time for E-glass fiber under different temperatures.
Figure 1.3 Reduction of tensile strength of E-glass fibers under sustained loads (taken from Mallick 1993)
17

Stress corrosion refers to the characteristic property of FRPs in which the failure strength
under long term sustained loads in a chemical environment is lower than its short term tensile
strength. In air, this phenomenon is referred to as “stress rupture” (Sen et al. 1993). Stress
rupture tests are usually performed by applying a constant tensile stress to a specimen until it
fractures completely. The time at which fracture occurs is termed the “lifetime”. Creep, on the
other hand, is defined as the increase in strain with time at a constant load level (Mallick 1993).
Glass, Aramid, and Boron fibers and their composites exhibit failure by stress rupture.
Carbon fibers, on the other hand, are relatively less prone to stress rupture failure. In order to
prevent stress rupture in glass FRP for a period of 10, 30, and 50 years, the sustained strains in
the GFRP should be less than about 0.35 εu, 0.32 εu, 0.30 εu, respectively (Sen et al.1993, ACI
2000).
The relationship between the sustained stress (or strain) and the logarithm of time is
approximately linear as shown in Figure 1.3. ACI Committee 440R recommends the use of a
safety factor of 1.67 and hence a safe level of sustained strain to prevent stress rupture in glass is
about 0.2 εu.
1.3.6 Effect of Confinement
Lateral confining pressure increases the strength and ductility of concrete in the axial
direction. The stress-strain curves of confined concrete show a remarkable energy dissipation
characteristic. Such behavior is of great importance as it can prevent catastrophic failure of
highway bridges or high-rise buildings under overload conditions. Figure 1.4 shows stress-strain
curves for confined and unconfined concrete.
18

Figure 1.4 Stress/strain curves for confined and unconfined concrete (Mander, et al.1988)
The relationship between confined compressive strength (f cc’), unconfined compressive
strength (f c’), and the lateral stress in core concrete produced by confining pressure (fr) is
f cc’ = f c’ + k fr (1.1)
The average value of the confinement effectiveness coefficient k was found to be equal to 4.1
(Richart, et al. 1928).
For circular column with spiral steel, the confining pressure fr is given by (Nilson and Winter
1991)
(1.2) SdfA
fc
yspr
2=
where
19

Asp = the cross-sectional area of the spiral steel
dc = the outside diameter of the spiral
S = the pitch of the spiral.
fy = spiral steel yield stress
Eq. (1.2) is calculated assuming that the spiral steel reaches its yield stress fy before the column
eventually fails.
FRP materials are essentially linear elastic up to the point of fracture, while steel shows
an elastic-plastic behavior. The stress-strain curve of the confining materials affects the failure
mode of the confined core. Figure 1.5 shows stress-strain curves for A36 steel, E-glass and
carbon fibers.
Figure 1.5 Stress-strain curves for A36 steel, E-glass and carbon fibers
Confinement of concrete columns with FRP wraps offers many advantages in comparison
to other confinement methods. Composite material with their high strength and high stiffness to
20

density ratios allow for field installation with minimal workforce and disruptions to traffic.
Preliminary testing of concrete columns wrapped with FRPs has shown that the confinement
provided results in improved compressive strength and ductility. Picher at el. (1996) conducted a
series of tests on confined circular, square and rectangular concrete specimens. Axial loads were
applied to concrete specimens wrapped with different orientation of carbon FRP wraps. It was
concluded that confinement of concrete cylinders with CFRP wraps improves their compressive
strength and ductility (up to 41% axial strength increase and about 500% axial strain increase for
cylinders confined with three layers of carbon sheets with fibers oriented in the hoop direction)
compared to unconfined specimens. Although axial stiffness decreases with the increase of fiber
angle orientation, ductility and modes of failure remain the same. Wrapping of square and
rectangular specimens improves ductility but to a lesser degree than that observed for cylindrical
specimens. In the case of square and rectangular specimens, it was found that rounding the
corners greatly improved the compressive strength.
Tests on round and rectangular specimens and full scale columns wrapped with glass and
carbon FRPs was conducted by Kestner at el. (1997). They found that enhancement in axial
strength and deformation are proportional to jacket strength and stiffness. It was found that due
to the ineffectively confined concrete region in the square cross sections, the jackets provided to
square cross sections were not as effective as those provided to circular cross sections. A shape
factor, κs , was used to account for the ineffectively confined regions of concrete within the
rectangular and square cross sections.
From mechanics of thin walled cylinders, the confining pressure in a confined column
can be determined to be
fr = 2 (ft t n) / D (1.3)
21
where
t = the thickness of the wrap per layer
ft = the circumferential stress of wrap
n = number of wrap layers
D = the diameter of the concrete cylindrical column
The maximum confining pressure, fru is determined by the ultimate tensile strength of the
wrap ftu given by
fru = 2 (ftu t n) / D = 2 (Eεtu t n) / D (1.4)
where
E = modulus of elasticity of the wrap
εtu = wrap ultimate strain
Substituting fru from Eq. (1.4) into Eq. (1.1) yields the maximum compressive strength due to
confinement with FRP wraps.
More generally, for round and rectangular cross sections, the maximum confining
pressure may be expressed as (Restrepol and DeVino 1996)
fru = 0.5 κs ρj Eεtu t (1.5)
where
ρj = 4n/D for circular columns
ρj = 2n(d+b)/db for rectangular columns
n = number of layers of wrap
D = overall diameter of circular column
b = overall width of rectangular column
d = overall depth of rectangular column
22

κs = shape factor determined as the ratio of effectively confined concrete to the
gross area of the section
The shape factors for circular and rectangular are
Circular: κs = 1
Rectangular: κs = ( ) ( )[ ]ρ
ρ−
−−+−−1
221 22 rdrb
where
r = radius of rounded corners
ρ = longitudinal reinforcement ratio of cross section
Fig. 1.6 shows the effectively confined area of a rectangular cross section.
For circular columns, substituting κs = 1 in Eq. (1.5) will yield Equation (1.4), while for
rectangular columns
fru = κs n Eεtu t (d+b)/db (1.6)
Fig. 1.6 Illustration of effectively confined area of a rectangular cross section
23

1.3.7 Repair of Corrosion-Damaged Columns Using FRP
A review of research conducted to study the effectiveness of FRP wraps in repairing
corrosion-damaged columns indicates that FRP wraps have the following advantages:
• They provide a barrier to oxygen, moisture and chlorides.
• They have high strength and stiffness and provide confinement and ductility to the concrete
structure.
Debaiky and Green (1999) are investigating the suitability of using FRP wrap to
rehabilitate corroded concrete structures. The focus of the experiment is to assess what happens
to the corrosion process after the structure has been rehabilitated with FRP wraps. The
experiment consists of 12 reinforced concrete columns (300x 1200 mm) with chlorides cast in
the concrete cover. The columns are placed in a water bath to initiate corrosion. After the initial
corrosion phase, the columns will be wrapped with FRP sheets. The “natural” accelerated
corrosion environment will then be continued. Monitoring corrosion will be through the use of a
half-cell potential. This project is still underway.
Pantazopoulou et al. (1996), Michniewicz (1996), and Lee (1998) from the University of
Toronto conducted several projects using FRP for repair of corrosion damaged columns since
1993.
Two concrete mixes were used to construct the 150x300 mm cylinders. High density
concrete was used for the end caps, and high porosity concrete contaminated with 2.6% NaCl by
weight of cement was used for the middle 210 mm of the cylinder height. The corrosion was
electrically accelerated using a 6 volt potential while the cylinders were placed in 50 mm of 2%
chloride solution. Damage was significant after 150 days. Several repair techniques were
24

considered such as conventional patching, epoxy coating and wrapping with plastic foil. In
addition, glass FRP wrap also was used. The most effective repair method was the use of a
conventional patch with two layers of glass FRP (GFRP) wrap. The strength was fully restored
and ductility was doubled compared with an undamaged specimen.
Ten large-scale circular columns also were built and corrosion was accelerated in a
similar manner (voltage ranged from 3 to 15V). The columns were repaired using different
methods ranging from:
• Surface cleaning, non shrinkage grout, epoxy coat, and 2 layers of GFRP wrap to
• Epoxy coat and 2 layers of GFRP wrap only.
Compression tests results showed only columns that were repaired using the first method, surface
cleaning, non shrinkage grout, epoxy coat, and 2 layers of GFRP wrap, had the capacity of an
undamaged column.
Another project was also conducted at the University of Toronto. Seven large scale
columns were corroded using a 12 V fixed potential and wet-dry cycles consisting of one day
wet and 2.5 days dry. After significant corrosion, they were wrapped with one layer of carbon
FRP (CFRP) sheet. The results showed that using the CFRP wrap increased the strength of the
corroded specimens by 28% compared to the unwrapped specimens. The axial deformation at
failure was six times that of corroded unrepaired specimens.
It should mentioned that the above research projects conducted at the University of
Toronto did not investigate the effect of continuing corrosion on the FRP rehabilitation.
At the University of Sherbrooke, the following field applications have been conducted
(Rochette et al. 1996, Demers et al. 1996, and Kenneth et al. 1998):
25

• Corrosion-damaged circular building columns were repaired with GFRP after the column
section was restored with cement grout. The repair took place in November 1995, the resin
cured properly despite the cold temperature.
• Eighteen (18) circular bridge columns were repaired in August 1996. Five columns were
wrapped with GFRP, four with CFRP, and three were repaired using conventional material.
Axial deformation and circumferential expansion were monitored.
• The concrete pier on the Champlain bridge in Montreal was repaired in 1997. The pier
received nine layers of GRFP wrap in the four meters above its base.
The University of Minnesota is currently monitoring the rehabilitation of corrosion-
damaged columns for a bridge near Minneapolis (Debaiky and Green 1999). The set up is as
follows:
• Electrochemical chloride extraction (ECE) was used on three columns and then one column
was wrapped with CFRP sheets (supplied by Hexcel-Fyfe Company), the second was
wrapped with CFRP sheets (supplied by Tonen Corporation), and the third was wrapped with
chopped glass sheets.
• ECE was used on three columns and were then sealed without wrapping.
• Three columns were wrapped similar to the first group without the ECE.
• Three columns were left as control specimens.
Corrosion will be monitored for five years. Chloride sampling will be conducted once a year.
This project started in 1997 and is still underway.
In order to study the deterioration and evaluate different repair techniques, an FRP
column wrap project was initiated by the New York State Department of Transportation in 1998
(Halstead et al. 2000). Six severely deteriorated concrete columns of the Court Street Bridge
26

(Tioga County) were wrapped using six different wrap systems (by different suppliers). A
comprehensive testing program to evaluate the effectiveness of FRP column wrapping was
implemented. Prior to installation of the FRP wraps, three corrosion probes were embedded in
each column. Additional monitoring equipment was installed on each column and data collection
started in September 1998. Strain sensors were installed on the surface to measure the effect of
continued corrosion on the wraps. Concrete humidity and temperature are also being monitored.
The corrosion probes use linear polarization to monitor instantaneous corrosion rates. Data is
being collected at three month intervals. This non-destructive testing is scheduled to continue for
five years.
1.3.8 Effect of Fire and High Temperature on FRPs
Few studies have been performed on the effect of fire and high temperatures on carbon
and glass FRPs. Swiss researchers performed a series of bending tests on beams strengthened
with pultruded carbon FRP plates and steel plates, positioned in a large testing oven (Meier
1996). Four beam were strengthened by bonding carbon FRP plates (74 mm wide, 1mm thick),
and one beam was strengthened with steel plates (75 mm wide, 8 mm thick). The beams were
placed in the oven and the temperature was raised to 652°C. The steel plates debonded from the
beam in 8 minutes. The carbon FRP began to burn at the surface of the laminates and their cross
sections slowly decreased. The carbon FRP debonded from the beam after one hour.
The Aerospace Corporation subjected carbon and glass FRP panels constructed by the
wet lay-up method to dry heat at 60°C for 1000 and 3000 hours (Steckel 2000). The effect of
these exposures on modulus, ultimate strength and ultimate strain are given in Appendix A.
There was no significant effect on either carbon or glass FRP.
27

28
No studies appear to have been done on the fire resistance of conventional FRP panels
constructed by the wet lay-up method and not treated with fire retardents.

Chapter 2 Description of Experiments
2.1 Stiffness and Strength of Glass and Carbon FRPs
A 4-ply composite Tyfo-S fiber glass/epoxy sheet and a 2-ply Tonen carbon/epoxy sheet
were fabricated at MSU on 9/30/97 and 10/21/97 under the supervision of the respective
composite vendors. After the vendor-recommended curing periods of five to seven days, these
specimens were tested under direct tension at the MSU Composite Material and Structures
Center to check the moduli against the vendor-recommended values. The width of the test
specimens varied from 13 to 19 mm and their length varied from 190 to 230 mm, depending on
the test. Gage length over which strains were measured was 89 mm. The test machine was
equipped with hydraulically actuated wedge grips with serrated face. Table 2.1 shows a
comparison between actual tested and vendor-recommended moduli, thickness, effective axial
stiffness per unit width (equal to modulus × thickness), ultimate strength, ultimate strength per
unit width (equal to ultimate strength × thickness), and ultimate strain (FYFE 2000, Master
Builders 1998). Because the effective stiffness and ultimate strength per unit width are not
dependent on the thickness of sheets, these properties should be used in comparisons. Although
the properties varied from the vender recommended values, especially for carbon, the effective
axial stiffness which controls confinement and behavior was almost identical to and about 88%
of the vendor-recommended design values for glass and carbon FRPs, respectively. Master
Builders specify the thickness, modulus, and ultimate strength of their carbon FRP based on the
fiber properties only, which is why their values differ significantly from the measured values.
The design ultimate strengths per unit width recommended by the vendors, however, are 13%
29

and 22% higher than the measured values. The properties of each individual test specimen are
given in Appendix B.
Table 2.1 Vendor recommended and measured wrap properties for a single layer
Wrap Type
Thickness (mm)
Modulus (MPa)
Effective Stiffness (N/mm)
Ultimate Strength (MPa)
Ult. Str. per Unit Width
(N/mm)
Ultimate Strain
Test Properties Published by Vendors Glass 1.3 26100 33930 575 747 .022
Carbon 0.165 228000 37620 4275 705 .0175 Design Values Recommended by Vendors
Glass 1.3 20684 26889 448 582 .020 Carbon 0.165 228000 37620 3790 625 .015
As Measured Glass 1.227 22011 26967 421 516 .019
Carbon 0.625 53061 33191 821 513 .015
2.2 Strain Expected in Wraps Due to Corrosion
The transformation of metallic iron to rust can result in increases in volume of up to
600% (Mehta 1996), depending on the final rust form. (Table 2.2 shows sample calculations for
the volume expansion for some rust products.)
Rust Forms: FeO, Fe3O4, Fe2O3, Fe(OH)2, Fe(OH)3, Fe(OH)3 3H2O
Table 2.2. Volume expansion for some rust products Rust Form Density (D) Mol.Wt. Volume(MW/D) Vol.Rust/Vol.Fe
Fe 7.86 56 7.12 FeO 5.7 71.85 12.6 12.6/7.12=1.7
Fe3O4 5.18 231.54 44.70 44.7/(3x7.12) =2 Fe(OH)2 3.4 89.86 26.43 26.43/7.12=3.71
Table 2.3 shows the strain developed in the wrap due to corrosion in a 915 mm diameter
column with longitudinal steel ratios of 3%, 2%, and 1%, and ties spaced at 152 mm and 305
30

mm. Corrosion rates by cross section of 5% in the longitudinal reinforcement and 20% in the
lateral reinforcement over a 10 year period are assumed (Martin and Schieles 1969). For cases
one and two it is assumed that the volume of rust is three times and six times, respectively, the
volume of the corroded steel. The table shows that the strain in the wrap is within 0.30 εu = 0.6%
for GFRP (which is the sustained strain limit in order to prevent stress rupture in glass FRP for a
period of 50 years) for all situations considered, indicating that stress rupture should not be a
problem. If carbon FRP is used, then stress rupture is not an issue and the strains in Table 2.3
are below the rupture strain of εu = 1.5%. Hence the use of CFRP is also feasible.
Table 2.3 Strain in column wrap due to steel corrosion after 10 years Column Spacing of Steel ratio of Strain in wrap
dia. (mm) tie (mm) cross section Case 1 Case 2 #13 tie
915
305 3% 0.394% 0.450% 2% 0.260% 0.327%* 1% 0.145% 0.203%
152 3% 0.414% 0.530% 2% 0.290% 0.410% 1% 0.160% 0.284%
* Sample calculation for this row is shown in Appendix C.1.
2.3 Freeze-Thaw Test
Strength and durability tests were carried out on circular (diameter of 152 mm by 305
mm high) and square cylinders (152 mm by152 mm by 305 mm high) wrapped with three layers
of glass FRP or two layers of carbon FRP. The primary purpose of the tests was to determine the
endurance of the jackets under simulated cyclic environmental conditions, with strength
considerations being secondary. An internal bursting force similar to that produced by corroding
steel was induced. This was done by fabricating cylinders with a hole in the longitudinal
31

direction and filling it with an expanding cement known as Bristar (used for silent demolition).
Chloride was impregnated into the cylinders during casting in order to simulate deteriorated
concrete (11 kg of NaCl/m3 was used). Strength tests were carried out on plain control cylinders
as well as wrapped test specimens before and after freeze-thaw conditioning.
Climate data for Lansing, Michigan indicates that there were 58 days in the 1993/1994
year when the temperature cycled above and below 32° F and 78 days for the 1992/1993 year.
Based on this and ASTM C666 specifications, 150 and 300 freeze/thaw cycles were used in the
freeze-thaw conditioning. Subsequent to freeze/thaw cycles, the compressive strengths were
compared against those of wrapped control specimens that were not subjected to freeze-thaw
cycles. In addition, unwrapped plain concrete specimens also were exposed to freeze-thaw
cycles to establish loss of strength in concrete alone due to freeze/thaw conditioning.
Table 2.4 shows the test matrix used for the freeze/thaw laboratory testing. A total of 60
specimens were involved in the testing, of which 30 were subjected to freeze/thaw. Specimen
and gage numbering is shown in Table D.1 in Appendix D. A water/cement ratio of 0.4 was
used. Table E in Appendix E provides the concrete mix ratios and the 28 day strength for the
freeze-thaw specimens.
A half bridge configuration was used for reading the strain gages, and temperature
correction was done by using dummy gages mounted on glass and carbon FRP panels which also
were located in the freeze-thaw machine. However, thermal contraction and expansion of the
FRP panels on which the dummy gages were mounted had to be determined and compensated
for. The dummy gages also were used when reading strains on control specimens not subjected
to freeze-thaw.
32

Table 2.4 Freeze-thaw laboratory testing matrix No. of Specimens
Specimen Type Conditioning Glass Wrap
Carbon Wrap Unwrapped
Round None 3 3 3 Square None 3 3 Round None 3 3 3 Square None 3 3 Round 150 cycles of freeze-thaw 3 3 3 Square 150 cycles of freeze-thaw 3 3 Round 300 cycles of freeze-thaw 3 3 3 Square 300 cycles of freeze-thaw 3 3
2.3.1 Mold Fabrication
Prism molds
Nine 152 mm x 152 mm x 305 mm PVC molds were fabricated. Each is composed of
five panels (four sides and one bottom). The short side panels were fabricated with a center hole
that was 38 mm in diameter. A 38 mm steel rod was placed in the hole during casting. Dow
Corning release agent was applied to the steel rod and a plastic sheet was then wrapped around it
to aid removal after the concrete sets. The center hole was later filled with Bristar (a form of an
expanding grout). Fig. 2.1 provides a picture of the prism mold.
Fig. 2.1 Prism mold used for freeze-thaw test specimens
33

Cylindrical Molds
Nine 152 mm x 305 mm steel cylindrical molds were fabricated. Steel base plates and
wooden top plates with a 38 mm diameter center hole were used. As with the prism molds, a
steel rod was inserted at the middle of each cylinder to create a hole in which Bristar was later
inserted. Fig. 2.2 provides a picture of the cylindrical mold.
Fig. 2.2 Cylindrical mold used for freeze-thaw test specimens
2.3.2 Bristar Calibration
The Bristar mix used to create an internal bursting force in cylinders had to be calibrated
to yield the appropriate pressure when set. Nine 152 mm x 305 mm steel tubes were filled with
concrete and a 38 mm diameter hole was fabricated in the center of each. Each steel tube was
mounted with two strain gages located diametrically opposite each other at mid-height on the
exterior surface.
After the concrete was allowed to set, Bristar mixes with different water/Bristar ratios
were poured into the center hole. The intent was to calibrate the water/Bristar ratio so that a
34

confining pressure in the steel tube similar to that developed by corrosion-induced expansion
could be generated. The desired confining pressure was based on the strains in composite wraps
due to the expected volume expansion in a bridge column caused by corrosion (see Table 2.3).
Table 2.5 shows the strains that would be induced in the steel tube used for calibration by
confining pressures expected to be generated by corrosion in composite wrapped columns (for a
wrap strain of 0.531%). This strain, selected from Table 2.3, corresponds to a wrap strain that
would be generated in a 915 mm diameter column due to steel corrosion after 10 years when the
steel ratio by cross section and tie spacing are 3% and 152 mm, respectively. A steel ratio of 3%
and tie spacing of 152 mm are conservative. Sample calculations on how the values in Table 2.5
were obtained are shown in Appendix C.2.
Table 2.5 Internal pressure generated by corrosion for wrap strain of 0.531% Wrap Number Pressure Strain in
of layers (kPa) steel jacket 2 3763.6 0.029%
Glass 3 5644.9* 0.045%* 4 7527.2 0.060% 1 2310.4 0.018%
Carbon 2 4620.8 0.037% 3 6931.2 0.055%
* Sample calculation for this row is shown in Appendix C.2.
Figs. 2.3 and 2.4 show the strain generated in the steel jacket when the water/Bristar
weight ratio was 400g/1000g and 500g/1000g, respectively. The maximum strain of over 0.062%
generated in the steel calibration jacket by the 400g/1000g water/Bristar ratio corresponds to an
internal pressure of over 7600 kPa, which is larger than all the pressures shown in Table 2.5.
However, the maximum strain of about 0.038% generated in the steel calibration jacket by the
500g/1000g water/Bristar ratio corresponds to an internal pressure of about 4830 kPa. This is
35

closer to the pressures expected due to corrosion in columns (with wrap strain of 0.531%)
wrapped with 3 layers of fiberglass and 2 layers of carbon. The 500g/1000g water/Bristar ratio is
quite dilute and a higher water content is not feasible. Therefore, a water/Bristar ratio of
500g/1000g was used for all specimens requiring Bristar.
0
100
200
300
400
500
600
700
0 1 2 3 4 5 6 7 8 9 10 11 12 13 14
Time (day)
Stra
in μ
ε
Fig.2.3 Strain in steel tube for water/Bristar ratio of 400g/1000g
050
100150200250300350400
0 2 4 6 8 1
Time (day)
Stra
in μ
ε
0
Fig.2.4 Strain in steel tube for water/Bristar ratio of 500g/1000g
It was decided that three layers of glass and two layers of carbon would be used in the
freeze/thaw tests, and that the Bristar would be prepared to generate a pressure of about
4830 kPa. The strain in the glass wrap would then be about 0.45% while that in the carbon wrap
would be about 0.55%. Variations in these values occurred because it was not possible to control
36

the Bristar pressure precisely. It was felt that using more than three layers of glass and two layers
of carbon would unnecessarily increase the cost of the wraps.
Since Bristar is highly porous, and water absorption with subsequent freezing and
thawing within the hole containing Bristar was undesirable, the ends of the specimens were
coated with epoxy prior to the freeze/thaw tests.
2.3.3 Chloride Content
Sodium chloride (NaCl) was used exclusively in freeze/thaw and accelerated corrosion
tests to contaminate concrete with chloride ions. Some examples of NaCl concentrations found
in the literature are:
1. Arya and Sa'id-Shawaqi (1996) conducted tests on concrete prisms. Concrete was dosed
throughout by either 2%, 3% or 4% Cl− ions by weight of cement.
For concrete mix data used by the Michigan Department of Transportation (MDOT) and 4%
Cl− ions by weight, this translates to 22.12 kg NaCl/m3 of concrete:
• 336 kg cement/m3 of concrete × 0.04 = 13.44 kg Cl-/m3 of concrete
• 13.44 kg Cl−/ m3 of concrete × (58.5 NaCl/35.5 Cl-) = 22.12 kg NaCl/m3 of concrete.
For 3%Cl- and 2%Cl- this translates to 16.59 and 11.06 kg NaCl/m3 of concrete respectively.
2. Yamato, et al. (1987) found that the chloride content investigated in an off-shore concrete
bridge was about 3.0% Cl− by weight of cement at a point 2 cm in from the vertical sides of a
girder. Following calculations as in item 1, this translates to 22.69 kg NaCl/m3 of concrete.
A 2% Cl− ion by weight of cement was used in the freeze/thaw and accelerated corrosion
tests. This translates to 11 kg NaCl/m3 of concrete.
37
2.3.4 Strain Gage Placement
Strain gages were used to monitor wrap hoop strains during freeze/thaw tests on six
round specimens and six square specimens (three specimens for each type of wrap), and four
control specimens (one for each type of wrap and specimen shape). Each specimen was fitted
with two strain gages oriented in the circumferential direction and placed opposite each other at
mid-height.
Half of the specimens were wrapped with three layers of Tyfo-SEH Glass composite and
the other half were wrapped with two layers of MBrace (Tonen) Carbon composite. A total of
16 specimens (eight with each type of wrap system) that were to undergo 300 cycles of freeze-
thaw were fitted with strain gages (two strain gages per specimen). The gages were coated with
wax and silicon for moisture and mechanical protection.
The expansive nature of Bristar caused the specimens to expand in the hoop direction as
desired. An undesirable side effect was simultaneous expansion in the longitudinal direction.
This caused the specimens with the carbon wrap to split across the cross sectional area since the
carbon wrap contained no longitudinal fibers. The glass wrap had Kevlar strands embedded in
the longitudinal direction, which prevents these specimens from splitting.
Considerable effort was devoted to devising a system for releasing the vertical expansion
of Bristar using a greased aluminum tube. However, after several unsuccessful trials it was
determined that the vertical stresses caused by Bristar could not be totally eliminated. In order
not to risk having the carbon-wrapped specimens fail while in the freeze-thaw machine,
additional longitudinal reinforcement was provided to the carbon-wrapped specimens. This was
done by strengthening with strips of carbon in the longitudinal direction. The strain gage reading
should not be affected since the strips are placed adjacent to the gages but not above them, and
38

the longitudinal strips should not provide any additional confinement. Carbon-wrapped
specimens subjected to freeze-thaw as well as carbon-wrapped control specimens were fitted
with vertical strips.
Initial strain gage readings were taken prior to pouring Bristar in the center hole of each
specimen. After the initial expansion period of the Bristar, which is about one week, an epoxy
compound was used to cap the top and the bottom of the center hole. It was not possible to
control the Bristar pressure precisely. The average strain in the wraps after the addition of Bristar
to the specimens measured before starting the freeze/thaw testing varied from:
• 0.31% to 0.60% for Glass with an average of 0.47%
• 0.24% to 0.68% for Carbon with an average of 0.48%
The freeze/thaw machine was set to subject the specimens to freeze/thaw cycles
according to ASTM C666 Procedure B, with freezing in air and thawing in water. Strains were
monitored during the freeze/thaw tests. A half bridge configuration was used for strain
measurements, with dummy gages mounted on FRP panels located inside the freeze/thaw
machine so that strains due to temperature variations were eliminated.
Considerable effort was required to properly adjust the freeze/thaw machine. Since some
of the specimens were wrapped with composite wrap systems and others were not, careful and
precise calibration was needed to control the freeze and thaw temperatures. The wrapped
specimens took longer to reach −17.8oC (end set point for the freeze cycle) and 4.4oC (end set
point for the thaw cycle) than the unwrapped specimens. A plus or minus 1.7oC tolerance is
allowed at the upper and lower set points by ASTM C666. After a few trials, it was established
that an ideal sump water temperature of 7.2°C would ensure that all specimens attain
temperatures of −17.78±1.7°C at the end of the freeze cycle and 4.4±1.7°C at the end of the thaw
39

cycle according to ASTM C666. Temperatures at the center of control specimens were
monitored for both unwrapped and wrapped specimens.
Specimens prepared as mentioned above were then placed in the freeze/thaw chamber for
150 and 300 freeze-thaw cycles. The strains were measured throughout this period. Two switch
boxes were fabricated to facilitate reading of the strain gages during the freeze/thaw and
accelerated corrosion tests. A switch box is shown in Fig. 2.5.
Fig. 2.5 Strain measurement instrument (left) and switch box (right) used for strain gage reading
2.3.5 Compression Testing
Considerable preparation was required prior to compression testing of the freeze-thaw
specimens. Two special fixtures were manufactured to facilitate the testing.
40
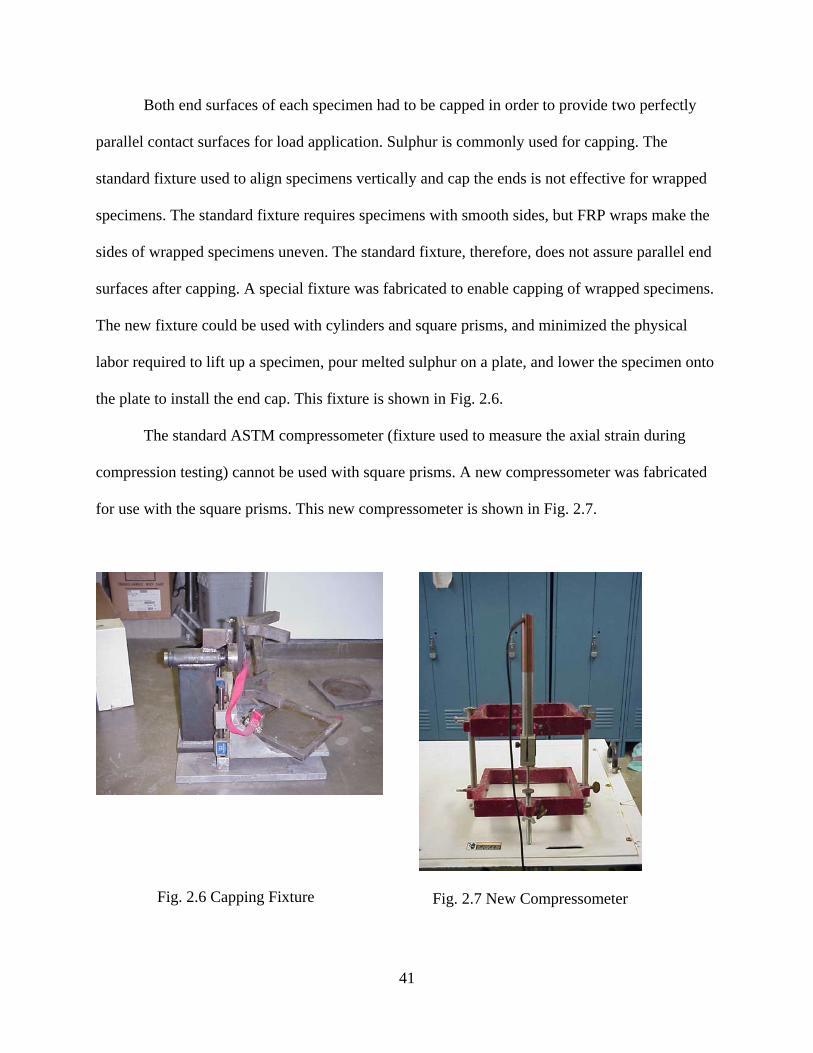
Both end surfaces of each specimen had to be capped in order to provide two perfectly
parallel contact surfaces for load application. Sulphur is commonly used for capping. The
standard fixture used to align specimens vertically and cap the ends is not effective for wrapped
specimens. The standard fixture requires specimens with smooth sides, but FRP wraps make the
sides of wrapped specimens uneven. The standard fixture, therefore, does not assure parallel end
surfaces after capping. A special fixture was fabricated to enable capping of wrapped specimens.
The new fixture could be used with cylinders and square prisms, and minimized the physical
labor required to lift up a specimen, pour melted sulphur on a plate, and lower the specimen onto
the plate to install the end cap. This fixture is shown in Fig. 2.6.
The standard ASTM compressometer (fixture used to measure the axial strain during
compression testing) cannot be used with square prisms. A new compressometer was fabricated
for use with the square prisms. This new compressometer is shown in Fig. 2.7.
Fig. 2.6 Capping Fixture Fig. 2.7 New Compressometer
41

The following data was gathered every six seconds using a data acquisition system:
• The compressive load and axial strain on all specimens using a load cell and a
compressometer fitted with an LVDT, respectively.
• The hoop strain in wraps for specimens fitted with strain gages
2.4 Accelerated Corrosion
Accelerated corrosion tests using an electrochemical cell were conducted to study the
effect of confinment on the progression of corrosion in the reinforcing steel within a reasonable
time frame. In addition, the hypothesis that FRP wraps slow down corrosion by reducing
permeability of water and oxygen or that they inhibit corrosion by developing sufficient
confining pressure (Brockenbrough at el. 1985) was to be evaluated. The confining pressure was
monitored using the strain readings of the wraps during the accelerated corrosion tests. In
addition, the rate of corrosion was indirectly measured to determine if confinement had any
effect on corrosion activity.
The test used by Detwiler (1991) on lollipop specimens was adopted for use with four
#13 steel reinforcing bars cast in 152 mm diameter by 305 mm high concrete cylinders. The
specimens were initially immersed in salt water (with 3% NaCl) at room temperature
(approximately 20 °C) and connected to a power source so that two of the steel rods became
anodic and the other two became cathodic. Figure 2.8 shows the wiring diagram used for
connecting specimens to the power supply in order to accelerate corrosion of the reinforcement.
The exposed ends of the steel bars were protected against crevice corrosion by using a Teflon
tube tightened with a nut and by covering the exposed end with silicon rubber. This forms a
42

barrier to prevent moisture penetration into the crevice (the interface between the steel bars and
the concrete surface).
Two bars were used as anodes and two bars were used as cathodes to keep the corrosion
products within the specimens as in natural corrosion. When an external cathode is used, the
corrosion products tend to migrate out of the cylinder. In addition, since a conductive medium
must be provided during accelerated corrosion testing, the cathodes must be placed inside the
wraps, because the specimens were not continually immersed in water. Corrosion was induced
on only two of the four bars in each specimen (i.e., at the anodes). Table 2.6 shows the corrosion
level required in two bars for various volume ratios (i.e., vol. of rust/vol. of corroded steel) to
induce a hoop strain of 0.531%, which is the anticipated strain in the wrap due to steel corrosion
after 10 years (see Table 2.3). Two layers of carbon and three layers of glass were used for the
accelerated corrosion test. This was the same number used for the freeze-thaw test.
305 mm
152 mm
8
Anodes(site of corrosion)
Cathodes
12 v+
-
Figure 2.8 Wiring diagram for accelerated corrosion specimens
43

Table 2.6 Corrosion level required in two bars to induce a strain of 0.531% in the wrap* Wrap Strain % Volume Ratio Percent Corrosion
3 38.1 Any number of layers
of carbon or glass 4 25.4 0.531 5 19.1 6 15.3
*Two #13 bars in 6” (152 mm) diameter cylinder
In order to simulate road column exposure to rain and water spray due to passing traffic,
the concrete specimens were subjected to cycles of wetting and drying. The specimens were
soaked in salt water for one hour each day and the water was then drained.
The rate of corrosion was measured to determine if confinement has any effect on
corrosion activity. The corrosion rate was measured using the ASTM G1 (ASTM 1990) test. The
hoop strain generated in the wraps due to corrosion induced expansion was monitored using
strain gages oriented in the circumferential direction. ASTM G1 test specifications is provided in
Appendix F.
A water/cement ratio of 0.6 was used for the accelerated corrosion specimens to promote
capillary porosity, which in turn would aid the corrosion process (see Table 1.1). Table E in
Appendix E provides the concrete mix ratios and the 28-day strength for the corrosion
specimens. The proportion of NaCl added to the mix to promote corrosion also is shown in the
table.
Four unwrapped dummy specimens were subjected to accelerated corrosion using
different resistors to vary the current intensities. These specimens were closely monitored to
determine when cracking initiated. Based on these trials, resistors of 8 Ω were used with a 12 V
power supply.
44

2.4.1 Corrosion Prior to Wrapping
Samples were exposed to accelerated corrosion while submerged in salt water prior to
applying the composite wrap. This simulated initial corrosion in field columns before wrapping
is applied. The initial corrosion period was closely monitored. When cracking started to develop,
the specimens were taken out of the water and dried thoroughly before wrapping them with the
two types of wrap systems (glass and carbon).
One approach to prevent stress concentrations on FRP wraps due to localized volume
expansion is not to bond the wrap directly on the column but only provide bond between the
different layers of the wrap. Thus localized volume expansion is contained by the entire wrap
system. As with bonded wraps, volume expansion due to corrosion will strain the wrap inducing
confining pressure. About half of the wrapped specimens contained a plastic sheet between the
concrete and the wrap in order to prevent the wrap from bonding to the concrete.
A total of 24 specimens were subjected to the initial phase of accelerated corrosion for 13
days. Although subjected to the same conditions, the specimens had significant variation in
corrosion level as observed from concrete cracking. The specimens were divided into three
groups based on the severity of cracking __ severe, moderate and light.
A total of five severely corroded specimens, in which some concrete had spalled off,
were patched. Patching was done using a sand/cement mortar that was contaminated with 2% Cl−
ion by weight of cement. Specimens for which spalls occurred at an edge were placed in a mold
and mortar was placed within the mold. These severely corroded specimens before and after
patching are shown in Figs. 2.9 and 2.10, respectively. Specimens were selected systematically
from the three groups for wrapping as shown in Table 2.7. Three layers of glass wrap and two
layers of carbon wrap were used to be consistent with the number of layers used in the freeze-
45

thaw test. A total of 16 specimens were fitted with strain gages oriented in the circumferential
direction (two gages per specimen located diametrically opposite each other at mid-height). All
specimens were then ready for the next phase of accelerated corrosion.
Table 2.7 Number of wrapped and unwrapped specimens in corrosion groups Number Wrapped with Corrosion Group Wrap Adhesion Glass Carbon Nothing
Bonded 1 1 Severe 1 Unbonded 1 1 Bonded 1 1 Moderate 1 Unbonded 1 1 Bonded 2+2 2 Light 2+2 Unbonded 2 2
Fig. 2.9 Severely corroded specimens prior to patching
46

Fig. 2.10 Patching of the severely corroded speciemns
2.4.2 Construction of the Corrosion Tank and Appurtenances
A special wood tank coated with fiberglass to accommodate the corrosion specimens was
constructed. The tank was fitted with a marine pump, a float shut-off mechanism, ball valves,
and a timer control. In automatic mode, the pump was activated once a day to fill the tank with
salt water (3% NaCl) from a holding tank located below the fiberglass tank. The float shut-off
mechanism would turn the pump off when the water level covered the top of the specimens.
After one hour of soaking, the timer opened the ball valve and the water was drained into the
holding tank. Photographs of the corrosion tank and the corrosion specimens placed in the tank
are shown in Figs. 2.11 and 2.12, respectively.
47

2.4.3 Monitoring Progress of Corrosion During Test
Monitoring corrosion levels during the accelerated corrosion test was important in order
to know when to remove specimens. Unwrapped specimens were expected to corrode faster than
Fig. 2.11 Corrosion tank
Fig. 2.12 Corrosion specimens in the tank
48

wrapped specimens. Also, some specimens were to be removed approximately mid-way through
testing when the anodic reinforcement in unwrapped specimens lost about half their cross
sectional area. The total length of time for the corrosion test could not be predicted in advance. A
method was needed to monitor corrosion levels during the test.
Two dummy specimens were originally fabricated to monitor corrosion levels through
destructive means. The plan was to cut off sections of the dummy specimens at regular intervals
and visually examine the cross section of corroded bars. This approach was error prone because
corrosion occurs unevenly and the dummy specimen size would be altered each time a section
was sliced off.
A non-destructive method of monitoring corrosion levels was sought, and an approach
utilizing X-rays was identified. Some unwrapped and wrapped pre-corroded specimens were
subjected to X-rays in a standard radiology laboratory. The X-ray negatives clearly show the
uncorroded parts of the anodic steel reinforcement.
Prior to beginning the accelerated corrosion process after specimens were wrapped,
representative specimens were subjected to X-rays to ascertain the level of corrosion during the
pre-corrosion phase. The X-ray images showed the reinforcing bars inside the specimen and the
approximate level of corrosion in them. This was necessary to establish a reference point and
assess the progress of corrosion.
Periodically, the specimens selected for observation were transported to the radiology
laboratory and subjected to X-rays. By comparing the state of corrosion in the wrapped and
unwrapped specimens, it was evident that the corrosion rate in wrapped specimens was
significantly lower than that in unwrapped specimens. Fig. 2.13, 2.14, and 2.15 show views of
the X-rays of a typical unwrapped specimen taken after 0, 90 and 105 days of accelerated
49

corrosion after the precorrosion stage, respectively. To facilitate reproduction, the X-ray images
were outlined to clearly show the edges of the reinforcing bars and the specimen, and the
photographic image was reduced to create the line drawings shown in the figures. Fig. 2.16
shows typical reinforcing bars removed from a specimen. The middle two bars are the cathodes
while the outer two bars are the anodes (the site of corrosion).
Figs. 2.13 Sample X-ray taken in the beginning of the accelerated corrosion test
Figs. 2.14 Sample X-ray taken after 90 days of accelerated corrosion test
50

Figs. 2.15 Sample X-ray taken after 105 days of accelerated corrosion test
Fig. 2.16 Reinforcing bars after removal from a corrosion specimen. The middle two bars are the cathodes while the outer two bars are the anodes (the site of corrosion)
51

Specimens were removed for X-ray exposure when there was no water in the tank. The
current used to accelerate corrosion was shut-off while the specimens were removed and
transported to the radiology laboratory, and turned back on when the specimens were returned to
the corrosion tank approximately two hours later.
2.4.4 Corrosion Test Matrix
The total number of specimens was 24, including the two extra specimens originally
planned for corrosion monitoring through destructive means. The numbers of samples of the
various types of specimens used are given in Table 2.8. Specimen, bar and strain gage numbering
is shown in Table D.2 in Appendix D. Specimens were removed from the corrosion process and
the amount of corrosion was measured as follows:
1. Four unwrapped, four carbon wrapped (two bonded, two unbonded), and five glass
wrapped (three bonded, two unbonded) specimens were removed when the X-ray
technique indicated that the diameter of corroded bars in unwrapped specimens was
reduced to about 70% of the initial diameter (which corresponds to about 50% reduction
in the cross sectional area). This corresponded to 130 days of accelerated corrosion.
2. Two unwrapped, four carbon wrapped (two bonded, two unbonded), and five glass
wrapped (three bonded, two unbonded) specimens were removed when the accelerated
corrosion test could not be effectively continued for the unwrapped specimens. This was
due to the upper tips of the anodes breaking off and occurred after 190 days of
accelerated corrosion.
Comparisons of corrosion levels at each of the two stages mentioned above was used evaluate
the effectiveness of the different wrapping systems in reducing corrosion.
52

Wrap strains were monitored until specimens were removed from the corrosion process.
These strains were used to estimate the amount of confining pressure built up due to corrosion.
Table 2.8 Accelerated corrosion laboratory test matrix
No. of Specimens Tested for 130 days
No. of Specimens Tested for 190 days Wrap
None (control) 4 2
Carbon bonded 2 2 Glass bonded 3 3
Carbon unbonded 2 2 Glass unbonded 2 2
2.5 Freeze-Thaw and Wet-Dry Cycling of FRP Panels
The dummy carbon and glass FRP panels used in the freeze-thaw and corrosion tests for
temperature correction were later used to assess the effect of freeze-thaw and wet-dry cycles on
the properties of the panels. The FRP panels in the freeze-thaw test were exposed to 300 freeze-
thaw cycles, with freezing in air and thawing in water. The FRP panels in the corrosion test were
exposed to 190 wet-dry cycles with 3% NaCl solution.
2.6 Impact Test
Impact testing was conducted on glass and carbon FRP panels. Three layers of glass and
two layers of carbon were used to make the panels. This number of layers was chosen to be
consistent with the number of glass and carbon layers for both the freeze-thaw test and the
corrosion test.
53

The impact machine is made of a 75 mm diameter semi-spherical aluminum head which
is dropped from a 0.79 m height. The impact force can be increased by adding more weight.
(This was a modified ASTM D1037 test.) In order to simulate impact of a wrapped column, the
FRP panel was placed on top of a 150 × 150 × 150 mm concrete block and the impact head was
dropped on it. The impact head was repeatedly dropped on the FRP panel while the weight was
gradually increased after each impact. The panel was examined after each impact and replaced so
that the subsequent impact would be at the same location. The starting weight used was 8.12 kg
and the capacity of the machine was 16.5 kg. Figure 2.17 shows the impact test machine.
2.7 High Temperature Test
One glass-wrapped and one carbon-wrapped specimens was sawed into three slices each,
and each slice was exposed to temperatures of 100°C, 150°C and 200°C for four hours. The
specimens were visually examined each half hour.
54

Fig. 2.17 Machine used for impact test of FRP panels
55

56
Note: Intentionally left blank

Chapter 3 Data Collection and Analysis of Results
3.1 Freeze-Thaw Test
3.1.1 Strain Gage Readings
Specimens subjected to 300 freeze-thaw cycles were equipped with strain gages, while
those subjected to 150 freeze-thaw cycles were not equipped with strain gages. The FRP hoop
strains were monitored about once a day during the entire testing period for specimens fitted with
strain gages. Two readings were made each day, one during the freeze phase and the other during
the thaw phase. All strain gages survived the freeze-thaw test.
Dummy gages mounted on FRP panels were used for monitoring the strain using a half
bridge configuration so that temperature compensation was performed. The same dummy gages
were used both for specimens subjected to freeze-thaw as well as for control specimens not
subjected to freeze-thaw. The FRP panels containing the dummy gages were located in the
freeze-thaw machine. By observing the difference in the strain reading of the control specimens
(wrapped, no freeze-thaw conditioning) between freeze and thaw cycles, the thermal contraction
of the FRP panels from thaw to freeze cycles could be determined. Figures 3.1-3.4 show the
uncorrected strain readings on round and square control specimens that were not subjected to
freeze-thaw. On any given day, the reading of a gage during a freeze or thaw cycle should be
approximately the same, since the control specimens were not subjected to freeze-thaw. The
difference in gage readings from the thaw to freeze curves observed in Figures 3.1-3.4 is
therefore due to contraction of the dummy FRP panel. The compensation strains for glass and
carbon were determined by the average difference between the thaw and freeze readings for
57

control specimens from day 15 onward, when the strains were stable. Note that for carbon
(Figures 3.3-3.4), there is only a slight difference between thaw and freeze readings since its
coefficient of thermal expansion is close to zero. The compensation strains computed in this
manner are 372 micro-strain for glass FRP and –37 micro-strain for carbon FRP. Figures 3.7,
3.11, 3.15 and 3.19 show the compensated strains on the same four control specimens,
respectively. The strains during the thaw and freeze cycles are now approximately the same for
the control specimens without freeze-thaw conditioning from day 10 onward as expected.
The compensated FRP strains on round and square specimens wrapped with glass and
subjected to freeze-thaw are shown in Figures 3.5. 3.6, 3.8, 3.9, 3.10 and 3.12. In general, the
strain during the freeze cycle is 100-200 micro-strain higher than that during the thaw cycle. This
is most likely due to the thermal contraction of the glass wrap during freezing. Since the concrete
specimens prevent the contraction, the tensile strain in the glass wraps increase. An exception is
Figure 3.6, in which the strains during the thaw cycle is slightly but consistently higher than that
during the freeze cycle.
The compensated FRP strains on round and square specimens wrapped with carbon and
subjected to freeze-thaw are shown in Figures 3.13, 3.14, 3.16-3.18 and 3.20. The results are less
consistent for carbon than for glass. In Figures 3.13, 3.16 and 3.17 the thaw strains are higher
than the freeze strains, while the reverse is true in Figures 3.14 and 3.20.
A reason for some of the variability in the wrap strains could be the ingestion of water
into the Bristar. Although epoxy caps were used on both ends of each specimen to prevent water
penetration, during freeze-thaw cycling the caps of several specimens ruptured due to expansive
pressure from Bristar. The loss of strain with time in Figure 3.17 also is likely to be due to the
loss of pressure in the Bristar.
58

0
500
1000
1500
2000
2500
3000
3500
4000
4500
0 5 10 15 20 25 30 35
Test Duration (Days)
Mic
ro S
trai
n Gage 5 freezeGage 6 freezeGage 5 thawGage 6 thaw
Fig. 3.1 Hoop strains in glass wrap of round control specimen #3 before correcting for thermal
contraction of dummy FRP panel
3000
3500
4000
4500
5000
5500
6000
6500
7000
7500
0 5 10 15 20 25 30 35
Test Duration (Days)
Mic
ro S
trai
n Gage 13 freezeGage 14 freezeGage 13 thawGage 14 thaw
Fig. 3.2 Hoop strains in glass wrap of square control specimen #7 before correcting for thermal
contraction of dummy FRP panel
59

5000
5500
6000
6500
7000
7500
8000
0 5 10 15 20 25 30 35
Test Duration (Days)
Mic
ro S
trai
n Gage 21 freezeGage 22 freezeGage 21 thawGage 22 thaw
Fig. 3.3 Hoop strains in carbon wrap of round control specimen #11 before correcting for
thermal contraction of dummy FRP panel
0
500
1000
1500
2000
2500
3000
0 5 10 15 20 25 30 35
Test Duration (Days)
Mic
ro S
trai
n Gage 29 freezeGage 30 freezeGage 29 thawgage 30 thaw
Fig. 3.4 Hoop strains in carbon wrap of square control specimen #15 before correcting for
thermal contraction of dummy FRP panel
60

3000
3200
3400
3600
3800
4000
4200
4400
4600
4800
5000
0 5 10 15 20 25 30 35
Test Duration (Days)
Mic
ro s
trai
n
Gage 1 freezeGage 2 freezeGage 1 thawGage 2 thaw
Fig. 3.5 Hoop strains in glass wrap of round specimen #1 during freeze-thaw cycles
3000
3500
4000
4500
5000
5500
6000
6500
0 5 10 15 20 25 30 35
Test Duration (Days)
Mic
ro S
trai
n Gage 3 freezeGage 4 freezeGage 3 thawGage 4 thaw
Fig. 3.6 Hoop strains in glass wrap of round specimen #2 during freeze-thaw cycles
61

0
500
1000
1500
2000
2500
3000
3500
4000
4500
0 5 10 15 20 25 30 35
Test Duration (Days)
Mic
ro S
trai
n Gage 5 freezeGage 6 freezeGage 5 thawGage 6 thaw
Fig. 3.7 Hoop strains in glass wrap of control round specimen #3
0
500
1000
1500
2000
2500
3000
3500
4000
4500
5000
0 5 10 15 20 25 30 35
Test Duration (Days)
Mic
ro S
trai
n Gage 7 freezeGage 8 freezeGage 7 thawGage 8 thaw
Fig. 3.8 Hoop strains in glass wrap, round specimen #4 during freeze-thaw cycles
62

3000
3500
4000
4500
5000
5500
6000
0 5 10 15 20 25 30 35
Test Duration (Days)
Mic
ro S
trai
n
Gage 9 freezeGage 10 freezeGage 9 thawGage 10 thaw
Fig. 3.9 Hoop strains in glass wrap, square specimen #5 during freeze-thaw cycles
2000
2500
3000
3500
4000
4500
5000
0 5 10 15 20 25 30 35
Test Duration (Days)
Mic
ro S
trai
n Gage 11 freezeGage 12 freezeGage 11 thawGage 12 thaw
Fig. 3.10 Hoop strains in glass wrap, square specimen #6 during freeze-thaw cycles
63

3000
3500
4000
4500
5000
5500
6000
6500
7000
7500
0 5 10 15 20 25 30 35
Test Duration (Days)
Mic
ro S
trai
n Gage 13 freezeGage 14 freezeGage 13 thawGage 14 thaw
Fig. 3.11 Hoop strains in glass wrap of control square specimen #7
3000
3500
4000
4500
5000
5500
6000
6500
7000
7500
0 5 10 15 20 25 30 35
Test Duration (Days)
Mic
ro S
trai
n
Gage 15 freezeGage 16 freezeGage 15 thawGage 16 thaw
Fig. 3.12 Hoop strains in glass wrap of square specimen #8 during freeze-thaw cycles
64

3000
3500
4000
4500
5000
5500
6000
6500
7000
0 5 10 15 20 25 30 35
Test Duration (Days)
Mic
ro S
trai
n Gage 17 freezeGage 18 freezeGage 17 thawGage 18 thaw
Fig. 3.13 Hoop strains in carbon wrap of round specimen #9 during freeze-thaw cycles
3000
3500
4000
4500
5000
5500
6000
0 5 10 15 20 25 30 35
Test Duration (Days)
Mic
ro S
trai
n Gage 19 freezeGage 20 freezeGage 19 thawGage 20 thaw
Fig. 3.14 Hoop strains in carbon wrap of round specimen #10 during freeze-thaw cycles
65

5000
5500
6000
6500
7000
7500
8000
0 5 10 15 20 25 30 35
Test Duration (Days)
Mic
ro S
trai
n Gage 21 FreezeGage 22 freezeGage 21 thawGage 22 thaw
Fig. 3.15 Hoop strains in carbon wrap of control round specimen #11
3000
3500
4000
4500
5000
5500
6000
6500
7000
0 5 10 15 20 25 30 35
Test Duration (Days)
Mic
ro S
trai
n Gage 23 freezeGage 24 freezeGage 23 thawGage 24 thaw
Fig. 3.16 Hoop strains in carbon wrap of round specimen #12 during freeze-thaw cycles
66

2000
2500
3000
3500
4000
4500
5000
0 5 10 15 20 25 30 35
Test Duration (Days)
Mic
ro S
trai
n Gage 25 freezeGage 26 freezeGage 25 thawGage 26 thaw
Fig. 3.17 Hoop strains in carbon wrap of square specimen #13 during freeze-thaw cycles
3000
3500
4000
4500
5000
5500
0 5 10 15 20 25 30 35
Test Duration (Days)
Mic
ro S
trai
n Gage 27 freezeGage 28 freezeGage 27 thawgage 28 thaw
Fig. 3.18 Hoop strains in carbon wrap of square specimen #14 during freeze-thaw cycles
67

0
500
1000
1500
2000
2500
3000
0 5 10 15 20 25 30 35
Test Duration (Days)
Mic
ro S
trai
n Gage 29 freezeGage 30 freezeGage 29 thawgage 30 thaw
Fig. 3.19 Hoop strains in carbon wrap of control square specimen #15
0
1000
2000
3000
4000
5000
0 5 10 15 20 25 30 35
Test Duration (Days)
Mic
ro S
trai
n Gage 31 freezeGage 32 freezeGage 31 thawGage 32 thaw
Fig. 3.20 Hoop strains in carbon wrap of square specimen #16 during freeze-thaw cycles
68

3.1.2 Results of Compression Testing
Figures 3.21 to 3.35 show results of the compression tests for plain and wrapped control
specimens and those subjected to 150 and 300 cycles of freeze-thaw. For wrapped specimens
fitted with strain gages in the hoop direction, longitudinal compression strains are given along
the positive x-axis while the average tensile hoop strain is shown along the negative x-axis. The
compression stress for wrapped specimens was computed by excluding the concrete cross
sectional area lost due to the presence of the hole in which Bristar was inserted. The following
observations are made:
• Plain round specimens (Figures 3.21-3.23): Only one of three specimens survived freeze-
thaw conditioning for 300 cycles. This specimen had approximately the same compression
strength as the control specimens (~35000-45000 kPa). One of the specimens subjected to
150 freeze-thaw cycles displayed low stiffness and strength, and a progressively hardening
behavior— it is not apparent what contributed to this behavior. There is no significant
reduction in strength due to freeze-thaw conditioning except for the anomalous specimen.
• Round glass-wrapped specimens (Figures 3.24-3.26): The ultimate strength values for two
of the six control specimens were unreliable because these specimens could not be crushed in
the MSU compression testing machine and were retested at MDOT. In general, conditioning
had little effect and compression strength and failure strains were approximately the same for
control and conditioned specimens. Strength of wrapped specimens (~105000-114000 kPa)
was approximately 2.6 times larger than the strength of unwrapped specimens.
• Square glass-wrapped specimens (Figures 3.27-3.29): Again conditioning had little effect
on the compressive strength (~62000-66000 kPa), but it reduced the longitudinal strain at
69

failure from about 0.01-0.017 to ~0.007. Strength of wrapped specimens was approximately
1.5 times larger than the strength of unwrapped specimens.
• Round carbon-wrapped specimens (Figures 3.30-3.32): Conditioning reduced
compression strengths from about 92000 kPa (unconditioned) to about 80000 kPa (300
cycles) representing about a 15% strength loss. One specimen each in the 150 and 300 cycle
batches had unusually high strengths, indicating that one batch of specimens prepared might
have had a different strength level. Longitudinal failure strains reduced from about 0.015 to
0.01 (~33%). Strength of wrapped specimens (~95000 kPa) is approximately 2.3 times larger
than the strength of unwrapped specimens.
• Square carbon-wrapped specimens (Figures 3.33-3.35): Conditioning reduced
compression strengths slightly from about 58000-65000 kPa to about 55000-63000 kPa.
Longitudinal failure strains reduced from about 0.007-0.01 to about 0.005. Strength of
wrapped specimens (~60000 kPa) is approximately 1.4 times larger than the strength of
unwrapped specimens. Note that for square specimens, glass and carbon wraps increased the
strength by about the same amount.
The square wrapped specimens had lower compressive strength compared to the round
specimens, even though the cross sectional area of the square prisms is higher than that of the
round cylinders. This is due to the reduced confinement provided by the wraps for square cross
sections and stress concentrations that develop at the corners. Wrapped square prisms always
failed by rupture of the wrap at a corner (see Figure 3.36). Note that a reduction of
approximately 30% to 40% in failure stress exists between the round and the square specimens.
Figures 3.36–3.37 show the failure modes under compression testing.
70

0
10000
20000
30000
40000
50000
0.000 0.005 0.010 0.015 0.020
Longitudinal Strain
Str
ess
(kP
a)
Specim en 55
Specim en 56
Specim en 57
Specim en 58
Specim en 59
Specim en 60
Fig. 3.21 Compressive stress-strain curves for plain, round, control specimens
0
10000
20000
30000
40000
50000
0.000 0.005 0.010 0.015 0.020
Longitudinal Strain
Stre
ss (k
Pa)
Specimen 32
Specimen 33Specimen 34
Fig. 3.22 Compressive stress-strain curves for plain, round specimens subjected to 150 freeze-
thaw cycles
71

0
10000
20000
30000
40000
50000
0.000 0.005 0.010 0.015 0.020
Longitudinal Stain
Stre
ss (k
Pa)
Specimen 17
Fig. 3.23 Compressive stress-strain curves for plain, round specimens subjected to 300 freeze-
thaw cycles
0
10000
20000
30000
40000
50000
60000
70000
80000
90000
100000
110000
120000
-0.015 -0.010 -0.005 0.000 0.005 0.010 0.015 0.020 0.025
-Hoop Strain +Longitudinal Strain
Str
ess
(kP
a) Specimen 35
Specimen 36Specimen 37
Specimen 3Specimen 3
Fig. 3.24 Compressive stress-strain curves and tensile hoop strain for glass-wrapped, round,
control specimens
72

0
10000
20000
30000
40000
50000
60000
70000
80000
90000
100000
110000
120000
0.000 0.005 0.010 0.015 0.020
Longitudinal Strain
Stre
ss (k
Pa)
Specimen 20
Specimen 21
Specimen 22
Fig. 3.25 Compressive stress-strain curves for glass-wrapped, round specimens subjected to 150 freeze-thaw cycles
0
10000
20000
30000
40000
50000
60000
70000
80000
90000
100000
110000
120000
-0.015 -0.010 -0.005 0.000 0.005 0.010 0.015 0.020
Stre
ss (k
Pa) Specimen 1
Specimen 1
Specimen 2Specimen 2
Specimen 4
Specimen 4
Fig. 3.26 Compressive stress-strain curves and tensile hoop strain for glass-wrapped, round
specimens subjected to 300 freeze-thaw cycles
73

0
10000
20000
30000
40000
50000
60000
70000
80000
90000
100000
110000
120000
-0.015 -0.010 -0.005 0.000 0.005 0.010 0.015 0.020
-Hoop Strain +Longitudinal Strain
Stre
ss (k
Pa)
Specimen 40
Specimen 41
Specimen 42
Specimen 7
Specimen 7
Specimen 43
Specimen 44
Fig. 3.27 Compressive stress-strain curves and tensile hoop strain for glass-wrapped, square,
control specimens
0
10000
20000
30000
40000
50000
60000
70000
80000
90000
100000
110000
120000
0.000 0.005 0.010 0.015 0.020
Longitudinal Strain
Stre
ss (k
Pa)
Specimen 23
Specimen 24specimen 25
Fig. 3.28 Compressive stress-strain curves for glass-wrapped, square specimens subjected to 150
freeze-thaw cycles
74

0
10000
20000
30000
40000
50000
60000
70000
80000
90000
100000
110000
120000
-0.015 -0.010 -0.005 0.000 0.005 0.010 0.015 0.020
-Hoop Strain +Longitudinal Strain
Stre
ss (k
Pa)
Specimen 8
Specimen 8
Specimen 6Specimen 6
Specimen 5
Specimen 5
Fig. 3.29 Compressive stress-strain curves and tensile hoop strain for glass-wrapped, square specimens subjected to 300 freeze-thaw cycles
0
10000
20000
30000
40000
50000
60000
70000
80000
90000
100000
110000
120000
-0.015 -0.010 -0.005 0.000 0.005 0.010 0.015 0.020
-Hoop Strain +Longitudinal Strain
Stre
ss (k
Pa)
Specimen 45
Specimen 46
Specimen 47
Specimen 11
Specimen 11
Specimen 48
Specimen 49
Fig. 3.30 Compressive stress-strain curves and tensile hoop strain for carbon-wrapped, round,
control specimens
75

0
10000
20000
30000
40000
50000
60000
70000
80000
90000
100000
110000
120000
0.000 0.005 0.010 0.015 0.020
Longitudinal Strain
Stre
ss (k
Pa) Specimen 26
Specimen 27
Specimen 28
Fig. 3.31 Compressive stress-strain curves for carbon-wrapped, round specimens subjected to 150 freeze-thaw cycles
0
10000
20000
30000
40000
50000
60000
70000
80000
90000
100000
110000
120000
-0.015 -0.010 -0.005 0.000 0.005 0.010 0.015 0.020
-Hoop Strain +Longitudinal Strain
Stre
ss (k
Pa) specimen 9
specimen 9
specimen 10
specimen 10
specimen 12
specimen 12
Fig. 3.32 Compressive stress-strain curves and tensile hoop strain for carbon-wrapped, round specimens subjected to 300 freeze-thaw cycles
76

0
10000
20000
30000
40000
50000
60000
70000
80000
90000
100000
110000
120000
-0.015 -0.010 -0.005 0.000 0.005 0.010 0.015 0.020
-Hoop Strain +Longitudinal Strain
Stre
ss (k
Pa)
Specimen 50Specimen 51
Specimen 15
Specimen 15
Specimen 52
Specimen 53
Specimen 54
Fig. 3.33 Compressive stress-strain curves and tensile hoop strain for carbon-wrapped, square,
control specimens
0
10000
20000
30000
40000
50000
60000
70000
80000
90000
100000
110000
120000
0.000 0.005 0.010 0.015 0.020
Longitudinal Strain
Stre
ss (k
Pa)
Specimen 29
Specimen 30
Specimen 31
Fig. 3.34 Compressive stress-strain curves for carbon-wrapped, square specimens subjected to
150 freeze-thaw cycles
77

0
10000
20000
30000
40000
50000
60000
70000
80000
90000
100000
110000
120000
-0.015 -0.010 -0.005 0.000 0.005 0.010 0.015 0.020
-Hoop Strain +Longitudinal Strain
Stre
ss (k
Pa)
Specimen 13
Specimen 13
Specimen 14Specimen 14
Specimen 16
Specimen 16
Fig. 3.35 Compressive stress-strain curves and tensile hoop strain for carbon-wrapped, square
specimens subjected to 300 freeze-thaw cycles
Fig. 3.36 Failure modes for square specimens under compression testing
78

(a) Glass wrap
(b) Carbon wrap
Fig. 3.37 Failure modes for round specimens under compression testing
79

It was also noted that the square wrapped specimens demonstrated a sudden loss of
strength after the peak stress was reached. However, the wraps were undamaged during this loss
of strength. The loss of strength is most likely due to failure of the ineffectively confined regions
of concrete. These regions do not experience capacity enhancement resulting from confinement.
A measure of ductility enhancement under compression is the ratio of the mean
longitudinal failure strain of wrapped specimens (εu, wrapped) to the mean longitudinal failure
strain of unwrapped specimens (εu, unwrapped).
The mean failure strains and strain ratios are given in Table 3.1. The ultimate strain for
unwrapped specimens is difficult to determine accurately because of the rapid unloading near
failure. Therefore, for unwrapped specimens, the strain at peak stress is used. As expected,
ductility under compression is enhanced more for round specimens than for square specimens. In
general freeze-thaw (F/T) conditioning reduces the ductility. Glass wrapped specimens are more
ductile than the carbon wrapped specimens because the ultimate failure strain of glass is higher
than that of carbon.
3.1.3 Statistical Analysis
Table 3.2 provides the ultimate compression strength, mean, standard deviation and 95%
confidence margin for each category of specimens. The cross sectional area lost by the cavity
containing Bristar was deducted when calculating the stresses. The 95% confidence margin is
calculated as t*ns , where s is the sample standard deviation, n is the sample size, and t* is the
value which a t-distributed random variable with n − 1 degrees of freedom will exceed with
probability (1 − 0.95)/2 = 0.025 (Neter et al. 1992).
80

Table 3.1 Ductility enhancement under compression for wrapped specimens Shape Wrap No. of F/T Cycles Mean Longitudinal
Failure Strain (%) εu, wrapped /εu, unwrapped
Round
None 0 0.2 1.0
150 0.2 1.0 300 0.2 1.0
Glass 0 1.8 9.0
150 1.2 6.0 300 1.7 8.5
Carbon 0 1.3 6.5
150 1.0 5.0 300 0.9 4.5
Square
None 0 0.2* 1.0
150 0.2* 1.0 300 0.2* 1.0
Glass 0 1.3 6.5
150 1.2 6.0 300 0.7 3.5
Carbon 0 0.8 4.0
150 0.5 2.5 300 0.5 2.5
* Unwrapped square specimens were not used. It is assumed that the failure strain for unwrapped square specimens is approximately the same as that for unwrapped round specimens
The average compressive strength for the control, 150 freeze-thaw cycle, and 300 freeze-
thaw cycle specimens is displayed in Figures 3.38-3.42. A 95% confidence interval is also
provided. Due to the small sample sizes and unknown population variances, the t-distribution
was used for all hypotheses tests in this report.
The null and alternate hypotheses are:
• Null hypothesis (Ho): There is no significant difference between the means of control and
freeze-thaw specimens, i.e., μ control = μ F/T
• Alternate hypothesis (Ha): There is a significant difference in means of control and freeze-
thaw specimens, i.e., μ control ≠ μ F/T
81

Table 3.2 Freeze-thaw summary data No. of F/T Cycles
Specimen Type Ultimate Compressive Strength (kPa)
Shape Wrap Individual Specimens Mean Standard Deviation
95% Conf. Margin
300
Round
Glass 109801, 106451 108858 108370 1727 ±4291
Carbon 94459, 79721 79962 84714 8440 ±20967
Plain 42875, *, * a 42875 0 NA
Square Glass 62370, 64362
64551 63761 1208 ±3002
Carbon 57870, 57279 63004 59384 3149 ±7822
150
Round
Glass 106575, 112621 109316 109504 3027 ±7520
Carbon 97675, 84705 83178 88519 7966 ±19788
Plain 41080, 29825 36926 35944 5691 ±14138
Square Glass 64881, 61500
66988 64456 2769 ±6877
Carbon 55332, 58231 61421 58328 3046 ±7566
0
Round
Glass 109504, 104977 114289, 110873 92200b, 89000b
109911 3856 ±6136
Carbon 93254, 90494, 95130 86555, 93174, 96738 92558 3612 ±3791
Plain 41911, 41696, 40932 39973, 37114, 44818 41074 2531 ±2656
Square Glass 65820, 65776, 64148
61856, 62216, 61792 63601 1907 ±2002
Carbon 61623, 58034, 60294 65542, 63967, 62082 61924 2652 ±2783
a Specimens that did not survive 300 F/T cycles are denoted with * b Data unreliable because specimens did not fail when tested at MSU and were retested at MDOT
Sample calculations
Comparing results for carbon wrapped, control, round specimens and carbon wrapped, 300 F/T
cycle, round specimens, for the former
92558__
1 =x kPa, S1 = 3612 kPa , n1 = 6, and for the latter
82

84714__
=x kPa, S2 =8440 kPa , n2 = 3 2
x , where S, and n are sample average, standard deviation, and size, respectively.
A conservative degree-of-freedom is (Neter at el. 1992)
1 2
The 95% confidence interval for control - F/T (difference between the mean strength of control
specimens not subjected to F/T and is
d.o.f.= smaller of n − 1 or n – 1 = 3 – 1 = 2 ⇒ t* = 4.303 ( 2 tail test)
μ μ
the mean strength of specimens subjected to F/T)
2
2
1
22
____
/ss
TFcontrol μμ n mean (Neter at el. 1992)
According to statistical theory, when the confidence interval spans zero the means are not
significantly different and Ho is not rejected.
The results of the hypothesis tests for the various comparisons are given in Table 3.3. The
standard deviations and number of samples for each case are given in Table 3.2. The value of t*
was 4.303 for all comparisons.
Table 3.3 Results of hypothesis tests (95%) on specim ee
Shape W No. of F/T Cycles
1*21 nn
txx +±−=− where μ is populatio
=7844 ± 4.303 (5091) = (−14063, 29751)
ens exposed to frC.I. (kPa) for
ze-thaw cycles Outcome of rap μ control - μ F/T Test
Plain 150 (-9692, 19952) Don’t Reject Ho300 NA
Round Glass 150 (-10789, 11603) Don’t Reject Ho300 (-7799, 10881) Don’t Reject Ho
Carbon (-16745, 24821) 150 Don’t Reject Ho300 (-14063, 29751) Don’t Reject Ho
Square Glass 150 (-8506, 6796) Don’t Reject Ho
300 (-4339, 4659) Don’t Reject Ho
Carbon 150 (-5290, 12482) Don’t Reject Ho300 (-6565, 11645) Don’t Reject Ho
83

At the 95% confidence, means of the compressive strength of freeze thaw specimens are
not significantly different from those of control specimens. Similarly, the freeze thaw cycles
have no statistically significant effect on the compressive strength of round specimens.
At the 95% confidence level, means of the compressive strength of freeze thaw
specimens are not significantly different from those of control specimens. Similarly, the freeze-
thaw cycles have no statistically significant effect on the compressive strength of square
specimens.
It should be noted that a reduction in mean compressive strength was observed for
carbon-wrapped specimens after freeze-thaw conditioning. This difference is not statistically
significant for the sample size used in this study.
0
20000
40000
60000
80000
100000
120000
140000
Control 150 F/T cycles 300 F/T cycles
Stre
ss (k
Pa)
Fig 3.38 Average compressive strength of round glass-wrapped specimens
84

0
20000
40000
60000
80000
100000
120000
Control 150 F/T cycles 300 F/T cycles
Stre
ss (k
Pa)
Fig 3.39 Average compressive strength of round carbon-wrapped specimens
0
20000
40000
60000
80000
100000
120000
Control 150 F/T cycles 300 F/T cycles
Stre
ss (k
Pa)
Fig 3.40 Average compressive strength of square glass-wrapped specimens
85

0
20000
40000
60000
80000
100000
120000
Control 150 F/T cycles 300 F/T cycles
Stre
ss (k
Pa)
Fig 3.41 Average compressive strength of square carbon-wrapped specimens
0
20000
40000
60000
80000
100000
120000
Control 150 F/T cycles 300 F/T cycles
Stre
ss (k
Pa)
Fig 3.42 Average compressive strength of round plain specimens
86
3.1.4 Effect of Sustained Loads on Freeze-Thaw Durability of Wraps
Bristar was used in the wrapped specimens to investigate the durability of glass and
carbon wraps under sustained load subjected to freeze-thaw cycling. The sustained load
simulated the load generated in wrapped columns by corrosion products.
The compression strength of wrapped specimens subjected to freeze-thaw cycling was
not significantly different than that of wrapped control specimens. This indicates that the wraps
did not sustain any significant damage due to freeze-thaw cycling under sustained load.
3.1.5 Comparison of Measured and Predicted Confined Compression Strength
Equations for predicting the confined compression strength of wrapped circular and
rectangular columns are outlined in Section 1.3.6. Here the confined compression strengths
predicted by Eq. 1.1 and 1.5 are compared to the measured strengths. Measured FRP panel
properties in Tables 2.1 and 3.1 were used in the predictions for unconditioned and conditioned
specimens, respectively. The observed and predicted compression strengths are shown in
Table 3.4. The table indicates that the Restrepol-DeVino model for rectangular sections over
predicts the measured strengths of unconditioned specimens by about 38% and 9% for glass and
carbon wrapped specimens, respectively. For unconditioned round glass and round carbon
wrapped specimens, the Richart model over predicts the observed strength by about 16% and
−2%, respectively. For conditioned specimens, the Restrepol-DeVino model for rectangular
sections over predicts the measured strengths by about 21% and 9% for glass and carbon
87

wrapped specimens, respectively. For conditioned round glass and round carbon wrapped
specimens, the predicted and the measured strength are almost the same.
Table 3.4 Comparison of measured and predicted confined compression strength No. of F/T
Cycles Shape Wrap Type
Predicted
Strength (kPa)
Measured
Strength (kPa)
Predicted/
Measured
0
Round Glass 127,707 109,910 1.16
Carbon 90,542 92,577 0.98
Square Glass 87,614 63,601 1.38
Carbon 67,649 61,924 1.09
300
Round Glass 108,224 108,370 1.00
Carbon 85,131 84,714 1.00
Square Glass 77,147 63,761 1.21
Carbon 64,742 59,384 1.09
3.2 Accelerated Corrosion
3.2.1 Mass Loss Results
Corrosion specimens were removed from the corrosion tank in two phases and
measurements of corrosion-induced mass loss were determined. Mass loss data and corrosion
depths for the first batch (exposed to 130 days of accelerated corrosion) and the second batch
(exposed to 190 days of accelerated corrosion) are given in Tables 3.5 and 3.6, respectively. The
standard deviation and 95% confidence margin for the corrosion depth also are provided. The
95% confidence margin was calculated in the same way as for the ultimate strength in Table 3.2.
The corrosion depth for each individual bar varied significantly over the length of the bar. The
depth reported in Tables 3.5 and 3.6 is the average depth calculated from the total mass loss for
88

each bar. The average corrosion depth over the entire bar can be calculated from the fractional
mass loss (FML) of the bar.
FML = i
fi
www −
where
= initial weight of bar iw
= final weight of bar fw
Note that
FML = 2
22
2
22
i
fi
i
fi
rrr
rrr −
=−
ρπρπρπ
where ρ is the density.
∴ FMLrr if −= 1
Average corrosion depth = fi rr −
= ( )FMLri −− 11
The average corrosion depths for all categories and 95% confidence intervals are displayed in Fig. 3.43.
89

0
500
1000
1500
2000
2500
3000
3500
130 days 190 days
Duration of Accelerated Corrosion
Ave
rage
Cor
rosi
on D
epth
( μm
)
Glass bondedGlass unbondedCarbon bondedCarbon unbondedPlain
Fig. 3.43 Average corrosion depths due to accelerated corrosion
The following observations are made:
1. Corrosion depths for reinforcement in specimens with unbonded wraps were approximately
20% more than those in specimens with bonded wraps after 190 days of testing. This may be
due to water seepage between the concrete and the plastic sheet used to create the unbonded
condition.
2. Wrapping reduced the corrosion depth by 46% – 59% after 190 days of testing.
It should be noted that the specimens removed after 130 days had corrosion levels of
“medium” to “severe” prior to wrapping. The specimens removed after 190 days, on the other
hand, had a “low” corrosion level prior to wrapping. This accounts for the higher variability in
the corrosion mass loss in the specimens removed after 130 days.
90

Table 3.5 Mass loss and average corrosion depth for specimens exposed to 130 days of accelerated corrosion
Individual Standard 95% Conf.Specimens Deviation Margin
9 289.0 82.5 98211 288.4 81.0 96586 281.0 93.0 115688 286.0 101.5 125045 289.5 119.5 148447 288.6 96.4 116862 289.2 103.2 125764 286.0 110.7 137850 288.7 108.0 132652 289.1 113.8 140529 289.3 88.4 105831 288.0 136.0 173770 288.6 121.1 151272 288.8 91.2 109754 288.8 121.5 151756 288.9 120.7 150590 286.7 102.5 126092 281.4 127.0 164666 286.0 187.0 261468 289.0 175.5 237038 289.0 176.0 237940 289.5 190.5 26372 290.3 181.5 24634 289.4 172.5 2314
13 289.4 169.2 225815 289.3 162.3 2143
Average Corrosion Depth (μm)
MeanMass Loss (g)
Specimen Type
Corrosion Level Before Wrapping Bar No. Original
Mass (g)
1168 191 ±200
1342 65 ±104
2397 169 ±142
1351 329 ±524
1482 161 ±256
Glass bonded
Medium
Low
Severe
Glass unbonded
Severe
Medium
Carbon bonded
Medium
Severe
Carbon unbonded
Severe
Medium
Plain
Severe
Low
Medium
Low
91

Table 3.6 Mass loss and average corrosion depth for specimens exposed to 190 days of accelerated corrosion
Individual Standard 95% Conf.Specimens Deviation Margin
17 289.7 95.9 115619 288.7 98.5 119557 289.5 101.3 123059 286.5 87.9 106382 286.9 103.4 127184 280.9 98.2 122925 285.8 113.8 142427 289.2 116.3 143942 290.0 117.8 145644 288.6 114.5 141833 289.2 100.0 121435 286.4 102.7 126577 286.6 109.8 136279 285.9 108.6 134922 289.9 115.2 142024 288.7 116.3 144293 280.4 125.8 163595 280.9 130.3 17015 288.7 187.7 25947 285.8 204.0 2951
73 288.4 208.8 301475 289.7 207.2 2961
Average Corrosion Depth (μm)
Mean
Glass bonded
Low
Low
Low
Specimen Type
Corrosion Level Before Wrapping Bar No. Original
Mass (g)Mass Loss
(g)
1191 73 ±77
1434 17 ±27
1297 70 ±112
1550 140 ±222
2880 193 ±307
Glass unbonded
Low
Low
Carbon bonded
Low
Low
Carbon unbonded
Low
Low
PlainLow
Low
92

3.2.2 Statistical analysis
The following hypotheses are tested for the specimens exposed to 190 days of accelerated
corrosion.
1. Null hypothesis (Ho): There is no significant difference between the mean corrosion
depth for bonded and unbonded specimens with the same type of wrap.
i.e., Ho: μ bonded = μ unbonded
Alternate hypothesis (Ha): There is a significant difference between the mean corrosion
depth for bonded and unbonded specimens with the same type of wrap.
i.e., . Ha: μ bonded ≠ μ unbonded
2. Null hypothesis (Ho): There is no significant difference between the mean corrosion
depth for carbon bonded and glass bonded specimens or between carbon unbonded and
glass unbonded specimens, i.e, Ho: μ carbon = μ glass
Alternate hypothesis (Ha): There is a significant difference between the mean corrosion
depth for carbon bonded and glass bonded specimens or carbon unbonded and glass
unbonded specimens, i.e., Ha: μ carbon ≠ μ glass
Sample calculations
Comparing results for carbon wrapped bonded specimens and carbon wrapped unbonded
specimens, for the former
1297__
1 =x μm, S1 = 70 μm, n1 = 4, and for the latter
1550__
2 =x μm, S2 =140 μm, n2 = 4
93

where x , S, and n are sample average, standard deviation, and size, respectively.
A conservative degree-of-freedom is
d.o.f.= smaller of n1 - 1 or n2 – 1 = 4-1=3 ⇒ t* = 3.182 ( 2 tail test)
The 95% confidence interval for μ bonded - μ unbonded, using a 2-sample t is
μ bonded - μ unbonded 2
22
1
21*
__
2
__
1 ns
ns
txx +±−= where μ is population mean
= -252 ± 3.182 (78) = (-500, -3.4)
Since this confidence interval does not span zero, the means are significantly different and Ho. is
rejected.
The results of the hypothesis tests for the various comparisons are given in Table 3.7. The
standard deviations and number of samples for each case are given in Table 3.6. The value of t*
was 3.182 for all comparisons.
Table 3.7 Results of hypothesis tests (95%) on specimens exposed to accelerated corrosion Wrap Type C.I. for μ bonded - μ unbonded (μm) Outcome of Test
Glass (-343, -144) Reject Ho Carbon (-300, -3.4) Reject Ho
FRP/Concrete Adhesion C.I. for μ carbon - μ glass (μm) Outcome of Test Bonded (-41, 253) Don’t reject Ho
Unbonded (-108, 340) Don’t reject Ho
The following observations are made:
• The mean corrosion depths for bonded and unbonded specimens are different at the
95% significance level. The bonded wrap is more effective in reducing the rate of
corrosion than the unbonded wrap.
94

• The mean corrosion depths for specimens with glass and carbon wraps for either the
bonded or unbonded conditions are not significantly different. Both wrap systems,
glass and carbon, are equally effective in reducing the corrosion rate.
3.2.3 Strain Measurements
The wrapped corrosion specimens were fitted with strain gages. Two gages oriented in
the circumferential direction were mounted at mid-height were mounted on each specimen. On
some specimens, the strain gages were installed near the anodes, the site of corrosion and
subsequent volume expansion. For others, strain gages were installed between the anode and
cathode. The purpose of this arrangement was to investigate the variation in strain gage readings
with respect to the site of corrosion. The observations below are for the specimens exposed to
190 days of accelerated corrosion:
• For glass bonded specimens (Figure 3.44), it is evident that the strain reading is considerably
higher for specimen 7 (approximately 4200 micro strain) for which the gages are located at
the anodes. For other specimens the gages (installed between the anodes and cathodes) are
consistent at about 900 micro strain. Based on the average strains developed at gages not
located at the anodes, the confining pressure is estimated to be about 950 kPa away from the
anodes, but much higher near the anodes.
• For glass unbonded specimens (Figure 3.45), all strain gage readings are about 1500 micro
strain regardless of the gage location. This yields a confining pressure of about 1600 kPa
(scaled directly from Table 2.5 as 5644.9 x 1500/5310). The unbonded condition, created by
a plastic sheet located between the wrap and the specimens, allows the wrap to expand more
freely instead of concentrating the strains near the anode as in the bonded wraps.
95

• For carbon bonded specimens (Figure 3.46), the results are similar to those for the glass
bonded specimens. The strains developed for specimen 13 (for which the gages are located at
the anodes) are higher than the gage readings for the other specimens (for which gages are
located between the anodes and the cathodes) and is approximately 1800 micro strain. The
average strain value where gages are located between the anodes and the cathodes is about
1300 micro strain, and yields a confining pressure of about 1150 kPa.
• For carbon unbonded specimens (Figure 3.47), all strain gage readings are about the same
regardless of the gage location and approximately 1300 micro strain. This yields a confining
pressure of about 1150 kPa.
Figures 3.44 to 3.47 indicates that wrap strains for bonded specimens with both types of
wraps tend to level off with time. One explanation could be that the stress concentration near the
anodes in the bonded wraps is more effective in containing the corrosion-induced crack and
reducing the corrosion rate. The slip of unbonded wraps and the resulting redistribution of strain
along the entire wrap may be less effective at containing the large corrosion-induced crack near
the anodes.
Figure 3.48 shows strains at gages placed on the anodes, and indicates the following:
• Even though the corrosion rate for the bonded specimens is lower than that for the unbonded
specimens, hoop strains developed near the anodes for specimens with bonded wraps are
higher than those developed with unbonded wraps. In the case of unbonded specimens, the
entire wrap (to some degree) absorbs the volume expansion associated with corrosion of the
reinforcement, while for bonded wraps the strain is localized near the corrosion-induced
crack at the anode.
96

-3000
300600900
120015001800210024002700300033003600390042004500
0 2 4 6 8 10 12 14 16 18 20 22 24 26 28
Time (weeks)
Stra
in (
)
Specimen 1
Specimen 2
Specimen 5
Specimen 7 (gage at anode)
Fig. 3.44 Hoop strains in bonded, glass-wrapped specimens
-3000
300600900
120015001800210024002700300033003600390042004500
0 2 4 6 8 10 12 14 16 18 20 22 24 26 28
Time (weeks)
Stra
in ( μ
ε)
Specimen 3 (gage at anode)Specimen 6
Specimen 8
Specimen 4
Fig. 3.45 Hoop strains in unbonded, glass-wrapped specimens
97

-3000
300600900
120015001800210024002700300033003600390042004500
0 2 4 6 8 10 12 14 16 18 20 22 24 26 28
Time (weeks)
Stra
in ( μ
ε) Specimen12
Specimen13 (gage at anode)Specimen15
Specimen16
Fig. 3.46 Hoop strains in bonded, carbon-wrapped specimens
-300
0
300
600900
1200
1500
1800
2100
2400
2700
30003300
3600
3900
4200
4500
0 2 4 6 8 10 12 14 16 18 20 22 24 26 28
Time (weeks)
Stra
in (
)
Specimen 11 (gage at anode)Specimen 14
Specimen 17
Specimen 18
Fig. 3.47 Hoop strains in unbonded, carbon-wrapped specimens
98

-3000
300600900
120015001800210024002700300033003600390042004500
0 2 4 6 8 10 12 14 16 18 20 22 24 26 28
Time (weeks)
Stra
in (
)CarbonbondedCarbonunbondedGlassbondedGlassunbonded
Fig. 3.48 Hoop strains in glass and carbon-wrapped specimens, gages at the anodes
• Corrosion of reinforcement seems to have a more direct effect on strain values generated in
glass bonded wraps compared to those with carbon bonded wraps. The maximum strain for
glass bonded wraps is approximately 4000 micro strain compared to 1800 micro strain for
carbon bonded wraps. It should be noted that variations in strain readings also could be
influenced by initial wrap tightness around the specimens and by crack width and direction.
Although the wrap strain near the anode is large, there is no danger of stress rupture in the
glass since the stress rupture limit (with a safety factor of 1.67) is about 0.2 εu = 4000 micro
strain. Further, in real columns the strain near corroding bars will be significantly smaller
because of the larger column diameter and concrete cover.
99

Note that the wrap strains measured in the accelerated corrosion test away from the
anodes are lower than the wrap strains generated by Bristar in the freeze-thaw test. Thus the
internal expansive force used in the freeze-thaw test was very conservative.
3.3 Effect of Freeze-Thaw and Wet-Dry Cycling on the Properties of FRP Panels
Table 3.8 provides the mean mechanical properties of FRP panels after 300 freeze-thaw
cycles and 190 wet-dry cycles with 3% NaCl solution. The properties for unconditioned panels
from Table 2.1 also are included in Table 3.8 to facilitate comparisons. Note that different sets of
specimens were used for the unconditioned modulus and strength tests. Properties of individual
specimens are given in Appendix B. It is difficult to control the thickness of panels fabricated
using the wet lay-up process. This impacts the measured moduli because the volume fraction of
fibers changes. For comparisons the effective stiffness (modulus × thickness) and ultimate
strength per unit width per layer should be used since these are not sensitive to specimen
thicknesses.
The following hypotheses are tested for the freeze-thaw and wet-dry conditioning:
• Null hypothesis (Ho): There is no significant difference between the mean property (effective
stiffness, ultimate strength per unit width or ultimate strain) of the control specimen and the
corresponding mean property of the conditioned specimen. i.e., Ho: μ control = μ conditioned
• Alternate hypothesis (Ha): There is a significant difference between the mean property of the
control specimen and the corresponding mean property of the conditioned specimen.
i.e., . Ha: μ control ≠ μ conditioned
100

Table 3.8 Mean properties per layer for unconditioned and conditioned FRP panels
Wrap Type
Thickness (mm.)
Modulus (MPa)
Effective Stiffness (N/mm)
Ultimate Strength (MPa)
Ult. Str. Per Unit Width
(N/mm)
Ultimate Strain
Unconditioned
Glass 1.227 22011 26967 1.275 421 536 0.019
Carbon 0.625 53061 33192 0.506 821 415 0.015
300 Freeze-Thaw Cycles Glass 1.092 24148 26506 385 424 0.016
Carbon 0.508 79014 43171 820 448 0.010 190 Wet-Dry Cycles
Glass 0.914 29538 27467 469 439 0.016 Carbon 0.571 83765 46786 738 413 0.009
Table 3.9 Outcome of 95%-level significance tests for μcontrol −μF/T
Wrap Type Effective Stiffness Ultimate Strength per Unit Width Ultimate Strain
Glass Do not reject Ho Reject Ho Reject Ho Carbon Reject Ho Do not reject Ho Reject Ho
Table 3.10 Outcome of 95%-level significance tests for μcontrol −μwet-dry
Wrap Type Effective Stiffness Ultimate Strength per Unit Width Ultimate Strain
Glass Do not reject Ho Reject Ho Reject Ho Carbon Reject Ho Do not reject Ho Reject Ho
The 95% confidence intervals for the difference in the mean properties of control and
conditioned panels, and the outcome of the significance tests, are given in Tables 3.9 and 3.10
for the freeze-thaw and wet-dry conditioning, respectively. The confidence intervals are
computed as outlined in Section 3.2.2. By comparing these results to the unconditioned panels
tested (see Table 2.1), the following observations are made:
• The freeze-thaw conditioning had little effect on the mean effective stiffness of glass panels
while that of carbon panels appear to have been increased by 30%, the latter being significant
101

at the 95% level. The decrease of 21% in the mean ultimate strength per unit width of glass is
significant at the 95% level, but the apparent increase in strength for carbon is not significant
at the 95% level (because of the large variation for the unconditioned panels). The decrease
of 20% and 28% in the mean ultimate strains of glass and carbon panels, respectively, is
significant at the 95% confidence interval. It should be noted that many of the failures
occurred at the grips and may have been premature. The ultimate strains of the unconditioned
and conditioned specimens are significantly lower than the values reported by Aerospace
Corporation (see Appendix A). It is likely that a better end fixture needs to be used for the
tension testing of the FRP strips for obtaining accurate ultimate strengths and strains.
• The wet-dry conditioning had little effect on the mean effective stiffness of glass panels
while that of carbon panels appear to have increased by 41%, the latter being significant at
the 95% level. The decrease of 18% in the mean ultimate strength per unit width of glass is
significant at the 95% level, but there is no significant change in strength for carbon. The
decrease of 20% and 36% in the mean ultimate strains of glass and carbon panels,
respectively, is significant at the 95% confidence interval.
The increase in effective stiffness for carbon FRP after conditioning is unexpected and
has not been reported by other investigators. The carbon panels were extremely thin and many of
the test specimen broke at the grips or split longitudinally. These failures may have been
premature and contributed to the low ultimate strains for carbon.
In order to cross check the test results the following additional tests were performed:
• One carbon strip (Sample 6) left over near the edges of the panel exposed to freeze-thaw
conditioning and from which the original samples were cut was tested.
102

• Two carbon specimens that broke at the grips and otherwise appeared undamaged were re-
tested. One specimen had been subjected to freeze-thaw conditioning (Sample 4), and the
other was subjected wet-dry conditioning (Sample 2).
• One glass sample that broke at the grip and otherwise appeared undamaged was re-tested.
This specimen was subjected to 300 freeze-thaw cycles (Sample 5).
The results from these tests, shown in Table 3.11 and plotted in Figures 3.49, 3.50 and 3.51,
indicate the following:
• The effective stiffness for the new carbon Sample 6 and the re-tested carbon Sample 4
(Figure 3.49) are very close to that of the mean value for unconditioned specimens, and are
about 25% lower than the effective stiffness measured from the original test for Sample 4.
The effective stiffness for the re-tested carbon Sample 2 (Figure 3.50) is 20% higher than the
mean value for unconditioned specimens. The variation in the estimates is indicative of the
difficulty in obtaining reliable measures for the very thin carbon specimens.
• The ultimate strengths per unit width are lower for the new and re-tested carbon specimens
than for the original tests. This behavior is expected for the re-tested specimens, since some
microcracks are likely to have developed during the first test causing premature failure
during the re-test. The lower strength of the new specimen is most likely a reflection of the
significant scatter in the strength results for carbon.
• The results for the re-tested glass specimen (Sample 5) are very close to the original test results, and indicate that the results for glass are much more reliable than those for carbon.
103

Table 3.11 Properties per layer of FRP panels from additional tests and re-tests FRP Type (New
or Retest)
Condi-tioning
Sample Number
Width (mm)
Thick. (mm)
Modulus (MPa)
Effective Stiffness (N/mm)
Ultimate Strength Per Unit Width
(N/mm)
Ult. Strain
Carbon (new)
Freeze-thaw Sample 6 10.69 1.092 63309 34547 347 0.010
Carbon (retest)
Freeze-thaw Sample 4 12.53 1.161 57333 33468 418 0.009
Carbon (retest) Wet-dry Sample 2 13.20 1.346 56586 39946 374 0.009
Glass (retest)
Freeze-thaw Sample 5 13.20 1.232 22879 24776 365 0.015
0
50
100
150
200
250
300
350
400
450
500
0 0.2 0.4 0.6 0.8 1 1.2
Strain (%)
Fo
rce/
Un
it W
idth
/Lay
er (
N/m
m)
Sample 4 (Original)
Sample 4 (Re-test)
Sample 6
Sample 4 (Original)
Sample 6
Sample 4(Re-test)
Fig. 3.49: New carbon sample and re-test of carbon sample subjected to freeze-thaw
104

0
50
100
150
200
250
300
350
400
450
0 0.2 0.4 0.6 0.8 1 1.2
Strain (%)
Fo
rce/
Un
it W
idth
/Lay
er (
N/m
m)
Sample 2 (Original)
Sample 2 (Re-test)
Original
Re-test
Fig. 3.50 New carbon sample and re-test of carbon sample exposed to wet-dry conditioning
0
50
100
150
200
250
300
350
400
0 0.2 0.4 0.6 0.8 1 1.2 1.4 1.6
Strain (%)
Fo
rce/
Un
it W
idth
/Lay
er (
N/m
m)
Sample 5 (Original)
Sample 5 (Re-test)
Fig. 3:51: Re-test of glass sample subjected to freeze-thaw
105

106
The unconditioned control panels and the conditioned panels were fabricated at different
times and the epoxy mixes are likely to have been slightly different. Some of the observed
differences in properties are likely to be due to fabrication variations. For more reliable
comparisons control panels and panels to be conditioned for each FRP should be cut out of a
single larger panel. Testing of the thin carbon panels also is problematic and better test fixtures
and procedures may need to be implemented.
In general, the results from the panel tests are somewhat unreliable for carbon.
3.4 Impact Test
Both glass and carbon FRP panels did not display any significant damage due to the
impact test. Minor interlaminar debonding was visible on the glass panels, which are somewhat
transparent, at the point of impact. Interlaminar debonding could not be observed on the carbon
panels because they are opaque. For column repair purposes, both types of FRP panels (glass and
carbon) behaved in an acceptable manner. The wraps should therefore be able to sustain damage
from vandalism or minor vehicle impact.
3.5 Behavior at Very High Temperature
At 100°C the wraps browned, at 150°C they charred and unraveled, and at 200°C the
epoxy completely burned and evaporated. The discoloration was more pronounced for glass
wrapped specimens due to the light color of the glass fibers. Thus, unless effective insulation is
provided the wraps become ineffective at very high temperature and are not able to provide any
confinement.

Chapter 4 Summary, Conclusions and Recommendations
Experiments were conducted to assess the effects of using glass and carbon FRP wraps in
rehabilitating corrosion-damaged columns. Issues that were explored are: (1) freeze-thaw
durability of concrete square and cylindrical specimens wrapped with glass and carbon FRP and
subjected to an internal expansive force; (2) effect of wrapping on the rate of corrosion in an
accelerated corrosion test; (3) effect of freeze-thaw and wet-dry cycles on the properties of FRP
panels; and (4) the impact resistance of glass and carbon FRP; (5) effect of high temperature on
FRP wraps.
4.1 Freeze-Thaw Test
Strength and durability tests were carried out on wrapped circular (diameter of 152 mm
by 305 mm high) and square cylinders (152 mm by152 mm by 305 mm high). The primary
purpose of the tests was to determine the endurance of the jackets under simulated cyclic
environmental conditions. Creation of an internal bursting force similar to that produced by
corroding steel was attempted. This was done by fabricating specimens with a hole in the
longitudinal direction and filling it with an expanding cement known as Bristar (used for silent
demolition). Chloride was impregnated into the cylinders during casting in order to simulate
deteriorated concrete. Compression strength tests were carried out on plain and wrapped control
cylinders as well as wrapped test specimens after 150 and 300 cycles of freeze-thaw
conditioning. A total of sixty specimens were utilized in the freeze-thaw test. The strength of
FRP panels subjected to 300 freeze-thaw cycles also was investigated.
107

Bristar was used in the wrapped specimens to investigate the durability of glass and
carbon wraps under sustained load and subjected to freeze-thaw cycling. The sustained load
simulated the load generated in wrapped columns by corrosion products. The means of the
compressive strength of freeze-thaw specimens are not significantly different from those of
control specimens at the 95% confidence level. This holds both for carbon and glass wraps, and
for specimens with round and square cross sections. It should be noted that a reduction in mean
compressive strength was observed for carbon-wrapped specimens after freeze-thaw
conditioning. Based on our sample size and statistical analysis, this difference is not significant.
The results indicate that the wraps did not sustain significant damage due to freeze-thaw cycling
under sustained load.
The square wrapped specimens had lower compressive strength compared to the round
specimens, even though the cross sectional area of the square prisms is higher than that of the
round cylinders. This is due to the reduced confinement provided by the wraps for square cross
sections and stress concentrations that develop at the corners. Wrapped square prisms always
failed by rupture of the wrap at a corner. A reduction of approximately 30% to 40% in the failure
strength was observed for the square wrapped specimens compared to the round wrapped
specimens. This loss of strength due to reduced confinement in square specimens is reasonably
accounted for by Restrepo and Devino’s (1996) model of confinement. Richart’s model of
confinement (1928) predicts the strength of round wrapped specimens reasonably well.
Compression strength of wrapped specimens is 1.4 to 2.6 times larger than the strength of
unwrapped specimens for square and round sections, respectively. Ductility of wrapped
specimens under compression is 4 to 9 times larger than that of unwrapped specimens for square
and round sections, respectively.
108

4.2 Accelerated Corrosion Test
Tests were conducted on twenty-four 152 mm x 305 mm concrete cylindrical specimens.
A water/cement ratio of 0.6 and 2% Cl- ion by weight of cement (intended to simulate chloride
contaminated columns) were used in the mix. Initially all specimens were partially submerged in
3% NaCl solution and subjected to electrically induced corrosion until cracks were visible on the
exterior surfaces. After the initial corrosion stage, specimens were wrapped with glass and
carbon FRP. Specimens were then placed in a tub and soaked in 3% NaCl solution for one hour
each day while the electrically induced accelerated corrosion continued for several weeks. Some
specimens were removed after 130 days and others after 190 days. The merit of using unbonded
wraps to minimize localized wrap strains near reinforcing bars was investigated. The ASTM G1
mass loss test was performed to determine the total corrosion of reinforcement in unwrapped and
wrapped specimens. The strength of FRP panels exposed to 190 wet-dry cycles with salt water
also was determined.
The mean corrosion depths for glass and carbon wraps are not significantly different for
either the bonded or unbonded conditions. Both wrap systems, glass and carbon, are equally
effective in reducing the corrosion rate. Wrapping reduced the corrosion depth by 46% – 59%
after 190 days of testing.
The mean corrosion depths for bonded and unbonded specimens are significantly
different after 190 days of accelerated corrosion. The bonded wrap is more effective in reducing
the rate of corrosion than the unbonded wrap. Corrosion depths for reinforcement in specimens
with unbonded wraps were approximately 20% more than those in specimens with bonded wraps
after 190 days of testing. This may be due to water seepage between the concrete and the plastic
sheet used to create the unbonded condition.
109

Wrap strains for bonded specimens with both types of wraps tend to level off with time.
One explanation could be that the stress concentration near the anodes in the bonded wraps is
more effective in containing the corrosion-induced crack and reducing the corrosion rate. The
slip of unbonded wraps and the resulting redistribution of strain along the entire wrap may be
less effective at containing the large corrosion-induced crack near the anodes.
4.3 Effect of Freeze-Thaw and Wet-Dry Cycles on FRP Panels The tensile properties of glass and carbon FRP panels exposed to 300 freeze-thaw cycles
and 190 wet-dry cycles with 3% NaCl solution were measured and compared to the properties of
unconditioned panels. The effective stiffness (modulus × thickness) of glass FRP is not affected
significantly by the freeze-thaw or wet-dry cycling. However, its ultimate strength per unit width
decreased by 21% due to freeze-thaw cycling and 18% due to wet-dry cycling. The ultimate
strain of glass FRP decreased by 20% due to both types of conditioning.
For carbon the test results indicated a 30% increase in the effective stiffness due to
freeze-thaw cycling and a 41% increase due to wet-dry cycling. The ultimate strength per unit
width was not significantly affected by either type of conditioning. The ultimate strain decreased
by 28% due to freeze-thaw cycling and 36% due to wet-dry cycling. For carbon, the increase in
stiffness after conditioning was surprising, and limited re-testing indicated that the results were
not reliable for the thin carbon panels. Better grip fixtures are recommended for testing thin
carbon FRP.
4.4 Behavior Under Impact and High Temperature
When supported on a concrete substrate, both glass and carbon FRP panels are not
significantly damaged by 16.5 kg head with a 75 mm radius when dropped from a height of
110

0.79 m. Damage to wraps from vandalism or minor vehicle impact should therefore not be
significant.
At temperature exceeding 150°C the epoxy in the wraps char and the wraps unravel. The
wraps are therefore not effective at very high temperatures.
4.5 Recommendation for Field Installation
It is evident from the experimental study conducted that both carbon and glass wrap
systems are equally resistant to freeze-thaw cycles and reduce the corrosion rate by about the
same rate. Therefore, three layers of glass wrap or two layers of carbon wrap may be used to
repair Michigan bridge columns. Reducing the number of layers may also be feasible, but it is
not possible to provide any recommendation about this without additional studies.
The preferred wrap system will most likely depend on the material and installation cost
rather than performance issues. However, it should be noted that many studies indicate strength
degradation of glass FRP in an alkaline and/or humid environment under elevated temperature.
Thus in regions with long periods of hot and humid conditions, carbon FRP may be preferable to
glass FRP.
It is also recommended that a non-destructive technique or coring be used every ten years
to monitor the condition of the concrete inside the wrap.
4.6 Repair Costs
The estimated cost for the conventional chip and patch repair technique that is currently
used by the MDOT is approximately $500-$725/m2 of repaired column surface. The estimated
111

112
cost of the glass and carbon wrap systems used in this research study as provided by the
respective suppliers is provided in Table 4.1.
Table 4.1 Estimated material and installation cost for Tyfo-S glass and MBrace carbon wrap systems
Wrap Type Material Cost /m2/layer
Installation Cost /m2/layer
No. of Layers
*Surface Prep./ m2
Total Cost/ m2
Glass $54 $54 3 $101 $425 Carbon $75 $54 2 $101 $360
* Estimated cost of surface preparation prior to wrap installation was provided by MDOT
The benefit of repairing corrosion-damaged columns with FRP wraps is dependent on the
life of conventional chip and patch repair and that of FRP repaired columns. Because of the lack
of long-term field experience with FRP wraps it is not possible to perform an effective cost-
benefit analysis at this time.

Chapter 5 Field Installation and Future Studies
5.1 Corrosion Monitoring of Field Columns
Six corrosion probes were installed on six corrosion damaged field columns in the
summer of 1999. These columns had considerable surface spalling and reinforcement was
exposed at several locations. Each column was also fitted with two pre-weighed #13 reinforcing
steel bars approximately 305 mm long to measure mass loss. The corrosion probes and the steel
bars were located at the same level of the existing column reinforcement steel and about two
meters above the roadway surface. The initial weights of the bars are given in Table 5.1. These
columns are located on Lansing Road in Lansing, Michigan under the I-96 overpass (Bridge ID
S09 and S10 of 23152)). Columns one through three are located on Pier 1 under the westbound
overpass (S09), while columns four through six are located on Pier 1 under the eastbound
overpass (S10). After superficially repairing the column surface spalls by patching (chloride was
added to the patch to match existing chloride content of the column), two columns were wrapped
with two layers of carbon fiber sheets, two were wrapped with three layers of glass fiber sheets
and two were left unwrapped as control columns. Column wrapping was done in July 1999.
The corrosion probes manufactured by Rohrback Cosasco Systems, Inc. (Santa Fe
Springs, California) are based on an electrical resistance measurement system. This system is
simple to install, directly measures the total corrosion, does not need regular measurements, is
smaller, easy to transport, and costs about $5,500 for six probes and the readout measurement
device. The manufacturer’s information for the probes are included in Appendix G.
113

Table 5.1 Initial weight of corrosion bars installed in field columns
Column No. Column 1 Glass wrapped
Column 2 Carbon wrapped
Column 3 Control
Bar No. 1 2 3 4 5 6
Bar Wt. (g) 252.09 276.14 270.70 263.80 263.58 271.13
Column No. Column 4 Control
Column 5 Glass wrapped
Column 6 Carbon wrapped
Bar No. 7 8 9 10 11 12
Bar Wt. (g) 270.76 270.70 275.87 270.26 270.23 275.85
Corrosion data was collected about twice a month. Due to the short duration since the
corrosion probes were installed, the data is not significantly different from the initial readings.
Corrosion monitoring is scheduled to continue for about 10 years. At that time, the reinforcing
bars installed to monitor mass loss will be cleaned and mass loss analysis will be conducted.
Figures 5.1 and 5.2 show a column condition before and after minor surface repairs,
respectively. Figure 5.3 shows a corrosion probe and pre-weighed reinforcing bars used for
monitoring mass loss. Figures 5.4 and 5.5 show the field installation of glass and carbon wraps,
respectively. Figure 5.6 shows columns after repairs were completed. The carbon wrapped
column (in the foreground) is yet to be painted while the glass wrapped column (middle one) has
been painted. Figures 5.7 and 5.8 show the finished installation.
Appendix H provides specifications for field installation as recommended by the wrap
manufacturers __ glass wrap system by Tyfo-S and carbon wrap system by Master Builders.
114

Figs. 5.1 Column condition before surface repairs
Figs. 5.2 Column condition after surface repairs
115

Fig. 5.3 Corrosion probe and reinforcing bars for monitoring mass loss
Fig. 5.4 Field installation of glass wrap to selected columns
116

Fig. 5.5 Field installation of carbon wrap to selected columns
Fig. 5.6 Completed installation of glass and carbon wraps (glass wrapped column in the background with top coat and final paint layers applied).
117

Fig. 5.7 Control (far left), carbon-wrapped (left) and glass-wrapped (right) columns under westbound overpass (S09)
Fig. 5.8 Control (far right), carbon-wrapped (right) and glass-wrapped (left) columns
under eastbound overpass (S10)
118

5.2 Results of Field Monitoring
Wrapped and unwrapped columns in the field have been monitored for 10 months using
corrosion probes. So far no significant corrosion activity has been detected.
Table 5.2 provides the reading collected from the corrosion probes using the portable
monitoring instrument (Model Ck3 manufactured by Rohrback Cosasco Systems, Inc). It is
apparent that some drift occurs in the readings. The accuracy of the readout appears to be ± 20.
Table 5.2 Dial readings for the corrosion probes installed in field columns
Date Column 1 Glass Wrapped
Column 2 Carbon Wrapped
Column 3 Unwrapped
Column 4 Unwrapped
Column 5 Carbon Wrapped
Column 6 Glass Wrapped
7/12/99 222 222 252 246 212 222 8/20/99 228 215 234 245 223 223 9/26/99 231 215 232 * 214 219 10/10/99 231 225 232 * 225 220 11/7/99 240 232 239 * 226 229 12/13/99 242 236 248 251 232 232 1/28/00 255 246 248 * 242 ** 2/15/00 251 ** 248 * 239 ** 5/20/00 242 239 240 * 230 229 6/25/00 222 220 228 * 210 215 7/10/00 222 218 224 238 210 212 * Probe not responding, ** keyhole to probe box was frozen and readout instrument could not be connected.
5.3 Calculation of Corrosion Rate
The corrosion rate for the concrete monitoring corrosion probes manufactured by
Rohrback Cosasco is calculated as follows:
Corrosion Rate (mils/year) = (Days) Time
Reading DialΔΔ x 0.365 x Span
The corrosion probe used in the field columns (Model 650-0-T50) has a span of 25 mils.
119

Note: Intentionally left blank
120

References
ACI (2000). “Guide for the Design and Construction of Externally Bonded FRP Systems for Strengthening Concrete Structures.” ACI Committee 440 R. Alampalli, S., O’Connor, J., and Yannotti, A. (1999). “Advancing Composites.” Civil Engineering Magazine, December A1-A7. Allen, M. L. (1995). “Probability of Corrosion Induced Cracking in Concrete.” Cement and Concrete Research, Vol.25, No. 6, 1179-1190. Almusallam, T. H., Al-Salloume, Y. A., and Alsayed, S. H. (2000). “Durability of Concrete Cylinders Wrapped with GFRP Sheets at Different Environmental Conditioning.” Seventh Annual International Conference on Composites Engineering, 27-28. Arya C. and Sa'id-Shawqi, Q. (1996). " Factors Influencing Electrochemical Removal of Chloride from Concrete.” Cement and Concrete Research, Vol. 26, No. 6, 851-860. ASTM, 1990. “Standard Practice for Preparing, Cleaning, and Evaluating Corrosion Test Specimens.” ASTM Designation: G 1-90 (Reapproved 1994), 9-15. Brockenbrough, R. L. and Gallagher, W. P. (1985). “Effect of Clamping Pressure and Joint Geometry on Corrosion Induced Bowing and Distortion of Bolted Joints in Weathering Steel.” Journal of Construction Steel Research, 213-238.
Chajes, Mertz, Thomson, and Farschman (1994). “Durability of Composite Material Reinforcement.” Proceedings, Third Material Engineering Conference, ASCE, 598-605.
De Wilde, W.P. (1988). Proceedings of the International Conference on Computer Aided Design in Composite Material Technology. Computational Mechanics Publication, Springer-Verlag Berlin Heidelberg. Debaiky, A. and Green, G., and Hope, B., (1999). “FRP Rehabilitation of Corrosion-Damaged Concrete Structures.” Proceedings of the 44th International SAMPE Symposium, May 23-27. Demers, M. et al. (1996). “The Strengthening of Structural Concrete with an Aramid Woven fiber/Epoxy Resin Composites”, Proceedings of the 2nd International Conference, ACMBS, Montreal, PQ, Canada, pp.435-442. Detwiler, R., Kjellsen K., and Gjorv, O. (1991). “ Resistance to Chloride Intrusion of Concrete Cured at Different Temperatures.” ACI Materials Journal, Vol. 88, 19-24.
121

Fontana, M. G. (1986). Corrosion Engineering. McGraw-Hill, New York. Fyfe Co. LLC (2000). “Tyfo SEH-51 Composite using Tyfo S Epoxy.” San Diego, California. Fyfe, E. R., Watson, R. J. and Watson, S. C. (1996). “Long-Term Durability of Composites Based on Field Performance and Laboratory Testing.” Proceedings of the ICCI’96 Conference, Tucson, Arizona, 982-995. Gomez, J., and Casto, B. (1996). “Freeze Thaw Durability of Composite Materials.” Proceedings of the ICCI’96 Conference, Tucson, Arizona, 947-955. Guttman, H. and Sereda, P.J. (1968). “ Measurement of Atmospheric Factors Affecting the Corrosion of Metals.” Metal Corrosion in the Atmosphere, ASTM STP 435, ASTM. Halstead, O’Connor, Alampalli, and Minser. (2000). “Evaluating FRP Wrap with NDT Methods.” Proceedings of the NDT Conference. Hyun, A. (1995). “Fire Endurance and Hose Stream Tests of Three 48” high by 56” Wide Non-Symmetrical Walls.” Technical Report, Inchape Testing Services of Warnock Hersey, Inc., Pittsburgh, CA. Kenneth, W. N. and Labossiere, P. “Fiber Composite Sheets in Cold Climate Rehab.” Concrete International, V. 20, No. 6, June 1998, pp. 22-24. Kestner, Harries, Pessiki, Sause, and Ricles (1997). “Rehabilitation of Reinforced Concrete Columns using Fiber Reinforced Polymer Composite Jackets.” Report No. 97-07. Advanced Technology for Large Structural Systems, Lehigh University, Bethlehem, PA. Lee, C. (1998). “Accelerated Corrosion and Repair of Reinforced Concrete Columns Using CFRP Sheets”, M. Eng. Thesis, Department of Civil Eng., University of Toronto, Toronto, ON, Canada, 106 p. Lopez-Anido, R. (1993). “Influence of Temperature on the Service Life of Rebars.” Cement and Concrete Research, Vol.23, No. 5, 1130-1190. Malek, A. and Saadatmanesh H. (1996). “Physical and Mechanical Properties of Typical Fibers and Resins.” Proceedings of the ICCI’96 Conference, Tucson, Arizona, 68-79. Mallick, P. K. (1993). Fiber Reinforced Composites–Materials, Manufacturing and Design. Second Edition, Marcel Dekker Inc., New York, 326-327. Mander, J. B., Priestley, M. J. N., and Park R. (1988). “Theoretical Stress-Strain Model for Confined Concrete.” Journal of Structural Engineering, ACSE, Vol. 114, No. 8, 1804-1826.
122

Martin, H. and Schieles, P. (1969). “ The Influence of Time and Environmental Condition on Corrosion of Deformed Bars in Cracked Concrete.” Preliminary Report of RILEM International Symposium on Durability of Concrete, Vol. II, Prague. Martin, H. and Schieles, P. (1969). “The Influence of Cracks on Corrosion of Steel in Concrete.” Preliminary Report of RILEM International Symposium on Durability of Concrete, Vol. II, Prague. Master Builders, Inc. (1998). “MBrace Composite Strengthening System Engineering Design Guidelines.” Second Edition, Cleveland, Ohio. McCrum, R. (1994). MDOT office memorandum to Sonny Jadun, June 22. Mehta, P., and Monteiro, J. (1993). Concrete, structure, properties, and materials. Second Edition, Prentice-Hall, Englewood Cliffs, 160-164. Meier, U. (1996). “Composites for structural repair and retrofitting.” Proceedings, ICCI’96 Conference, Tucson, Arizona, 1202-1216. Michniewicz, J. (1996). “Repair and Rehabilitation of Reinforced Concrete Columns with Fiber-Reinforced Plastics”, M. Eng. Thesis, Department of Civil Eng., University of Toronto, Toronto, ON, Canada, 97 p. Murphy, K., Zhang, S., and Karbhari, V. M. (1999). “Effect of Concrete Based Alkaline Solutions on Short Term Response of Composites.” Proceeding of the 44th International SAMPE Symposium, May 23-27. Neter, J., Wasserman, W., and Whitmore, G.A. (1992). Applied Statistics, 4th Edition, Allyn and Bacon, Boston, MA. Nilson A. and Winter G. (1991). Design of Concrete Structures. Eleventh Edition, McGraw-Hill, New York, New York. Pantazopolou et al. (1996). “Repair of Corrosion-Damaged Concrete Using ACM”, Proceedings of the 2nd International Conference, ACMBE, Montreal, PQ, Canada, pp.287-298. Picher, F., Rochette, P., and Labossiere, P. (1996). “Confinement of Concrete Cylinders with CFRP.” Proceedings of the ICCI’96 Conference, Tucson, Arizona, 829-841. Pigeon, M. and Pleau, R.(1998). Durability of Concrete in Cold Climates. Modern Concrete Technology Series. E & FN Spon, London, UK, 1-5. Restrepol, J. and DeVino, B. (1996). “Enhancement of the Axial Load Carrying Capacity of Reinforced Concrete Columns by means Fiberglass Epoxy-Jackets.” Proceedings of Advanced Composite Materials in Bridges and Structures II, Montreal, August, 547-553.
123

124
Richart F. E., Brandtzaeg A, and Brown R. L. (1928). “ A Study of the Failure of Concrete under Combined Compressive Stresses.” University of ILL. Eng Exp. Stn. Bull 185. Rivera, J. and Karbhari, V. (1999). Effects of Extended Freeze-Thaw exposure on Composite Wrapped Concrete Cylinders.” Proceedings of the 44th SAMPE Symposium, May 23-27. Rochette, P. and Labossiere, P. (1996). “ A Plasticity Approach for Concrete Columns Confined with Composite Materials”. Proceedings of the 2nd International Conference, ACMBS, Montreal, PQ, Canada, pp.359-366. Sen, R., Mariscal, D., and Shahaway M. (1993). “Durability of Fiberglass Pretensioned Beams.” ACI Structural Journal, Vol. 90, 525-533. Sen, R., Mariscal, D., and Shahaway M. (1993). “Investigations of S2 Glass Epoxy Strands in Concrete.” Proceedings of the FRP Components Structures, International Symposium, 15-33. Steckel, G. (2000). Personal Communication, The Aerospace Corporation, El Segundo, CA. Tarricone P. (1995). “Composite Sketch.” Civil Engineering Magazine, May, 52-55. Toutanji, H. and Balaguru, P. (1998). “Durability Characteristics of Concrete Columns Wrapped with FRP Tow Sheets.” Journal of Materials in Civil Engineering, February, 52-57. Wrobel, P. (1994). “Laboratory Measurements of Corrosion Activity of Steel Reinforcement in Concrete using Simple Equipment.” Cement, Concrete, and Aggregates, CCAGPD, Vol. 16, No. 2, Dec. 1994, 100-103. Yamato, T., Emoto, Y., and Soeda, M. (1987). "Freezing and Thawing Resistance of Concrete Containing Chloride." Concrete Durability, ACI SP100-50, Vol. 1, 901-917.

Appendix A Aerospace Corporation’s FRP Panel Durability Data
Fyfe Company E-Glass/Epoxy
SEH 51/Tyfo S Epoxy
ENVIRONMENTAL EXPOSURE
YOUNG'S MODULUS,
msi
TENSILE STRENGTH,
ksi
FAILURE STRAIN,
%
SHORT BEAM SHEAR
STRENGTH, ksi
GLASS TRANSITION
TEMP., oC
HARDNESS, SHORE D
WEIGHT CHANGE,
%
CONTROL 3.96 + 0.13 80.5 + 5.1 2.10 + 0.18 5.9 + 0.5 65, 64, 68, 68 83 + 3
100% HUMIDITY/38oC
1000 Hour 4.04 + 0.13 71.6 + 2.8 1.82 + 0.08 6.0 + 0.4 72 83 + 2 0.56
3000 Hour 3.94 + 0.10 67.9 + 1.9 1.77 + 0.05 5.8 + 0.3 73 84 + 2 0.82
10,000 Hour 3.93 + 0.18 51.4 + 2.1 1.31 + 0.08 4.5 + 0.3 73 82 + 2 1.09
SALT WATER
1000 Hour 4.03 + 0.09 80.8 + 2.2 2.07 + 0.06 6.0 + 0.9 65 85 + 2 0.46
3000 Hour 4.02 + 0.04 81.7 + 1.2 2.09 + 0.03 5.6 + 0.2 63 84 + 3 0.57
10,000 Hour 4.09 + 0.07 66.0 + 1.9 1.64 + 0.04 4.6 + 0.2 63 82 + 2 0.91
pH 9.5 CaCO3 SOLUTION
1000 Hour 3.85 + 0.03 83.2 + 2.8 2.25 + 0.11 5.9 + 0.3 65 83 + 2 0.36
3000 Hour 4.00 + 0.13 80.8 + 4.1 2.11 + 0.11 6.0 + 0.3 61 85 + 2 0.53
10,000 Hour 3.88 + 0.06 62.4 + 2.5 1.63 + 0.08 5.1 + 0.3 64 84 + 2 0.88
DRY HEAT AT 60oC
1000 Hour 3.89 + 0.06 82.0 + 1.7 2.17 + 0.08 6.4 + 0.4 95 85 + 2 -0.33
3000 Hour 4.05 + 0.06 84.8 + 2.4 2.16 + 0.09 6.7 + 0.8 87 85 + 2 -0.44
20 FREEZE/THAW CYCLES
4.02 + 0.06 78.0 + 2.1 2.00 + 0.06 5.2 + 0.3 68 82 + 3 0.59
UV/CONDENSATION, 100 CYCLES
4.03 + 0.08 84.0 + 3.1 2.18 + 0.11 6.5 + 0.2 86 83 + 3 -0.42
DIESEL FUEL, 4 Hour
4.01 + 0.06 83.4 + 2.6 2.16 + 0.06 5.9 + 0.2 67 81 + 2
125

Master Builders "MBRACE" Carbon/Epoxy CF-130/MBI Epoxy
ENVIRONMENTAL EXPOSURE
YOUNG'S MODULUS
, msi
TENSILE STRENGTH,
ksi
FAILURE STRAIN,
%
SHORT BEAM SHEAR
STRENGTH, ksi
GLASS TRANSITION
TEMP., oC
HARDNESS, SHORE D
WEIGHT CHANGE, %
(2 PLY/6 PLY)
CONTROL 32.8 + 1.8 636 + 27 1.75 + 0.09 7.8 + 0.3 67, 67, 67, 70 92 + 2
100% HUMIDITY/38oC
1000 Hour 34.0 + 1.4 591 + 25 1.59 + 0.08 7.6 + 0.1 75 91 + 1 1.13/0.95
3000 Hour 33.2 + 0.4 540 + 17 1.51 + 0.06 7.2 + 0.1 74 92 + 1 1.41/1.03
10,000 Hour 33.1 + 0.8 596 + 22 1.67 + 0.07 6.9 + 0.2 70 93 + 2 1.51/1.46
SALT WATER
1000 Hour 33.6 + 0.5 619 + 25 1.70 + 0.05 7.5 + 0.2 65 90 + 3 1.14/0.65
3000 Hour 33.9 + 1.1 623 + 23 1.74 + 0.07 7.6 + 0.4 65 91 + 2 1.24/0.88
10,000 Hour 32.1 + 1.6 610 + 23 1.75 + 0.08 6.8 + 0.1 63 91 + 3 1.48/1.37
pH 9.5 CaCO3 SOLUTION
1000 Hour 32.9 + 1.3 597 + 27 1.70 + 0.11 7.6 + 0.1 65 92 + 1 1.24/0.44
3000 Hour 31.8 + 0.8 585 + 35 1.70 + 0.09 7.2 + 0.6 67 91 + 2 1.27/1.02
10,000 Hour 33.1 + 1.5 615 + 39 1.70 + 0.12 6.7 + 0.2 62 92 + 1 1.31/0.78
DRY HEAT AT 60oC
1000 Hour 33.4 + 1.2 637 + 23 1.73 + 0.08 9.5 + 0.2 84 94 + 1 -0.47/-0.20
3000 Hour 32.6 + 0.9 582 + 12 1.67 + 0.05 8.6 + 0.4 85 93 + 1 - /-0.33
20 FREEZE/THAW CYCLES
33.3 + 1.7 561 + 29 1.57 + 0.06 7.5 + 0.1 72 91 + 1 1.32/0.97
UV/CONDENSATION, 100 CYCLES
33.6 + 1.2 644 + 37 1.76 + 0.09 8.4 + 0.3 79 91 + 2 -0.63/-0.33
DIESEL FUEL, 4 Hour
34.1 + 1.5 589 + 9 1.61 + 0.08 8.2 + 0.1 66 93 + 3 0.02/0.00
126

127
Appendix B Measured FRP Panel Properties
FRP panel properties were measured and reported by the Composite Materials and Structures Center at MSU. Carbon FRP panels were made of two layers. Unconditioned glass FRP panels were made of four layers, while conditioned glass FRP panels were made of three layers. Different sets of unconditioned specimens were tested for modulus and fracture properties.
Table B.1 Modulus of unconditioned FRP panels Carbon Panels
Width (mm)
Thickness (mm)
Modulus (MPa)
Eff. Stiffness Per Layer (N/mm)
Sample 1 19.06 1.283 54993 35278 Sample 2 19.08 1.219 46644 28430 Sample 3 19.10 1.283 58995 37845 Sample 4 19.11 1.194 55407 33078 Sample 5 19.13 1.270 49335 31328 Average 19.10 1.250 53061 33192 Std. Dev. 0.025 0.041 4968 3612
Glass Panels
Width (mm)
Thickness (mm)
Modulus (MPa)
Eff. Stiffness Per Layer (N/mm)
Sample 1 19.06 4.788 22356 26760 Sample 2 19.10 5.055 19251 24328 Sample 3 19.13 4.877 27600 33651 Sample 4 19.11 4.953 24288 30075 Sample 5 19.16 4.788 19251 23043 Sample 6 19.09 4.826 23598 28471 Sample 7 19.15 5.042 17802 22439 Average 19.12 4.905 22011 26967 Std. Dev. 0.036 0.114 3450 4072
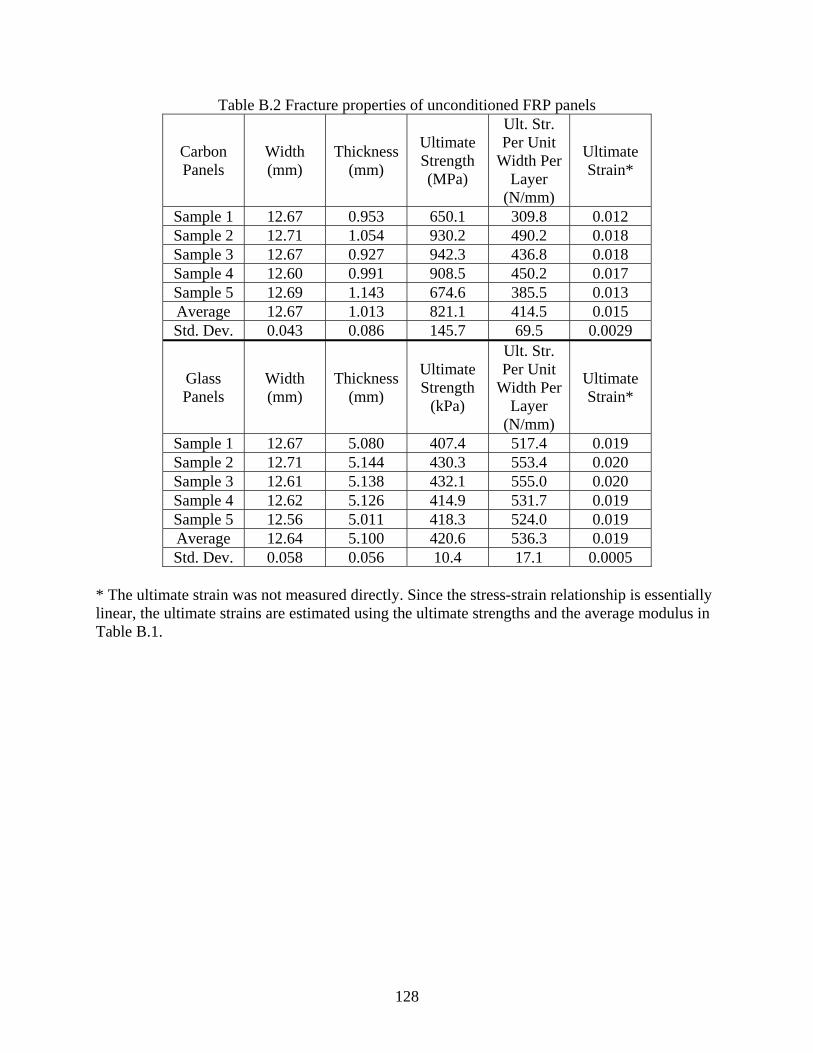
Table B.2 Fracture properties of unconditioned FRP panels
Carbon Panels
Width (mm)
Thickness(mm)
Ultimate Strength (MPa)
Ult. Str. Per Unit
Width Per Layer
(N/mm)
Ultimate Strain*
Sample 1 12.67 0.953 650.1 309.8 0.012 Sample 2 12.71 1.054 930.2 490.2 0.018 Sample 3 12.67 0.927 942.3 436.8 0.018 Sample 4 12.60 0.991 908.5 450.2 0.017 Sample 5 12.69 1.143 674.6 385.5 0.013 Average 12.67 1.013 821.1 414.5 0.015 Std. Dev. 0.043 0.086 145.7 69.5 0.0029
Glass Panels
Width (mm)
Thickness(mm)
Ultimate Strength
(kPa)
Ult. Str. Per Unit
Width Per Layer
(N/mm)
Ultimate Strain*
Sample 1 12.67 5.080 407.4 517.4 0.019 Sample 2 12.71 5.144 430.3 553.4 0.020 Sample 3 12.61 5.138 432.1 555.0 0.020 Sample 4 12.62 5.126 414.9 531.7 0.019 Sample 5 12.56 5.011 418.3 524.0 0.019 Average 12.64 5.100 420.6 536.3 0.019 Std. Dev. 0.058 0.056 10.4 17.1 0.0005
* The ultimate strain was not measured directly. Since the stress-strain relationship is essentially linear, the ultimate strains are estimated using the ultimate strengths and the average modulus in Table B.1.
128

Table B.3 Properties of FRP panels subjected to 300 freeze-thaw cycles
Carbon Panels
Width (mm)
Thickness (mm)
Modulus (MPa)
Effective Stiffness Per Layer (N/mm)
Ult. Str. Per Unit
Width Per Layer
(N/mm)
Ultimate Strain
Sample 1 12.61 0.986 90500 44595 448.8 0.010 Sample 2 12.57 1.113 78094 43441 416.1 0.010 Sample 3 12.58 1.092 78481 42858 484.6 0.011 Sample 4 12.53 1.161 76431 44360 440.5 0.010 Sample 5 12.57 1.135 71567 40600 450.0 0.011 Average 12.57 1.097 79014 43171 448.0 0.010 Std. Dev. 0.03 0.067 6986 1598 24.6 0.0006
Glass Panels
Width (mm)
Thickness (mm)
Modulus (MPa)
Effective Stiffness Per Layer (N/mm)
Ult. Str. Per Unit
Width Per Layer
(N/mm)
Ultimate Strain
Sample 1 12.70 3.411 22818 25946 421.3 0.017 Sample 2 12.78 3.462 22101 25504 409.4 0.016 Sample 3 12.63 3.348 23764 26518 434.4 0.017 Sample 4 12.77 3.289 24930 27334 451.9 0.018 Sample 5 12.78 3.251 24164 26187 393.3 0.015 Sample 6 12.61 3.048 27110 27544 428.9 0.015 Average 12.71 3.302 24148 26506 423.6 0.016 Std. Dev. 0.08 0.146 1760 798 22.7 0.0012
129

130
Table B.4 Properties of FRP panels subjected to 190 wet-dry cycles
Carbon Panels
Width (mm)
Thickness (mm)
Modulus (MPa)
Effective Stiffness Per Layer (N/mm)
Ult. Str. Per Unit
Width Per Layer
(N/mm)
Ultimate Strain
Sample 1 13.30 1.003 103155 51748 410.0 0.008 Sample 2 13.20 1.346 69228 46597 417.9 0.009 Sample 3 13.20 1.232 78246 48196 433.3 0.009 Sample 4 13.21 1.181 76673 45279 369.4 0.008 Sample 5 12.97 1.176 78239 46005 436.7 0.010 Sample 6 12.34 0.884 97049 42892 406.3 0.009 Average 13.04 1.137 83765 46786 412.7 0.009 Std. Dev. 0.36 0.166 13229 2990 27.1 0.0007
Glass Panels
Width (mm)
Thickness (mm)
Modulus (MPa)
Effective Stiffness Per Layer (N/mm)
Ult. Str. Per Unit
Width Per Layer
(N/mm)
Ultimate Strain
Sample 1 12.53 2.888 28600 27533 426.6 0.014 Sample 2 12.62 2.710 29918 27028 463.4 0.017 Sample 3 12.53 2.908 28062 27205 457.7 0.017 Sample 4 12.71 2.743 32306 29540 411.6 0.014 Sample 5 12.61 2.739 30043 27428 427.8 0.016 Sample 6 12.58 2.764 28297 26066 432.7 0.016 Average 12.60 2.792 29538 27467 438.6 0.016 Std. Dev. 0.07 0.084 1591 1143 21.6 0.0012

Appendix C Calculation Details
C.1 Strain in Column Wrap After 10 years
1. Geometric and Material Properties
Column diameter, D = 91.44 cm Column area, Ac = 6563.60 cm2 Initial volume of col. = Ac (100 cm) = 656360 cm3
Core diameter = dc = 80.01 cm Longitudinal steel Ratio, ρ = 2% Steel area, As = ρ Ac = 131.27 cm2
Tie steel diameter, d = 1.27 cm
4
2dπTie steel cross sectional area: Asp = = 1.266 cm2
Tie Spacing = 30.48 cm Volume of rust / volume of corroded steel = 6
2. Rust Volume
Corrosion rate for steel rebar (deformed) = 5% Corroded steel area, Acrd s = 0.05 As = 6.56 cm2 Rust area, Arust = 6 Acrd s = 39.38 cm2 Rust Volume, Vrust = Arust (100 cm) = 3938 cm3 Corroded rate for ties (smooth steel) = 20% Corroded tie steel area, Acrd,tie = 0.2 Asp = 0.2532 cm2 Rust area spiral steel, Arust,tie = 6Acrd,tie = 6 (0.2532) = 1.519 cm2 Rust volume tie steel, Vrust,tie = Arust,tie (length of tie) = 1.519 π dc 100/30.48 = 1252.0 cm3
3. Strain in Wrap
Change of volume in vertical steel: Chg. Vst = 66.3281)3938(65
65
==rustV cm3
Change of volume in tie steel: Chg. Vsp = 33.1043)1252(65
65
==−tierustV cm3
Final column volume: Final V = Initial column volume +Chg. Vst +Chg.Vsp = 656360 + 3281.66 + 1043.33 = 660684.99 cm3
Final column diameter: 1004
)( 2final
final
DV
π=
=finalD 91.74 cm
Strain generated in wrap: %327.≈−
=initial
initialfinal
DDD
Strain
131

C.2 Confining Pressure and Strain in Steel Jacket
Confining Pressure
From mechanics of thin walled cylinders, the confining pressure can be determined to be
equal to:
fr = 2 (ft t n) / D = 2 (E εt t n) / D
D
For glass FRP,
fr = 2 (22011 x 0.00531 x 0.1227 x 3) / 15.24 = 5.645 MPa
where:
t = the thickness of the wrap per layer = 0.1227 cm ft = the circumferential stress of wrap n = number of wrap layers = 3 D = the dia. of the concrete cylindrical column = 15.24 cm E = modulus of elasticity of the wrap (glass/epoxy) = 22011 MPa εt = wrap strain = 0.531
Strain in Steel Jacket
fr D = 2 fst tst
fst = (fr D) / (2 tst )
εst = fst / E st = (fr D) / (2 tst E st )
= (5.645 x 15.24) / (2 x 0.477 x 200100) = 0.045%
132

where
fr = the confining pressure generating the strain in the jacket = 5.645 MPa d = diameter of steel jacket = 15.24 cm fst = stress in steel jacket E st = modulus of elasticity of steel jacket = 200100 MPa tst = thickness of steel jacket =0.477 cm εst = strain in steel jacket
133

Appendix D Specimen, Bar and Gage Numbering
Table D.1 Specimen and gage numbering for freeze-thaw test
Shape Wrap Cycle123456789
1011121314151617181920212223242526272829303132
Round Plain 300 17, 18, 19 -Round Glass 150 20, 21, 22 -Square Glass 150 23, 34, 25 -Round Carbon 150 26, 27, 28 -Square Carbon 150 29, 30, 31 -Round Plain 150 32, 33, 34 -Round Glass 0 3, 35, 36, 37, 38, 39 -Square Glass 0 7, 40, 41, 42, 43, 44 -Round Carbon 0 11, 45, 46, 47, 48, 49 -Square Carbon 0 15, 50, 51, 52, 53, 54 -Round Plain 0 55, 56, 57, 58, 59, 60 -
Squ
are
300 13
300 14
0 15
300 16
Rou
nd
Car
bon
300 9
300 10
0 11
300 12
Squ
are
300 5
300 6
0 7
300 8
Rou
nd
Gla
ss
300 1
300 2
0 3
300 4
Freeze ThawSpecimen Type Specimen Number Gage Number
134

Table D.2 Specimen, bar and gage numbering for accelerated corrosion test Specimen Type Specimen Number Bar Number† Gage Number Wrap Bonded
9
Gla
ss
Yes 1 1 11 2 17 Yes 2 3 19 4 25 No 3 5* 27 6* 42 No 4 7 44 8 45 Yes 5 9 47 10 50 No 6 11 52 12 57 Yes 7 13* 59 14* 62 No 8 15 64 16 82 Yes 9 - 84 - 86 Yes 10 - 88 -
Car
bon
No 11 22 17* 24 18* 29 Yes 12 19 31 20 33 Yes 13 21* 35 22* 54 No 14 23 56 24 70 Yes 15 25 72 26 77 Yes 16 27 79 28 90 No 17 29 92 30 93 No 18 31 95 32
Pla
in
- 19 2 - 4 - 5 - 20 - 7 -
13 - 21 - 15 - 38 - 22 - 40 - 66 - 23 - 68 - 73 - 24 - 75 -
† Cathodes were also numbered * Gage located on the anode-others are located between an anode and cathode
135

Appendix E Concrete Mix Ratios and 28-Day Strength
Test
Material Weights (kg/m3) Pit No. W/C Ratio
Average 28-Day Strength (MPa)
Fine Agg. (Oven Dry)
Coarse Agg. (Oven
Dry) Water NaCl Fine
Agg. Coarse Agg.
Freeze-Thaw 755.68 1111.54 161.0 11 19-
46 95-5 0.4 37.70
Accel. Corrosion 607.16 1111.54 214.4
6 11 19-46 95-5 0.6 20.35
136


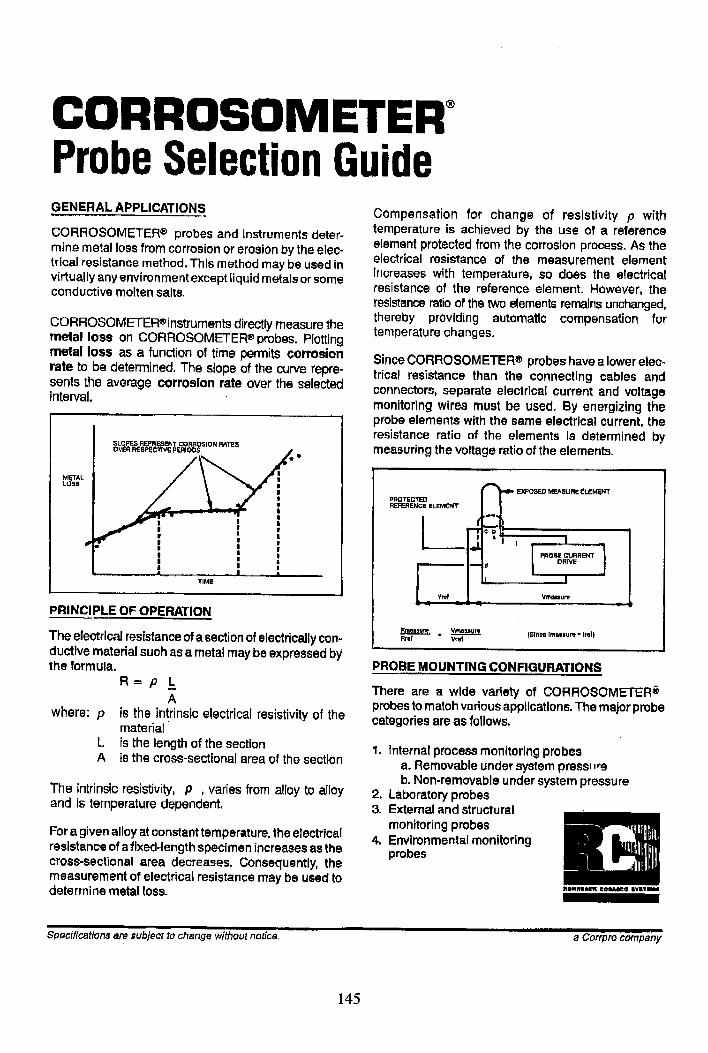

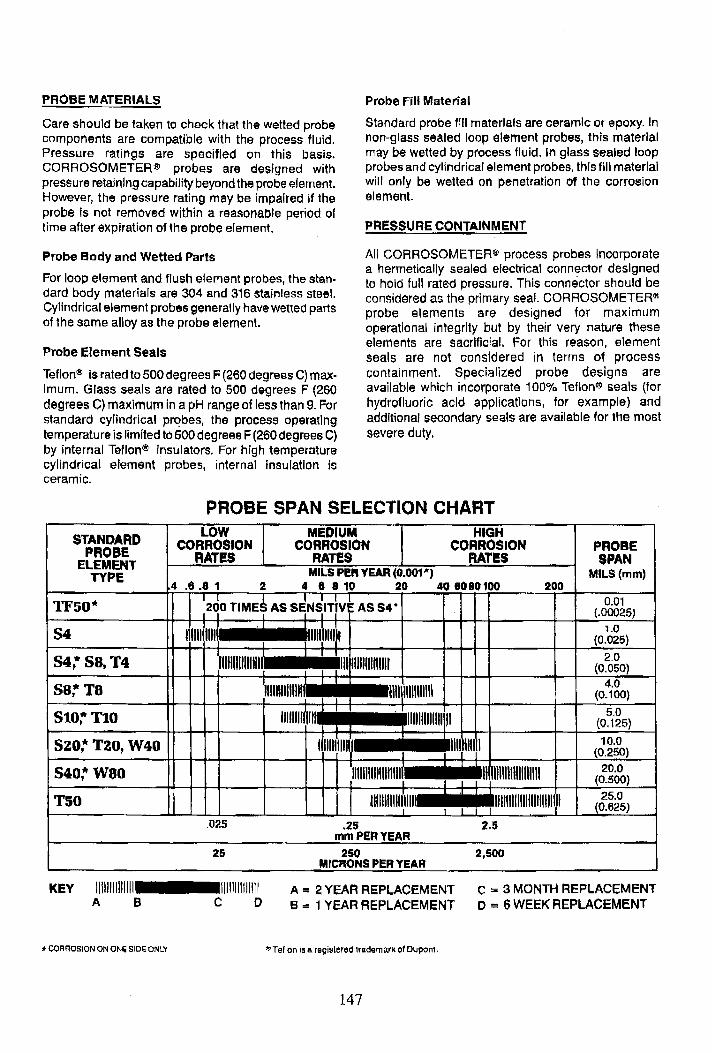


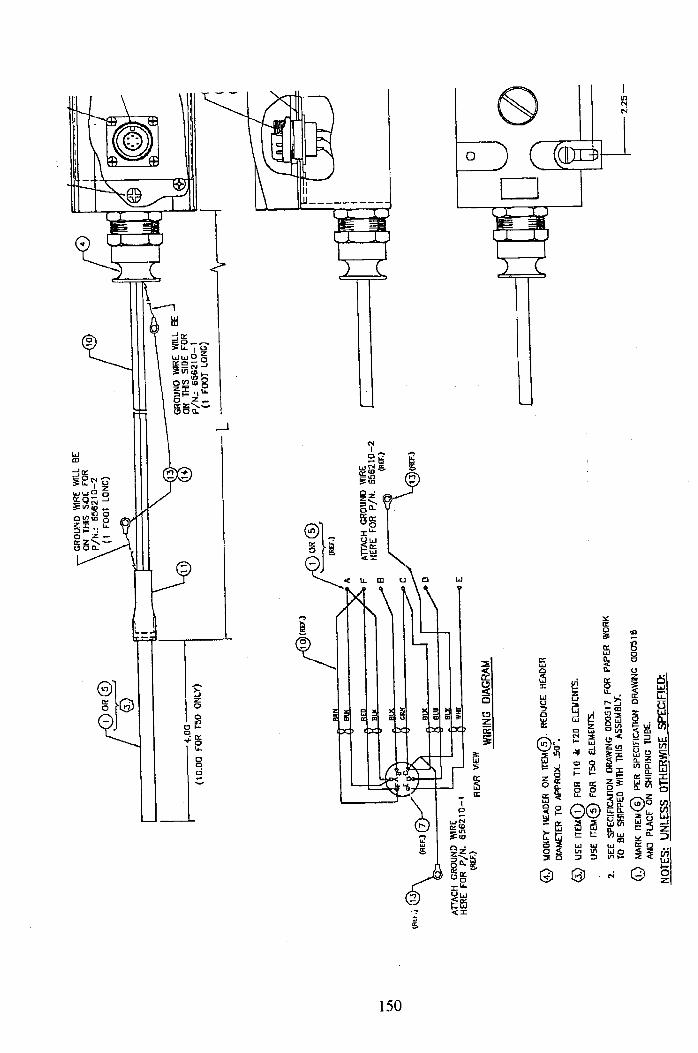

Appendix H Field Installation of Fiber Reinforced Plastic (FRP) Wraps
on Concrete Columns
Materials.-The following is a list of material required for each type of composite system:
1. TYFO SHE-51 composite system (glass): Vendor: FYFE Co.
6044 Cornerstone Court West, Suite C San Diego, CA 92121-4730 Tel: 619-642-0694 Local Rep.: Kurt Baron Tel: 847-706-9230
Fabric: Tyfo SEH-51 Epoxy: Tyfo-S, parts A & B
Top coat: Tyfo-WS, parts A&B Paint: Tyfo A (acrylic), or Tyfo U (polyurethane). Color: Concrete gray
2. MBrace composite system (carbon): Vendor: Master Builders, Inc.
23700 Chagrin Boulevard Cleveland, OH 44122 Tel: 800-MBT-9990 Local Rep.: Brad Costello Tel: 248-683-3554
Fabric: MBrace CF130 Primer: MBrace Primer, parts A&B
Saturant: Mbrace Saturant, parts A&B Filler: Mbrace Putty, parts A&B Top Coat: Mbrace Top Coat. Color: Concrete gray
Construction Methods.- Do not apply when ambient temperatures are lower than 4°C. Do not apply to wet surface or when rainfall is anticipated. Do not apply when dew point is within 3°C of the concrete surface temperature. Do not apply when humidity is 90% or higher. Manufacturer’s representative shall be on site for initial placement. Directions of the manufacturer’s representative shall be followed.
151

1. TYFO SEH composite system:
A. Remove loose concrete from the column surface and fill all voids to a smooth surface using Type S-F or Type S-M patching mixture, depending on the depth of the patch. The area of the patch shall be blown out with oil-free compressed air. The cleaned area for patching shall be flushed out with clean water under pressure immediately prior to application of the patching mixture. Forming methods used to retain the patching mixture shall not leave holes in the concrete surface. The patch shall cure for at least three days prior to application of wrap. Uneven surfaces, protrusions, and sharp edges shall be ground smooth. Dust from surface grinding shall be removed by using an oil-free air blower or other suitable means.
B. Pre-cut desired number of layers of fabric to a length exceeding the column perimeter by at least 150 mm. Off site labor shall be used where possible. An overlap of 150 mm shall be provided in the fiber direction when terminating the wrap.
C. Round or bevel corners by grinding to a radius of at least 20 mm.
D. The concrete surface shall be free of any moisture at the time of application.
E. Mix parts A and B of Tyfo-S epoxy at a ratio of 100:42 by volume (or 100:34.5 by weight) with a tolerance of 10%. Stir with a mechanical mixer, typically 5 minutes at 400 to 600 rpm until uniformly blended. Pot life is 3 hours at 20°C and 45 minutes at 38°C.
F. Apply one coat of Tyfo-S epoxy by brush or roller to prime the surface. Volume to be applied may vary depending on the porosity of the concrete surface. Wait 2 to 4 hours and then apply wrap (as described below) while primer is still tacky.
G. Tyfo-S epoxy shall be applied to TYFO fabric as follows: (1) Place dry fabric sheets in a saturation bath and add epoxy. Work
epoxy into fabric using gloved hands, a paint roller, or similar tool. Alternatively, an automatic saturating machine may be used.
(2) After the fabric has been completely saturated (both sides), remove excess epoxy by squeegying it out with a plastic trowel or by blotting the excess resin with the next dry fabric to be saturated.
(3) Use a PVC pipe to spool the saturated fabric prior to wrapping column.
H. The fabric shall be placed on the column entirely by hand assuring a smooth, uniform, mat finish. The (white) glass fibers shall be oriented horizontally. The (yellow) Kevlar fibers will then be oriented vertically. Pull the layer so that it is taut and free of bubbles. A lap length of at least 150 mm is required in the fiber longitudinal direction when terminating the layer.
I. Apply additional layers while the wrapped column surface is still tacky to the touch, ensuring that overlaps are staggered.
152

J. Mix parts A and B of Tyfo-WS epoxy at ratio of 100:42 by volume (or 100:34.5 by weight) with a tolerance of 10%.
K. Apply final coat of Tyfo-WS top coat with a minimum thickness of 0.4 mm. Epoxy shall be tacky to touch before final coat is applied.
L. The system shall be protected from damage, debris, and moisture during the initial curing period of 24 hours. Final curing is completed in 72 hours.
M. Apply finish of two coats of Tyfo A or Tyfo U paint with a minimum thickness of 0.1 mm per coat.
2. MBrace composite system A. Remove loose concrete from the column surface and fill all voids to a smooth surface using
Type S-F or Type S-M patching mixture, depending on the depth of the patch. The area of the patch shall be blown out with oil-free compressed air. The cleaned area for patching shall be flushed out with clean water under pressure immediately prior to application of the patching mixture. Forming methods used to retain the patching mixture shall not leave holes in the concrete surface. Uneven surfaces to receive FRP shall be filled with Type S-F mixture or other approved material. Surface irregularities must be rounded and smoothed to less than 1 mm using a grinder. Dust from surface grinding shall be removed by using an oil free air blower or other suitable means.
B. Pre-cut desired number of layers of fabric to a length exceeding the column perimeter by at least 100 mm. Off site labor shall be used where possible. An overlap of 100 mm shall be provided in the fiber direction when terminating the wrap. The length of the carbon sheet should preferably be less than 3 m for manageability.
C. Round or bevel corners by grinding to a radius of at least 13 mm.
D. The concrete surface shall be free of any moisture at the time of application.
E. Mix parts A and B of the primer at a ratio of 3:1 by volume (or 100:30 by weight). Stir with a mechanical mixer for at least 3 minutes at 400 to 600 rpm until uniformly blended. Pot life of the epoxy is approximately one-half to one hour after mixing.
F. Prime the concrete surface with the primer using a brush or a roller at a rate of 0.25 to 0.4 kg/m2. Volume to be applied may vary depending on the porosity of the concrete surface.
G. Mix parts A and B of the filler at a ratio of 3:1 by volume (or 100:30 by weight).
H. Apply filler to primed surface preferably within 1 or 2 days of, and no more than one week after, applying the primer. The filler may be applied immediately after applying the primer.
153
154
Applying the filler is optional.
I. Wait 2 to 4 hours before mixing and applying the saturant. The surface must be tacky to touch when applying the saturant, otherwise it must be roughened using sandpaper. If sandpaper is used, then the surface shall be cleaned using an air blower before applying the saturant.
J. Mix parts A and B of the saturant at a ratio of 3:1 by volume (or 100:34 by weight). Pot life of the saturant is approximately one-half to one hour.
K. Apply one coat of the saturant to primed surface using a medium nap (9.5 mm) roller at a rate of 0.25 to 0.4 kg/m2.
L. Place carbon sheet on a flat horizontal surface so that the backing paper is on top, smooth down by hand and peel away backing paper, and then wrap the sheet around the column. The surface that originally contained the backing paper shall be placed against the column and the fibers shall be oriented horizontally (i.e., the corners containing the obtuse angles of the diamond stitch pattern shall be aligned horizontally).
M. Squeeze the surface of adhered carbon sheet in the fiber direction in order to impregnate the saturant into the sheet. Remove excess epoxy by squeegying it out with a plastic trowel (without sharp edges) and roll out bubbles.
N. Apply additional saturant over the bonded carbon sheet at the overlap.
O. Wait a minimum of 30 minutes and then roll on an overcoat of saturant. (This is done for each layer.)
P. Repeat saturant mixing and rolling for consecutive carbon sheets, waiting 1 to 2 hours after applying each layer. Apply while previous coat of saturant is tacky to touch and stagger wrap overlaps for each layer.
Q. The system shall be protected from damage, debris, and moisture during the curing period of not less than 24 hours.
R. Apply finish of two coats of Mbrace Top Coat using a 10 mm nap roller at a rate of 4.9 m2/liter per coat.


![Sport [broj 1386, 22.5.2009]](https://img.pdfslide.net/doc/110x75/577d2f6a1a28ab4e1eb1a68e/sport-broj-1386-2252009.jpg)


![1386 voronka[1]](https://img.pdfslide.net/doc/110x75/5577dbc7d8b42a7b7b8b4770/1386-voronka1.jpg)