Embed Size (px)
Citation preview

RC-1631
July 31, 2015
Costs and Benefits of MDOT Intelligent
Transportation System Deployments
FINAL REPORT
Jun-Seok Oh, Valerian Kwigizile, Zhanbo Sun, Matthew L. Clark,
Aous Hammad Kurdi and Matthew J. Wiersma
Transportation Research Center
for Livable Communities
Western Michigan University

Technical Report Documentation Page
1. Report No.
RC-1631 2. Government Accession No.
N/A 3. MDOT Project Manager
Collin Castle
4. Title and Subtitle
Costs and Benefits of MDOT Intelligent Transportation System Deployments
5. Report Date
July 31, 2015
6. Performing Organization Code
N/A
7. Author(s)
Jun-Seok Oh, Valerian Kwigizile, Zhanbo Sun, Matthew L. Clark, Aous Hammad Kurdi, Matthew J. Wiersma
8. Performing Org. Report No.
N/A
9. Performing Organization Name and Address
Western Michigan University 1903 West Michigan Avenue Kalamazoo, MI 49008
10. Work Unit No. (TRAIS)
N/A
11. Contract No.
2013-0069
11(a). Authorization No.
5
12. Sponsoring Agency Name and Address
Michigan Department of Transportation Research Administration 8885 Ricks Rd. P.O. Box 30049 Lansing MI 48909
13. Type of Report & Period Covered
Final Report 6/3/2013 - 7/31/2015 14. Sponsoring Agency Code
N/A
15. Supplementary Notes
16. Abstract
This report analyses costs and benefits of Intelligent Transportation Systems (ITS) deployed by the Michigan Department of Transportation (MDOT). MDOT ITS focuses on traffic incident management and also provide Freeway Courtesy Patrol services. According to a survey in this study, radio, television and Mi Drive are the most frequently used travel information sources and 93 percent of motorists are at least somewhat trusting general dynamic message sign (DMS) information. The survey also revealed that the motorists assisted by the freeway courtesy patrol (FCP) are willing to wait at least 15 minutes longer than actual wait times and over 90 percent are satisfied with the quality and response time of the service. MDOT ITS reduced significant incident duration and delays. Thanks to the delay reduction, the benefit-cost ratio of statewide ITS deployment was estimated at 3.16. Among ITS devices in Michigan, CCTV and DMS were found to be very cost-effective. Accordingly, future investments should focus on DMS and CCTV installation, while deployment of MVDS needs further studies in conjunction with the coming wake of Connected Vehicle technology. ITS deployments were more cost-effective on locations with higher incidents and higher traffic volumes. This study identified highway segments with highest potential for positive ITS benefit. 17. Key Words
Intelligent Transportation System; Cost and Benefit Analysis; Traffic Incident Management
18. Distribution Statement
No restrictions. This document is available to the public through the Michigan Department of Transportation.
19. Security Classification - report
Unclassified
20. Security Classification - page
Unclassified
21. No. of Pages
189
22. Price
N/A

Disclaimer
This publication is disseminated in the interest of information exchange. The Michigan
Department of Transportation (hereinafter referred to as MDOT) expressly disclaims any
liability, of any kind, or for any reason, that might otherwise arise out of any use of this
publication or the information or data provided in the publication. MDOT further disclaims any
responsibility for typographical errors or accuracy of the information provided or contained
within this information. MDOT makes no warranties or representations whatsoever regarding
the quality, content, completeness, suitability, adequacy, sequence, accuracy or timeliness of the
information and data provided, or that the contents represent standards, specifications, or
regulations.
Acknowledgments
We would like to thank Mr. Collin Castle, the project manager, and Mr. Andre Clover, the
research manager, for their continued support and technical guidance during this project. We also
would like to thank the Research Advisory Panel members for their comments and suggestions.
Mr. Matt Smith, Michigan Department of Transportation
Mr. Mark Geib, Michigan Department of Transportation
Ms. Jennifer Foley, Michigan Department of Transportation
Ms. Elise Kapphahn, Michigan Department of Transportation
Their comments and suggestions greatly helped the research team in improving the final product
of this research. This report is based upon work supported by the Michigan Department of
Transportation under the contract number 2013-0069.

Costs and Benefits of MDOT ITS Deployments
i
Table of Contents
Executive Summary ........................................................................................................................ 1
Chapter 1 Introduction .................................................................................................................. 11
1.1 Research Problem ............................................................................................................... 11
1.2 Research Objectives ............................................................................................................ 13
1.3 Research Scope and Overview ............................................................................................ 13
Chapter 2 Literature Review ......................................................................................................... 15
2.1 ITS Cost-Benefit Evaluation Methods ................................................................................ 15
2.1.1 Traditional Cost-Benefit Analysis ............................................................................... 15
2.1.2 Multi-Criteria Analysis ................................................................................................ 15
2.1.3 Sketch-Planning ........................................................................................................... 16
2.1.4 Questionnaire Surveys ................................................................................................. 16
2.1.5 Other Methods ............................................................................................................. 17
2.2 ITS Costs and Benefits by Device ...................................................................................... 17
2.2.1 Freeway Traffic Management ...................................................................................... 18
2.2.2 Arterial Traffic Management ....................................................................................... 19
2.2.3 Advanced Public Transit .............................................................................................. 20
2.2.4 Smart Work Zones ....................................................................................................... 21
2.2.5 Road Weather Information .......................................................................................... 22
2.2.6 Regional Parking Management .................................................................................... 23
2.3 Similar Traffic Operation Centers in Other States .............................................................. 24
2.3.1 SEMTOC ..................................................................................................................... 24
2.3.2 WMTOC ...................................................................................................................... 26

Costs and Benefits of MDOT ITS Deployments
ii
2.3.3 STOC ........................................................................................................................... 26
2.4 ITS Benefits ........................................................................................................................ 27
2.5 Findings from Literature Review ........................................................................................ 30
Chapter 3 MDOT ITS Deployments ............................................................................................. 32
3.1 MDOT ITS Deployments ................................................................................................... 32
3.1.1 Introduction .................................................................................................................. 32
3.1.2 2006-2013 Statewide ITS Deployments ...................................................................... 32
3.1.3 SEMTOC ITS Deployment.......................................................................................... 34
3.1.4 WMTOC ITS Deployment .......................................................................................... 38
3.1.5 STOC ITS Deployment................................................................................................ 41
3.2 Cost Analysis ...................................................................................................................... 47
3.2.1 ITS Construction-phase Costs...................................................................................... 47
3.2.2 ITS Maintenance & Operations Costs ......................................................................... 50
Chapter 4 User Perception Survey ................................................................................................ 55
4.1 Introduction ......................................................................................................................... 55
4.2 Survey and Analysis Methodology ..................................................................................... 55
4.2.1 Survey Design and Data Collection ............................................................................. 55
4.2.2 Data Analysis Focuses & Methods .............................................................................. 57
4.3 Results and Analysis ........................................................................................................... 59
4.3.1 Demographics and Exposure ....................................................................................... 59
4.3.2 ITS Device Familiarity and Frequency of Use ............................................................ 61
4.3.3 Freeway Travel Frequency and Concerns.................................................................... 70
4.3.4 Travel Information ....................................................................................................... 73
4.3.5 Survey General Comments .......................................................................................... 74

Costs and Benefits of MDOT ITS Deployments
iii
4.3.6 Effect of Pre-Departure Travel Information on Trips .................................................. 84
4.4 Impact of Results on Practice ............................................................................................. 86
4.5 Conclusion .......................................................................................................................... 87
Chapter 5 Performance of MDOT ITS ......................................................................................... 89
5.1 Summary of MDOT ITS Performance Report.................................................................... 89
5.1.1 Introduction .................................................................................................................. 89
5.1.2 SEMTOC Performance Report Summary ................................................................... 90
5.1.3 WMTOC Performance Report Summary .................................................................... 94
5.1.4 STOC Performance Report Summary ......................................................................... 95
5.2 Traffic Incidents and Delays ............................................................................................... 98
5.2.1 Introduction .................................................................................................................. 98
5.2.2 Annual Incident Count by TOC Region ...................................................................... 99
5.2.3 Incident Duration by TOC Region ............................................................................. 101
5.3 Summary ........................................................................................................................... 108
Chapter 6 Modeling ITS Corridors ............................................................................................. 109
6.1 Introduction ....................................................................................................................... 109
6.2 Selection of Corridors ....................................................................................................... 110
6.3 Modeling Procedure .......................................................................................................... 111
6.3.1 Introduction ................................................................................................................ 111
6.3.2 Network Development ............................................................................................... 112
6.3.3 Model Verification, Calibration and Validation ........................................................ 114
6.3.4 Simulation Scenarios ................................................................................................. 117
6.4 Results & Benefits ............................................................................................................ 120
6.4.1 Total Vehicle Hours Traveled and Delay .................................................................. 121

Costs and Benefits of MDOT ITS Deployments
iv
6.4.2 Emissions and Fuel Consumption .............................................................................. 122
6.5 Conclusion ........................................................................................................................ 125
Chapter 7 Cost and Benefit Analysis .......................................................................................... 126
7.1 Introduction ....................................................................................................................... 126
7.2 Cost Estimation ................................................................................................................. 127
7.3 Benefit Estimation ............................................................................................................ 128
7.3.1 Travel Delay and Emission Estimation...................................................................... 128
7.3.2 Estimation of Secondary Incident Reduction ............................................................ 135
7.3.3 Crash Reduction ......................................................................................................... 137
7.3.4 Mi Drive User Benefit ............................................................................................... 141
7.3.5 FCP User Satisfaction Benefit ................................................................................... 142
7.4 Cost and Benefit Analysis Results .................................................................................... 142
7.4.1 Cost and Benefit by TOC ........................................................................................... 142
7.4.2 Costs and Benefits by Device .................................................................................... 144
Chapter 8 Conclusion .................................................................................................................. 145
8.1 Summary of Research ....................................................................................................... 145
8.2 Recommendations ............................................................................................................. 148
Bibliography ............................................................................................................................... 150
Appendix ..................................................................................................................................... 156
Appendix 1: Survey Questionnaire ......................................................................................... 157
Appendix 2: MDOT ITS Performance Data ........................................................................... 162
Appendix 3: MDOT ITS Cost Data ........................................................................................ 165
Appendix 4: Simulation Corridor Data ................................................................................... 177
Appendix 5: Candidate ITS Corridors .................................................................................... 188

Costs and Benefits of MDOT ITS Deployments
v
List of Figures
Figure 1-1: Overall Research Approach ....................................................................................... 14
Figure 3-1: MDOT TOCs ............................................................................................................. 33
Figure 3-2: 2013 SEMTOC Device Locations ............................................................................. 34
Figure 3-3: 2006-2013 SEMTOC ITS Deployment ..................................................................... 35
Figure 3-4: 2013 SEMTOC Segment ITS Density by 2013 AADT ............................................. 36
Figure 3-5: SEMTOC FCP Routes ............................................................................................... 37
Figure 3-6: 2013 WMTOC Device Locations .............................................................................. 38
Figure 3-7: 2006-2013 WMTOC ITS Deployment ...................................................................... 39
Figure 3-8: 2013 WMTOC Segment ITS Density by 2013 AADT .............................................. 40
Figure 3-9: WMTOC FCP Routes (Planned)................................................................................ 41
Figure 3-10: 2013 STOC Device Locations ................................................................................. 42
Figure 3-11: 2006-2013 STOC ITS Deployments ........................................................................ 43
Figure 3-12: 2013 STOC Region 1 Segment ITS Density by 2013 AADT ................................. 44
Figure 3-13: 2013 STOC Region 2 Segment ITS Density by 2013 AADT ................................. 44
Figure 3-14: 2013 STOC Region 3 Segment ITS Density by 2013 AADT ................................. 45
Figure 3-15: STOC University Region FCP Routes ..................................................................... 46
Figure 3-16: STOC Lansing FCP Routes (Planned) ..................................................................... 46
Figure 3-17: STOC Southwest Region FCP Routes (Planned) .................................................... 47
Figure 3-18: Changes in Annual Operations and Maintenance Costs .......................................... 54
Figure 4-1: Weekly Timeline of Completed Surveys ................................................................... 57
Figure 4-2: Survey Responses by Age .......................................................................................... 60
Figure 4-3: Survey Responses by Gender ..................................................................................... 60
Figure 4-4: Survey Referral Points ............................................................................................... 61
Figure 4-5: ITS Device Familiarity............................................................................................... 62
Figure 4-6: "No, not at all." Level of Familiarity vs. Device Type .............................................. 63
Figure 4-7: Helpfulness of DMS Messages .................................................................................. 64
Figure 4-8: Effect of DMS on Travel Decisions ........................................................................... 65
Costs and Benefits of MDOT ITS Deployments
vi
Figure 4-9: Level of Trust in DMS ............................................................................................... 65
Figure 4-10: FCP Wait Duration................................................................................................... 69
Figure 4-11: FCP Level of Satisfaction ........................................................................................ 70
Figure 4-12: Weekday Daily Freeway Travel Duration ............................................................... 71
Figure 4-13: Weekend Daily Freeway Travel Duration ............................................................... 71
Figure 4-14: Major Concern during Daily Travel......................................................................... 72
Figure 4-15: 2013 Number of Unique Messages by Type at TOCs ............................................. 72
Figure 4-16: Weather and Construction Primary Concern vs. Time of Year ............................... 73
Figure 4-17: Daily Mi Drive Use by Week .................................................................................. 75
Figure 4-18: Work Zone and Road Weather Information by Week ............................................. 78
Figure 5-1: 2013 SEMTOC Percentage of FCP Assists by Type ................................................. 91
Figure 5-2: 2013 SEMTOC Average Response and Clearance Times ......................................... 92
Figure 5-3: 2013 WMTOC Percentage of Incidents by Type ....................................................... 95
Figure 5-4: 2013 STOC Percentage of FCP Assists by Type ....................................................... 97
Figure 5-5: 2013 STOC Average FCP Response and Clearance Times ....................................... 97
Figure 5-6: Annual Reported SEMTOC and STOC FCP Assist Counts .................................... 100
Figure 5-7: Annual Reported All TOC LCAR Incident Counts ................................................. 100
Figure 5-8: SEMTOC and STOC Reported FCP Assist Duration .............................................. 102
Figure 5-9: All TOC LCAR Incident Duration........................................................................... 103
Figure 5-10: 2013 SEMTOC Incident Duration ITS Comparisons ............................................ 104
Figure 5-11: 2013 WMTOC Incident Duration ITS Comparisons ............................................. 105
Figure 5-12: 2013 STOC Incident Duration ITS Comparisons .................................................. 107
Figure 6-1: Proposed Study Sites Selected ................................................................................. 110
Figure 6-2: Simulation Model Development Procedure ............................................................. 111
Figure 6-3: WMTOC SS5 Paramics Network ............................................................................ 112
Figure 6-4: WMTOC SS5 TransCAD Subarea .......................................................................... 113
Figure 6-5: WMTOC SS5 Model Verification (Signal Coordination) ....................................... 115
Figure 6-6: WMTOC SS5 OD Demands Zone-to-Zone ............................................................. 116
Figure 6-7: WMTOC SS5 Simulated vs. Observed Detector Speed-Flow Curves .................... 117

Costs and Benefits of MDOT ITS Deployments
vii
Figure 6-8: WMTOC SS5 Modeled Incident.............................................................................. 118
Figure 6-9: WMTOC SS5 Alternate Routes Example ................................................................ 119
Figure 7-1: Timeline of Incidents ............................................................................................... 128
Figure 7-2: Estimation of Incident Delay ................................................................................... 131
Figure 7-3: Speed-Flow Relation ................................................................................................ 133
Figure 7-4: Emission Rates by Speed ......................................................................................... 133
Figure 7-5: Number of Sessions Accessed to Mi Drive ............................................................. 141
Figure 8-1: ITS Candidate Corridor Hotspots ............................................................................ 149
Figure A-1: 2013 SEMTOC SS1 ITS Devices ........................................................................... 178
Figure A-2: 2013 SEMTOC SS2 ITS Devices ........................................................................... 179
Figure A-3: 2013 SEMTOC SS3 ITS Devices ........................................................................... 180
Figure A-4: 2013 WMTOC SS4 ITS Devices ............................................................................ 181
Figure A-5: 2013 WMTOC SS5 ITS Devices ............................................................................ 182
Figure A-6: 2013 STOC SS6 ITS Devices ................................................................................. 183
Figure A-7: 2013 STOC SS7 ITS Devices ................................................................................. 184
Figure A-8: SEMCOG TransCAD Model .................................................................................. 185
Figure A-9: GVMC TransCAD Model ....................................................................................... 186
Figure A-10: WMTOC SS5 ToD Travel Pattern ........................................................................ 187

Costs and Benefits of MDOT ITS Deployments
viii
List of Tables
Table E-1: Summary of ITS Construction Costs (2006-2013) ....................................................... 2
Table E-2: Total Operations and Maintenance Costs (2006 – 2013) .............................................. 2
Table E-3: Summary of Annual Operations and Maintenance Cost (2013) ................................... 3
Table E-4: Summary of MDOT ITS performance .......................................................................... 4
Table E-5: Estimated Incident Duration Reduction ........................................................................ 5
Table E-6: Summary of ITS Costs by TOC .................................................................................... 7
Table E-7: Summary of Costs and Benefits .................................................................................... 8
Table E-8: Summary of Benefit Cost Ratios .................................................................................. 9
Table E-9: Summary of Benefit Cost Ratios by Device ............................................................... 10
Table 2-1: TOCs Similar to SEMTOC ......................................................................................... 25
Table 2-2: TOCs Similar to WMTOC .......................................................................................... 25
Table 2-3: TOCs Similar to STOC ............................................................................................... 26
Table 2-4: Costs and Benefits of Michigan Road Weather Information Systems ........................ 27
Table 2-5: Example B/C Ratios from Other Studies .................................................................... 31
Table 3-1: MDOT ITS Devices (2013) ......................................................................................... 33
Table 3-2: 2006-2013 SEMTOC ITS Devices by Operation Date ............................................... 35
Table 3-3: 2006-2013 WMTOC ITS Devices by Operation Date ................................................ 40
Table 3-4: 2006-2013 ITS Devices by Operation Date ................................................................ 43
Table 3-5: ITS Construction Costs (2006-2013) .......................................................................... 49
Table 3-6: Average Construction Costs per ITS Device (2006-2013) ......................................... 49
Table 3-7: Total Operations and Maintenance Costs (2006 – 2013) ............................................ 53
Table 3-8: Changes in Operations and Maintenance Cost ............................................................ 54
Table 3-9: Summary of Operations and Maintenance Cost .......................................................... 54
Table 4-1: Familiarity on ITS Devices ......................................................................................... 62
Table 4-2: Source of Pre-departure Information ........................................................................... 63
Table 4-3: “How trusting are you of information displayed on DMS” vs. “How did DMS affect
your travel?”.................................................................................................................................. 67

Costs and Benefits of MDOT ITS Deployments
ix
Table 4-4: Level of Trust vs. “Incident Ahead: Use Detour Exit 35” .......................................... 68
Table 4-5: Level of Trust vs. “Travel to Jackson/Distance 30 Miles/Time 25 Minutes” ............. 68
Table 4-6: Winter Pre-Departure Information Use Frequency by Source .................................... 76
Table 4-7: Spring Pre-Departure Information Use Frequency by Source .................................... 76
Table 4-8: Information Type Necessity by Season ....................................................................... 77
Table 4-9: Crash Information Necessity vs. Mi Drive Usage Frequency ..................................... 79
Table 4-10: Crash Information Necessity vs. TV Usage Frequency ............................................ 79
Table 4-11: ITS Device Familiarity: Ordered Logit Regression .................................................. 82
Table 4-12: ATIS Pre-Departure Usage: Ordered Logit Regression ............................................ 83
Table 4-13: Impact of Travel Information on Trip Changes ........................................................ 84
Table 4-14: Trip Changes: Ordered Logit Regression .................................................................. 85
Table 5-1: 2006-2013 Annual SEMTOC Performance Summary ................................................ 90
Table 5-2: 2011-2013 SEMTOC Monthly LCAR Incidents ........................................................ 93
Table 5-3: 2009-2013 WMTOC Annual Performance Summary ................................................. 94
Table 5-4: 2009-2013 Annual STOC Performance Summary ...................................................... 96
Table 5-5: 2013 STOC Incidents .................................................................................................. 96
Table 5-6: Incident Duration Reduction from Other Studies........................................................ 98
Table 5-7: TOC Performance Report Database Utilization ........................................................ 101
Table 5-8: 2013 SEMTOC Incident Duration Reductions ......................................................... 104
Table 5-9: 2013 SEMTOC LCAR Incident Duration by Lanes Blocked ................................... 105
Table 5-10: 2013 WMTOC Incident Duration Reductions ........................................................ 106
Table 5-11: Comparison of Incident Duration (STOC – Assisted) ............................................ 107
Table 5-12: 2013 STOC Incident Duration Reductions ............................................................. 107
Table 5-13: 2013 STOC LCAR Incident Durations by Lanes Blocked ..................................... 108
Table 6-1: WMTOC SS5 Vehicle Mix ....................................................................................... 114
Table 6-2: Simulation Scenario Map .......................................................................................... 120
Table 6-3: Delay Saved at 100 Percent Demand ........................................................................ 122
Table 6-4: CO2 Emissions Saved at 100% Demand ................................................................... 123
Table 6-5: NOx Emissions Saved at 100% Demand ................................................................... 124

Costs and Benefits of MDOT ITS Deployments
x
Table 6-6: Fuel Consumption Saved at 100% Demand .............................................................. 124
Table 7-1: Summary of ITS Costs by TOC ................................................................................ 127
Table 7-2: Estimated Incident Duration Reduction .................................................................... 130
Table 7-3: Capacity Reduction by Lane Block ........................................................................... 132
Table 7-4: Free flow Speed Adjustment Factor .......................................................................... 132
Table 7-5: Summary of Incident Delay and Saving .................................................................... 134
Table 7-6: Summary of Fuel and Emission Saving .................................................................... 135
Table 7-7: Secondary Incident Delay Saving ............................................................................. 136
Table 7-8: Descriptive Statistics ................................................................................................. 139
Table 7-9: Model estimation results ........................................................................................... 139
Table 7-10: Number of crashes reduced by region ..................................................................... 140
Table 7-11: Average Crash Cost ................................................................................................. 140
Table 7-12: Crash Reduction Saving .......................................................................................... 141
Table 7-13: User Satisfaction Benefit ......................................................................................... 142
Table 7-14: Summary of Costs and Benefits .............................................................................. 143
Table 7-15: Summary of Benefit Cost Ratios ............................................................................. 143
Table 7-16: Summary of Benefit Cost Ratios by Device ........................................................... 144
Table A-1: 2008-2013 SEMTOC Number of FCP Assists ......................................................... 162
Table A-2: 2008-2013 Annual SEMTOC FCP Performance ..................................................... 163
Table A-3: 2009-2013 WMTOC Incidents by Type................................................................... 164
Table A-4: WMTOC Costs ........................................................................................................ 165
Table A-5: SEMTOC Costs ........................................................................................................ 166
Table A-6: STOC Costs .............................................................................................................. 167
Table A-7: IPO Costs ................................................................................................................. 168
Table A-8: WMTOC Project Costs............................................................................................. 169
Table A-9: SEMTOC Project Costs ............................................................................................ 170
Table A-10: STOC Project Costs ................................................................................................ 173
Table A-11: Construction Costs by Device Type and TOC ....................................................... 175

Costs and Benefits of MDOT ITS Deployments
xi
Table A-12: Operations & Maintenance Costs by Device Type and TOC................................. 176
Table A-13: Simulation Study Site 2013 Characteristics ........................................................... 177
Costs and Benefits of MDOT ITS Deployments
City of Bloomington, IN
List of Acronyms
AADT Average Annual Daily Traffic
AHP Analytic Hierarchy Process
APTS Advanced Public Transit Systems
ATIS Advanced Traveler Information Systems
ATMS Advanced Traffic Management Systems
AVL Automatic Vehicle Location
BCR Benefit-Cost Ratio
C/B Cost/Benefit
CBA Cost-Benefit Analysis
CBR Case-Based Reasoning
CCTV Closed-Circuit Television
CVO Commercial Vehicle Operations
DMS Dynamic Message Signs
EPA Environmental Protection Agency
ESS Environmental Sensor Stations
FCP Freeway Courtesy Patrol
FDOT Florida Department of Transportation
FHWA Federal Highway Administration
GDOT Georgia Department of Transportation.
GVMC Grand Valley Metropolitan Council
HAR Highway Advisory Radio
ICM Integrated Corridor Management
IDAS ITS Deployment Analysis System
IMAP Incident Management Assistance Patrols
IPO ITS Program Office
IRR Internal Rate of Return
ITS Intelligent Transportation Systems
LCAR Lane Closure and Restrictions

Costs and Benefits of MDOT ITS Deployments
MAP-21 Moving Ahead for Progress in the 21st Century Act
MCA Multi-Criteria Analysis
MDOT Michigan Department of Transportation
MMTPS Multi-Modal Trip Planning Systems
MOVES Motor Vehicle Emission Simulator
MVDS Microwave Vehicle Detection System
NB Negative Binomial
NPV Net Present Value
O&M Operations and Maintenance
RITA Research and Innovative Technology Administration
RWIS Road Weather Information System
SEMCOG Southeast Michigan Council of Governments
SEMTOC Southeast Michigan Transportation Operations Center
SCRITIS Screening for Intelligent Transportation Systems
STOC Statewide Transportation Operations Center
SWZ Smart Work Zones
TMC Traffic Management Center
TOC Transportation Operations Center
ToD Time-of-Day
VOT Value of Time
TTS Travel Time Signs
V2D Vehicle-to-Device.
V2I Vehicle-to-Infrastructure
V2V Vehicle-to-Vehicle.
WMTOC West Michigan Transportation Operations Center
WSDOT Washington State Transportation Operations Center
Costs and Benefits of MDOT ITS Deployments
1
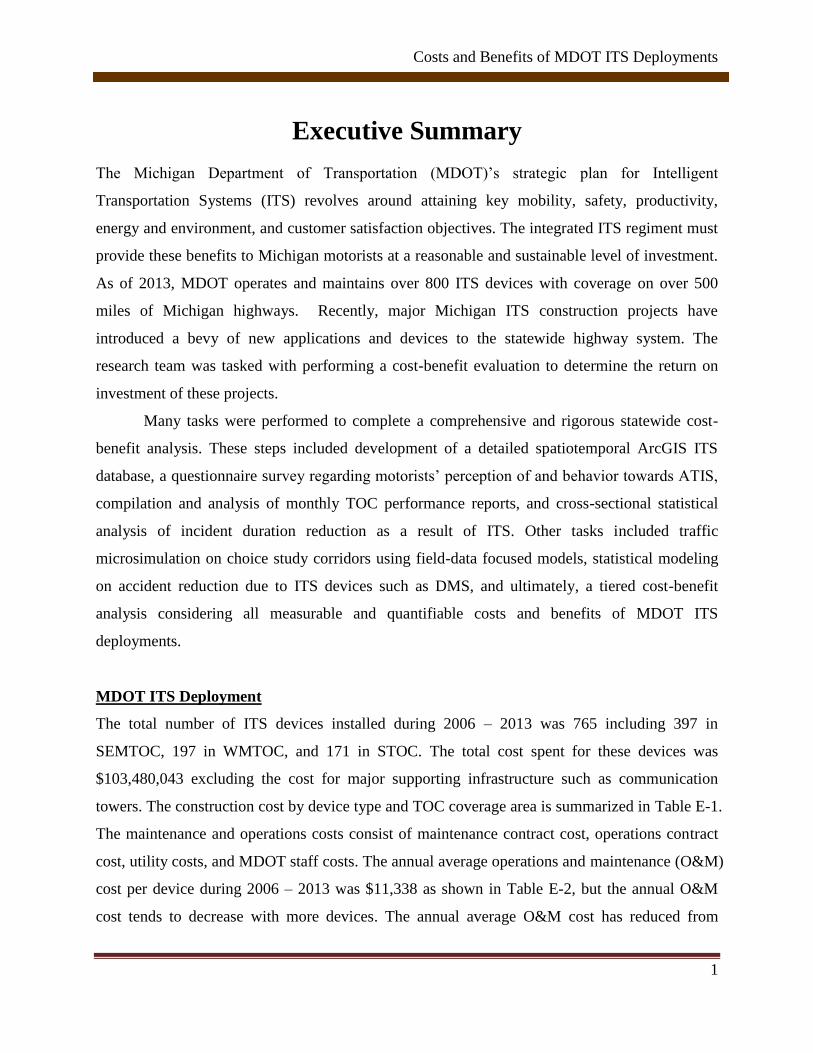
Executive Summary
The Michigan Department of Transportation (MDOT)’s strategic plan for Intelligent
Transportation Systems (ITS) revolves around attaining key mobility, safety, productivity,
energy and environment, and customer satisfaction objectives. The integrated ITS regiment must
provide these benefits to Michigan motorists at a reasonable and sustainable level of investment.
As of 2013, MDOT operates and maintains over 800 ITS devices with coverage on over 500
miles of Michigan highways. Recently, major Michigan ITS construction projects have
introduced a bevy of new applications and devices to the statewide highway system. The
research team was tasked with performing a cost-benefit evaluation to determine the return on
investment of these projects.
Many tasks were performed to complete a comprehensive and rigorous statewide cost-
benefit analysis. These steps included development of a detailed spatiotemporal ArcGIS ITS
database, a questionnaire survey regarding motorists’ perception of and behavior towards ATIS,
compilation and analysis of monthly TOC performance reports, and cross-sectional statistical
analysis of incident duration reduction as a result of ITS. Other tasks included traffic
microsimulation on choice study corridors using field-data focused models, statistical modeling
on accident reduction due to ITS devices such as DMS, and ultimately, a tiered cost-benefit
analysis considering all measurable and quantifiable costs and benefits of MDOT ITS
deployments.
MDOT ITS Deployment
The total number of ITS devices installed during 2006 – 2013 was 765 including 397 in
SEMTOC, 197 in WMTOC, and 171 in STOC. The total cost spent for these devices was
$103,480,043 excluding the cost for major supporting infrastructure such as communication
towers. The construction cost by device type and TOC coverage area is summarized in Table E-1.
The maintenance and operations costs consist of maintenance contract cost, operations contract
cost, utility costs, and MDOT staff costs. The annual average operations and maintenance (O&M)
cost per device during 2006 – 2013 was $11,338 as shown in Table E-2, but the annual O&M
cost tends to decrease with more devices. The annual average O&M cost has reduced from

Costs and Benefits of MDOT ITS Deployments
2
$14,160 in 2007 to $8,983 in 2013. In addition, SEMTOC and STOC have been operating
freeway courtesy patrol (FCP) programs which cost $2.3 million annually. Table E-3
summarizes the annual O&M cost including FCP costs.
Table E-1: Summary of ITS Construction Costs (2006-2013)
TOC Coverage Area Overall
SEMTOC WMTOC STOC
New CCTV Quantity 124 57 56 237
New MVDS Quantity 222 120 65 407
New DMS Quantity 50 20 45 115
New TTS Quantity 1 0 5 6
Total 397 197 171 765
ITS Construction Cost $45,728,333 $15,423,533 $20,506,649 $81,658,515
Estimated Design Cost $8,424,541 $2,359,045 $2,973,464 $13,757,050
Estimated System Manager Cost $4,938,524 $1,382,888 $1,743,065 $8,064,478
Total Construction Cost $59,091,399 $19,165,466 $25,223,178 $103,480,043
Av
erag
e
Co
nst
ruct
ion
Co
st p
er
Dev
ice
Overall $148,845 $97,287 $147,504 $135,268
CCTV $161,404 $97,906 $141,945 $141,535
MVDS $105,945 $76,064 $45,853 $87,538
DMS $308,848 $222,860 $307,037 $293,185
TTS $115,187 N/A $95,422 $98,717
Note) Costs for major supporting infrastructure (communication towers) were excluded.
Table E-2: Total Operations and Maintenance Costs (2006 – 2013)
SEMTOC WMTOC STOC Total
Total CCTV Quantity 1162 301 115 1578
Total MVDS Quantity 1096 486 151 1733
Total DMS Quantity 541 134 115 790
Total TTS Quantity 1 0 8 9
Total Devices (Device-Year) 2,800 921 389 4,110
Maintenance Contract Cost $12,006,309 $1,135,537 $1,064,344 $14,206,190
TOC Operations Cost $13,137,988 $2,953,545 $2,220,658 $18,312,191
Utility Cost (power) $2,255,840 $597,636 $304,964 $3,158,440
Utility Cost (communication) $2,202,764 $641,047 $258,283 $3,102,093
MDOT Staff Cost $4,500,000 $1,800,000 $1,518,750 $7,818,750
Total O&M Cost $34,102,901 $7,127,765 $5,366,998 $46,597,664
Annual Average O&M Cost per
Device
$12,180 $7,739 $13,797 $11,338
Note) Total ITS device quantity is the sum of devices active each year during 2006 – 2013.
Costs and Benefits of MDOT ITS Deployments
3
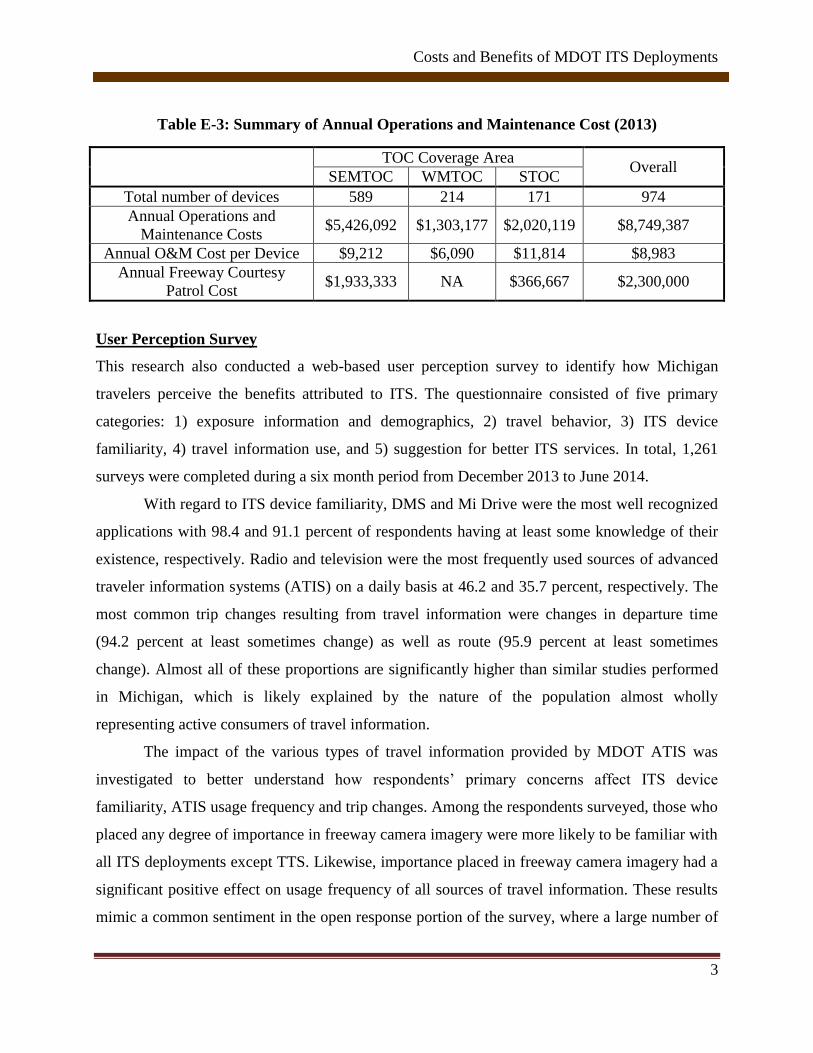
Table E-3: Summary of Annual Operations and Maintenance Cost (2013)
TOC Coverage Area
Overall SEMTOC WMTOC STOC
Total number of devices 589 214 171 974
Annual Operations and
Maintenance Costs $5,426,092 $1,303,177 $2,020,119 $8,749,387
Annual O&M Cost per Device $9,212 $6,090 $11,814 $8,983
Annual Freeway Courtesy
Patrol Cost $1,933,333 NA $366,667 $2,300,000
User Perception Survey
This research also conducted a web-based user perception survey to identify how Michigan
travelers perceive the benefits attributed to ITS. The questionnaire consisted of five primary
categories: 1) exposure information and demographics, 2) travel behavior, 3) ITS device
familiarity, 4) travel information use, and 5) suggestion for better ITS services. In total, 1,261
surveys were completed during a six month period from December 2013 to June 2014.
With regard to ITS device familiarity, DMS and Mi Drive were the most well recognized
applications with 98.4 and 91.1 percent of respondents having at least some knowledge of their
existence, respectively. Radio and television were the most frequently used sources of advanced
traveler information systems (ATIS) on a daily basis at 46.2 and 35.7 percent, respectively. The
most common trip changes resulting from travel information were changes in departure time
(94.2 percent at least sometimes change) as well as route (95.9 percent at least sometimes
change). Almost all of these proportions are significantly higher than similar studies performed
in Michigan, which is likely explained by the nature of the population almost wholly
representing active consumers of travel information.
The impact of the various types of travel information provided by MDOT ATIS was
investigated to better understand how respondents’ primary concerns affect ITS device
familiarity, ATIS usage frequency and trip changes. Among the respondents surveyed, those who
placed any degree of importance in freeway camera imagery were more likely to be familiar with
all ITS deployments except TTS. Likewise, importance placed in freeway camera imagery had a
significant positive effect on usage frequency of all sources of travel information. These results
mimic a common sentiment in the open response portion of the survey, where a large number of
Costs and Benefits of MDOT ITS Deployments
4
respondents voiced requests for extended publically available CCTV coverage as well as
improved image quality. Regarding pre-departure travel behaviors, the degree of importance
placed in various types of information, including camera images, crash/accident, planned special
events and road weather, primarily affected the decision to change route more than any other trip
change. This observation indicates that travel information proves more impactful in route
decision than scheduling or mode choices.
According to the survey results, radio, television and Mi Drive are the most frequently
used ATIS sources and 93 percent of motorists are at least somewhat trusting general DMS
information. The survey also revealed that FCP assisted motorists are willing to wait at least 15
minutes longer than actual wait times and over 90 percent are satisfied with the quality and
response time of the service.
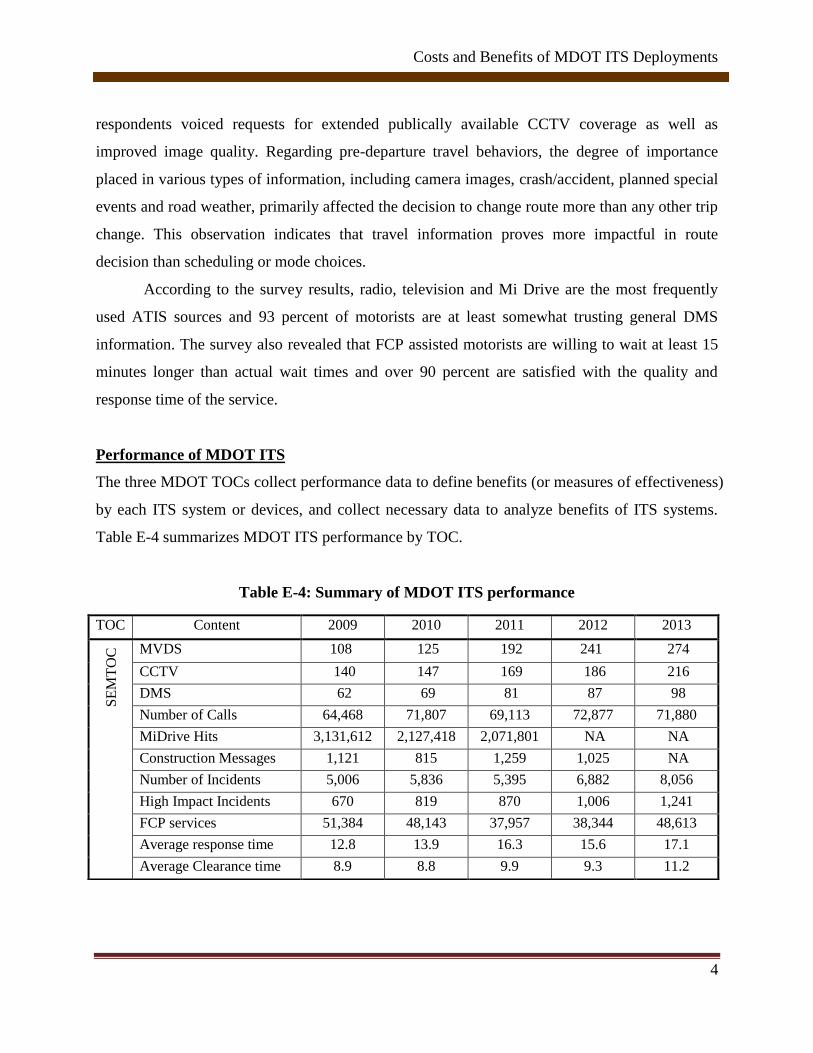
Performance of MDOT ITS
The three MDOT TOCs collect performance data to define benefits (or measures of effectiveness)
by each ITS system or devices, and collect necessary data to analyze benefits of ITS systems.
Table E-4 summarizes MDOT ITS performance by TOC.
Table E-4: Summary of MDOT ITS performance
TOC Content 2009 2010 2011 2012 2013
SE
MT
OC
MVDS 108 125 192 241 274
CCTV 140 147 169 186 216
DMS 62 69 81 87 98
Number of Calls 64,468 71,807 69,113 72,877 71,880
MiDrive Hits 3,131,612 2,127,418 2,071,801 NA NA
Construction Messages 1,121 815 1,259 1,025 NA
Number of Incidents 5,006 5,836 5,395 6,882 8,056
High Impact Incidents 670 819 870 1,006 1,241
FCP services 51,384 48,143 37,957 38,344 48,613
Average response time 12.8 13.9 16.3 15.6 17.1
Average Clearance time 8.9 8.8 9.9 9.3 11.2

Costs and Benefits of MDOT ITS Deployments
5
WM
TO
C MVDS 42 42 120 120 120
CCTV 23 26 67 67 67
DMS 11 12 27 27 27
Number of Calls 1059 2712 2703 3492 3789
Construction Messages 451 504 641 491 NA
Number of Incidents 606 1192 1015 1373 1477
Incident Clearance time 54 75 81 69 68
Roadway Clearance time NA NA NA 23 24
ST
OC
MVDS 0 0 31 55 65
CCTV 0 0 19 40 56
DMS 2 6 22 36 45
Number of Calls NA NA NA 3690 NA
Construction Messages NA NA NA 236 184
Number of Incidents NA NA NA 2452 7458
Incident Response time NA NA NA NA 13.1
Incident Clearance time NA NA NA NA 16.3
Table E-5: Estimated Incident Duration Reduction
SEMTOC WMTOC STOC TOTAL
Total Number of Incidents 56,425 1,477 7,458 65,360
LCAR Incidents 8,056 1,477 1,502 11,035
FCP Assisted 48,369 - 5,956 54,325
Average Duration 24.2 54.9 46.5 27.5
LCAR Incidents 47.1 54.9 117.2 57.7
FCP Assisted 20.4 - 28.7 21.3
Average Duration Reduced by ITS 24.5 23.9 32.3 25.38
LCAR Incidents 24.5 23.91)
18.92)
23.66
FCP Assisted 24.5 - 35.7 25.73
1) 24.5 minute reduction for incidents within the ITS dense area; 10 minute reduction for
those outside
2) 44.9 minute reduction for incidents within the ITS dense area; 10 minute reduction for
those outside
TOC Content 2009 2010 2011 2012 2013

Costs and Benefits of MDOT ITS Deployments
6
In an effort to determine incident reduction as a result of ITS, a descriptive statistical
incident duration analysis was performed based on processed data provided by the TOCs.
Finally, incident delay analysis as affected by ITS was performed. The most notable effect of
ITS observed in reducing incident duration occurred in the STOC region, which saw a 35.7
minute assisted incident reduction as a result of ITS. For LCAR incidents, the reduction was
more substantial at 44.9 minutes for all ITS and 57.7 minutes for CCTVs. Cross-sectional
statistical analysis determined that ITS reduced incident durations between 18.9 and 24.5
minutes for high-impact incidents and between 24.5 and 35.7 minutes for FCP assisted events. A
summary of estimated incident duration reduction is presented in Table E-5.
Modeling ITS Corridors
In this project, the research team selected a sample of representative corridors from each of the
three MDOT TOCs. The Quadstone Paramics traffic microsimulation software package was
utilized to quantify benefits from “with/without” ITS scenarios with regards to freeway incident
management. MDOT’s incident management programs strive to produce savings in congestion
cost, reduce incident duration, reduce motorist delay, and improve safety by minimizing the
probability of secondary crash occurrence. Seven major MDOT freeway corridors were selected
for the simulation study. The corridor characteristics under consideration for site selection
included AADT, ITS device density, economic impact and crash/incident history.
The simulation study provided valuable insight into the operational performance of ITS
on the corridor level. Analysis determined that ITS was most beneficial in high duration, high
reduction scenarios. Many factors governed the results according to each corridor, namely,
traffic volume, network configuration and ITS device placement. Using microsimulation models
was a cost-effective method in analyzing ITS corridors. It is suggested to adopt microsimulation
models in developing deployment plans for ITS corridors.
Cost and Benefit Analysis
A cost-benefit analysis was performed at two levels: (1) by TOC and (2) by device. For purposes
of cost-benefit analysis, the base year was assumed to be 2012. The analysis period extends for
20 years after base ITS deployment, while applying a 3 percent discount rate over the duration.

Costs and Benefits of MDOT ITS Deployments
7
It was assumed that all devices were installed at the same time during the base year (2012) in
order to avoid complexity in estimating benefits with partial ITS deployments. It was also
assumed that the lifespan of ITS devices was 20 years. O&M costs were applied during the
analysis period (2013 – 2032) and assumed to be the same for all years.
Table E-6: Summary of ITS Costs by TOC
Period SEMTOC WMTOC STOC Total
Number Devices 589 214 171 974
DMS 98 27 45 170
CCTV 216 67 56 339
MVDS 274 120 65 459
TTS 1 0 5 6
Construction Cost 86,519,413 30,765,154 27,788,750 145,073,317
DMS 28,732,112 7,915,990 13,193,317 49,841,419
CCTV 18,908,122 5,865,019 4,902,106 29,675,248
MVDS 38,780,462 16,984,144 9,199,745 64,964,351
TTS 98,717 - 493,583 592,299
Annual O&M Costs 5,426,092 1,303,177 2,020,119 8,749,387
Annual FCP Cost 1,933,333 - 366,667 2,300,000
The key focus of MDOT ITS is managing traffic incidents and providing recurrent and
non-recurrent traffic information. In this study, ITS benefits were estimated from these activities.
The benefits of ITS were comprised of travel time saving, secondary incident reduction, fuel
consumption saving, emission cost saving, and crash reduction. Other benefits are using MiDrive
to acquire travel information to potentially alter motorist travel decisions and user satisfaction
from FCP services.
Incident delay was estimated by applying the queue concept. The reduced capacity by an
incident is the main source of delay. The total delay includes the time to dissipate the queue after
the incident is cleared. The total delay is reduced when the incident duration is reduced by ITS
services. Based on the concept of queueing, a delay computation model was developed to

Costs and Benefits of MDOT ITS Deployments
8
quantify the ITS benefit. The benefit of ITS in reducing secondary incidents was included as a
complimentary part of incident delay reduction. It was based on the likelihood of secondary
incidents during an incident period. Emission and fuel consumption saving benefits were also
estimated by applying unit monetary values. Crash reduction benefit was estimated by
employing the negative binomial model that analyzed the impact of ITS devices on crashes. The
model indicates that one DMS is likely to reduce 16.6 percent of crashes while one ITS devices
other than DMS reduces 1.9 percent of crashes. The total amount of time spent for Mi Drive
webpage and mobile app was regarded as an ITS benefit, because users willingly spend their
time to acquire traffic information worth more than the time spent. The total benefit from the Mi
Drive is estimated as $6.6 million from the total amount of 434,140 hours. In addition, FCP user
satisfaction benefit is quantified by applying an average of $60.25 per assist.
Table E-7: Summary of Costs and Benefits
SEMTOC WMTOC STOC TOTAL
Construction Cost $86,519,413 $30,765,154 $27,788,750 $145,073,317
Annual O&M Cost $5,426,092 $1,303,177 $2,020,119 $8,749,387
Annual FCP Cost $1,933,333 $0 $366,667 $2,300,000
Total Annual Benefit $46,764,939 $10,246,404 $8,675,271 $65,686,613
LCAR Delay saving $16,999,350 $2,916,013 $2,950,967 $22,866,331
FCP Delay Saving $3,054,315 $0 $423,873 $3,478,188
Secondary Incident Delay Saving $4,010,733 $583,203 $674,968 $5,268,904
Fuel Saving $1,301,310 $187,994 $216,593 $1,705,897
Emission Saving $1,315,257 $225,470 $263,126 $1,803,853
Crash Saving $13,205,914 $4,924,239 $2,513,772 $20,643,926
MiDrive User Benefit $3,963,827 $1,409,484 $1,273,122 $6,646,434
FCP Satisfaction Benefit $2,914,232 $0 $358,849 $3,273,081
Benefit-cost ratios are presented at four different levels of benefits. As shown in Table
E-8, benefit-cost ratios were all greater than 1.0, even at the base level, which includes delay,
fuel consumption and emissions savings only. When including all benefits, the final statewide

Costs and Benefits of MDOT ITS Deployments
9
BCR was estimated at $3.16 for every dollar spent. The BCR breakdown by TOC was 3.55 for
SEMTOC; 3.04 for WMTOC; and 2.04 for STOC. Based on the estimated costs and benefits, it
can be stated that MDOT’s ITS investment was cost effective, even though its history was
relatively short.
Table E-8: Summary of Benefit Cost Ratios
SEMTOC WMTOC STOC TOTAL
Sum of Present Value (Cost) $196,009,067 $50,153,131 $63,298,098 $309,460,296
Su
m o
f P
rese
nt
Valu
e (
Ben
efit
) A: Delay + Fuel + Emission $396,945,383 $58,210,798 $67,387,927 $522,544,108
BCR 2.03 1.16 1.06 1.69
B: A + Crash $593,416,042 $131,471,044 $104,786,514 $829,673,599
BCR 3.03 2.62 1.66 2.68
C: B + Mi Drive $652,387,782 $152,440,611 $123,727,361 $928,555,754
BCR 3.33 3.04 1.95 3.00
D: C + FCP Satisfaction $695,744,199 $152,440,611 $129,066,128 $977,250,938
BCR 3.55 3.04 2.04 3.16
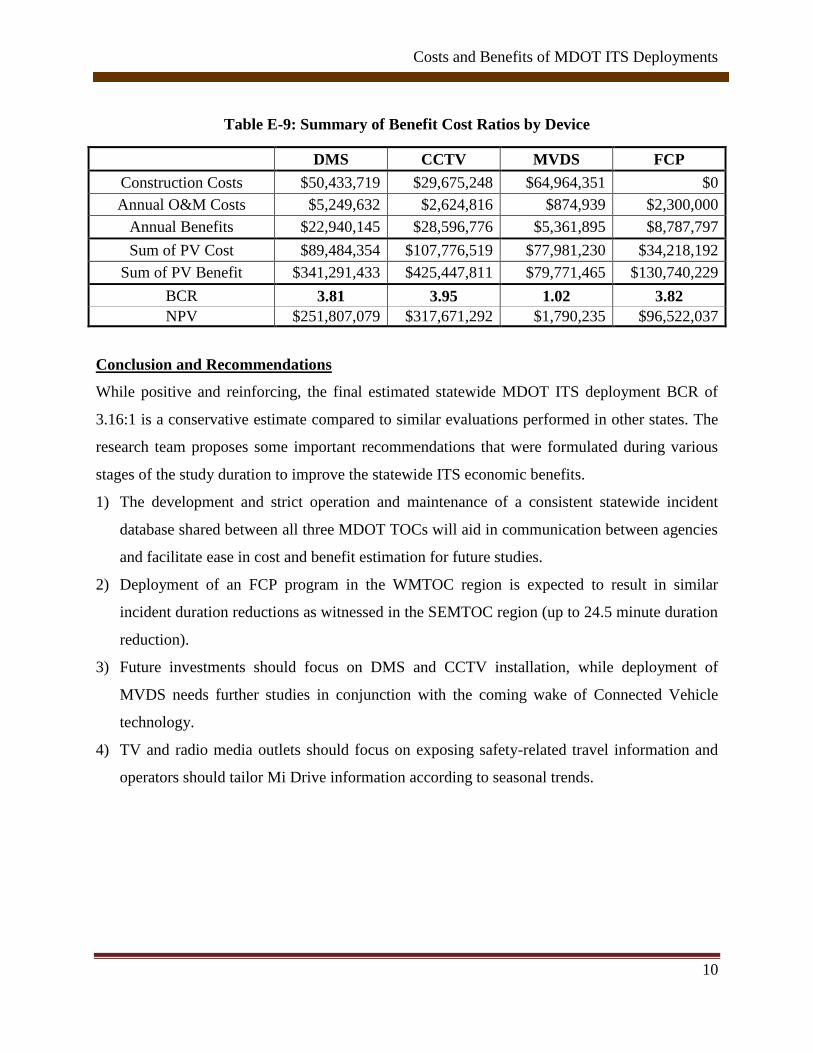
While it is difficult to separate ITS benefits by device, there might be differences in
utilization of devices and their effectiveness. In order to identify the difference, the research team
conducted phone interviews with TOC operators to understand the proportion each device type
was utilized for daily operation activities. The overall consensus was that an operator spent 64%,
24% and 12% of their time for activities related with CCTV, DMS, and MVDS, respectively.
Based on the operator’s time split, cost-benefit ratios by device were estimated as shown in
Table E-9. The benefit-cost ratio (BCR) of CCTV was the highest, while that of MVDS was the
lowest. Both FCP and DMS also showed high BCR values. Even though MVDS are the
backbone of ITS through providing basic traffic information, the analysis result showed a low
BCR, due to relatively low utilization from the operators’ perspective. However, it should be
noted that TOC operators are using travel time information obtained from traffic sensors for their
proactive operations decisions.
Costs and Benefits of MDOT ITS Deployments
10
Table E-9: Summary of Benefit Cost Ratios by Device
DMS CCTV MVDS FCP
Construction Costs $50,433,719 $29,675,248 $64,964,351 $0
Annual O&M Costs $5,249,632 $2,624,816 $874,939 $2,300,000
Annual Benefits $22,940,145 $28,596,776 $5,361,895 $8,787,797
Sum of PV Cost $89,484,354 $107,776,519 $77,981,230 $34,218,192
Sum of PV Benefit $341,291,433 $425,447,811 $79,771,465 $130,740,229
BCR 3.81 3.95 1.02 3.82
NPV $251,807,079 $317,671,292 $1,790,235 $96,522,037
Conclusion and Recommendations
While positive and reinforcing, the final estimated statewide MDOT ITS deployment BCR of
3.16:1 is a conservative estimate compared to similar evaluations performed in other states. The
research team proposes some important recommendations that were formulated during various
stages of the study duration to improve the statewide ITS economic benefits.
1) The development and strict operation and maintenance of a consistent statewide incident
database shared between all three MDOT TOCs will aid in communication between agencies
and facilitate ease in cost and benefit estimation for future studies.
2) Deployment of an FCP program in the WMTOC region is expected to result in similar
incident duration reductions as witnessed in the SEMTOC region (up to 24.5 minute duration
reduction).
3) Future investments should focus on DMS and CCTV installation, while deployment of
MVDS needs further studies in conjunction with the coming wake of Connected Vehicle
technology.
4) TV and radio media outlets should focus on exposing safety-related travel information and
operators should tailor Mi Drive information according to seasonal trends.

Costs and Benefits of MDOT ITS Deployments
11
Chapter 1 Introduction
1.1 Research Problem
Traffic congestion has been a worldwide problem as a result of increased motorized traffic and
urbanization. Congestion reduces the efficiency of transportation infrastructure and increases
travel time, fuel consumption, and air pollution. In many regions in the United States, traffic
jams can occur at any daylight hour, many nighttime hours and on weekends. The problems that
travelers and shippers face include extra travel time, unreliable travel time and a system that is
vulnerable to a variety of irregular congestion-producing incidents. According to the Urban
Mobility Report (Schrank et al., 2012), congestion caused urban Americans to travel 5.5 billion
hours more and to purchase an extra 2.9 billion gallons of fuel at a cost of $121 billion in 2011.
Each auto-commuter paid $818 as a congestion cost.
Intelligent Transportation Systems (ITS) have been regarded as a cost-effective solution
to help travelers in using existing transportation infrastructure by taking advantage of advanced
communication technologies, such as advanced traveler information systems (ATIS), advanced
traffic management systems (ATMS), advanced public transportation systems (APTS) and
commercial vehicle operations (CVO). The concept of ITS has evolved and ITS applications
have been expanded in various directions, including the Connected Vehicles (CV) technology
that applies advanced vehicle-to-vehicle (V2V), vehicle-to-infrastructure (V2I), vehicle-to-
device (V2D) communications technologies. Typically, ITS application areas are classified into
two parts: intelligent infrastructure and intelligent vehicles. While applications of intelligent
vehicles include collision avoidance, collision notification, driver assistance, etc., those of
intelligent infrastructure include various roadside traffic operations and management applications,
such as freeway management systems, arterial management systems, crash prevention and safety
systems, road weather information systems, traffic incident management, transit management,
emergency management, traveler information systems, commercial vehicle operations,
intermodal freight management, etc. Various ITS applications are invented and deployed to
fulfill U.S. DOT’s ITS goals, such as safety, mobility, efficiency, productivity, energy and
environmental impacts, and customer satisfaction.

Costs and Benefits of MDOT ITS Deployments
12
Michigan’s ITS deployment efforts date back to 1995, when MDOT initiated the design
and build of ITS infrastructure in southeast Michigan. The initiation was considered the largest
ITS deployment of its kind in the world at that time. Since then, MDOT has deployed many ITS
devices, mostly in the southeast region of Michigan. MDOT’s rigorous efforts led to developing
strategic goals and objectives. According to the MDOT’s ITS strategic plan, the ITS mission is
as follows:
“Develop and sustain a program at MDOT to improve safety, operational performance
and integration of the transportation system utilizing Intelligent Transportation System
technologies for economic benefit and improved quality of life.”
The MDOT strategic plan is executed by regional ITS architectures and deployment plans.
MDOT has also invested many advanced ITS technologies, such as Connected Vehicles, to
maintain leadership in this area as a home state of automobile industry. While many new ITS
technologies are being developed and tested worldwide, advanced traffic control and information
systems have been deployed to help Michigan motorists and travelers. MDOT’s ITS deployment
plans include applications in freeway traffic management systems, arterial management system,
advanced public transportation systems, freeway service patrols, smart work zone, road weather
information systems, and emergency traffic management. MDOT has invested significantly in
ITS deployments across the state over the last six years. Michigan's traffic safety and operations
have been improved by deploying these ITS technologies.
As Peter Ferdinand Drucker, a social ecologist, stated that, “You cannot manage what you
cannot measure”, performance measures are very important. Likewise, the U.S. Department of
Transportation (DOT) emphasizes the importance of performance-based planning in the latest
authorization of transportation bill, Moving Ahead for Progress in the 21st Century Act (MAP-
21). One of the key emphases in MAP-21 is performance measurement. Under MAP-21,
performance management is emphasized as a means towards more efficient investment through
performance-based planning and programming (FHWA, 2012). In fact, due to an increasingly
competitive fiscal environment, transportation agencies around the country are being asked more
than ever to justify their programs and expenditures. ITS investments are not an exception from
this requirement. However, the benefits of Michigan ITS have not been fully quantified yet.

Costs and Benefits of MDOT ITS Deployments
13
Accordingly, MDOT is lacking in response to inquiries from public and legislators on the costs
and benefits of ITS deployments, despite its great benefits to Michigan travelers. Therefore,
there are needs for reviewing and quantifying costs and benefits of MDOT’s ITS investments.
1.2 Research Objectives
The main objective of this research is to review and summarize the benefits and costs of ITS
deployed by the Michigan Department of Transportation. In order to achieve this main objective,
this research includes the following sub-objectives:
1) developing a ITS database including all ITS devices deployed by region
2) reviewing costs associated with ITS deployment
3) collecting all performance measures reported by each Traffic Operation Center (TOC)
4) analyzing traffic incidents and clearance time
5) quantifying benefits from ITS deployed by MDOT
1.3 Research Scope and Overview
There are many types of ITS supported by MDOT, including Connected Vehicle Systems.
However, this research does not include connected vehicle systems in its scope. The focus of this
research is to analyze the costs and benefits associated with ITS devices deployed on Michigan
highways. To accomplish the objectives of this research, the following tasks will be performed:
Task 1: Literature Review
Task 2: Reviewing MDOT’s ITS Deployments
Task 3: User Perception Survey
Task 4: Collecting Performance Data
Task 5: Selection of Analysis Tool and Modeling ITS Corridors
Task 6: Cost and Benefit of ITS System
Task 7: Cost and Benefit of Individual ITS Devices
Task 8: Recommendations and Final Report
Figure 1-1 depicts the connectivity of the eight tasks and the overall flow of this research.

Costs and Benefits of MDOT ITS Deployments
14
Figure 1-1: Overall Research Approach

Costs and Benefits of MDOT ITS Deployments
15
Chapter 2 Literature Review
2.1 ITS Cost-Benefit Evaluation Methods
Various methods have been utilized in the past to evaluate ITS deployments, both pre- and post-
implementation. Examples of these approaches include traditional cost-benefit analysis (CBA),
multi-criteria analysis (MCA), sketch-planning, before-and-after studies, simulation studies,
“willingness-to-pay” analyses and cased-based reasoning techniques. The discussion that follows
will summarize past research which employed these methods.
2.1.1 Traditional Cost-Benefit Analysis
The traditional cost benefit analysis is the most utilized approach by researchers and
transportation agencies in assessing the impact of ITS deployments on traffic operations
performance. However, the method has stagnated and has not been refined or improved for
several decades (Leviäkangas et al., 2002). Regardless, some researchers continue to believe that
CBA potentially represents the best method due to a lack of viable alternatives. Travel time
savings are often the most important and relevant benefit gleaned by CBA. A key limitation of
CBA is its inherent failure to analyze “risk-return tradeoff,” which results in decision makers
choosing against the alternative with acceptable Cost/Benefit (C/B) ratio if the probability for
excessive cost is high (Yang et al., 2007). Other limitations include the inability to quantify the
value of ITS information dissemination to the user (or system) or the tendency of the user to alter
travel behavior (Juan et al., 2006).
2.1.2 Multi-Criteria Analysis
The MCA is also commonly referred to as the analytic hierarchy process (AHP). A key
distinguishing factor of MCA compared to CBA is that priority is placed on investment
efficiency rather than C/B ratio (Leviäkangas et al., 2002). Some benefits of MCA include the
allowance for analysis of criteria not easily quantified monetarily (Juan et al., 2006), decision
makers can evaluate ITS alternatives based on preferences, and criteria outside the range of CBA
can be included. The disadvantages of AHP include the subjectivity of decision makers and it
must be performed on case-by-case basis, thus stifling transferability (Leviäkangas et al., 2002).

Costs and Benefits of MDOT ITS Deployments
16
2.1.3 Sketch-Planning
Sketch-planning is a spreadsheet-based or GIS-based tool that produces order-of-magnitude
estimates of transportation and land-use demand and impacts. It is touted for its low cost and
reduced complexity. Typical applications include rural and suburban areas or fast-growing areas,
as well as cities, counties, regional planning agencies and state agencies. Sketch-planning utilizes
a framework of statistical relationships and rules that evaluate the ITS system on the basis of
characteristics and measures of effectiveness (Berger et al., 2007). Recently, sketch-planning has
been incorporated in a Florida DOT (FDOT) evaluation to determine environmental benefits as a
result of ITS (Hadi et al., 2008). For statewide ITS sketch-planning, two applications are
typically utilized: SCReening for Intelligent Transportation Systems (SCRITIS) and the ITS
Deployment Analysis System (IDAS). Of the two resources, SCRITIS requires less detail
compared to IDAS (Peng et al., 2000).
IDAS is a FHWA-developed software with a higher cost and complexity compared to
most other sketch-planning tools (Peng et al., 2000). It is designed to be a near-term ITS sketch-
planning solution. IDAS can predict relative costs and benefits for more than 60 types of ITS
investments. Input variables include travel time and speed, freeway throughput, number of
accidents, emissions and fuel consumption, while output variables include travel time reliability,
mobility, safety, emissions and fuel consumption. Output variables are calculated based on user-
provided estimates of input variables. It can be used for alternatives analysis (He et al., 2010).
IDAS analyses often show a high degree of uncertainty in ITS benefits and costs (Yang et al.,
2007). Thus, it is not suitable for providing detailed and accurate estimates of ITS benefits.
2.1.4 Questionnaire Surveys
The most commonly utilized questionnaire design used by researchers to analyze motorist
receptiveness to ITS is the stated preference approach. Stated preference questionnaires require
the respondent to indicate how he/she would react to various scenarios or the degree of value
placed in the topic of interest by offering a choice between limited, mutually exclusive
alternatives. Stated preference surveys have been used by researchers to investigate the impact of
ATIS on trip changes (Tay et al., 2010; Richards et al., 2007; Abdel-Aty et al., 1997; Bifulco et
al., 2014; Razo et al., 2013), in various non-recurrent traffic conditions (Muizelaar et al., 2007),

Costs and Benefits of MDOT ITS Deployments
17
on acceptance of transit (Abdel-Aty et al., 2001) and in emergency situations (Robinson et al.,
2011). The primary limitation of stated preference surveys is the overstatement of travel
behaviors (Richards et al., 2007; Peng et al., 2004).
2.1.5 Other Methods
Before-and-after studies represent another commonly used approach that attempts to
comprehensively summarize ITS benefits in a practical sense (He et al., 2010). Such studies can
evaluate the following changes as a result of ITS deployment: traffic capacity, human resources,
reduction of traffic accidents and duration and frequency of congestion (He et al., 2010; Chen et
al., 2010). Before-and-after studies require field measurement data from devices, such as vehicle
detectors, before and after ITS device deployment.
Another frequently employed evaluation method is the simulation study. These studies
are more suitable for urban roadways where traffic signals and congestion are more frequent
(RITA, 2011). ITS evaluation using simulation has been used to evaluate ICM deployment, crash
prevention and safety, work zone management, system impact of TMC, and the impact of
traveler information.
“Willingness-to-Pay” studies have been conducted to evaluate the “Countdown” real-
time information system on London transit. Juan et al. (2006) performed a real-time survey on
transit vehicles to measure user willingness to pay an additional amount while riding the bus.
Case-based reasoning (CBR) is an artificial intelligence technique based on the premise
that humans typically solve a new problem by adapting and revising a solution to a previous
problem. The approach establishes a “case-base” of previous ITS deployments under different
traffic conditions with which to compare against. Sadek et al used CBR in conjunction with a
DTA model to evaluate the benefits of diverting traffic through the use of VMS (Sadek et al.,
2003).
2.2 ITS Costs and Benefits by Device
In September 2011, the US DOT Research and Innovative Technology Administration (RITA)
released a report titled, “Intelligent Transportation Systems Benefits, Costs, Deployment, and
Lessons Learned Desk Reference: 2011 Update”. The report summarizes a collection of

Costs and Benefits of MDOT ITS Deployments
18
databases known as the “ITS Knowledge Resources”, which track developments regarding
evaluation of deployed ITS nationwide. The discussion that follows is a comprehensive synopsis
of the report contents concerning freeway traffic management, arterial traffic management,
advanced public transit, smart work zones, road weather information systems and regional
parking management.
2.2.1 Freeway Traffic Management
Freeway traffic management ITS applications consist of surveillance, ramp control, lane
management, special event transportation management, information dissemination, and
enforcement. Surveillance systems use vehicle detectors and cameras in conjunction with other
freeway management technologies. Closed circuit television cameras and other security
applications can be used to monitor important transportation infrastructure. The unit cost for a
CCTV ranges from $8,000 to $16,000 (RITA, 2011). Speed enforcement is conducted by
detector-activated CCTV feed, which records vehicles breaking the speed limit. Dynamic
message signs (DMS) and highway advisory radio (HAR) are used in freeway traffic
management for information dissemination and lane management. DMS is used in 86 of the
United States’ largest metropolitan areas (populations exceeding 1 million). The unit cost for a
DMS ranges $28,000 to $136,000, and $16,000 and $21,000 for a portable unit. In Grand
Canyon National Park, DMS and HAR were estimated to reduce 66,000 to 99,000 vehicle-miles
driven and save 2,600 to 28,000 gallons of fuel in 2008 (Briglia, 2009). HAR applications also
provide info on 21 percent of freeway miles in the largest metro areas in the US. The unit cost
for a HAR ranges from $15,000 to $36,000, and $4,000 to $8,000 for an HAR sign (RITA, 2011).
The SR14 traveler information system in Washington employs the use of HAR, with a total
system cost of $511,300 (Briglia, 2009). With respect to the stated ITS goals of safety, mobility,
efficiency, productivity, energy/environment, and customer satisfaction, lane management has a
positive impact on safety, while information dissemination has a positive impact on safety,
mobility, and customer satisfaction. Some benefit-cost ratios related to freeway traffic
management include 9.7:1 over 10 years for ICM deployment in San Diego, California and 14:1
to 39:1 for converting HOV lanes to HOT lanes in San Francisco, California (Cambridge
Systematics, 2008; Alexiadis et al., 2009).

Costs and Benefits of MDOT ITS Deployments
19
2.2.2 Arterial Traffic Management
Arterial traffic management ITS techniques include surveillance, traffic control, lane
management, parking management, information dissemination, and enforcement. As seen, there
is a considerable amount of overlap between ITS in freeway traffic management and arterial
traffic management, with many of the same technologies in deployment in both applications.
Surveillance of arterial streets can also be used to monitor security of critical infrastructure, as in
freeway management. 48 percent of signalized intersections in the country’s largest metro areas
in 2010 are monitored by surveillance, representing a 100 percent increase since 2000 (Richards
et al., 2007). Surveillance is shown to positively impact customer satisfaction.
In Monroe County, NY, CCTV and other forms of surveillance have been shown to
reduce incident validation times by 50-80 percent, for an estimated per incident time savings of
between 5 and 12 minutes (Bergmann Associates, 2006). Some unit costs of common
surveillance equipment used in ITS include $7.5K to $13.3K for inductive loops at intersections,
$14K for a remote traffic microwave sensor at an intersection, and $8K-$16K for CCTVs (RITA
2011). Deployment of CCTV cameras on arterial streets is seeing a moderate growth rate. The
cost to install and implement five CCTV cameras in Monroe County in 2005 was $55,860 per
camera. A lesson learned by the New York State Police in coordination with the New York
Department of Transportation was to use CCTV at signalized intersections for monitoring
congestion and adjusting signal phases. CCTV can also be used as a roadside subsystem in lane
management.
DMS are often used in arterial traffic management systems to share information collected
with road users in an effort to smooth traffic flow during special events. DMS also has parking
management applications in its ability to show parking space availability, as demonstrated by the
smart parking system in deployment in San Francisco (Rodier, 2006). Similar to freeway traffic
management, DMS is often used in information dissemination, with permanent DMS, portable
DMS, and HAR being used on 2 percent of arterial street miles in the largest cities (RITA, 2011).
DMS costs for arterial applications are the same as in freeway applications. HAR does not enjoy
as high of a level of deployment in arterial ITS as compared to freeway ITS. With respect to the
ITS goals outlined in the Freeway Traffic Management section, parking management has a
positive impact on efficiency and a substantial positive impact on mobility and customer

Costs and Benefits of MDOT ITS Deployments
20
satisfaction. Information dissemination has a positive impact on mobility and a substantial
positive impact on productivity. Some example B/C ratios of arterial ITS include 461.3:1 in
Virginia and 57:1 in Pennsylvania (Park et al., 2010; Southwestern Pennsylvania Commission,
2011).
2.2.3 Advanced Public Transit
Despite the unfavorable economic condition of the past 10 years, the transit industry has grown
by over 20% during this time-span (RITA, 2011). Accordingly, transit agencies continue to
deploy ITS technology at a rapid rate. From 2000-2010 in the country’s biggest cities, the
percentage of fixed route buses equipped with AVL increased from 31 percent to 66 percent, the
percentage of demand responsive vehicles with CAD increased from 28 percent to 88 percent,
and the percentage of fixed route buses equipped with electronic real-time monitoring systems
increased from 15 percent to 35 percent (RITA, 2011). ITS strives to increase passenger
throughput by offering a safer and more reliable service due to systems that combine Automated
Vehicle Location (AVL) and Computer Aided Dispatch (CAD), automatic passenger counters
(APC), electronic payment and smart card systems, and real time information. AVL and CAD
systems reduce passenger wait times by improving transit reliability. Vehicle-to-dispatch
communication systems realize security and incident management benefits by facilitating quicker
response times. Real time information on vehicle location and schedule allows agencies to
provide transit signal priority, which improves trip and schedule reliability. Multi-Modal Trip
Planning Systems (MMTPS) allow passengers to confirm schedule information, improve transfer
coordination, and reduce wait times through their ability to provide public access to bus location
data and schedule status information.
Two of the primary ITS programs from the mid-2000s are beginning to demonstrate
positive impacts, namely the Mobility Service for All Americans (MSAA) and Integrated
Corridor Management (ICM). With regard to the impact of advanced public transit ITS on the
primary goals, operations and fleet management is shown to have a positive impact on mobility,
productivity, and customer satisfaction, and a substantial positive impact on efficiency and
energy/environment. Information dissemination has a positive impact on customer satisfaction.
Transportation demand management has a positive impact on productivity and a substantial

Costs and Benefits of MDOT ITS Deployments
21
positive impact on customer satisfaction. Positive impacts have been demonstrated on the goals
of safety, productivity, and customer satisfaction through the safety and security public transit
ITS applications, such as the advanced software and communication technology used to enable
data and voice to be transferred between TMCs (Transportation Management Centers) and transit
vehicles.
Some costs associated with ITS in public transit include a capital cost of between $1K
and $4K per mobile data terminal, with installation costs between $500 and $1,000. AVL/CAD
systems have a unit cost of between $8K and $10K per vehicle (RITA, 2011). A few lessons
were learned from deployment of ITS in public transit applications, including: a need to plan for
the semi-annual evolution of communications technologies, foresee and prepare against the
challenges of operating and maintaining a reliable TSP system (installation, calibration, and
testing of TSP emitters), and improving general transit safety and security through video
assessment (RITA, 2011).
2.2.4 Smart Work Zones
ITS is used in smart work zones (SWZ) as temporary traffic or incident management systems.
These systems can be stand-alone or supplement existing systems during construction. ITS
deployments in smart work zones govern travel speeds, disseminate information regarding lane
configuration changes or travel times and delays, hasten incident detection and allocate pertinent
incident management, and guide traffic flow during full road closures. Smart work zones
improve driver behavior through dynamic lane merger systems. SWZs which include speed
monitoring displays have been shown to reduce vehicle speeds by 4-6 MPH and reduce speeding
likelihood by 25-78 percent (RITA, 2011). 39 percent of TMCs on freeways and 34 percent of
TMCs on arterials are deploying SWZs, according to a 2010 survey. SWZs display positive
impacts on efficiency, productivity, and customer satisfaction, and substantial positive impact on
safety and mobility.
With respect to the mobility impact, a work zone simulation of four-to-two lane closure
in Washington D.C. revealed that a VSL configuration resulted in mean savings of 267 vehicle-
hours of delay (Fudala et al., 2010). While in Texas, work zone traffic management systems
diverted an average of 10% of mainline traffic to alternate routes (Luttrell, 2008). With respect to

Costs and Benefits of MDOT ITS Deployments
22
the safety impact, in Kalamazoo, MI, activation of a Dynamic Lane Merger System in work
zones reduced the number of forced mergers by seven times and the number of dangerous
mergers by three times (Luttrell, 2008). With respect to the customer satisfaction impact, in
Little Rock, Arkansas, a survey showed that 82% of drivers stated that an Automated Work Zone
Information System enhanced their reaction to slow or stopped traffic (Krechmer, 2010). In the
United States, a study of 17 states determined the cost of work zone ITS to range from $100K to
$2.5 million, with the majority costing in the $150K-$500K range (RITA, 2011). A lesson
learned about SWZ is the necessity to coordinate the schedules for ITS deployment and roadway
construction through involvement of the construction contractor.
2.2.5 Road Weather Information
The estimated cost of weather-related crashes in the US ranges from $22-$55 billion annually,
with 24% of all crashes occurring during poor weather conditions from 1995-2008 (RITA, 2011).
Recognition of the importance in mitigating the impact of weather on transportation systems
prompted the creation of the Road Weather Management Program (RWMP) at the Federal Level.
The RWMP develops weather related ITS systems. Environmental Sensor Stations (ESS)
represent the standard method to monitor road conditions in the Road Weather Information
System (RWIS), and the recently developed Clarus web-interface collects and distributes ESS
data across North America for all interested parties. The RWMP also developed the Maintenance
Decision Support System (MDSS), a decision support tool that automatically integrates weather
model information with a road model, rules of practice, and maintenance resource data.
Integration of weather information into agency TCMs is known as Weather-Responsive
Traffic Management (WRTM). WRTM operates under three specific strategies: advisory, control,
and treatment. Information dissemination falls under the “advisory” strategy, and includes fog
warnings on DMS and indicating flooded routes. With respect to the “control” strategy, variable
speed limits are used to reduce speed limits and ITS is used to modify traffic signal timing based
on pavement conditions reported by ESS. The MDSS is commonly employed with regard to the
“treatment” strategy. In addition, agencies install winter maintenance vehicles with AVL systems
and mobile sensors to aid in determining pavement conditions and correct treatment application
rates (RITA, 2011).

Costs and Benefits of MDOT ITS Deployments
23
Within RWIS, surveillance, monitoring, and prediction systems have a positive impact on
safety and mobility, and a substantial positive impact on customer satisfaction. Information
dissemination (advisory strategy) positively impacts safety and has a substantial positive effect
on customer satisfaction. Traffic control (control strategy) has a positive impact on safety.
Response and Treatment (treatment strategy) has a positive impact on safety and productivity,
and a substantial positive impact on energy/environment. Costs of RWIS vary widely, dependent
on system scope, complexity, and the specific technology in use. In Michigan, RWIS
demonstrated a region-dependent B/C ratio of 2.8:1 to 7:1 (Krechmer, 2010). Lessons learned
about RWIS deployments include: investing in accurate road weather information to guarantee
greater usage and lower costs, and usage of a self-evaluation guide and integration planning
process to foster improved perception of the benefits of RWIS integration to enhance TMC
performance (RITA, 2011).
2.2.6 Regional Parking Management
Regional parking management is typically deployed in urban areas or at airports and outlying
transit stations. ITS is used to monitor open parking spaces and provide the information to
drivers in an effort to reduce traveler frustration and congestion experienced while discovering a
parking space. The proportion of agencies making use of parking management systems increased
from 5% in 2000 to 8% in 2010 (RITA, 2011). An example of ITS technology used for parking
management is electronic parking fee payment, which uses various forms of technology
(magnetic cards, transponders, etc.) to simplify payment and lower congestion at entrances and
exits. Regional parking management in the form of a Smart Parking system in San Francisco has
shown to impart a positive impact on mobility (decrease average commute time by 5% for 50-
minute commute and reduce total vehicle miles traveled by 9.7 miles per month) and customer
satisfaction (30% of commuters would prefer an expansion of Automated Parking Information
Systems), as well as a substantial positive impact on efficiency (Rodier, 2006). Some unit costs
associated with a Parking Management System include $1K-$3K for entrance/exit ramp meters,
$1K-$3K for tag readers, $10K-$15K for the billing/pricing database and software, and $16K-
$35K for the parking monitoring system (RITA, 2011).

Costs and Benefits of MDOT ITS Deployments
24
2.3 Similar Traffic Operation Centers in Other States
In an effort to compare MDOT’s ITS deployments to other states, MDOT recommended a
number of metropolitan areas to evaluate against the three state TOCs: SEMTOC, WMTOC and
STOC. The recommended TMCs were judged to be most similar to MDOT TOCs on the basis of
total miles of ITS coverage and percentage of ITS device coverage by device. With respect to
SEMTOC, the cities included St. Louis, MO, Miami, FL, Kansas City, MO and Atlanta, GA.
WMTOC was compared with the Collinsville, IL District 8 CommCenter, while the Lansing
STOC was most similar to the Milwaukee, WI STOC. A discussion of literature review
concerning ITS deployments in these similar locations by MDOT TOC follows.
2.3.1 SEMTOC
As mentioned previously, SEMTOC, located in Detroit, was determined to be most similar to the
St. Louis, MO “Gateway Guide” TMC, the Miami, FL “SunGuide” TMC, the Kansas City, MO
“KC Scout” TMC and the Atlanta, GA TMC. Among these four cities, analysis showed that the
St. Louis Gateway Guide was most congruent with the Detroit SEMTOC, on the basis of total
miles of ITS coverage as well as ITS device split, as shown in Table 2-1 on the following page.
A short summary of some of the cost-benefit evaluation performed on the Gateway Guide ITS
deployments follows.
VSL signs were installed on Interstate Loop I-270/I-255 to garner consistent speeds
during congestion and lower the closing speeds of incoming traffic. This freeway management
ITS deployment reduced the number of crashes by 4.5 to 8 percent (Bham, 2010). St Louis also
has a traffic incident management and freeway service patrol system known as “St. Louis
Motorist Assist”, which covers all freeway segments in the metro area. Analysis revealed that St.
Louis Motorist Assist reduced secondary crashes by 1,082 annually, with an estimated B/C ratio
of 38.25:1 (Sun, 2010). Operating costs of St. Louis Motorist Assist were $2,015,378 in 2008
and $2,075,839 in 2009 (RITA, 2011). St. Louis has also deployed arterial service patrols, most
notably during the “New I-64 Project”, demonstrating a B/C ratio of 8.3:1 and reduction in
yearly congestion costs of $1,034,000 (Ryan et al., 2009).

Costs and Benefits of MDOT ITS Deployments
25
Table 2-1: TOCs Similar to SEMTOC
Center SEMTOC Gateway
Guide
SunGuide
TMC KC Scout
Atlanta
TMC
Location Detroit, MI St Louis, MO Miami, FL Kansas City,
MO Atlanta, GA
Total Miles of ITS
Coverage 200 200 215 150 230
Total ITS Devices 452 676 676 649 825
% Cameras 37.2% 44.4% 35.2% 39.6% 66.7%
% DMS 19.2% 18.5% 16.3% 9.2% 13.3%
% Vehicle Detectors 43.6% 29.6% 45.3% 43.6% 20.0%
% Ramp Meters 0.0% 0.1% 3.3% 4.5% 0.0%
% Dynamic
Trailblazers 0.0% 0.0% 0.0% 0.0% 0.0%
% Travel Time Signs 0.0% 0.0% 0.0% 0.0% 0.0%
# of ITS Per Mile
Coverage 2.3 3.4 3.1 4.3 3.6
Table 2-2: TOCs Similar to WMTOC
Center WMTOC District 8 CommCenter
Location Grand Rapids, MI Collinsville, IL
Total Miles of ITS Coverage 130 51
Total ITS Devices 213 127
% Cameras 31.5% 38.6%
% DMS 12.2% 6.3%
% Vehicle Detectors 56.3% 55.1%
% Ramp Meters 0.0% 0.0%
% Dynamic Trailblazers 0.0% 0.0%
% Travel Time Signs 0.0% 0.0%
# of ITS Per a Mile Coverage 1.6 2.5

Costs and Benefits of MDOT ITS Deployments
26
2.3.2 WMTOC
The MDOT WMTOC is located in Grand Rapids, MI. The TOC manages 130 miles within the
MDOT Grand Region with approximately 2.1 ITS devices per mile of coverage. The District 8
CommCenter in Collinsville, IL was found to be the most similar TMC to WMTOC, as shown in
Table 2-2 on the following page. However, no previous research conducted on ITS deployment
evaluation was found concerning the District 8 CommCenter in Collinsville.
2.3.3 STOC
The STOC, located in Lansing, MI, manages the rest of the 133 statewide ITS deployments
outside of the Grand and Metro MDOT regions, with a primary focus on the University region.
A comparative analysis determined that the STOC in Milwaukee, WI was most similar to the
Lansing STOC on the basis of ITS device split, as shown in Table 2-3. In Milwaukee, automatic
vehicle location (AVL) contributed to a 28 percent reduction in buses behind schedule by greater
than one minute (RITA, 2011).
Table 2-3: TOCs Similar to STOC
Center STOC STOC
Location Lansing, MI Milwaukee, WI
Total Miles of ITS Coverage N/A N/A
Total ITS Devices 129 918
% Cameras 31.8% 33.6%
% DMS 28.7% 8.9%
% Vehicle Detectors 39.5% 41.2%
% Ramp Meters 0.0% 15.7%
% Dynamic Trailblazers 0.0% 0.7%
% Travel Time Signs 2.3% 0.0%
# of ITS Per a Mile Coverage N/A N/A

Costs and Benefits of MDOT ITS Deployments
27
2.4 ITS Benefits
MDOT’s strategic goals in ITS are to improve safety, mobility, efficiency, productivity, energy
and environmental impacts, and customer satisfaction. ITS applications deployed to attain these
goals include two components: intelligent infrastructure and intelligent vehicles. Intelligent
vehicle systems consist of collision avoidance, collision notification and driver assistance.
Intelligent infrastructure is primarily concerned with roadside traffic operations and management
applications, such as freeway management systems, arterial management systems, crash
prevention and safety systems, RWIS, traffic incident management, transit management,
emergency management, traveler information systems, commercial vehicle operations,
intermodal freight management, etc. A number of ITS evaluation studies have been conducted in
Michigan, a few of which will be summarized below.
In Oakland County, signal retiming provided a 1.7-2.5 percent reduction in carbon
monoxide emissions, 2.7-4.2 percent reduction in hydrocarbon emissions, and a 1.9-3.5 percent
reduction in nitrogen oxide emissions (Halkias et al., 2004). A pre-deployment CBA of RWIS
performed by Krechmer et al. (2010) revealed a rural, region dependent B/C ratio ranging from
2.8:1 - 7.0:1, due to reduced travel times, crash reduction and lowered operating costs. A
summary of the costs in the four regions under analysis is shown in the table below (includes
2007 annualized capital cost and annual O&M costs).
Table 2-4: Costs and Benefits of Michigan Road Weather Information Systems
Region ESS Quantity Capital O&M B/C Ratio
North 50 $4,020,000 $460,000 2.8
Bay 15 $2,060,000 $256,000 7
Grand ? $2,272,000 $233,000 5.1
Superior 34 $3,463,000 $358,000 3.4
Source: Krechmer et al., 2010
Luttrell et al. (2008) found that, in Kalamazoo, smart work zones reduced the frequency of
forced merges and dangers merges by seven times and three times, respectively. The Flint Mass

Costs and Benefits of MDOT ITS Deployments
28
Transportation Authority established a back-up emergency system at an estimated capital
investment of $500,000, with $50,000 annual operations and maintenance costs (IBI Group,
2005). Sayer et al. (2011) performed a behavioral analysis on 108 volunteers who drove vehicles
with crash warning systems installed, and found that eight of the volunteers stated that the
system prevented a crash, with 72 percent of the drivers indicating a preference to have the
system installed in their personal vehicles. A 1999 U.S. DOT report (1999) investigated adaptive
cruise control in a Michigan field evaluation and reported a reduction of rear-end crashes by 8 to
23 percent. Gates et al. (2012) and Hedden et al. (2011) examined the utilization frequency of
various travel information sources in Michigan (including DMS, radio, television, Mi Drive,
other websites, etc.), and found very low user familiarity with Mi Drive: 22.5 and 19 percent,
respectively.
Kimley Horn (2010), in association with Cambridge Systematics and HNTB, prepared
the “I-75, US-127, I-94 Triangle ATIS Plan” in May 2010, evaluating traffic conditions and
incident issues on these Michigan freeways. The report used the Michigan statewide travel
demand model, in conjunction with IDAS, to evaluate ITS alternatives. ITS projects were
evaluated in areas that include the North, Bay, Southwest, University and Metro regions. A
“spectrum” approach was used to analyze the statewide ITS plan, using criteria that consisted of
existing volumes, future volumes and crash rates. Finally, the report assigned a deployment plan
based on the results of the spectrum to provide information on alternate routes in an effort to
reduce congestion and incidents.
The Washington State DOT (WSDOT) published “The 2014 Corridor Capacity Report”
in October 2014 (WSDOT, 2014). The report comprehensively summarizes a multimodal
analysis of Washington’s highway system performance, including a cost-benefit analysis of
WSDOT’s incident management program – “Incident Response” (IR). As of 2013, WSDOT
operated 933 CCTVs, 279 DMSs, 109 RWISs and 767 traffic data stations. IR managed 43,088
incidents in 2013 with an average clearance time of 12.7 minutes. The report estimated $67.4
million in economic benefit as a result of IR in reducing incident-related congestion and
secondary incident prevention, resulting in a 15:1 B/C ratio. The estimated savings due to
incident-related congestion reduction and secondary crash prevention were $37.6 million and
$29.8 million, respectively.

Costs and Benefits of MDOT ITS Deployments
29
URS Corporation published “Task Order 5.2: Benefits Analysis for the Georgia
Department of Transportation NaviGAtor Program” for the Georgia DOT in August 2006 (URS,
2006). The report summarized the methodology and findings of a sweeping cost-benefit analysis
performed for the GDOT incident management program –“NaviGAtor”. Benefits under
consideration included mobility, environmental, safety and customer satisfaction. Similar to the
WSDOT report, the mobility benefit provided by incident management was the total savings in
incident-delay. Also like the WSDOT analysis, the safety benefit was wholly provided by the
reduction in secondary crashes. In total, NaviGAtor provided an estimated $187,228,535.00 in
estimated cost savings, resulting in an annual B/C ratio of 4.4:1.
Chou and Miller-Hooks (Chou, 2009) utilized a simulation-based analysis to conduct a
B-C analysis of the New York state freeway service patrol – “Highway Emergency Local Patrol”.
Simulation scenarios were developed varying incident type by number of lanes (or shoulder)
blocked, traffic volume, and incident duration reduction to determine the savings in travel delay,
fuel consumption and emissions. On these measurements alone, the study computed a B/C ratio
of 2.68:1, assuming a $40.00/truck-hour operating cost rate. Khattak and Rouphail (Khattak,
2004) assessed the benefits provided by Incident Management Assistance Patrols (IMAP) on
North Carolina freeways. The research focused on creation of a decision-support tool for
determining highest priority locations for IMAP dispatch based on incident/crash data and
freeway traffic volume. However, in the process of developing the tool, Khattak and Rouphail
estimated a 4.3:1 and 3.5:1 B/C ratio for deploying IMAP in Raleigh and Asheville, respectively.
The benefits in this study were conservatively estimated on incident-delay reduction alone.
Similarly, Moss (Moss, 2012) developed a benefit-cost model for incident management in
Knoxville, TN using incident-delay savings provided by incident management based on traffic
sensor travel time data and Tennessee DOT incident logs. Moss estimated a B-C ratio of 8.5:1.
Ozbay et al (Ozbay, 2009) utilized the Rutgers Incident Management System (RMIS), a traffic
simulation used to evaluate incident management performance, on the South Jersey highway
network to estimate the benefits provided by DMS and FSP. The study found that the impact of
DMS in diverting traffic resulted in a B/C ratio of 9.2:1, while the positive effect of FSP in
reducing incident duration resulted in a B/C ratio of 3.9:1. Chowdhury et al (Chowdhury, 2007)
at Clemson University published the “Benefit Cost Analysis of Accelerated Incident Clearance:
Costs and Benefits of MDOT ITS Deployments
30
Final Report” in April 2007 for the South Carolina DOT. The study employed traffic simulation
to conduct a benefit-cost analysis of the impact of various ITS applications on accelerated
incident clearance for both motorists and the environment. Algorithms were developed for use in
the Paramics microsimulation software to model various incident detection, response and
clearance strategies. Ultimately, B-C ratios of 11:1, 12:1 and 7:1 were determined for FSP,
traffic cameras and traffic sensors, respectively.
2.5 Findings from Literature Review
Various methods were described to perform benefit-cost evaluations. These include, but are not
limited to, traditional B-C analysis, multi-criteria analysis, sketch-planning, questionnaire
surveys, and others. The traditional CBA approach is most commonly utilized, but suffers from
limitations such as inability to analyze risk-return tradeoff, the value of ITS information
dissemination and tendency of the user to alter travel behaviors. The multi-criteria analysis
accounts for risk-return tradeoff by placing priority on investment efficiency rather than raw B/C
ratio, while questionnaire surveys can return missing information on user benefits obtained from
information dissemination and alterations to travel behavior as a result of ITS.
With regards to freeway traffic management, ITS benefits include positive impacts on
safety, mobility and customer satisfaction. Concerning arterial traffic management, ITS has a
positive effect on efficiency, mobility, customer satisfaction and productivity. Advanced public
transit benefits include safety, mobility, productivity, customer satisfaction, efficiency and
energy/environment. Smart work zones display positive impacts on efficiency, productivity,
customer satisfaction, safety and mobility. Road weather information systems have proven
beneficial in customer satisfaction, safety, productivity, and energy/environment. While regional
parking management improves mobility and customer satisfaction.
MDOT TOCs were compared against other nationwide TOCs on the basis of total miles
of ITS coverage and percentage of ITS device coverage by device. SEMTOC was most similar to
the St. Louis, MO “Gateway Guide” TOC, WMTOC was most similar to the Collinsville, IL
“District 8 CommCenter” and STOC was most similar to the Milwaukee, WI “STOC”. A
summary of B/C ratios reported by other studies is included in Table 2-5 on the following page.

Costs and Benefits of MDOT ITS Deployments
31
Table 2-5: Example B/C Ratios from Other Studies
ITS Application Location B/C Ratio Source
Freeway Traffic
Management
San Diego 9.7:1 Briglia, 2009
San Francisco 14:01 Cambridge Systematics, 2008
San Francisco 39:1 Alexiadis et al, 2009
Arterial Traffic
Management
Virginia 461.3:1 Park et al, 2010
Pennsylvania 57:1 Southwestern Pennsylvania
Commission, 2011
Road Weather
Information
Michigan 2.8:1 - 7:1 Krechmer, 2010
Incident Management St. Louis 38.25:1 Sun, 2010
St. Louis 8.3:1 Ryan et al, 2009
Washington 15:01 WSDOT, 2014
Georgia 4.4:1 URS, 2006
New York 2.68:1 Chou et al, 2009
North
Carolina
4.3:1 -
3.5:1
Khattak et al, 2004
Tennessee 8.5:1 Moss, 2012
New Jersey 3.9:1 Ozbay et al, 2009
South
Carolina
11:1 Chowdhury et al, 2007
DMS-Specific New Jersey 9.2:1 Ozbay et al, 2009
CCTV-Specific South
Carolina
12:1 Chowdhury et al, 2007
Sensor-Specific South
Carolina
7:1 Chowdhury et al, 2007

Costs and Benefits of MDOT ITS Deployments
32
Chapter 3 MDOT ITS Deployments
3.1 MDOT ITS Deployments
3.1.1 Introduction
A GIS database was developed using ESRI ArcMAP 10 to spatiotemporally reference MDOT’s
past and current ITS inventory. Individual ITS device locations from 2006-2013 were aggregated
and summarized by TOC region as well as on a corridor segment-by-segment level within the
three TOC regions. The MDOT 2012 Sufficiency file was used as the basis for the corridor
database. The 2012 Sufficiency file contains information regarding the level-of-service and
related attributes of MDOT highway segments. In addition to the sufficiency information, data
regarding the following were summarized according to each sufficiency database segment:
ITS device presence from 2006-2013,
Yearly AADT and CADT from 2006-2013,
2010-2012 NAVTEQ minute-by-minute travel time and delay information,
2008-2013 vehicle accident frequency according to UD10 police crash reports,
2011-2013 statewide LCAR incident frequency and duration,
and 2007-2013 statewide TOC Call Log FCP assisted incidents.
The remaining portions of this chapter will summarize the 2006-2013 MDOT ITS deployment
and associated cost information by TOC region.
3.1.2 2006-2013 Statewide ITS Deployments
Three TOCs are currently in operation in the state of Michigan. A figure representing the TOC
coverage areas is shown on the following page. The Southeast Michigan Transportation
Operations Center (SEMTOC) operates 87 DMSs, 168 CCTVs and 197 MVDSs on
approximately 400 freeway miles in the Detroit “Metro” region, while the West Michigan
Transportation Operations Center (WMTOC) governs 26 DMSs, 67 CCTVs and 120 MVDSs on
roughly 45 freeway miles in the Grand Rapids “Grand” region. The Statewide Transportation
Operations Center (STOC) provides ITS management in regions outside the Metro and Grand
regions, overseeing 36 DMSs, 40 CCTVs and 50 MVDSs. Tables comparing ITS deployments
by device and MDOT region are shown below.

Costs and Benefits of MDOT ITS Deployments
33
Figure 3-1: MDOT TOCs
Table 3-1: MDOT ITS Devices (2013)
Region CCTV DMS MVDS TTS
Metro Region /BWB 168 87 197 0
Grand Region 67 26 120 0
Bay Region 9 7 26 0
North Region 0 2 0 0
Southwest Region 10 4 5 0
Superior Region 0 8 0 0
University Region 21 15 19 3
Total 275 149 367 3

Costs and Benefits of MDOT ITS Deployments
34
3.1.3 SEMTOC ITS Deployment
The SEMTOC has a rich history of ITS experience. The first ITS devices were installed in the
mid-1990s in the Metro Detroit area. Figure 3-3 shows the cumulative total ITS deployment in
SEMTOC from 2006 until 2013, by year of operation. As seen in Figure 3-3, between 2006 and
2008, no new ITS devices came into operation. Beginning in 2009, new devices came online,
culminating in the 2013 total ITS device count. The number of MVDS in operation more than
doubled between 2012 and 2013.
Figure 3-2: 2013 SEMTOC Device Locations

Costs and Benefits of MDOT ITS Deployments
35
Figure 3-3: 2006-2013 SEMTOC ITS Deployment
Table 3-2: 2006-2013 SEMTOC ITS Devices by Operation Date
Year CCTV DMS MVDS
2006 92 48 52
2007 92 48 52
2008 92 48 52
2009 106 48 52
2010 141 61 52
2011 141 62 75
2012 152 69 92
2013 168 87 197
0
20
40
60
80
100
120
140
160
180
200
2006 2007 2008 2009 2010 2011 2012 2013
Dev
ice
Qu
anti
ty
Year
Annual SEMTOC ITS Deployment
CCTV
DMS
MVDS

Costs and Benefits of MDOT ITS Deployments
36
Figure 3-4: 2013 SEMTOC Segment ITS Density by 2013 AADT
The figure above shows 2013 ITS (summation of DMS, CCTV and MVDS in operation)
density by 2013 AADT, according to 2012 MDOT Sufficiency database segments. A polygon
region was defined as “Detroit” according to the region displaying the highest concentration of
ITS devices in the SEMTOC region, as indicated by the black outline on
Figure 3-4. This region will be utilized in subsequent analysis when determining the
impact of ITS on performance metrics such as crash count, incident count, incident duration and
others. As seen, the “Detroit” region encompasses the majority of the entire SEMTOC region,
with actual representation of 1,173 of 1,411 total miles (83 percent). Additionally, the majority

Costs and Benefits of MDOT ITS Deployments
37
of 2013 in-operation ITS devices (449 of 452, or 99 percent) reside within the “Detroit” ITS
region.
Figure 3-5 shows the FCP routes (highlighted in green) in the SEMTOC region. As of
2013, the SEMTOC FCP patrols over 320 miles of freeway in Southeast Michigan.
Figure 3-5: SEMTOC FCP Routes

Costs and Benefits of MDOT ITS Deployments
38
3.1.4 WMTOC ITS Deployment
The WMTOC manages ITS deployment in the MDOT Grand Region, which consists of the city
of Grand Rapids and outlying rural areas. Figure 3-6 shows the WMTOC ITS locations of those
devices in operation during the year 2013 around and in the city of Grand Rapids. As shown in
Figure 3-7, ITS deployment was relatively minor in the Grand region until the year 2010, which
saw the introduction of 7 new CCTVs and 43 new MVDS into operation. Another significant
boost to the quantity of operable ITS devices occurred between 2012 and 2013, where the total
count of all ITS devices more than doubled.
Figure 3-6: 2013 WMTOC Device Locations

Costs and Benefits of MDOT ITS Deployments
39
Figure 3-8 shows the 2013 total in-operation ITS density by 2013 AADT according to 2012
MDOT Sufficiency database segments for the WMTOC region. The focus of the picture is
around the Grand Rapids metropolitan region, as a scarce amount of ITS devices exist outside
this area. Similar to the “Detroit” ITS polygon region defined for SEMTOC, a “Grand Rapids”
ITS region was defined for WMTOC, indicating the space containing the highest concentration
of ITS devices within the overall WMTOC region. However, unlike the SEMTOC case, the
“Grand Rapids” ITS region covers a relatively smaller portion of total analysis roadway miles,
only 264 miles of a total of 1285 WMTOC miles (20.5 percent). Similar to the SEMTOC
“Detroit” ITS region, the “Grand Rapids” ITS region represents the overwhelming majority (208
of 213, or 98 percent) of the total ITS devices in operation in 2013 in the WMTOC region.
WMTOC does not currently manage a FCP program, but plans to implement FCP on routes
shown in Figure 3-9.
Figure 3-7: 2006-2013 WMTOC ITS Deployment
0
20
40
60
80
100
120
140
2006 2007 2008 2009 2010 2011 2012 2013
Dev
ice
Qu
anti
ty
Year
Annual WMTOC ITS Deployment
CCTV
DMS
MVDS

Costs and Benefits of MDOT ITS Deployments
40
Table 3-3: 2006-2013 WMTOC ITS Devices by Operation Date
Year CCTV DMS MVDS
2006 10 7 0
2007 10 10 0
2008 10 10 0
2009 10 10 0
2010 17 10 43
2011 26 12 43
2012 26 12 43
2013 67 26 120
Figure 3-8: 2013 WMTOC Segment ITS Density by 2013 AADT

Costs and Benefits of MDOT ITS Deployments
41
Figure 3-9: WMTOC FCP Routes (Planned)
3.1.5 STOC ITS Deployment
The STOC operates out of Lansing, MI and oversees all ITS related operation and maintenance
outside of the Metro and Grand Regions, while also providing assistance and coordination with
the other two TOCs, when required. Key focus MDOT regions for the STOC include the
University, Bay and Southwest regions. Unlike the other two TOCs, STOC plays a key role in
acquiring and disseminating road weather related information through their management of
MDOT’s ESSs, as indicated in Figure 3-10. As seen in Figure 3-11, the STOC experienced a
rapid deployment of ITS functioning devices beginning in 2011. Also of note is the coming
online of 40 CCTVs between 2012 and 2013. The STOC region consists of 9,304 total 2012
MDOT Sufficiency database segment miles.

Costs and Benefits of MDOT ITS Deployments
42
Figure 3-10: 2013 STOC Device Locations
In Figures 11-13, selected STOC ITS regions are indicated with associated 2013 segment
ITS density. STOC Region 1, shown in Figure 3-12, is the stretch of I-94 between Kalamazoo
and Battle Creek, for a total of 340 2012 MDOT Sufficiency database roadway miles. STOC
Region 2, shown in Figure 3-13, covers a portion of I-96 between Howell and Brighton, for a
total of 180 2012 MDOT Sufficiency database roadway miles. Finally, Figure 3-14 indicates
STOC Region 3, which is a stretch of I-75 running from Flint to Bay City, for a total of 251 2012
MDOT Sufficiency database roadway miles. In total, the three STOC ITS regions hold 70 of the
129 ITS (CCTV, DMS, and MVDS) devices in operation in 2013 (54 percent), while only
representing 771 of the 9,304 roadway miles (8 percent). Similar to SEMTOC, the STOC
operates a FCP division, patrolling over 128 miles of freeway in the University Region (Figure
3-15) and plans to expand to the Lansing area (Figure 3-16) and the Southwest region (Figure
3-17).

Costs and Benefits of MDOT ITS Deployments
43
Figure 3-11: 2006-2013 STOC ITS Deployments
Table 3-4: 2006-2013 ITS Devices by Operation Date
Year CCTV DMS MVDS ESS TTS
2006 1 0 0 0 0
2007 1 0 0 0 0
2008 1 2 0 0 0
2009 1 2 0 0 0
2010 1 2 0 0 0
2011 1 6 24 12 0
2012 1 10 25 24 0
2013 41 37 51 24 3
0
10
20
30
40
50
60
2006 2007 2008 2009 2010 2011 2012 2013
Dev
ice
Qu
anti
ty
Year
Annual STOC ITS Deployment
CCTV
DMS
MVDS
ESS
TTS

Costs and Benefits of MDOT ITS Deployments
44
Figure 3-12: 2013 STOC Region 1 Segment ITS Density by 2013 AADT
Figure 3-13: 2013 STOC Region 2 Segment ITS Density by 2013 AADT

Costs and Benefits of MDOT ITS Deployments
45
Figure 3-14: 2013 STOC Region 3 Segment ITS Density by 2013 AADT

Costs and Benefits of MDOT ITS Deployments
46
Figure 3-15: STOC University Region FCP Routes
Figure 3-16: STOC Lansing FCP Routes (Planned)

Costs and Benefits of MDOT ITS Deployments
47
Figure 3-17: STOC Southwest Region FCP Routes (Planned)
3.2 Cost Analysis
A detailed cost analysis was conducted for this project. The majority of the task entailed a review
of the contractor bid tabulation and final project closeout documentation for 50 individual
Michigan Department of Transportation (MDOT) Intelligent Transportation Systems (ITS)
projects between 2006 and 2013, and a summary of the construction cost information. Several
road construction projects were also included in the analysis, because the projects included ITS
pay items.
In addition to the construction phase costs, costs associated with the maintenance and
operation of the ITS network were collected and assembled into the year-by-year summary. The
cost summary was further subdivided into three transportation operations center coverage areas
representing the following operations:
West Michigan Transportation Operations Center (WMTOC)
Southeast Michigan Transportation Operations Center (SEMTOC)
Statewide Transportation Operations Center (STOC)
3.2.1 ITS Construction-phase Costs
The construction-phase costs were subdivided into design, construction and system manager
categories.
Design Contract Costs
Design costs are costs paid by MDOT to bring an ITS project from the planning phase to a
biddable package of design plans and specifications. Generally, the costs are paid to an

Costs and Benefits of MDOT ITS Deployments
48
engineering consultant and the actual values of design contracts are not typically public
knowledge. For the purposes of this analysis, it was agreed with MDOT that an average design
cost for the ITS projects included in the analysis was approximately 15 percent of the project
construction costs.
Construction Contract Costs
Construction costs are costs paid by MDOT to bring an ITS project from design plans through
construction and into operation. The costs included in this category were determined from the
official bid tabulation for each project, which can be found on the MDOT website
(http://mdotcf.state.mi.us/public/bids/). For the road construction projects included in the
analysis, it was necessary to tabulate only the pay items related to the ITS sites.
Between 2006 and 2013, MDOT constructed several projects that were limited to the
communications infrastructure needed to support ITS devices, such as fiber optic cable
installation or wireless communications towers. These projects were included as a separate item
in the cost analysis.
Several projects were constructed under MDOT’s statewide Dynamic Message Sign
(DMS) procurement contract. For those projects, the cost of the DMS was tabulated separately
since the costs were paid directly by MDOT and not included in the bid tabulations. Based on
past guidance from MDOT, a cost of $53,000 per DMS was used for DMS purchased under the
statewide procurement contract. These costs were included as a separate item in the cost analysis.
Construction contract costs ranged between $63,000 and $6.952 million for the projects included
in this analysis.
System Manager Contract Costs
System Manager costs are costs paid by MDOT to a consultant to act as an agent of MDOT and
oversee the technical elements of the ITS construction project. Similar to the design contract
costs, the actual system manager costs are not typically public information. Based on past
projects, it was agreed with MDOT that an average system manager cost for the ITS projects
included in the analysis was approximately 8.5 percent of the construction costs.

Costs and Benefits of MDOT ITS Deployments
49
Construction Cost Summary
The cost analysis incorporated ITS projects that resulted in over 750 new ITS devices with a total
construction cost of more than $100 million. In addition to tabulating the combined total cost of
all devices for an average construction cost per device by TOC coverage area, the MDOT bid
tabulations were reviewed in order to determine an average construction cost by device type (i.e.:
DMS, CCTV, vehicle detector) and TOC coverage area. A summary of the construction costs by
device, device type and TOC coverage area is shown in Table 3-5 and Table 3-6.
Table 3-5: ITS Construction Costs (2006-2013)
SEMTOC WMTOC STOC Total
New CCTV Quantity 124 57 56 237
New MVDS Quantity 222 120 65 407
New DMS Quantity 50 20 45 115
New TTS Quantity 1 0 5 6
Total 397 197 171 765
ITS Construction Cost $45,728,333 $15,423,533 $20,506,649 $81,658,515
Estimated Design Cost $8,424,541 $2,359,045 $2,973,464 $13,757,050
Estimated System Manager Cost $4,938,524 $1,382,888 $1,743,065 $8,064,478
Total Construction Cost $59,091,399 $19,165,466 $25,223,178 $103,480,043
Table 3-6: Average Construction Costs per ITS Device (2006-2013)
TOC Coverage Area Overall
SEMTOC WMTOC STOC
New Device Quantity 397 197 171 765
Total Construction Cost $59,091,399 $19,165,466 $25,223,178 $103,480,043
Average Construction Cost
per Device $148,845 $97,287 $147,504 $135,268
Average Construction Cost
per CCTV $161,404 $97,906 $141,945 $141,535
Average Construction Cost
per Vehicle Detector $105,945 $76,064 $45,853 $87,538
Average Construction Cost
per DMS $308,848 $222,860 $307,037 $293,185
Average Construction Cost
per TTS $115,187 N/A $95,422 $98,717
Note) Costs for major supporting infrastructure (communication towers) were excluded.

Costs and Benefits of MDOT ITS Deployments
50
3.2.2 ITS Maintenance & Operations Costs
Maintenance and operation costs were subdivided into maintenance contract, Transportation
Operations Center (TOC) contract, Freeway Courtesy Patrol (FCP) contract (SEMTOC and
STOC coverage areas only), utility costs and MDOT staff cost categories.
Maintenance Contract Cost
MDOT contracts with a third party to provide ITS maintenance throughout the state, with the
exception of the Grand Rapids metro area and the RWIS devices. The City of Grand Rapids
provides ITS maintenance for MDOT ITS devices within the Grand Rapids metro area under a
municipal agreement with MDOT. RWIS devices are maintained by a separate contractor and
because RWIS were not included in this project, those costs were not analyzed.
The MDOT ITS Program Office (IPO) provided various data related to ITS maintenance
contract costs for 2006-2013. The data from the MDOT IPO was compared to data provided by
the MDOT Grand Region ITS staff in order to determine the estimated maintenance costs for
devices outside of the SEMTOC and WMTOC coverage areas. Data for the annual maintenance
contract cost for 2006 and 2007 was not readily available and was estimated to be $500,000 per
year.
MDOT Grand Region ITS staff provided the annual ITS maintenance contract costs with
the City of Grand Rapids for 2006-2013. In addition to the municipal agreement with the City of
Grand Rapids for ITS device maintenance, MDOT contracted with an engineering consultant,
beginning in 2013, to provide as-needed system manager services in the WMTOC coverage area,
which supports the maintenance of the ITS communications network. The following ITS
maintenance contract costs were used in the cost analysis:
$45,000 - $365,000/year – WMTOC coverage area, 2006-2013
$500,000 - $2.329 million/year – SEMTOC coverage area, 2006-2013
$105,000 - $415,000/year – STOC coverage area, 2010-2013
Operations Contract Cost
MDOT contracts with an engineering consultant to provide ITS operations and engineering
support at the WMTOC, STOC and SEMTOC. URS, the current ITS operations consultant at the

Costs and Benefits of MDOT ITS Deployments
51
three MDOT TOCs, provided ITS operations contract costs for 2006-2013. The following ITS
operations contract costs were used in the cost analysis:
$165,000 - $528,000/year – WMTOC coverage area, 2006-2013
$1.200 million - $2.023 million/year – SEMTOC coverage area, 2006-2013
$640,000 - $885,000/year – STOC coverage area, 2011-2013
Freeway Courtesy Patrol Contract Cost
MDOT contracts with a third party to provide Freeway Courtesy Patrol (FCP) services in the
SEMTOC and STOC coverage areas. The SEMTOC coverage area has had FCP for the entire
analysis period of 2006-2013, while the STOC coverage area has had FCP since 2013. The
MDOT IPO provided the FCP contract cost information for the SEMTOC and STOC coverage
areas. The following FCP contract costs were used in the cost analysis:
$1.933 million/year – SEMTOC coverage area, 2006-2013
$367,000/year – STOC coverage area, 2013
Utility Costs
Electrical power and communications utility costs for dynamic message signs (DMS) and closed-
circuit television (CCTV) cameras were provided by MDOT and included co-located vehicle
detectors. A separate electrical power cost was not used for vehicle detectors since stand-alone
sites are not prevalent in Michigan, resulting in an assumed under-estimation of the electrical
power costs. A limited number of travel time signs (TTS) were included in the cost analysis, and
were assumed to have electrical power costs approximately one-tenth that of a DMS. The
following average electrical utility costs were used in the cost analysis:
$103.70/month for DMS (includes co-located vehicle detector)
$105.34/month for CCTV (includes co-located vehicle detector)
$8.64/month for TTS
Since a separate electrical power cost was not estimated for vehicle detectors, as noted
above, a separate communications utility cost was estimated, resulting in an assumed over-
estimation of the communication utility costs. The monthly communications utility cost for a

Costs and Benefits of MDOT ITS Deployments
52
TTS was assumed to be comparable to a DMS. The following average communications utility
costs were used in the cost analysis:
$30/month for DMS
$115.68/month for CCTV
$30/month for vehicle detectors
$30/month for TTS
Utility costs were included in the cost analysis based on the number of devices installed
annually in the various TOC coverage areas. Utility costs for devices installed prior to the study
period of 2006-2013 were also included in the cost analysis, as the utility costs are cumulative
based on the number of devices in the MDOT ITS network.
MDOT Staff Costs
Several staff in each MDOT region are dedicated to supporting the MDOT ITS network. In lieu
of requesting individual annual salary information for each individual, the following average
salary was provided by MDOT for the purposes of the cost analysis:
$62,500/year, plus an additional 20 percent ($12,500) for benefits
The following staffing levels were assumed to be associated with the MDOT ITS
network during the cost analysis study period of 2006-2013. The staffing levels in the STOC
coverage area apply to various portions of the study period based on when ITS devices were
installed in the individual regions, as noted below.
Grand Region (WMTOC coverage area) – 3 full-time staff, 2006-2013
Metro Region (SEMTOC coverage area) – 7.5 full-time staff, 2006-2013
North Region (STOC Coverage area) – 1 full-time staff, 2007-2013
Superior Region (STOC Coverage area) – 2 full-time staff, 2010-2013
Bay Region (STOC coverage area) – 2 full-time staff, 2011-2013
Lansing Operations (STOC coverage area) – 4 equivalent full-time staff, 2011-
2013
Southwest Region (STOC coverage area) – 2 full-time staff, 2011-2013
University Region (STOC coverage area) – 2 full-time staff, 2011-2013

Costs and Benefits of MDOT ITS Deployments
53
The following annual MDOT staff costs were used in the cost analysis:
$225,000/year – WMTOC coverage area, 2006-2013
$565,000/year – SEMTOC coverage area, 2006-2013
$20,000-$470,000/year – STOC coverage area, 2007-2013
Operations and Maintenance Cost Summary
The cost analysis incorporated more than 4,100 device-years and over $50 million in ITS
operations and maintenance costs, plus an additional $15 million in FCP costs. A summary of the
operations and maintenance costs by TOC coverage area is shown in Table 3-7 and Table 3-9.
As shown in Table 3-8 and Figure 3-18, the average operations and maintenance costs decrease
as the number of devices increases. The operations and maintenance cost per device is likely
dependent on quantity of devices and density of device placement. In general, devices in the
STOC coverage area have the greatest operations and maintenance costs per device and devices
in the WMTOC coverage area have the least operations and maintenance costs per device. The
statewide average cost has reduced from $14,160 in 2007 to $8,983 in 2013.
Table 3-7: Total Operations and Maintenance Costs (2006 – 2013)
SEMTOC WMTOC STOC Total
Total CCTV Quantity 1162 301 115 1578
Total MVDS Quantity 1096 486 151 1733
Total DMS Quantity 541 134 115 790
Total TTS Quantity 1 0 8 9
Total (Device-Year) 2800 921 389 4110
Maintenance Contract Cost $12,006,309 $1,135,537 $1,064,344 $14,206,190
TOC Operations Cost $13,137,988 $2,953,545 $2,220,658 $18,312,191
Utility Cost (power) $2,255,840 $597,636 $304,964 $3,158,440
Utility Cost (communication) $2,202,764 $641,047 $258,283 $3,102,093
MDOT Staff Cost $4,500,000 $1,800,000 $1,518,750 $7,818,750
Total O&M Cost $34,102,901 $7,127,765 $5,366,998 $46,597,664
Average O&M Cost per Device $12,180 $7,739 $13,797 $11,338
Note) Total ITS device quantity is the sum of devices active each year during 2006 – 2013.

Costs and Benefits of MDOT ITS Deployments
54
Table 3-8: Changes in Operations and Maintenance Cost
2007 2009 2011 2013 Total (06-13)
SEMTOC No. of Devices 206 310 442 589 2,800
O&M $2,641,795 $4,363,007 $5,358,605 $5,426,092 $34,102,901
Cost/device $12,824 $14,074 $12,124 $9,212 $12,180
WMTOC No. of Devices 27 76 214 214 921
O&M $663,885 $794,561 $961,442 $1,303,177 $7,127,765
Cost/device $24,588 $10,455 $4,493 $6,090 $7,739
STOC No. of Devices 2 2 72 171 389
O&M $21,959 $21,959 $1,427,456 $2,020,119 $5,366,998
Cost/device $10,979 $10,979 $19,826 $11,814 $13,797
Overall No. of Devices 235 388 728 974 4,110
O&M $3,327,638 $5,179,527 $7,747,503 $8,749,387 $46,597,664
Cost/device $14,160 $13,349 $10,642 $8,983 $11,338
Figure 3-18: Changes in Annual Operations and Maintenance Costs
Table 3-9: Summary of Operations and Maintenance Cost
TOC Coverage Area
Overall SEMTOC WMTOC STOC
Total number of devices 589 214 171 974
Annual Operations and
Maintenance Costs $5,426,092 $1,303,177 $2,020,119 $8,749,387
O&M Cost per Device $9,212 $6,090 $11,814 $8,983
Annual Freeway Courtesy
Patrol Cost $1,933,333 NA $366,667 $2,300,000
$0
$5,000
$10,000
$15,000
$20,000
$25,000
$30,000
2006 2007 2008 2009 2010 2011 2012 2013
SEMTCO
WMTOC
STOC

Costs and Benefits of MDOT ITS Deployments
55
Chapter 4 User Perception Survey
4.1 Introduction
Although many similar surveys have been conducted in the past, the overwhelming majority
have focused on the performance of one particular device (such as Dynamic Message Signs
(DMS)) at one particular area (Chicago, Shanghai, Sydney, etc.) conducted over a limited time
range (typically a week or less). Accordingly, the present study distinguishes itself from the body
of previous work by considering ITS deployments as a cohesive system (as well as individual
devices) while gathering responses over an extended duration (six and a half months) across the
entire state of Michigan. As addressed in the previous chapter, current MDOT ITS deployments
under investigation include freeway management applications such as DMS, Travel Time Signs
(TTS), Closed Circuit Television Cameras (CCTV), Road Weather Information Systems (RWIS),
and Mi Drive.
Given that the survey was linked on MDOT’s main web-based travel information portal,
Mi Drive (http://michigan.gov/midrive/), the present survey is among the first to utilize an ITS
service as the primary means of exposure (85 percent of respondents). Therefore, the main
contributions of this study include the analysis of the entire range of Michigan ITS deployments
individually and aggregated as a system, investigation of the effect of time/season on survey
responses, and the audience consisting of primarily active ITS users on a statewide-scope, as
opposed to the general public in a specific area.
4.2 Survey and Analysis Methodology
4.2.1 Survey Design and Data Collection
A mixed-preference questionnaire was prepared and pilot-tested by a group of university
students before publically available at the link http://mdot.itssurvey.questionpro.com. The stated
purpose of the survey was to identify how Michigan travelers perceive the benefits attributed to
ITS. The questionnaire consisted of five primary categories, as summarized below:
Category 1: Exposure Information & Demographics
o “How did you find out about this survey?”

Costs and Benefits of MDOT ITS Deployments
56
o Age, Sex, Location (Zip Code), Date of Survey Completion
Category 2: Travel Behaviors
o “How many hours per day do you normally travel on freeways during the week
and weekend?
o “What is your major concern during your daily travel?
Category 3: ITS Device Familiarity
o Freeway Courtesy Patrol (FCP)
Waiting Time; Satisfaction; Willingness to Wait
o Dynamic Message Signs (DMS)
Usefulness; Effects; Trustfulness
o Travel Time Signs (TTS), Highway Advisory Radio (HAR), Closed Circuit
Television Camera (CCTV), Road Weather Information Systems (RWIS),
Mi Drive
Category 4: Travel Information
o Frequency; Importance; Trip changes
Category 5: Suggestions for Better ITS Services
o Open response
The survey opened on December 16, 2013, with responses collected through June 30, 2014,
allowing for a six and a half month analysis window over two calendar seasons. A timeline of
surveys completed is included in Figure 4-1 below. A copy of the survey questionnaire is
provided in the Appendix 1.

Costs and Benefits of MDOT ITS Deployments
57
Figure 4-1: Weekly Timeline of Completed Surveys
4.2.2 Data Analysis Focuses & Methods
Comprehensive ITS device familiarity & frequency of use
As mentioned in the literature review section, motorist perception of travel information has
primarily been studied with regard to the messages provided on DMS. Although the present
study similarly queried driver familiarity and response to DMS and the various message types,
an analysis of these results will not be discussed singularly. Instead, the degree of familiarity
among respondents with regard to the entire range of MDOT ITS deployments is investigated.
Initially, a descriptive analysis is conducted to show how general user familiarity varies
by device. The descriptive analysis is followed by ordered logistic regression modeling to
determine how individual device familiarity and frequency of use varies according to
characteristics such as age, sex, TOC location, freeway travel time, time of year and relative
importance of various information types. User familiarity with the various ITS devices were
categorized according to three candidate responses, as follows:
1. “No, not at all.”
2. “I have heard about it, but do not know it well.”
3. Yes, I know it well.”
While device usage frequency could vary from “Never” to “Daily”, with “Weekly”, “Monthly”
and “Yearly” as other options. Those respondents who indicated unfamiliarity with a certain
93 89
134
80
45
177
42 43 54
89
55
12 0 0
29 44
25 26 10 17
31 28 13 14
32 20
32 25 2
0
50
100
150
200
12/15/2013 1/15/2014 2/15/2014 3/15/2014 4/15/2014 5/15/2014 6/15/2014Su
rvey
s C
om
ple
ted
Week
Surveys Completed by Week (12/16 - 6/30)

Costs and Benefits of MDOT ITS Deployments
58
device type were not further questioned about device usage frequency. Ordered logistic
regression was chosen as the modeling approach as the qualitative responses to the questions of
interest were structured discretely on an ordinal scale. The ordered logistic model determines the
nonlinear probability that the latent, dependent variable will cross a certain threshold with
respect to a change in the independent variables (Borooah, 2002). The general form of the
ordered logit model is as follows (William, 2014):
𝑍𝑖 =∑𝛽𝑙
𝐿
𝑙=1
𝑋𝑙
Where Z represents the estimated dependent variable and the β parameters are estimated
according to the X independent variables. The threshold values that determine the odds of Y (the
observed dependent variable) falling within a certain category are the estimated κ-terms in the
following equation, where j represents the various discrete, ordered categories, such as 1, 2, and
3 in the user familiarity response example above (Bifulco et al., 2014):
𝑃(𝑌𝑖 > 𝑗) =exp(𝑍𝑖 − 𝜅𝑗)
1 + [exp(𝑍𝑖 − 𝜅𝑗)]
Effect of pre-departure travel information on trips
MDOT TOCs disseminate a variety of information through the various ATIS deployments.
When not displaying travel time messages, DMS provide information regarding incidents,
special events, congestion, weather, construction, AMBER alerts and others. Additionally, Mi
Drive provides information regarding construction, camera imagery, current travel speeds,
incidents and weather. The current study investigates the impact of pre-departure travel
information, regardless of ATIS source, on travel behaviors.
The types of pre-departure travel information under investigation include travel time,
current roadway speeds, road work locations, crash/accident locations, road weather information,
planned special events and freeway camera images. Respondents were asked to rate the
importance of these information types on a scale from “No Need” to “Essential”, with
intermediate options including “Not Important”, “Good to Have” and “Important”. A follow up
question asked how often respondents perform the following behaviors based on answers to the
previous questions: reschedule your trip, change your departure time, change your route and

Costs and Benefits of MDOT ITS Deployments
59
change your transportation mode. Answers to this question could range from “Never” to “Very
Frequently”, with “Sometimes” and “Often” as other choices. Similar to the ITS device
familiarity and frequency of use analysis, an initial descriptive analysis was performed to
identify which information types respondents view as most essential. Following the descriptive
analysis, travel behaviors were modeled with an ordered logistic regression according to the
same independent characteristics stated in the previous ITS device familiarity section.
4.3 Results and Analysis
4.3.1 Demographics and Exposure
In total, 1,261 surveys were completed (at approximately a 75% completion rate) over the
duration of data collection, with an average of 48.5 surveys completed on a weekly basis. As
seen in Figure 4-1 during an approximately three-week period beginning on March 6, 2014 and
ending on March 24, 2014, no surveys were completed. This absence of data gathering
corresponds precisely with a time range in which the link to the survey was missing from the Mi
Drive website (although the survey was still accessible). In the “Winter” period (12/16-3/16),
913 surveys were completed, while 291 surveys were completed during the “Spring” period
(3/17 – 6/16). 64 percent of respondents were male, which mimics the male majority experienced
by similar surveys (Peng et al., 2004; Peeta et al., 2006). As seen in Figure 4-2, the proportion of
respondents above and below the age of 50 was approximately equal at 49 percent and 51
percent, respectively. The majority of respondents (64.3 percent) were male, as seen in Figure
4-3. Additionally, respondents were categorized according to TOC location by zip code. The
majority of respondents (46.8 percent) resided in areas managed by the Statewide TOC (STOC),
with 36.2 percent and 11.6 percent hailing from the Southeast Michigan TOC (SEMTOC) and
West Michigan TOC (WMTOC), respectively. The remaining 5.6 percent of participants did not
correctly indicate their zip code. As mentioned previously, the overwhelming majority (85.3
percent) of respondents were exposed to the survey through the Mi Drive link, as shown in
Figure 4-4. Additional exposure sources included email request, rest area poster, FCP referral
card and others.

Costs and Benefits of MDOT ITS Deployments
60
Figure 4-2: Survey Responses by Age
Figure 4-3: Survey Responses by Gender
0.83%
21.22% 28.90%
40.63%
8.42%
0.00%
20.00%
40.00%
60.00%
80.00%
100.00%
16-20 21-35 36-50 51-65 Over 65
Pe
rce
ntg
age
of
Re
spo
nse
s
Age Bracket
Responses by Age
64.32%
35.68%
Survey Responses by Gender
Male
Female

Costs and Benefits of MDOT ITS Deployments
61
Figure 4-4: Survey Referral Points
4.3.2 ITS Device Familiarity and Frequency of Use
Descriptive Analysis
Descriptive summaries of the responses regarding ITS device familiarity and ATIS source usage
frequency are provided in Table 4-1 and Table 4-2. The most well recognized devices were DMS
and Mi Drive, while the least recognized devices were RWIS and HAR. While similar studies
performed by Gates et al. (2012) and Hedden et al. (2011) only observed 22.5 percent and 19
percent familiarity with Mi Drive, the comparatively high Mi Drive recognition in the present
study was anticipated given that only 16.5 percent of respondents had never used Mi Drive, as
indicated in Table 4-2. The weekly variation in Mi Drive familiarity (in addition to DMS and
CCTV) chosen as “Not at all.” is represented in Figure 4-5. As seen, fewer respondents
appeared to be aware of these devices in the spring season compared to the winter season. This
observation may be explained by the propensity for harsh Michigan winter weather conditions to
draw travelers’ attention to these sources of travel information.
Television and radio represented the most frequently used ATIS sources on a daily basis,
as seen in Table 4-2. However, Gates et al. (2012) similarly observed radio as the most utilized
ATIS source, but found that only 23.8 percent of en-route travelers and 31.9 percent of
0.00%
20.00%
40.00%
60.00%
80.00%
100.00%
While exploringinformation on Mi
Drive
Invited by e-mailrequest
Pamphlet/Poster inrest area
Referral card fromthe Freeway
Courtesy Patrol
Other
"How did you find out about this survey?"

Costs and Benefits of MDOT ITS Deployments
62
commuters use radio daily. In the survey performed by Hedden et al. (2011), 53 percent of
respondents reported never listening to radio traffic information and 62 percent never watch TV
for travel information. Respondents in the present study use radio and TV much more frequently
compared to these other studies conducted in Michigan, likely resulting from the nature of the
majority of respondents representing active seekers of travel information, compared to the public
at large.
Table 4-1: Familiarity on ITS Devices
Device Type No, not at all.
I have heard about it, but do
not know it well. Yes, I know it well.
DMS 21 (1.7) 160 (12.7) 1082 (85.7)
TTS 186 (14.8) 318 (25.2) 757 (60.0)
HAR 763 (60.5) 371 (29.4) 127 (10.1)
CCTV 292 (23.2) 421 (33.4) 548 (43.5)
RWIS 623 (49.4) 411 (32.6) 227 (18.0)
Mi Drive 112 (8.9) 285 (22.6) 864 (68.5)
Note: Proportions in parenthesis. Highest proportion bolded.
Figure 4-5: ITS Device Familiarity
0%
10%
20%
30%
40%
50%
60%
70%
80%
90%
100%
DMS TTS HAR CCTV RWIS MiDrive
Pre
cen
tage
of
Re
spo
nse
s
ITS Device Type
Yes, I know it well.
I have heard about it,but do not know it well.
No, not at all.

Costs and Benefits of MDOT ITS Deployments
63
Figure 4-6: "No, not at all." Level of Familiarity vs. Device Type
Table 4-2: Source of Pre-departure Information
Usage
Frequency Mi Drive Smartphone Other websites TV Radio
Daily 381 (30.3) 298 (23.7) 300 (23.8) 449 (35.7) 582 (46.2)
Weekly 340 (27.0) 236 (18.7) 349 (27.7) 221 (17.6) 224 (17.8)
Monthly 235 (18.7) 99 (7.86) 268 (21.3) 130 (10.3) 124 (9.85)
Yearly 96 (7.55) 30 (2.38) 68 (5.40) 52 (4.13) 43 (3.42)
Never 208 (16.5) 596 (47.3) 274 (21.8) 407 (32.3) 286 (22.7)
Note: Proportions in parenthesis. Highest proportion bolded.
Given that respondents displayed a high degree of familiarity with DMS (as expected),
the survey included various supplementary questions targeting additional insight into motorists’
interaction with DMS. Survey respondents were asked to indicate their perceived usefulness of
various types of DMS messages, effect of DMS on travel behaviors and level of trust in DMS
information.
0%
10%
20%
30%
40%
50%
60%
Per
cen
tage
of
Res
pon
ses
Week
"No, not at all."
DMS
CCTV
Mi Drive

Costs and Benefits of MDOT ITS Deployments
64
Regarding the perceived usefulness of DMS messages by type, four different types of
example messages were shown to the respondent, with varying degrees of indicated usefulness
ranging from “Unhelpful” to “Very Helpful”. Those respondents who did not indicate at least
some familiarity with DMS were barred from accessing this portion of the survey. The
descriptive analysis of message types and level of usefulness are indicated in Figure 4-7. As seen,
while all messages were seen as being very helpful by most respondents, the most helpful
message type indicated was “Incident Ahead: Use Detour Exit 35”. DMS messages displaying
travel time information were viewed as the least helpful.
Additionally, respondents were asked how DMS affected their travel behaviors and their
level of trust placed in the DMS device. Figures depicting the response-split with respect to these
questions are shown in Figure 4-8 and Figure 4-9, respectively. As seen, most respondents stated
that DMS either reduced their anxiety or guided them to alternate routes, at 30.4 percent and 29.6
percent of all travel impacts, respectively. Also, the overwhelming majority (93 percent) of
respondents were at least somewhat trusting of DMS information.
Figure 4-7: Helpfulness of DMS Messages
UnhelpfulGood To
Know Helpful
VeryHelpful
N/A
"Accident Ahead: ExpectCongestion"
41 168 246 622 5
"Incident Ahead: Use Detour Exit35"
13 67 209 781 12
"Travel to Jackson / Distance 30Miles / Time 25 Minutes"
73 341 333 328 7
"To Detroit: 30 Minutes via I-94, 25Minutes via M-14"
64 259 338 412 9
0100200300400500600700800900
Nu
mb
er o
f R
esp
on
ses
How helpful are the following types of messages displayed on
DMS?
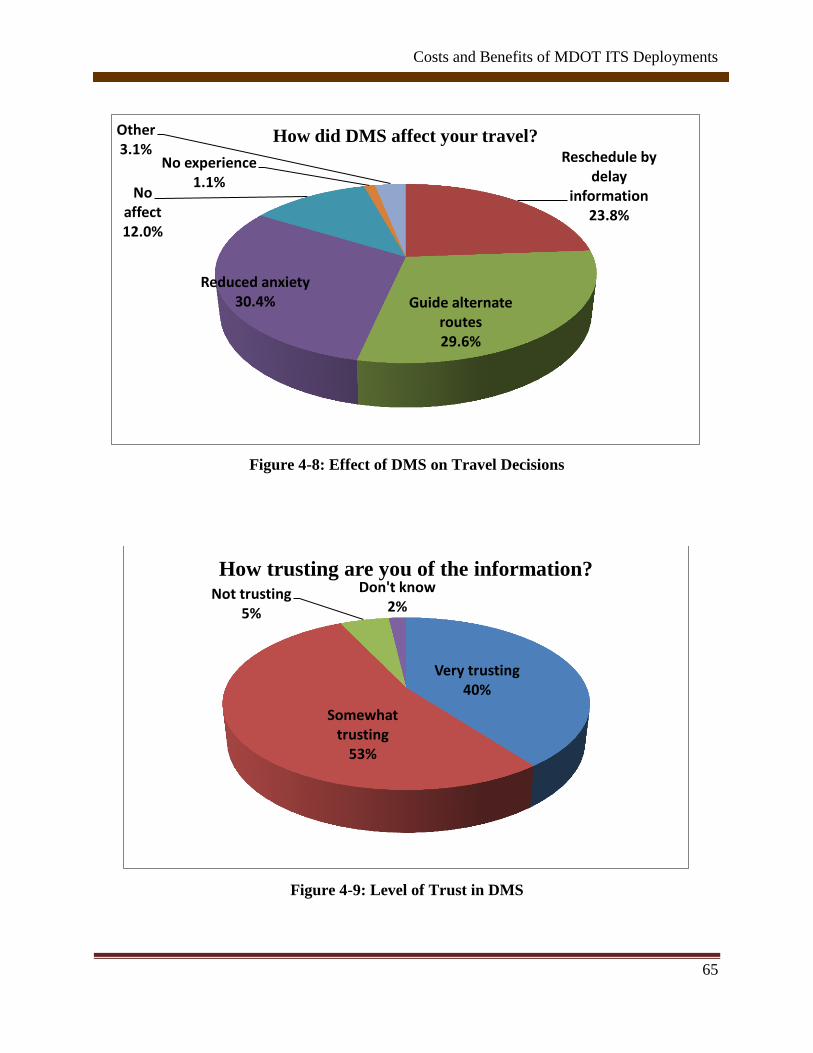
Costs and Benefits of MDOT ITS Deployments
65
Figure 4-8: Effect of DMS on Travel Decisions
Figure 4-9: Level of Trust in DMS
Reschedule by delay
information 23.8%
Guide alternate routes 29.6%
Reduced anxiety 30.4%
No affect 12.0%
No experience 1.1%
Other 3.1%
How did DMS affect your travel?
Very trusting 40%
Somewhat trusting
53%
Not trusting 5%
Don't know 2%
How trusting are you of the information?

Costs and Benefits of MDOT ITS Deployments
66
To gain further insight into the interaction of perceived usefulness and trustfulness of
DMS information and travel behaviors as a result, Chi-Square analyses were performed on the
survey results. Expected values were calculated as a proportion of the total responses in each
category, and compared with observed responses. The sum of the differences between observed
and expected values over the sum of expected values results in the Chi-Square value, as shown in
the equation below.
𝜒2 = ∑(𝑜𝑏𝑠𝑒𝑟𝑣𝑒𝑑 − 𝑒𝑥𝑝𝑒𝑐𝑡𝑒𝑑)2
𝑒𝑥𝑝𝑒𝑐𝑡𝑒𝑑
Any Chi-Square value that returned an asymptotic significance greater than 0.05 was
deemed insignificant and led to a conclusion that there is no difference among level of trust in
the responses to the survey question of interest. While a Chi Square test with asymptotic
significance less than 0.05 indicated that trust level somehow influences survey responses. The
Chi-Square analysis of level of trust versus effect of DMS on travel behaviors is shown in Table
4-3. As seen, those who were very trusting of the information displayed on DMS tended to take
the advised alternate route as per the displayed message. Additionally, those who were not
trusting of DMS information tended to not adhere to whatever type of information was displayed
and did not allow DMS to affect their travel behaviors or decisions. Further, a Chi-Square
analysis was conducted on the effect of level of trust on the perceived helpfulness of different
message types, as shown in Table 4-4 and Table 4-5. The message type “Incident Ahead: Use
Detour Exit 35” is an example of prescriptive message content, while the message type “Travel
to Jackson/Distance 30 Miles/Time 25 Minutes” represents a descriptive message aid. A
comparison of Table 4-4 and Table 4-5 shows that as displayed information becomes more
descriptive rather than prescriptive, even very trusting people lower their degree of perceived
helpfulness. For example, 79.7 percent of those very trusting in DMS information felt that the
message type “Incident Ahead: Use Detour Exit 35” was very helpful, however only 44.5 percent
of the same group felt that the message type “Travel to Jackson/Distance 30 Miles/Time 25
Minutes” was very helpful.

Costs and Benefits of MDOT ITS Deployments
67
Table 4-3: “How trusting are you of information displayed on DMS” vs. “How did DMS affect your travel?”
Cross Tabulation
Frequency/Percent
How did DMS affect your travel? (Select all that apply)
How trusting are
you of the
information
displayed on
DMS?
Helped me in
revising my
schedule by
providing
delay
information
Helped me
avoid
congestion by
guiding me to
alternative
routes
Reduced my
anxiety by
informing me
of reasons for
congestion
Did not
affect my
travel
I have not
had any
experience
with DMS
Other Row
Totals
Very trusting 236 276 263 50 5 19 849
27.80% 32.51% 30.98% 5.89% 0.59% 2.24% 43.47%
Somewhat
trusting
215 278 316 146 14 28 997
21.56% 27.88% 31.70% 14.64% 1.40% 2.81% 51.05%
Not trusting 3 10 9 43 1 10 76
3.95% 13.16% 11.84% 56.58% 1.32% 13.16% 3.89%
Dont know 5 7 7 6 4 2 31
16.13% 22.58% 22.58% 19.35% 12.90% 6.45% 1.59%
Column Total 459 571 595 245 24 59 1953
Column Percent 23.50% 29.24% 30.47% 12.54% 1.23% 3.02% 100%
Chi-Square 260.608 P Value 0.000 Degree of Freedom 15

Costs and Benefits of MDOT ITS Deployments
68
Table 4-4: Level of Trust vs. “Incident Ahead: Use Detour Exit 35”
Cross Tabulation "Incident Ahead: Use Detour Exit 35"
How trusting are you of
the information displayed
on DMS?
Unhelpful Good
To
Know
Helpful Very
Helpful N/A Row
Totals Very trusting 1 23 65 376 7 472
0.21% 4.87% 13.77% 79.66% 1.48% 38.88% Somewhat
trusting 5 42 156 448 3 654
0.76% 6.42% 23.85% 68.50% 0.46% 53.87% Not trusting 10 13 19 21 3 66
15.15% 19.70% 28.79% 31.82% 4.55% 5.44% Don’t know 0 4 5 12 1 22
0% 18.18% 22.73% 54.55% 4.55% 1.81% Column Total 16 82 245 857 14 1214
Column Percent 1.32% 6.75% 20.18% 70.59% 1.15% 100% Chi-Square 174.422 p Value 0.000 Degrees of Freedom 12
Table 4-5: Level of Trust vs. “Travel to Jackson/Distance 30 Miles/Time 25 Minutes”
Cross Tabulation "Travel to Jackson / Distance 30 Miles / Time 25 Minutes"
How trusting are you of
the information
displayed on DMS?
Unhelpful Good To
Know Helpful Very
Helpful N/A Row
Totals Very trusting 9 105 144 210 4 472
1.91% 22.25% 30.51% 44.49% 0.85% 38.88% Somewhat
trusting 44 248 209 150 3 654
6.73% 37.92% 31.96% 22.94% 0.46% 53.87% Not trusting 32 20 9 4 1 66
48.48% 30.30% 13.64% 6.06% 1.52% 5.44% Dont know 4 12 4 2 0 22
18.18% 54.55% 18.18% 9.09% 0% 1.81% Column Total 89 385 366 366 8 1214
Column Percent 7.33% 31.71% 30.15% 30.15% 0.66% 100%
Chi-Square 268.924 p Value 0.000 Degrees of Freedom 12

Costs and Benefits of MDOT ITS Deployments
69
A secondary portion of the survey was made available to travelers assisted by FCP services.
A referral card to the survey was provided to FCP personnel with instructions to pass along to
assisted motorists after completion of the service. Despite these exposure efforts, only 63
responses were gathered from FCP-assisted motorists. However, the researchers felt that the
analysis of results could still prove insightful and thus are presented below. The three additional
questions asked of those assisted by FCP were as follows:
1. How long have you waited for the Freeway Courtesy Patrol (FCP) service?
2. How long would you be willing to wait for the FCP service?
3. Were you satisfied with the FCP service?
Figure 4-10: FCP Wait Duration
The descriptive results of the answers to these questions are provided in Figure 4-10 and
Figure 4-11, respectively. As indicated in Figure 4-10, respondents were willing to wait much
longer than actual FCP response time. The majority (63.5 percent) of respondents indicated that
they waited less than 15 minutes for FCP service, however, roughly 54 percent answered that
63.49%
25.40%
7.94%
0.00% 3.17%
14.29%
53.97%
20.63%
6.35% 4.76%
0.00%
10.00%
20.00%
30.00%
40.00%
50.00%
60.00%
70.00%
Pe
rce
nt
of
Re
spo
nse
s
FCP Wait Duration
How long have you waited for the Freeway Courtesy Patrol (FCP) service?
How long would you be willing to wait for the FCP service?

Costs and Benefits of MDOT ITS Deployments
70
they’d be willing to wait up to 30 minutes for an FCP vehicle to arrive at the scene. Additionally,
almost all (94 percent) of FCP-assisted survey respondents stated that they were satisfied with
both the response time and quality of service provided by FCP.
Figure 4-11: FCP Level of Satisfaction
4.3.3 Freeway Travel Frequency and Concerns
To better understand the travel dynamics of those motorists responding to the survey, questions
were posed asking the duration of daily travel on freeways on both weekdays and weekends. The
responses to these questions are shown in Figure 4-12 and Figure 4-13, respectively. As seen, the
“0-30 Minute” time-range represented the most frequently chosen response on both weekdays
and weekends. However, weekday daily travel is more evenly distributed between the various
time-ranges as compared to the weekend. This likely indicates an acceptable distribution of
weekday commuters in the sample.
I was satisfied with the response time and service.
94%
I was satisfied, but hoped for quicker
service. 5%
I had to wait too long for service.
1%
Were you satisfied with the FCP service?

Costs and Benefits of MDOT ITS Deployments
71
Figure 4-12: Weekday Daily Freeway Travel Duration
Figure 4-13: Weekend Daily Freeway Travel Duration
Regarding travel behaviors, a question posing, “What is your major concern during your
daily travels?” was asked of survey respondents. The results are presented in Figure 4-14. As
seen, the most frequently stated concern was “Congestion”. However, the frequency of unique
messages displayed on DMS does not coincide with the primary concerns of travelers, as seen in
Figure 4-15. Despite representing a minor concern of motorists according to the survey results,
Incident-type messages were the most frequently displayed message type at both WMTOC and
STOC in 2013, at 39 percent and 48 percent of all messages, respectively.
31.56%
24.19% 25.14%
19.11%
0%
20%
40%
0-30 minutes 30 minutes - 1 hour 1 hour - 2 hours 2+ hoursPe
rce
nta
ge o
f R
esp
on
ses
Travel Duration Range
How many hours per day do you normally travel on
freeways Monday through Friday?
36.64% 32.28%
16.89% 14.20%
0%
20%
40%
0-30 minutes 30 minutes - 1 hour 1 hour - 2 hours 2+ hours
Pe
rce
nta
ge o
f R
esp
on
ses
Travel Duration Range
How many hours per day do you normally travel on
freeways during the weekend?

Costs and Benefits of MDOT ITS Deployments
72
Figure 4-14: Major Concern during Daily Travel
Figure 4-15: 2013 Number of Unique Messages by Type at TOCs
Additionally, a time series analysis was conducted to determine the effect of time of year
on daily travel concerns, as presented in Figure 4-16 below. As seen, “Weather” as a primary
concern dominates the spectrum from December to March, which coincides with the Michigan
winter season, while the focus switches to “Construction Zones/Closures” from March onwards,
aligning with the Michigan road construction season. The transfer point in Mid-March where no
responses are indicated is due to the aforementioned time-period when the survey was not
available online due to a broken link.
27.44%
39.65%
15.31% 12.37% 5.23%
0.00%
10.00%
20.00%
30.00%
40.00%
50.00%
Weather Congestion ConstructionZones/Closures
Safety Other
Pe
rce
nt
of
Re
spo
nse
s
Major Travel Concern
Major Concern During Daily Travel
31%
17% 12%
39%
1%
20% 19%
10%
48%
3%
0%
5%
10%
15%
20%
25%
30%
35%
40%
45%
50%
Weather Congestion Construction Incident Special Event
Pe
rce
nt
of
Me
ssag
es
Message Type
2013 Number of Unique Messages by Type at TOCs
WMTOC
STOC

Costs and Benefits of MDOT ITS Deployments
73
Figure 4-16: Weather and Construction Primary Concern vs. Time of Year
4.3.4 Travel Information
Survey respondents were asked to indicate their level of usage frequency of various sources of
advanced travel information. Usage frequency could vary from “Daily” to “Never”, while source
types included Mi Drive, smartphones, other websites, TV and radio. The seasonal variation of
Mi Drive usage frequency is indicated in Figure 4-17. As seen, daily Mi Drive use steadily
declined over the duration of the survey period. Radio was the most frequently used source of
pre-departure travel information in both the defined spring (March 21 – June 21) and winter
(December 21 – March 21) periods, as shown in Table 4-6 and Table 4-7, respectively. However,
Mi Drive use dropped from most often used daily in the winter period to only weekly in the
spring period.
Further, the survey asked respondents to indicate their perceived level of necessity (from
“No Need” to “Essential” of various types of pre-departure travel information, including travel
time, speed, work zone, crash, road weather, planned event and CCTV. The descriptive summary
of this analysis by time period is shown in Table 4-8. As seen, all information types were seen by
the majority of respondents to at least be “Good to Have”, while pre-departure crash information
was seen to be essential by the most respondents in both the Winter and Spring periods.
Regarding Work Zone and Road Weather information, a figure showing the seasonal variation is
0.00%
10.00%
20.00%
30.00%
40.00%
50.00%
60.00%P
erc
en
tage
of
Re
spo
nse
s
Week
Weather Construction Zones/Closures

Costs and Benefits of MDOT ITS Deployments
74
presented in Figure 4-18. As expected, Road Weather information is viewed as essential by the
majority of respondents during the Winter period, while the focus shifts towards Work Zone
information in the Spring period, coinciding with the Michigan road construction season.
Given that crash information was viewed as the most essential type of pre-departure
travel information, further Chi-Square analyses were conducted on the level of importance
placed on crash information by source usage frequency. These analyses according to Mi Drive
and TV usage are provided in Table 4-9 and Table 4-10, respectively. As seen, those respondents
who felt that crash information was essential tended to use both Mi Drive and TV as sources of
pre-departure travel information on a daily basis.
4.3.5 Survey General Comments
At the conclusion of the survey, respondents were asked to leave general comments regarding
ITS if desired. The majority of the comments were overwhelmingly, positive. A few choice
examples are shown below:
o “This is a very useful app as I commute 45 mins each way to work and travel to
other remote locations very frequently. It is useful to know current speeds not
only for travel time planning but also to infer road conditions.”
o “LOVE IT!!! Thank you for reducing stress, saving us time & avoiding adding us
to the accidents. I share the website with so many people! ...I don't remember
seeing weather alerts on the website, but driving speeds usually tell me what to
expect anyways.”
In addition, many users indicated a high demand for a standalone, mobile Mi Drive
application for their smartphones. Among all ITS devices, many of the comments indicated a
desire for increased freeway camera imagery exposure and quality. Some of the negative themes
included a general lack of appreciation for special DMS messages such as “Click It or Ticket”
and “Don’t Veer for Deer”. Many respondents also felt that provided travel information was not
up to date. A compilation of general comments is provided in s separate appendix document.

Costs and Benefits of MDOT ITS Deployments
75
Figure 4-17: Daily Mi Drive Use by Week
0.00%10.00%20.00%30.00%40.00%50.00%60.00%
12
/15
/20
13
12
/22
/20
13
12
/29
/20
13
1/5
/20
14
1/1
2/2
01
4
1/1
9/2
01
4
1/2
6/2
01
4
2/2
/20
14
2/9
/20
14
2/1
6/2
01
4
2/2
3/2
01
4
3/2
/20
14
3/9
/20
14
3/1
6/2
01
4
3/2
3/2
01
4
3/3
0/2
01
4
4/6
/20
14
4/1
3/2
01
4
4/2
0/2
01
4
4/2
7/2
01
4
5/4
/20
14
5/1
1/2
01
4
5/1
8/2
01
4
5/2
5/2
01
4
6/1
/20
14
6/8
/20
14
6/1
5/2
01
4
6/2
2/2
01
4
6/2
9/2
01
4
Pe
rce
nta
ge o
f R
esp
on
ses
Week
Daily Mi Drive Use by Week

Costs and Benefits of MDOT ITS Deployments
76
Table 4-6: Winter Pre-Departure Information Use Frequency by Source
Table 4-7: Spring Pre-Departure Information Use Frequency by Source
Spring Pre-Departure Information Use Frequency by Source
Source
Usage Frequency MiDrive Smartphone Other
websites TV Radio
Daily 21.65% 22.68% 20.27% 37.11% 45.02%
Weekly 26.80% 17.53% 29.55% 13.75% 16.84%
Monthly 21.31% 7.90% 24.74% 9.28% 10.65%
Yearly 9.28% 2.06% 7.56% 5.50% 5.15%
Never 20.96% 49.83% 17.87% 34.36% 22.34%
Winter Pre-Departure Information Use Frequency by Source
Source
Usage
Frequency MiDrive Smartphone Other websites TV Radio
Daily 33.92% 24.59% 25.03% 35.78% 47.42%
Weekly 27.44% 19.21% 27.00% 18.88% 18.22%
Monthly 17.45% 7.90% 20.31% 10.54% 9.33%
Yearly 6.70% 2.09% 4.61% 3.73% 2.85%
Never 14.49% 46.21% 23.05% 31.06% 22.17%

Costs and Benefits of MDOT ITS Deployments
77
Table 4-8: Information Type Necessity by Season
Information Type Necessity - Seasonal Variation
Level of
Necessity Travel Time Speed Work Zone Crash Road Weather Planned Event CCTV
Winter Spring Winter Spring Winter Spring Winter Spring Winter Spring Winter Spring Winter Spring
No Need 7.03% 3.44% 4.83% 2.75% 0.66% 0.34% 0.88% 0.69% 1.43% 0.69% 4.50% 3.09% 8.78% 8.93%
Not
Important 8.12% 7.22% 8.89% 9.97% 1.76% 0.69% 1.43% 0.34% 2.31% 4.12% 13.50% 12.03% 19.87% 23.02%
Good to
Have 38.86% 40.89% 37.54% 46.05% 31.50% 24.05% 15.26% 14.78% 17.89% 31.96% 48.08% 44.33% 34.91% 38.14%
Important 27.55% 32.65% 30.74% 27.84% 43.14% 38.83% 37.21% 37.11% 33.04% 40.21% 24.92% 27.15% 19.87% 19.93%
Essential 18.44% 15.81% 18.00% 13.40% 22.94% 36.08% 45.23% 47.08% 45.33% 23.02% 9.00% 13.40% 16.58% 9.97%

Costs and Benefits of MDOT ITS Deployments
78
Figure 4-18: Work Zone and Road Weather Information by Week
0.00%10.00%20.00%30.00%40.00%50.00%60.00%70.00%
12
/15
/20
13
12
/22
/20
13
12
/29
/20
13
1/5
/20
14
1/1
2/2
01
4
1/1
9/2
01
4
1/2
6/2
01
4
2/2
/20
14
2/9
/20
14
2/1
6/2
01
4
2/2
3/2
01
4
3/2
/20
14
3/9
/20
14
3/1
6/2
01
4
3/2
3/2
01
4
3/3
0/2
01
4
4/6
/20
14
4/1
3/2
01
4
4/2
0/2
01
4
4/2
7/2
01
4
5/4
/20
14
5/1
1/2
01
4
5/1
8/2
01
4
5/2
5/2
01
4
6/1
/20
14
6/8
/20
14
6/1
5/2
01
4
6/2
2/2
01
4
6/2
9/2
01
4
Pe
rce
nta
ge o
f R
esp
on
ses
Week
Work Zone and Road Weather Information chosen as "Essential" by
Week
Work Zone
Road Weather
(Two week period where no responses collected due to missing MiDrive link.)

Costs and Benefits of MDOT ITS Deployments
79
Table 4-9: Crash Information Necessity vs. Mi Drive Usage Frequency
Cross Tabulation
Frequency/Percent
Mi Drive site usage frequency
Crash/Accident
location info
necessity
Daily Weekly Monthly Yearly Never Row
Totals
No Need 0 1 2 1 6 10
0% 10% 20% 10% 60% 0.73%
Not
Important
1 1 3 3 9 17
5.88% 5.88% 17.65% 17.65% 52.94% 1.24%
Good to
Have
41 48 41 26 50 206
19.90% 23.30% 19.90% 12.62% 24.27% 15.07%
Important 125 142 112 49 92 520
24.04% 27.31% 21.54% 9.42% 17.69% 38.04%
Essential 245 172 96 26 75 614
39.90% 28.01% 15.64% 4.23% 12.21% 44.92%
Column
Total
412 364 254 105 232 1367
Column
Percent
30.14% 26.63% 18.58% 7.68% 16.97% 100%
Chi-Square 109.084 p Value 0.000 Degrees of Freedom 16
Table 4-10: Crash Information Necessity vs. TV Usage Frequency
Cross Tabulation
Frequency/Percent
Television usage frequency
Crash/Accident
location info
necessity
Daily Weekly Monthly Yearly Never Row
Totals
No Need 1 2 0 0 7 10
10% 20% 0% 0% 70% 0.73%
Not
Important
2 4 0 1 10 17
11.76% 23.53% 0% 5.88% 58.82% 1.24%
Good to
Have
59 44 22 9 72 206
28.64% 21.36% 10.68% 4.37% 34.95% 15.07%
Important 171 103 76 26 144 520
32.88% 19.81% 14.62% 5% 27.69% 38.04%
Essential 247 90 49 18 210 614
40.23% 14.66% 7.98% 2.93% 34.20% 44.92%
Column
Total
480 243 147 54 443 1367
Column
Percent
35.11% 17.78% 10.75% 3.95% 32.41% 100%
Chi-Square 49.429 p Value 0.000 Degrees of Freedom 16

Costs and Benefits of MDOT ITS Deployments
80
Ordered logistic regression
An ordered logistic regression was performed on responses to ITS device familiarity and ATIS
source frequency use against the explanatory variables defined below:
Age Spring
= 1, if age ≤ 50 = 1, if completion between 3/17 - 6/16
= 0, if age > 50 = 0, if completion before/after 3-17 - 6/16
Sex Wk_Trav_30
= 1, if male = 1, if daily weekday travel ≥ 30 minutes
= 0, if female = 0, if daily weekday travel < 30 minutes
WMTOC We_Trav_30
= 1, if zip within WMTOC region = 1, if daily weekend travel ≥ 30 minutes
= 0, if zip outside WMTOC region = 0, if daily weekend travel < 30 minutes
SEMTOC “Info”_Imp
= 1, if zip within SEMTOC region = 1, if at least "Good to Have"
= 0, if zip outside SEMTOC region = 0, if "No Need" or "Not Important"
Winter
= 1, if completion between 12/16 - 3/16
= 0, if completion after 12/16 - 3/16
The “Info”_Imp variable refers to the stated level of importance respondents placed on the
various types of travel information provided by MDOT ATIS sources as summarized in the note
under Table 4-11. The results of the ordered logit models are provided in Table 4-11 and Table
4-12 on the subsequent pages. As seen in Table 4-11, all ITS device familiarity model chi-square
values were significant at greater than the 99 percent confidence level, with P >𝝌𝟐=0.000 in all
cases. The low McFadden R2 values are expected given that many explanatory variables not
under investigation in these models affect ITS device familiarity. Therefore, these models cannot
be used to predict device familiarity with any degree of certainty. However, the models provide
insight into which factors are significantly correlated with familiarity and use frequency, which
is a primary focus of this study.
One of the more notable results is the effect of location on ITS device familiarity. The
WMTOC and SEMTOC variables were significant at greater than the 99 percent confidence
level, with P > |z| values of 0.000. The coefficient value of -0.995 for the WMTOC variable

Costs and Benefits of MDOT ITS Deployments
81
indicates that if the respondent resided in the WMTOC region, there is a 0.995 decrease in the
log-likelihood of being in a higher category of FCP familiarity. This result is intuitive, given that
WMTOC does not currently mange a FCP program; unlike SEMTOC whose FCP covers a
freeway network of over 320 miles in southeast Michigan. The positive coefficients for the
SEMTOC variable with regards to DMS and CCTV familiarity are also to be expected, as 96
DMS and 227 CCTV are currently in operation in the SEMTOC region, compared to 26 DMS
and 68 CCTV in the WMTOC region and 54 DMS and 81 CCTV in the STOC region. With
regard to the effect of season on ITS familiarity, the positive coefficients for the winter variable
with respect to DMS, CCTV and Mi Drive familiarity verify the time trend seen in Figure 4-6.
The significant effect of Cam_Imp in all device familiarity models except TTS possibly reflects a
relationship between interest in an advanced form of travel information such as freeway camera
imagery and general ITS interest.

Costs and Benefits of MDOT ITS Deployments
82
Table 4-11: ITS Device Familiarity: Ordered Logit Regression
ITS Device Familiarity
FCP DMS TTS HAR CCTV RWIS MiDrive
Model
Fit
Model Chi-Sq. 345.60 61.22 46.81 48.52 153.05 38.23 51.38
Prob. > Chi-Sq. 0.0000 0.0000 0.0000 0.0000 0.0000 0.0000 0.0000
Pseudo R-Sq. 0.1263 0.053 0.0199 0.0215 0.0569 0.0148 0.0252
Indep
enden
t V
aria
ble
s
Age
Coef. - 0.432 - - - - 0.288
P>|z| - 0.013 - - - - 0.022
Sex
Coef. 0.358 - - 0.609 0.624 0.409 -
P>|z| 0.002 - - 0.000 0.000 0.000 -
WMTOC
Coef. -0.995 - -0.589 - - - -
P>|z| 0.000 - 0.001 - - - -
SEMTOC
Coef. 1.55 0.660 - - 0.684 - -
P>|z| 0.000 0.001 - - 0.000 - -
Winter
Coef. - 0.366 - - 0.305 - 0.355
P>|z| - 0.038 - - 0.011 - 0.008
Spring
Coef. - - - - - - -
P>|z| - - - - - - -
Wk_Trav_30
Coef. 0.719 0.441 0.385 - - - 0.464
P>|z| 0.000 0.013 0.002 - - - 0.000
We_Trav_30
Coef. 0.235 0.379 0.358 0.284 0.283 - -
P>|z| 0.046 0.027 0.003 0.018 0.011 - -
Spd_Imp*
Coef. - - 0.486 - - - -
P>|z| - - 0.002 - - - -
WZ_Imp*
Coef. - - - - - - -
P>|z| - - - - - - -
PSE_Imp*
Coef. 0.403 - - - - - -
P>|z| 0.008 - - - - - -
Cam_Imp*
Coef. 0.295 0.583 - 0.532 0.897 0.588 0.571
P>|z| 0.016 0.001 - 0.000 0.000 0.000 0.000
Crash_Imp*
Coef. - - - - - - -
P>|z| - - - - - - -
RW_Imp*
Coef. - - - - - - -
P>|z| - - - - - - -
Note: “-“ indicates a non-significant correlation at the 95% confidence level.
*=Information Types: Spd=Travel Speed, WZ=Work Zone, PSE=Planned Special Events,
Cam=Freeway Camera, Crash=Crash/Accident, RW=Road Weather

Costs and Benefits of MDOT ITS Deployments
83
Table 4-12: ATIS Pre-Departure Usage: Ordered Logit Regression
ATIS Pre-Departure Source Usage Frequency
Mi Drive Smartphone
Other
websites TV Radio
Model
Fit
Model Chi-Sq. 144.30 69.95 75.90 64.90 51.92
Prob. > Chi-Sq. 0.0000 0.0000 0.0000 0.0000 0.0000
Pseudo R-Sq. 0.0377 0.0214 0.0199 0.0184 0.0153
Indep
enden
t V
aria
ble
s
Age
Coef. - 0.377 0.405 -0.245 -
P>|z| - 0.000 0.000 0.018 -
Sex
Coef. - - - - -
P>|z| - - - - -
WMTOC
Coef. - - - - -
P>|z| - - - - -
SEMTOC
Coef. - - -0.225 - 0.350
P>|z| - - 0.035 - 0.002
Winter
Coef. 0.553 - - - -
P>|z| 0.000 - - - -
Spring
Coef. - - - - -
P>|z| - - - - -
Wk_Trav_30
Coef. 0.491 0.484 - - 0.432
P>|z| 0.000 0.000 - - 0.000
We_Trav_30
Coef. - - 0.483 - -
P>|z| - - 0.000 - -
Spd_Imp*
Coef. - 0.447 0.344 - -
P>|z| - 0.006 0.025 - -
WZ_Imp*
Coef. - - - - -
P>|z| - - - - -
PSE_Imp*
Coef. - - 0.475 - -
P>|z| - - 0.001 - -
Cam_Imp*
Coef. 0.912 0.524 0.325 0.669 0.506
P>|z| 0.000 0.000 0.004 0.000 0.000
Crash_Imp*
Coef. 1.58 - - - -
P>|z| 0.000 - - - -
RW_Imp*
Coef. - - - 1.01 -
P>|z| - - - 0.000 -
Note: “-“ indicates a non-significant correlation at the 95% confidence level.
*=Information Types: Spd=Travel Speed, WZ=Work Zone, PSE=Planned Special Events,
Cam=Freeway Camera, Crash=Crash/Accident, RW=Road Weather

Costs and Benefits of MDOT ITS Deployments
84
4.3.6 Effect of Pre-Departure Travel Information on Trips
Descriptive analysis
The descriptive summary of the responses to the revealed preference question asking how often
pre-departure trip changes were made based on the various types of travel information provided
by MDOT ATIS are provided in Table 4-13. The majority of respondents tend to at least
sometimes reschedule, change departure time or change route, while few respondents ever
change transportation mode as a result of travel information. As seen, the categorical response
split for changing departure time and route are almost identical, a result similar to that found by
the study performed by Gates et al. (2012). However, in the survey performed by Gates et al., the
plurality of respondents stated that they rarely change route or departure time at 30 percent and
34 percent, respectively. Once again, this deviation between studies is likely explained by the
present study primarily consisting of respondents who actively seek and take advantage of travel
information.
Table 4-13: Impact of Travel Information on Trip Changes
Trip Change
Reschedule Change Departure Time Change Route Change Mode
N/A 13 (1.03) 5 (0.40) 3 (0.24) 50 (3.97)
Never 360 (28.59) 68 (5.40) 49 (3.89) 1070 (84.99)
Sometimes 737 (58.54) 673 (53.46) 657 (52.18) 115 (9.13)
Often 110 (8.74) 377 (29.94) 377 (29.94) 16 (1.27)
Very Frequently 39 (3.10) 136 (10.80) 173 (13.74) 8 (0.64)
Note: Proportions in parenthesis. Highest proportion bolded.
Ordered logistic regression
Ordered logit regression modeling was used to determine which characteristics of respondents
influence trip changes. In addition to the explanatory variables used in the regression models of
the previous section, variables indicating at least weekly use of the various ATIS sources are
included in the trip change model, as shown in Table 4-14 with variables “Wk_MiDrive”,
“Wk_Web” and “Wk_TV”.

Costs and Benefits of MDOT ITS Deployments
85
Table 4-14: Trip Changes: Ordered Logit Regression
Trip Change
Reschedule
Change
Departure Time Change Route Change Mode
Model
Fit
Model Chi-Sq. 66.58 86.21 114.03 16.21
Prob. > Chi-Sq. 0.0000 0.0000 0.0000 0.0003
Psuedo R-Sq. 0.0266 0.0311 0.0410 0.0157
Indep
enden
t V
aria
ble
s
Age
Coef. -0.319 0.380 - -
P>|z| 0.005 0.001 - -
Sex
Coef. - -0.456 - -
P>|z| - 0.000 - -
SEMTOC
Coef. - - 0.321 -
P>|z| - - 0.005 -
Spring
Coef. - - - -0.824
P>|z| - - - 0.002
Wk_Trav_30
Coef. - - 0.615 -
P>|z| - - 0.000 -
We_Trav_30
Coef. - 0.362 0.265 -
P>|z| - 0.002 0.023 -
Wk_MiDrive
Coef. - 0.534 - -
P>|z| - 0.000 - -
Wk_Web
Coef. 0.446 - - -
P>|z| 0.000 - - -
Wk_TV
Coef. - - - 0.399
P>|z| - - - 0.031
Spd_Imp*
Coef. 0.526 - - -
P>|z| 0.001 - - -
Cam_Imp*
Coef. 0.618 - 0.411 -
P>|z| 0.000 - 0.001 -
Crash_Imp*
Coef. - 1.662 1.824 -
P>|z| - 0.000 0.000 -
PSE_Imp*
Coef. - - 0.640 -
P>|z| - - 0.000 -
RW_Imp*
Coef. - - -0.750 -
P>|z| - - 0.007 -
Note: “-“ indicates a non-significant correlation at the 95% confidence level.
*=Information Types: Spd=Travel Speed, PSE=Planned Special Events, Cam=Freeway Camera,
Crash=Crash/Accident, RW=Road Weather

Costs and Benefits of MDOT ITS Deployments
86
As seen in Table 4-14, all models were significant at a greater than 99 percent confidence
level with P > χ2 values less than 0.01. The level of importance placed on many information
types proved significant on influencing tendency to change route. Those respondents who placed
some degree of importance in freeway camera imagery as well as crash and planned special
event (PSE) information were more likely to change routes prior to departure, while motorists
who valued road weather information were less likely to change routes. This result is intuitive as
unlike a localized event such as an incident or planned special event, weather tends to impact
potential alternate routes in the same manner as the intended route. A second notable finding
was that only the “Wk_TV” and “Spring” variables had a significant effect on tendency to switch
modes, though as indicated in Table 4-13, the majority of respondents never change mode as a
result of travel information.
4.4 Impact of Results on Practice
The statewide ITS deployments can be enhanced if the provided information adheres to active
user characteristics and requirements, as those who do not seek or trust the information are
inherently unlikely to comply. However, even motorists who fail to notice and/or follow travel
guidance provided by ITS may benefit from the positive system impacts garnered by those who
decide to alter their trips. Allowing motorists to indicate their perception of ATIS and ITS
generally through a revealed preference questionnaire survey attached to the ATIS service itself
is an innovative and cost-effective approach towards tailoring information according to
device/source type, time of year and location, as required by those motorists most likely to
acquire and accept the guidance.
The relevance of perceived importance of information type on usage frequency is of
critical importance, as these relationships could aid agencies in aligning desired information type
to the most suitable ATIS source. For example, as seen in Table 4-13, “Cam_Imp” and
“Crash_Imp” have a significant positive effect on Mi Drive usage frequency. This result taken in
tandem with the positive effect of the winter variable on Mi Drive usage frequency may indicate
that MDOT should highlight freeway camera imagery and crash information during the winter
season, especially during major storm events. Similarly, local television media broadcasters may

Costs and Benefits of MDOT ITS Deployments
87
wish to stress CCTV streams and road weather information during their traffic segments. With
regard to altering traveler behavior, the results displayed in Table 4-14 indicate that TOC
operators should stress CCTV images as well as crash and PSE information to influence route
change behaviors. The model also revealed that respondents with a higher affinity towards the
television information source are more likely to change transportation modes.
4.5 Conclusion
The present study conducted an extended duration, web-accessible questionnaire survey to
determine the degree of device familiarity, frequency of device use, and impact on pre-departure
travel behaviors among active ITS users as a result of factors such as age, sex, location, time of
year and information type affinity. With regard to ITS device familiarity, DMS and Mi Drive
were the most well recognized applications with 98.4 and 91.1 percent of respondents having at
least some knowledge of their existence, respectively. Radio and television were the most
frequently used ATIS sources on a daily basis at 46.2 and 35.7 percent, respectively. The most
common trip changes resulting from travel information were changes in departure time (94.2
percent at least sometimes change) as well as route (95.9 percent at least sometimes change).
Almost all of these proportions are significantly higher than similar studies performed in
Michigan, which is likely explained by the nature of the population almost wholly representing
active consumers of travel information.
A primary focus of this study was to see how responses vary with time, given the six and
a half month duration of data gathering. Seasonal variables (winter and spring) were included as
explanatory factors in the ordered logistic regression modeling to determine their impact on
respondent’s choices. Respondents tended to be more familiar with DMS, CCTV and Mi Drive
in surveys completed during the winter period, as all had a significant positive effect in these
ordered logit models. This relationship with CCTV and Mi Drive likely results from the nature of
harsh winter weather conditions necessitating the use of such applications to plan pre-departure
travel decisions. Supporting this notion with regard to Mi Drive, the winter explanatory factor
also had a significant positive effect on Mi Drive usage frequency. A respondent being more
familiar with DMS in the winter is possibly explained by the increased proportion of displayed

Costs and Benefits of MDOT ITS Deployments
88
weather and incident related messages, as opposed to the typical travel time information that
motorists may tend to ignore due to redundancy. The study also sought to investigate the effect
of location with respect to survey responses, given that the survey reached the entire state of
Michigan, as it was available online. Specifically, responses were categorized according to the
three TOC regions: SEMTOC, WMTOC and STOC. The SEMTOC explanatory factor had a
significant positive correlation with FCP, DMS and CCTV familiarity. This result is intuitive
given that these ITS deployments are overwhelmingly more prevalent in the southeast region of
Michigan compared to the rest of the state.
The impact of the various types of travel information provided by MDOT ATIS was
investigated to better understand how respondents’ primary concerns affect ITS device
familiarity, ATIS usage frequency and trip changes. Among the respondents surveyed, those who
placed any degree of importance in freeway camera imagery were more likely to be familiar with
all ITS deployments except TTS. Likewise, importance placed in freeway camera imagery had a
significant positive effect on usage frequency of all sources of travel information. These results
mimic a common sentiment in the open response portion of the survey, where a large number of
respondents voiced requests for extended publically available CCTV coverage as well as
improved image quality. Regarding pre-departure travel behaviors, the degree of importance
placed in various types of information, including camera images, crash/accident, planned special
events and road weather, primarily affected the decision to change route more than any other trip
change. This observation indicates that travel information proves more impactful in route
decision than scheduling or mode choices.
The study suffers from some limitations that should be recognized. Most notably, the
questionnaire did not pose sufficient driver demographic characteristics, with examples including
employment, income level, typical vehicle type, trip purpose and others. Including these factors
as explanatory variables would have strengthened the insights gleaned from the regression
models. Additionally, using season based on response date as an explanatory variable may not
accurately portray the true effect of season on user perception of ITS, given that questions were
not posed specifically with time of year as a consideration. Finally, the ordered logit regression
model possesses natural inaccuracy given that the ordinal categories under investigation in this
study are not rigidly discrete.

Costs and Benefits of MDOT ITS Deployments
89
Chapter 5 Performance of MDOT ITS
5.1 Summary of MDOT ITS Performance Report
5.1.1 Introduction
The three MDOT TOCs collect performance data to define benefits (or measures of effectiveness)
by each ITS system or devices, and collect necessary data to analyze benefits of ITS systems.
Performance measures rely on output measures (aggregated traffic data) rather than outcome
measures (individual level). Such quantifiable measures include travel time saving, vehicle
operating costs saving, crash reduction, travel reliability and emissions. One common approach
to measure the benefits of ITS systems is the before-and-after study. Traffic data to be collected
and quantified in this report section are traffic operation data, crash data and TOC performance
measures. Specific TOC data includes the following:
Call Tracker/Call Card Microsoft Access database
Lane Closure and Restrictions website posts
Stuck in Traffic notifications
DMS logs
FCP assists
MVDS/PTR data
Mainstar break/fix and preventative maintenance logs
Monthly and annual performance measure reports
Statewide ATMS software (PROD & QA databases)
City of Grand Rapids break/fix and preventative maintenance logs
RWIS data
RITIS data
NAVTEQ data access & archived data

Costs and Benefits of MDOT ITS Deployments
90
5.1.2 SEMTOC Performance Report Summary
The SEMTOC has published monthly and annual performance reports beginning in 2006. The
following discussion will summarize annual reported TOC performance beginning in January
2008 until December 2013, as seen in Table 5-1 below:
Table 5-1: 2006-2013 Annual SEMTOC Performance Summary
2008 2009 2010 2011 2012 2013
MVDS 52 108 125 192 241 274
CCTV 106 140 147 169 186 216
DMS 48 62 69 81 87 98
Number of Calls 53,968 64,468 71,807 69,113 72,877 71,880
MiDrive Hits NA 3,131,612 2,127,418 2,071,801 NA NA
Construction
Messages 1,121 1,121 815 1,259 1,025 NA
Number of Incidents 4,725 5,006 5,836 5,395 6,882 8,056
High Impact
Incidents NA 670 819 870 1,006 1,241
Freeway Courtesy
Patrol services 49,498 51,384 51,452 49,571 46,619 48,369
Average response
time 12.1 12.8 13.9 16.3 15.6 17.1
Average Clearance
time 10.0 8.9 8.8 9.9 9.3 11.2
As seen, the number of incidents (and high-impact incidents) has steadily grown since 2008,
likely explained by heightened incident detection due to increased ITS coverage. Average FCP
response and clearance time has also shown an increasing trend, which might be the result of a
growing FCP patrol route area. The FCP is a federally funded service intended to provide traffic
control for freeway incidents and enhance mobility by clearing lanes of debris and vehicles. FCP
assisted events are logged directly in the SEMTOC Call Tracker. Figure 5-1 below shows the
percentage of 2013 SEMTOC FCP assists by type. There were a total of 48,369 FCP assists in
SEMTOC in 2013. “Other” assists includes such activities as cellular assists, direction giving,

Costs and Benefits of MDOT ITS Deployments
91
traffic policing, transport, etc. As seen, abandoned vehicles compose the greatest portion of FCP
assists, with 10,172 total assists in 2013, according to Table A-1 in the Appendix (which
summarizes SEMTOC FCP assists by type from 2008-2013).
Figure 5-1: 2013 SEMTOC Percentage of FCP Assists by Type
Due to the large number of FCP assists, the SEMTOC patrol schedule operates in three
shifts, 24 hours a day, all seven days of the week. The first shift runs from 10 PM – 6 AM, the
second shift runs from 6 AM – 2 PM and the third shift runs from 2 PM -10 PM. A summary of
the average response and clearance times by shift and weekday vs. weekend is shown in Figure
5-2 below. As seen, the combined average response and clearance times are shorter in the
weekday second and third shifts compared to the weekday first shift and weekend shifts. A
summary of the average FCP response and clearance times from 2008 to 2013 is shown in Table
A-2 in the Appendix.
9%
11%
4%
12%
21%
13%
11%
6%
8%
3% 2% Mechanical
Flat Tire
Debris
Accident
Abandoned Vehicles
Out of Gas
Other*
Declined
Gone on Arrival
Non-FCP Tow
Multiple

Costs and Benefits of MDOT ITS Deployments
92
Figure 5-2: 2013 SEMTOC Average Response and Clearance Times
In addition to FCP assisted events, those incidents which affected either a shoulder or
lane on SEMTOC managed roadways were logged in a separate database from the SEMTOC
Call Tracker, known as the Lane Closure and Restrictions (LCAR) database. These types of
events are summarized separately from FCP assisted events and classified as “Incidents” in the
monthly performance reports from 2011-2013. A summary of these LCAR incidents is shown in
Table 5-2 on the following page. As seen, similar to the number of FCP assists, the total number
of LCAR incidents shows a trend of growth between 2011 (5,395 incidents) to 2013 (8,056
incidents). This growth can likely be attributed to improved incident detection and verification
through increased deployment of CCTV and MVDS devices. Although SEMTOC did not begin
to publish specific average LCAR incident duration by month until October 2012, the average
LCAR incident duration is shown to decrease from 2012 to 2013, from 55.6 minutes to 48.7
minutes. The yearly LCAR incident duration reduction may be explained by faster incident
verification by TOC personnel.
0 5 10 15 20 25
1st Shift (10 PM - 6 AM)
2nd Shift (6AM-2PM)
3rd Shift (2-10 PM)
Saturday (All 3)
Sunday (All 3)
1st Shift (10PM - 6 AM)
2nd Shift(6AM-2PM)
3rd Shift (2-10 PM)
Saturday (All3)
Sunday (All3)
Average Response Times 13.2 10.1 10 12.8 14.3
Average Clearance Times 9.9 11.6 11.2 8.7 8.3

Costs and Benefits of MDOT ITS Deployments
93
Table 5-2: 2011-2013 SEMTOC Monthly LCAR Incidents
Year Month Count
Duration Total High Impact Normal
20
11
Jan 391 76 315
Feb 565 115 450
Mar 311 72 239
Apr 305 75 230
May 448 63 385
Jun 445 55 390
Jul 490 69 421
Aug 470 73 397
Sep 615 67 548
Oct 475 75 400
Nov 465 68 397
Dec 415 62 353
Total/Avg. 5395 870 4525
20
12
Jan 614 86 528
Feb 445 58 387
Mar 459 86 373
Apr 486 70 416
May 516 84 432
Jun 577 75 502
Jul 612 87 525
Aug 587 91 496
Sep 512 110 402
Oct 569 122 447 42.2
Nov 613 67 546 84.7
Dec 892 130 762 44.1
Total/Avg. 6882 1066 5816 55.58
2013
Jan 702 99 603 41.8
Feb 812 98 714 51.2
Mar 674 98 576 59.3
Apr 612 109 503 47.0
May 673 90 583 45.0
Jun 670 90 580 49.2
Jul 639 138 501 51.8
Aug 639 110 529 49.6
Sep 555 108 447 49.4
Oct 657 99 558 45.5
Nov 663 101 562 49.0
Dec 760 101 659 45.9
Total/Avg. 8056 1241 6815 48.71

Costs and Benefits of MDOT ITS Deployments
94
5.1.3 WMTOC Performance Report Summary
The WMTOC has published monthly and annual performance reports since 2006. The following
discussion will summarize annual reported TOC performance beginning in January 2009 until
December 2013, as seen in Table 5-3 below. As seen the total number of calls have grown
steadily since 2009. Additionally, the number of managed incidents has more than doubled, from
606 in 2009 to 1,477 in 2013. Incident clearance time showed an increasing trend, to a maximum
of 81 minutes in 2011, where it began to fall to 68 minutes in 2013. WMTOC began reporting
roadway clearance time in 2012, with a duration of 23 minutes and 24 minutes in 2012 and 2013,
respectively. Unlike the SEMTOC, WMTOC does not operate a FCP division. However, all
reported incidents are logged in the TOC Call Tracker. Additionally, all abandoned vehicles and
disabled vehicles with an incident duration greater than four hours are removed from reported
incident duration statistics. Figure 5-3 on the following page shows the percentage of WMTOC
incidents by type in 2013. As seen, “Crashes” represent the majority of managed incidents at 61
percent of the 1,477 total incidents. Table A-3 in the Appendix shows percentage of WMTOC
incidents by type for all years between 2009 and 2013.
Table 5-3: 2009-2013 WMTOC Annual Performance Summary
2009 2010 2011 2012 2013
Number of Calls 1059 2712 2703 3492 3789
Construction Messages 451 504 641 491 NA
Number of Incidents 606 1192 1015 1373 1477
Incident Clearance time 58 78 73 69 68
Roadway Clearance
time NA NA NA 23 24

Costs and Benefits of MDOT ITS Deployments
95
Figure 5-3: 2013 WMTOC Percentage of Incidents by Type
5.1.4 STOC Performance Report Summary
The STOC has published monthly and annual performance reports since 2012. The following
discussion will summarize annual reported TOC performance beginning in January 2012 until
December 2013, as seen in Table 5-4 below. STOC did not report FCP assist and incident
duration information until May 2013. The reported number of “Incidents” in STOC performance
reports combines the total number of assists logged in the TOC Call Tracker with incidents
logged in the LCAR database. As seen, the number of incidents managed by STOC more than
tripled from 2,452 in 2012 to 7,458 in 2013. The average incident duration in 2013 was 58.6
minutes as indicated in Table 5-5, while total FCP incident duration (combination of assist
response and clearance time) was 29.4 minutes, as shown in Table 5-4.
The percentage of 2013 STOC FCP assists by type are indicated in Figure 5-4. As seen,
“Other” types of assists represent the greatest portion of events assisted by the STOC FCP.
“Other” assists might include cellular assists, declined service, FCP tow, non-FCP tow, gave
directions, stand by, status check, gone on arrival and transport. Unlike SEMTOC, the STOC
FCP does not operate on a shift-schedule. 2013 STOC FCP average response and clearance times
by weekday and weekend are indicated in Figure 5-5.
8%
29%
2%
61%
0%
Abandonded Vehicle
Disabled Vehicle
Debris
Crashes
Other

Costs and Benefits of MDOT ITS Deployments
96
Table 5-4: 2009-2013 Annual STOC Performance Summary
2012 2013
Number of Calls 3,690 NA
Construction Messages 236 184
Number of Incidents 2,452 7,458
Number of Assists NA 5,956(1)
Assist Response time NA 13.1
Assist Clearance time NA 16.3
(1) Estimated value based on known LCAR incident count since STOC Performance Report
data did not report FCP assists until May 2013
Table 5-5: 2013 STOC Incidents
STOC Incidents
2013 Duration Count
January 183
February 659
March 603
April 560
May 50.3 661
June 71.1 606
July 57.8 657
August 56.8 730
September 45.6 669
October 65.1 746
November 63.7 681
December 59.0 703
Avg./Total 58.6 7458

Costs and Benefits of MDOT ITS Deployments
97
Figure 5-4: 2013 STOC Percentage of FCP Assists by Type
Figure 5-5: 2013 STOC Average FCP Response and Clearance Times
7%
13%
6%
3%
19%
11%
4%
37%
Mechanical
Flat Tire
Debris
Crash
Abandoned Vehicles
Out of Gas
Multiple
Other*
0 2 4 6 8 10 12 14
Mon-Fri
Saturday
Sunday
Mon-Fri Saturday Sunday
Average Clearance Time 9.9 11.6 11.2
Average Response Time 13.2 10.1 10

Costs and Benefits of MDOT ITS Deployments
98
5.2 Traffic Incidents and Delays
5.2.1 Introduction
This section analyzes traffic incidents which occurred by region and their clearance time, as well
as delays caused by incidents. Table 5-6 summarizes incident duration reduction in minutes used
in previous ITS benefit studies. As seen, most previous studies classify incidents according to
type, which may include information regarding lane/shoulder blockage or some other measure of
incident severity. Incident duration reduction as a benefit of ITS ranges from 4.3 minutes (Nee,
2001) to 45.9 minutes (Guin, 2007). The remaining portion of this section will describe and
summarize the incident duration and delay analysis performed in the present study.
Table 5-6: Incident Duration Reduction from Other Studies
Region Incident Type Incident Duration Reduction
(minutes)
Boston (Stamatiadis 1997) minor incident 15.0
Disabled 25.0
moved to shoulder 25.0
debris 30.0
accident in lane 20.0
Chicago (Fenno 1997) accidents on the shoulder 20.0
accidents in 1 lane 35.0
accidents in 2 or more lanes 40.0
Denver (Cuciti 1995) lane blockers 10.5
non-blockers 8.6
Gary, IN (Latoski 1999) crash/ in lane assist 10.0
others 15.0
Houston (Hawkins 1993) minor incident average 16.6
San Francisco
(Skabardonis 1995)
breakdowns 16.5
crashes 12.6
Minnesota
(Skabardonis 1995)
stall less than 30 8.0
stall thirty to an hour 5.0
stall over an hour 0.0
Virginia (Dougald 2007) accident 43.5
breakdown 25.0
debris 5.0
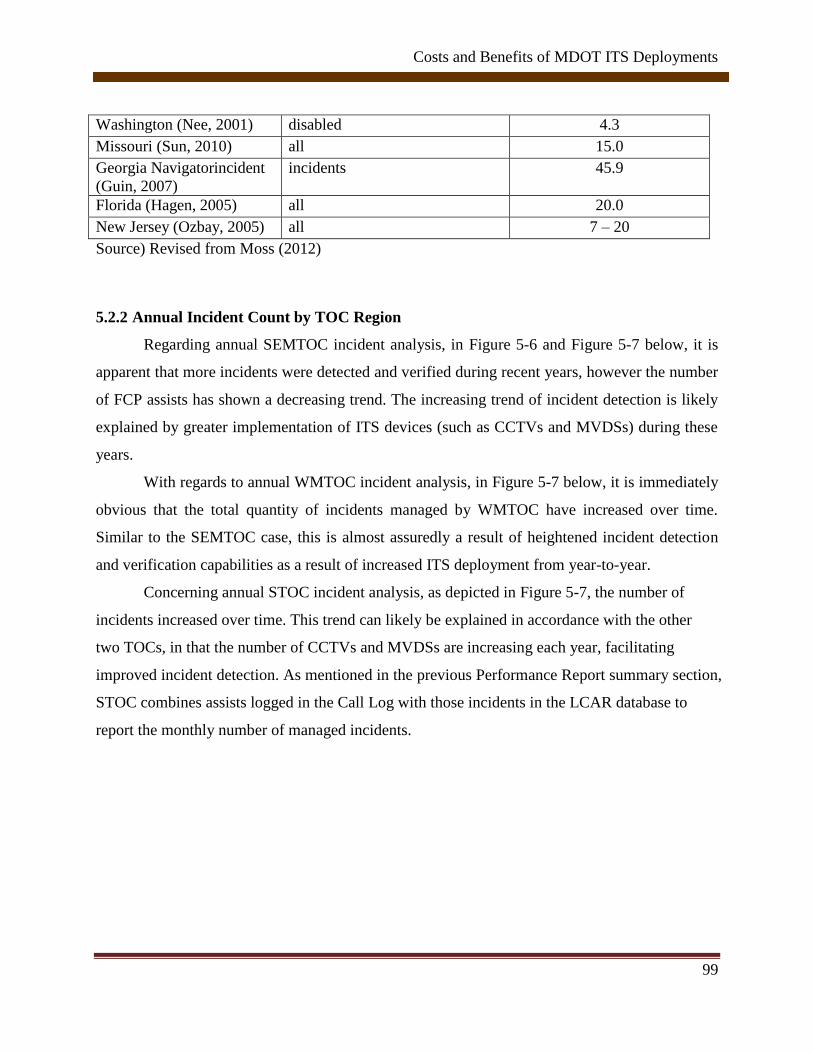
Costs and Benefits of MDOT ITS Deployments
99
Washington (Nee, 2001) disabled 4.3
Missouri (Sun, 2010) all 15.0
Georgia Navigatorincident
(Guin, 2007)
incidents 45.9
Florida (Hagen, 2005) all 20.0
New Jersey (Ozbay, 2005) all 7 – 20
Source) Revised from Moss (2012)
5.2.2 Annual Incident Count by TOC Region
Regarding annual SEMTOC incident analysis, in Figure 5-6 and Figure 5-7 below, it is
apparent that more incidents were detected and verified during recent years, however the number
of FCP assists has shown a decreasing trend. The increasing trend of incident detection is likely
explained by greater implementation of ITS devices (such as CCTVs and MVDSs) during these
years.
With regards to annual WMTOC incident analysis, in Figure 5-7 below, it is immediately
obvious that the total quantity of incidents managed by WMTOC have increased over time.
Similar to the SEMTOC case, this is almost assuredly a result of heightened incident detection
and verification capabilities as a result of increased ITS deployment from year-to-year.
Concerning annual STOC incident analysis, as depicted in Figure 5-7, the number of
incidents increased over time. This trend can likely be explained in accordance with the other
two TOCs, in that the number of CCTVs and MVDSs are increasing each year, facilitating
improved incident detection. As mentioned in the previous Performance Report summary section,
STOC combines assists logged in the Call Log with those incidents in the LCAR database to
report the monthly number of managed incidents.

Costs and Benefits of MDOT ITS Deployments
100
Figure 5-6: Annual Reported SEMTOC and STOC FCP Assist Counts
Figure 5-7: Annual Reported All TOC LCAR Incident Counts
2007 2008 2009 2010 2011 2012 2013
SEMTOC_Assist 49498 51384 51452 49571 46619 48369
STOC_Assist 5956
0
10000
20000
30000
40000
50000
60000
Nu
mb
er o
f A
ssis
ts
SEMTOC & STOC FCP Assist Counts
2007 2008 2009 2010 2011 2012 2013
SEMTOC_Incident 4674 4725 5006 5836 5395 6882 8056
WMTOC_Incident 606 1192 1015 1373 1421
STOC_Incident 2452 7458
0
1000
2000
3000
4000
5000
6000
7000
8000
9000
Nu
mb
er o
f L
CA
R I
nci
den
ts
All TOC LCAR Incident Counts

Costs and Benefits of MDOT ITS Deployments
101
5.2.3 Incident Duration by TOC Region
Data Gathering & Methodology
Each of the three TOCs supplied the research team with raw Call Tracker information in the
form of Microsoft Access databases. This data was used for “Assisted” event information for
both the SEMTOC and STOC regions. Additionally, the 2011-2013 statewide LCAR database
was provided to gather information about “LCAR” event information for both the SEMTOC and
STOC regions. These two databases are distinct and display no overlap of individual incident
information. Regarding WMTOC, only its Call Tracker database was used to analyze incident
data. Given that the WMTOC does not currently operate an FCP division, these incident are
considered unassisted. The table below describes how each of the two databases are utilized for
purposes of the monthly performance reports summarized in the previous section.
Table 5-7: TOC Performance Report Database Utilization
TOC Monthly TOC Performance Report Measures
"FCP Assists" "Incidents"
SEMTOC Call Tracker LCAR
WMTOC Inapplicable Call Tracker
STOC Call Tracker Call Tracker + LCAR
In order to determine the benefits gleaned from ITS with regard to incident duration
reduction and delay analysis, individual incidents were aggregated according to the 2012 MDOT
Sufficiency database roadway segments described in Chapter 3. In the case of FCP assisted
incident information, this process resulted in the loss of many incidents due to missing incident
location information in the Call Tracker database. However, all LCAR incidents were described
with accurate geographic coordinates, thus no incidents were lost in the segment aggregation
process.
All TOC Annual Incident Duration Descriptive Statistics
As seen in Figure 5-8, the temporal trend of SEMTOC assisted incident duration is not clear.
This can likely be explained because the recently implemented ITS devices are mostly located in

Costs and Benefits of MDOT ITS Deployments
102
suburban and rural areas, whereas a significant portion of the urban SEMTOC region was
already saturated with ITS deployments prior to 2008. Traffic incidents in suburban and rural
areas usually have longer durations. However, the temporal trend of LCAR incident duration
shown in Figure 5-9 shows a decreasing trend. Also, the average incident duration in the LCAR
data is much larger than the Call Tracker database. This could likely be explained by the nature
of LCAR incidents to typically exhibit a higher-impact with lane or shoulder closures.
Regarding the WMTOC, an observation that mimics that found in the SEMTOC region is
the failure to establish a clear temporal trend with regard to average incident duration. Once
again, this may be explained by a greater number of incidents being detected in rural regions
outside of the metropolitan Grand Rapids area, resulting in longer detection, verification and
response. However, from 2011 to 2013, the incident duration in WMTOC shows a decreasing
trend.
For the STOC, reported incident and assist duration is only available for the year 2013,
thus no temporal trend can be established.
Figure 5-8: SEMTOC and STOC Reported FCP Assist Duration
2007 2008 2009 2010 2011 2012 2013
SEMTOC_Assist 22.1 21.7 22.7 26.2 24.9 28.3
STOC_Assist 28.7
0
5
10
15
20
25
30
35
FC
P A
ssis
t D
ura
tion
(M
inu
tes)
SEMTOC & STOC FCP Assist Duration

Costs and Benefits of MDOT ITS Deployments
103
Figure 5-9: All TOC LCAR Incident Duration
2013 SEMTOC Incident Duration Reduction Analysis
As explained, incidents were aggregated according to nearest 2012 MDOT Sufficiency
file segments in order to determine the benefit of ITS with regard to reducing incident duration.
Figure 5-10 shows the change in 2013 incident duration according to incidents occurring on
segments with any ITS (DMS, CCTV, or MVDS) or with only a CCTV or MVDS versus
incidents occurring on segments with no ITS presence. According to statistical tests, in the
SEMTOC region, no significant difference in 2013 incident duration was detected with respect to
presence of ITS devices at a 95% confidence level. However, one notable result is the 2.02
minute reduction of LCAR incident duration for those incidents occurring within the “Detroit”
ITS region compared to those outside the region. No 2013 FCP assist duration reductions were
observed with regard to ITS influence. This may be explained by the nature of roadway segments
with ITS devices to experience higher traffic volumes, thus affecting the ability of FCP patrol
vehicles to quickly respond and clear an incident.
2009 2010 2011 2012 2013
SEMTOC_Incident 57 46.8
WMTOC_Incident 54 75 81 69 54.9
STOC_Incident 117.2
0
20
40
60
80
100
120
140
LC
AR
In
cid
ent
Du
rati
on
All TOC LCAR Incident Duration

Costs and Benefits of MDOT ITS Deployments
104
Further, 2013 SEMTOC LCAR incidents were classified by type according to either
shoulder affected, number of lanes blocked, or other as shown in Table 5-9. A comparison was
made between LCAR incidents occurring anywhere within the SEMTOC region versus those
occurring within the defined “Detroit” ITS region. As seen, very little difference was noticed in
incident duration, regardless of type, as affected by ITS. The most positive scenario appears to be
incidents classified as “Shoulder” or “One Lane” blocked, 0.93 minute and 3.3 minute reductions,
respectively.
Figure 5-10: 2013 SEMTOC Incident Duration ITS Comparisons
Table 5-8: 2013 SEMTOC Incident Duration Reductions
SEMTOC
LCAR Assist
Average
Incident
Duration
Reduction of
Incident Duration
Average
Incident
Duration
Reduction of
Incident Duration
Incidents in the
area with no ITS 47.37 - 20.38 -
Incidents in the
area with ITS 46.86 0.51 21.08 -0.7
Incidents in the
area with MVDS 46.6 0.77 20.96 -0.58
Incidents in the
area with CCTV 47.35 0.02 21.21 -0.83
Incidents outside
Detroit 49.16 - 16.91
Incidents within
Detroit 47.14 2.02 20.76 -3.85
SEMTOCSEMTOCNon-ITS
SEMTOC ITSSEMTOC
MVDSSEMTOC
CCTVDetroit
OutsideDetroit
LCAR Duration 47.15 47.37 46.86 46.60 47.35 47.14 49.16
Assist Duration 20.64 20.38 21.08 20.96 21.21 20.76 16.91
0.00
10.00
20.00
30.00
40.00
50.00
60.00
Inci
den
t D
ura
tio
n (
Min
ute
s)
SEMTOC Incident Duration ITS Comparisons

Costs and Benefits of MDOT ITS Deployments
105
Table 5-9: 2013 SEMTOC LCAR Incident Duration by Lanes Blocked
Type
SEMTOC Detroit Outside Detroit
Count
Average
Duration
(Min)
Count
Average
Duration
(Min)
Count
Average
Duration
(Min)
Shoulder 5207 45.83 5190 45.83 17 46.76
1 Lane 1443 38.05 1434 38.03 9 41.33
2+ Lanes 118 21.96 118 21.96 0 -
All Lanes 230 124.86 226 125.54 4 86.50
Other 812 53.43 805 53.51 7 43.71
Total/Avg. 7810 47.15 7773 47.14 37 49.16
2013 WMTOC Incident Duration Reduction Analysis
As with the SEMTOC data, statistical analysis was performed to determine the impact of
ITS on 2013 incident duration in WMTOC. Figure 5-11 compares the incident duration on
segments with ITS presence versus those without ITS devices installed and operating according
to year 2013. Positively, a revealing trend is found by comparing the incident duration at
segments within the defined “Grand Rapids” ITS region and those outside the region. As of year
2013, the average incident duration on “Grand Rapids” segments is 20.89 minutes lower than the
average duration on segments outside the region. CCTVs are found to be most effective in
reducing incident duration, at an improvement of 0.79 minutes on any segment with at least one
CCTV within the entire WMTOC region.
Figure 5-11: 2013 WMTOC Incident Duration ITS Comparisons
WMTOCWTMOCNon-ITS
WMTOC ITSWMTOC
MVDSWMTOC
CCTVGR Outside GR
Duration 48.30 48.36 48.28 47.84 47.57 47.55 68.42
0.0010.0020.0030.0040.0050.0060.0070.0080.00
Inci
den
t D
ura
tio
n (
Min
ute
s)
WMTOC Incident Duration ITS Comparisons

Costs and Benefits of MDOT ITS Deployments
106
Table 5-10: 2013 WMTOC Incident Duration Reductions
WMTOC Incident
Average Incident Duration Reduction of Incident Duration
Incidents in the area with no ITS 48.36 -
Incidents in the area with ITS 48.28 0.08
Incidents in the area with MVDS 47.84 0.52
Incidents in the area with CCTV 47.57 0.79
Incidents outside Grand Rapids 68.42
Incidents within Grand Rapids 47.55 20.87
STOC Incident Duration Reduction Analysis
Regarding 2013 STOC incident duration, as shown in Table 5-11 assist duration is
sharply decreasing with time. The average assist duration decreased significantly from 63.2
minutes in 2012 to 28.7 minutes in 2013. This result differs from the other TOC regions and
might be explained by rapid deployment of ITS devices and FCP services in STOC managed
corridors in 2013.
Once again, a statistical analysis was performed to verify the impact of ITS on reducing
incident duration, as depicted in Figure 5-12. As of year 2013, the average assist duration on ITS
segments is 5.47 minutes lower than on non-ITS segments. CCTVs are found to be effective in
reducing assist duration, showing a 5.82 minute improvement. Similar trends were observed for
the STOC LCAR data. As of year 2013, the reduction of incident duration is found to be 44.87
minutes for general ITS devices and 57.66 minutes for CCTVs.
Given that LCAR data is utilized in the STOC region for reporting purposes, a similar
analysis was conducted as for the SEMTOC case to determine the impact of ITS on incident
duration by type of incident, as shown in Table 5-13. The results show that average incident
duration is reduced in STOC ITS regions one and two by 49.45 minutes and 67.17 minutes,
respectively. The largest benefit of ITS appears to occur during incidents blocking either one-
lane or all lanes.

Costs and Benefits of MDOT ITS Deployments
107
Table 5-11: Comparison of Incident Duration (STOC – Assisted)
Year Average Incident Duration Reduction of Incident
Duration
2011 71.8 minutes -
2012 64.4 minutes 7.4 minutes
2013 28.7 minutes 35.7 minutes
Figure 5-12: 2013 STOC Incident Duration ITS Comparisons
Table 5-12: 2013 STOC Incident Duration Reductions
STOC
LCAR Assist
Average
Incident
Duration
Reduction of
Incident Duration
Average
Incident
Duration
Reduction of
Incident Duration
Incidents in the
area with no ITS 128.69 - 28.4 -
Incidents in the
area with ITS 83.82 44.87 22.93 5.47
Incidents in the
area with MVDS 71.44 57.25 21.54 6.86
Incidents in the
area with CCTV 71.03 57.66 22.58 5.82
Incidents within
STOC Region 1 73.65 55.04 64.25 -35.85
Incidents within
STOC Region 2 55.93 72.76 19.15 9.25
STOCSTOC Non-
ITSSTOC ITS STOC MVDS STOC CCTV
STOCRegion 1
STOCRegion 2
LCAR Duration 123.10 128.69 83.82 71.44 71.03 73.65 55.93
Assist Duration 27.04 28.40 22.93 21.54 22.58 64.25 19.15
0.00
20.00
40.00
60.00
80.00
100.00
120.00
140.00
Inci
den
t D
ura
tio
n (
Min
ute
s)

Costs and Benefits of MDOT ITS Deployments
108
Table 5-13: 2013 STOC LCAR Incident Durations by Lanes Blocked
Type
STOC STOC Reg_1 STOC Reg_2 STOC No ITS
Count
Average
Duration
(Min)
Count
Average
Duration
(Min)
Count
Average
Duration
(Min)
Count
Average
Duration
(Min)
Shoulder 303 74.52 42 78.21 25 52.12 237 76.35
1 Lane 546 89.81 89 65.58 39 53.51 457 91.79
2+ Lanes 8 48.00 1 49.00 2 47.00 7 50.14
All Lanes 576 180.99 36 90.75 5 80.40 557 183.12
Other 69 125.33 4 57.50 4 77.25 57 119.86
Total/Avg. 1502 123.10 172 73.65 75 55.93 1315 128.69
5.3 Summary
This section of the report focused on incident analysis by first introducing and summarizing
officially reported measures of effectiveness by each of the three MDOT TOCs. A descriptive
statistical incident duration analysis followed based on processed data provided by the TOCs, in
an effort to determine incident reduction as a result of ITS. Finally, incident delay analysis as
affected by ITS was performed.
The most notable effect of ITS observed in reducing incident duration occurred in the
STOC region, which saw a 35.7 minute assisted incident reduction as a result of ITS. For LCAR
incidents, the reduction was more substantial at 44.9 minutes for all ITS and 57.7 minutes for
CCTVs. Additionally, in the defined STOC ITS Regions One and Two, average LCAR incident
duration is reduced by 49.5 minutes and 67.2 minutes, respectively, with the largest benefit
occurring with regard to incidents blocking either one lane or all lanes. Through incident delay
analysis, it was determined that ITS can reduce average incident delay by 8.2%, from 0.61 to
0.56 minutes per vehicle.

Costs and Benefits of MDOT ITS Deployments
109
Chapter 6 Modeling ITS Corridors
6.1 Introduction
The objective of corridor microsimulation is to quantify detailed benefits resulting from MDOT
ITS. In this project, the research team selected a sample of representative corridors from each of
the three MDOT TOCs. The Quadstone Paramics traffic microsimulation software package was
utilized to quantify benefits from “with/without” ITS scenarios with regards to freeway incident
management. MDOT’s incident management programs strive to produce savings in congestion
cost, reduce incident duration, reduce motorist delay, and improve safety by minimizing the
probability of secondary crash occurrence.
In the United States, freeway and arterial incident management programs have reduced
incident duration from 15 to 70 percent (Bertini 2001, Dougald 2008, Petrov 2002). Simulation
studies are more suitable for urban roadways where traffic signals and congestion are more
frequent. They have been used in the past to evaluate the following ITS applications:
ICM deployment
Crash prevention and safety
Work Zone Management
System impact of TMCs
Impact of ATIS
The devices under investigation in the present simulation study with regards to freeway and
arterial traffic incident management are DMS, CCTV and MVDS. These ITS devices are
investigated with regards to their effect to induce short-term, near-incident alternate route
diversion. In addition, the impact of FCP’s ability to reduce incident duration is simulated
through various incident duration reduction scenarios. The nature of ATIS to delay or cancel a
vehicle trip or seek a more long-term, corridor-level alternate route diversion is investigated
through network vehicle demand reduction scenarios.

Costs and Benefits of MDOT ITS Deployments
110
6.2 Selection of Corridors
Seven major MDOT freeway corridors were selected for the simulation study. The corridor
characteristics under consideration for site selection included AADT, ITS device density,
economic impact and crash/incident history. The goal of the study was to choose a representative
selection of corridors whose analysis and subsequent results could be transferrable to other
corridors statewide. A list and description of the corridors ultimately selected is below with a
more comprehensive summary depicted in Table A-13 in the Appendix:
SEMTOC SS1 – I-75 between I-696 & M8 (5.25 mi)
SEMTOC SS2 – I-94 between Weir & I-96 (3.3 mi)
SEMTOC SS3 – I-275 between M-14/I-96 & I-696 (7 mi)
WMTOC SS4 – US-131 between M-11(28th
St.) & I -196 (4.9 mi)
WMTOC SS5 – I-196 between I-96 & Lake Michigan (5.7 mi)
STOC SS6 – I-96 between Grand River & US-23 (6.75 mi)
STOC SS7 – I-75 between Holland & Dixie (4.8 mi)
Figure 6-1 below depicts the locations of the seven selected sites, numbered according to
the list above. A more detailed rendition of spatial locations of ITS devices on the seven
corridors are provided in Figure A-1 through Figure A-7 in the Appendix.
Figure 6-1: Proposed Study Sites Selected

Costs and Benefits of MDOT ITS Deployments
111
6.3 Modeling Procedure
6.3.1 Introduction
The corridor microsimulation model procedure is a thorough and sequential process, as depicted
in Figure 6-2 below. In addition to using the Paramics microsimulation software package, other
software such as ArcGIS, TransCAD, and Excel are used to perform all required tasks.
TransCAD is used to develop the Sub-Area Origin-Destination matrices from regional travel
demand models, when available (all study sites barring STOC SS6 and STOC SS7). When a
regional travel demand model is not available, Paramics Estimator is used to estimate a Sub-Area
O-D matrix. MVDS and PTR data were used to formulate time-of-day travel patterns, vehicle
classification and model validation. The model development procedure is iterative in order to
achieve a desirable level of accuracy.
Figure 6-2: Simulation Model Development Procedure

Costs and Benefits of MDOT ITS Deployments
112
6.3.2 Network Development
Model development begins with coding of the highway network in Paramics Modeller. In
Paramics, building a network consists of placing node “Junction” at key locations, typically
either at roadway intersections or points on the roadway where the number of lanes changes.
Once two corresponding junctions are coded, a roadway “Link” is coded, connecting the two
nodes. Paramics has a built-in, scalable Bing Maps overlay map tool, considerably hastening the
network coding process. Once the network of “Junctions” and “Links” are coded, various other
network attributes can be altered, such as lane attributes, signal control, control points, zone
elements, etc. An example of the WMTOC SS5 coded network is shown in Figure 6-3 below
(network represented in yellow):
Figure 6-3: WMTOC SS5 Paramics Network

Costs and Benefits of MDOT ITS Deployments
113
Following network coding is development of subarea O-D matrices, either based on MPC
regional travel demand models or estimated through Paramics Estimator. The Southeast
Michigan Council of Governments (SEMCOG) and Grand Valley Metropolitan Council (GVMC)
provided their latest regional travel demand models in TransCAD files. Subarea polygons were
developed in TransCAD to accurately contain the entire study region around the selected
corridors. A TransCAD map of the GVMC and SEMCOG travel demand models are shown in
Figure A-8 and Figure A-9 the Appendix. The map in Figure 6-4 reveals the defined subarea
polygon (colored black) for WMTOC SS5.
Once the subarea is defined, TransCAD is used to develop the subarea O-D matrix. The
TransCAD subarea O-D nodes are converted to Paramics “Zones” and inputted into Modeller in
the Demand Editor tool. If a regional travel demand model was not available, such as in the case
of STOC SS6 and STOC SS7, Paramics Estimator was used to estimate the network O-D matrix
based on supplied link counts and intersection turn volumes. After defining the network O-D
matrix for a corridor, it is necessary to classify vehicle types and proportions on the network. The
FHWA 13-Category vehicle classification scheme was used to code vehicle dimensions, while
PTR data on the corridors was used to determine the vehicle mix. The vehicle mix for WMTOC
SS5 is shown in Table 6-1 below.
Figure 6-4: WMTOC SS5 TransCAD Subarea
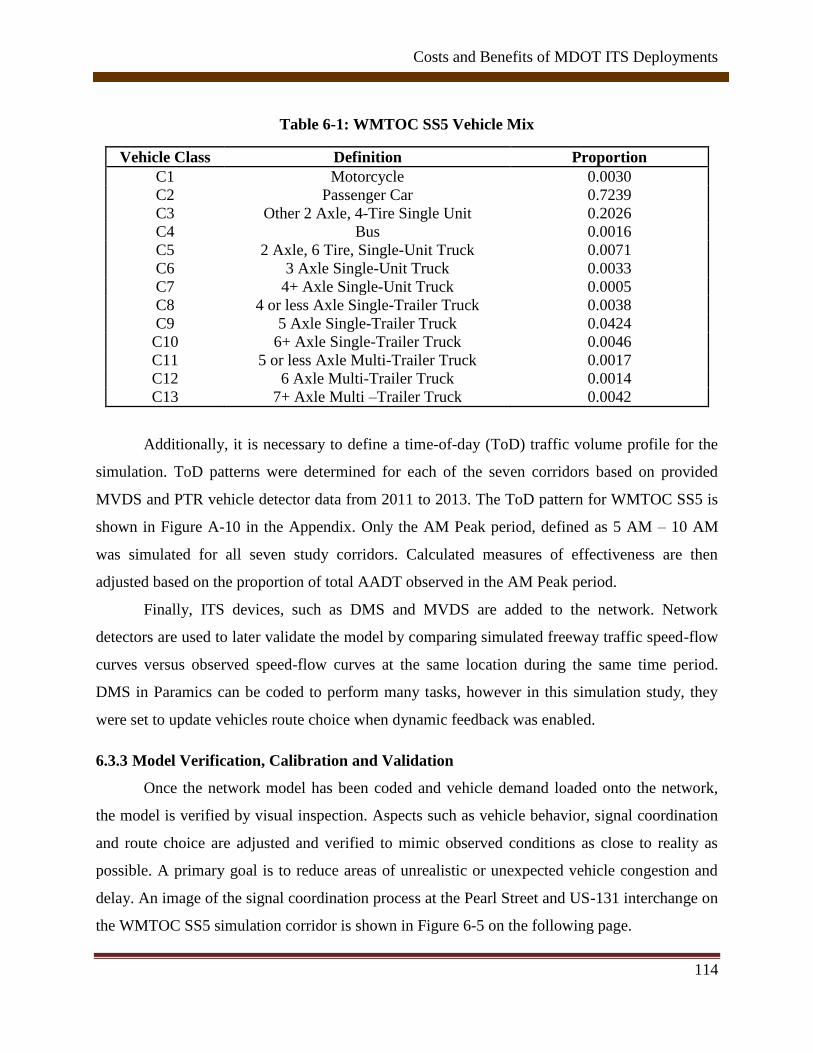
Costs and Benefits of MDOT ITS Deployments
114
Table 6-1: WMTOC SS5 Vehicle Mix
Vehicle Class Definition Proportion
C1 Motorcycle 0.0030
C2 Passenger Car 0.7239
C3 Other 2 Axle, 4-Tire Single Unit 0.2026
C4 Bus 0.0016
C5 2 Axle, 6 Tire, Single-Unit Truck 0.0071
C6 3 Axle Single-Unit Truck 0.0033
C7 4+ Axle Single-Unit Truck 0.0005
C8 4 or less Axle Single-Trailer Truck 0.0038
C9 5 Axle Single-Trailer Truck 0.0424
C10 6+ Axle Single-Trailer Truck 0.0046
C11 5 or less Axle Multi-Trailer Truck 0.0017
C12 6 Axle Multi-Trailer Truck 0.0014
C13 7+ Axle Multi –Trailer Truck 0.0042
Additionally, it is necessary to define a time-of-day (ToD) traffic volume profile for the
simulation. ToD patterns were determined for each of the seven corridors based on provided
MVDS and PTR vehicle detector data from 2011 to 2013. The ToD pattern for WMTOC SS5 is
shown in Figure A-10 in the Appendix. Only the AM Peak period, defined as 5 AM – 10 AM
was simulated for all seven study corridors. Calculated measures of effectiveness are then
adjusted based on the proportion of total AADT observed in the AM Peak period.
Finally, ITS devices, such as DMS and MVDS are added to the network. Network
detectors are used to later validate the model by comparing simulated freeway traffic speed-flow
curves versus observed speed-flow curves at the same location during the same time period.
DMS in Paramics can be coded to perform many tasks, however in this simulation study, they
were set to update vehicles route choice when dynamic feedback was enabled.
6.3.3 Model Verification, Calibration and Validation
Once the network model has been coded and vehicle demand loaded onto the network,
the model is verified by visual inspection. Aspects such as vehicle behavior, signal coordination
and route choice are adjusted and verified to mimic observed conditions as close to reality as
possible. A primary goal is to reduce areas of unrealistic or unexpected vehicle congestion and
delay. An image of the signal coordination process at the Pearl Street and US-131 interchange on
the WMTOC SS5 simulation corridor is shown in Figure 6-5 on the following page.
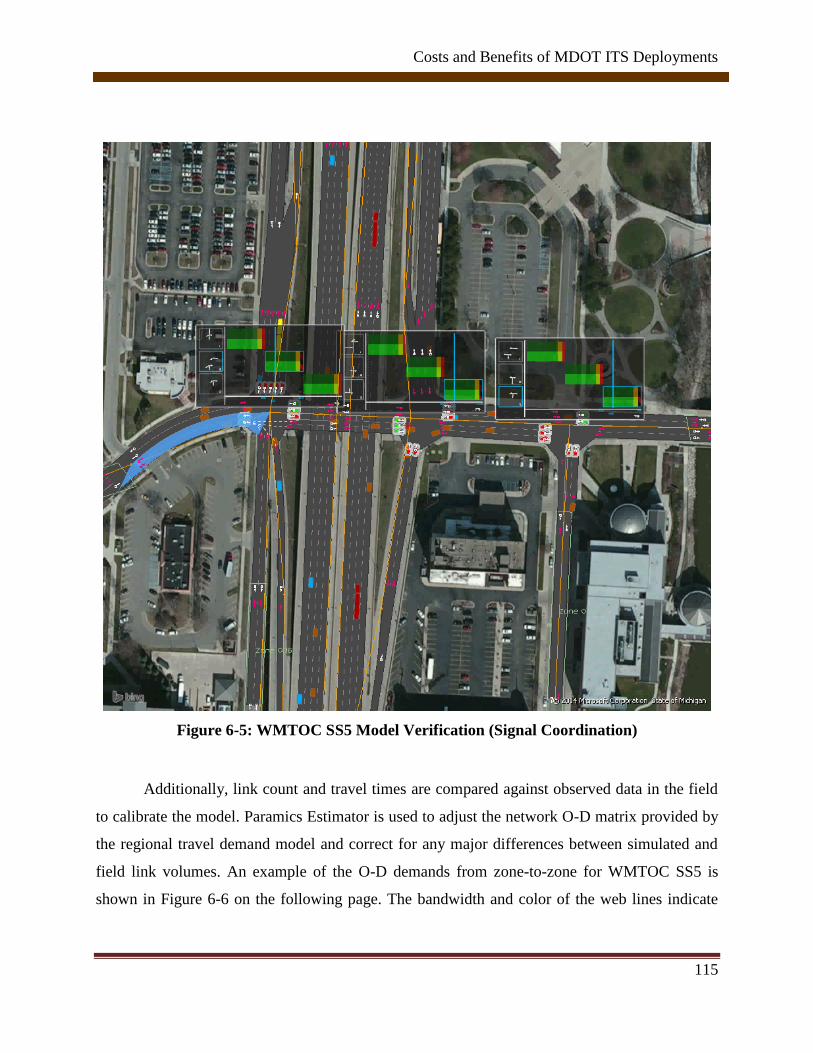
Costs and Benefits of MDOT ITS Deployments
115
Figure 6-5: WMTOC SS5 Model Verification (Signal Coordination)
Additionally, link count and travel times are compared against observed data in the field
to calibrate the model. Paramics Estimator is used to adjust the network O-D matrix provided by
the regional travel demand model and correct for any major differences between simulated and
field link volumes. An example of the O-D demands from zone-to-zone for WMTOC SS5 is
shown in Figure 6-6 on the following page. The bandwidth and color of the web lines indicate

Costs and Benefits of MDOT ITS Deployments
116
the intensity of demand from origin to destination. As seen, the majority of trips are accurately
and realistically either staying on the freeway links or traveling from freeway-to-freeway. The
model is then validated by comparing simulated speed-flow curves at detector locations against
observed speed-flow curves at the same location. An example of such a comparison for a MVDS
on WMTOC SS5 (I-96 Westbound) is provided in Figure 6-7 below. As seen, the shape of the
simulated curve closely mimics curve produced by the field detector if congested condition data
values are ignored.
Figure 6-6: WMTOC SS5 OD Demands Zone-to-Zone

Costs and Benefits of MDOT ITS Deployments
117
Figure 6-7: WMTOC SS5 Simulated vs. Observed Detector Speed-Flow Curves
6.3.4 Simulation Scenarios
In order to evaluate ITS benefits as a result of incident management, various “Base” and “ITS”
case scenarios were developed. Based on the results of the incident duration reduction analysis
performed in the previous section, incidents in duration of 60 minutes to 40 minutes were
modelled on sections of the study site corridors. Locations were chosen based on proximity to a
DMS and route diversion possibilities. Alternate route corridors were modelled in the network
based on MDOT Emergency Routing plans in the WMTOC and SEMTOC, while most probable
routes were modeled for the STOC study corridors. An example of a modeled incident and
potential alternate routes for the WMTOC SS5 corridor are shown in Figure 6-8 and Figure 6-9.
In Figure 6-8, the incident is circled in yellow with detail about remaining incident duration. As
seen, a queue is building behind the incident. In Figure 6-9, the primary route for vehicles
traveling westbound on I-96 is highlighted in red, while potential alternate routes as a result of
diversion are highlighted in blue.
55
60
65
70
75
80
85
0 200 400 600 800 1000 1200 1400 1600 1800
Spe
ed
(m
ph
)
Flow (vphpl)
WM MVDS 120 WB Speed-Flow Curve
Observed
Simulated

Costs and Benefits of MDOT ITS Deployments
118
Figure 6-8: WMTOC SS5 Modeled Incident

Costs and Benefits of MDOT ITS Deployments
119
Figure 6-9: WMTOC SS5 Alternate Routes Example
For base versus ITS case comparisons, the base case is considered to be a simulation run
with no dynamic feedback enabled. Vehicles make route choices based on route cost calculations
made as they are first generated on the network. An ITS case is one where dynamic feedback is
enabled (with route cost calculations updated at one minute intervals) and the closest DMS in
proximity of the incident advises vehicles to make a route choice reevaluation. All vehicles
approaching the DMS update their route choice at each simulation time-step while on the link the
DMS is located. Five simulation runs over the entire five hour AM Peak period were made per
scenario, with simulation seed values being held constant over all scenarios in order to obtain

Costs and Benefits of MDOT ITS Deployments
120
reliable and comparable results. A map of simulated scenarios (indicated by a check mark) is
provided below:
Table 6-2: Simulation Scenario Map
Demand
Simulation Scenarios Modelled
No ITS (Base) With ITS
0 Min 40
Min
45
Min
50
Min
60
Min 0 Min
40
Min
45
Min
50
Min
60
Min
100%
95%
90%
85%
80%
75%
“No Incident” scenarios were modeled to calculate the delay expected due to an incident
without ITS. Incident delay reduction as a result of ITS is calculated with respect to this value,
according to incident duration and/or network vehicle demand reduction. In total, 150 simulation
runs were performed across all scenarios per study corridor.
6.4 Results & Benefits
The benefits of CCTVs, MVDSs, and the FCP (for STOC and SEMTOC cases) in incident
management are evaluated according to incident duration reduction scenarios, for example
reducing total incident duration (the total time lapse beginning at incident detection until incident
clearance from the roadway) from 60 minutes to 40 minutes. The benefit arising from ATIS,
such as the Mi Drive service, is analyzed according to network impacts of reduced vehicle
demand during the time of the incident. The benefits under investigation are system-wide travel
time delay reductions in vehicle hours traveled (VHT), total emission (CO2 and NOx) reductions
in tons, and fuel consumption reductions in grams. Cost values are placed on each of these
benefits.

Costs and Benefits of MDOT ITS Deployments
121
6.4.1 Total Vehicle Hours Traveled and Delay
Total network vehicle hours traveled represents a pivotal network performance measure in this
study, as it allows for calculation of total vehicle hours of delay according to the various
simulation scenarios. A primary mobility benefit of ITS is the ability to reduce motorist vehicle
hours of delay. Thus, a delay reduction analysis was performed on the simulation results. Total
delay due to an incident of X duration was calculated as follows:
𝑇𝑜𝑡𝑎𝑙𝐷𝑒𝑙𝑎𝑦𝐷𝑢𝑒𝑡𝑜𝐼𝑛𝑐𝑖𝑑𝑒𝑛𝑡 = 𝑇𝑜𝑡𝑎𝑙𝑉𝐻𝑇𝑋,𝑁𝑜𝐼𝑇𝑆 − 𝑇𝑜𝑡𝑎𝑙𝑉𝐻𝑇𝑁𝑜𝐼𝑛𝑐𝑖𝑑𝑒𝑛𝑡,𝑁𝑜𝐼𝑇𝑆
The total delay saved by reducing an incident of X duration (at 100% demand) to Y duration (of
variable demand) was calculated as shown below:
𝑇𝑜𝑡𝑎𝑙𝐷𝑒𝑙𝑎𝑦𝑆𝑎𝑣𝑒𝑑 = 𝑇𝑜𝑡𝑎𝑙𝑉𝐻𝑇𝑋,𝑁𝑜𝐼𝑇𝑆 − 𝑇𝑜𝑡𝑎𝑙𝑉𝐻𝑇𝑌,𝐼𝑇𝑆
The total delay saved as result of incident duration reduction alone at 100 percent demand (with
no ITS influence) was calculated as below:
𝑇𝑜𝑡𝑎𝑙𝐷𝑒𝑙𝑎𝑦𝑆𝑎𝑣𝑒𝑑𝑑𝑢𝑒𝑡𝑜𝐷𝑢𝑟𝑎𝑡𝑖𝑜𝑛𝑅𝑒𝑑𝑢𝑐𝑡𝑖𝑜𝑛 = 𝑇𝑜𝑡𝑎𝑙𝑉𝐻𝑇𝑋,𝑁𝑜𝐼𝑇𝑆 − 𝑇𝑜𝑡𝑎𝑙𝑉𝐻𝑇𝑌,𝑁𝑜𝐼𝑇𝑆
Finally, the total delay saved as a result of vehicles detouring due to ITS was calculated as
follows:
𝑇𝑜𝑡𝑎𝑙𝐷𝑒𝑙𝑎𝑦𝑆𝑎𝑣𝑒𝑑𝑑𝑢𝑒𝑡𝑜𝐼𝑇𝑆
= 𝑇𝑜𝑡𝑎𝑙𝐷𝑒𝑙𝑎𝑦𝑆𝑎𝑣𝑒𝑑 − 𝑇𝑜𝑡𝑎𝑙𝐷𝑒𝑙𝑎𝑦𝑆𝑎𝑣𝑒𝑑𝑑𝑢𝑒𝑡𝑜𝐷𝑢𝑟𝑎𝑡𝑖𝑜𝑛𝑅𝑒𝑑𝑢𝑐𝑡𝑖𝑜𝑛
A summarized version of the results at just the 100 percent demand case is provided below in
Table 6-3. As seen, the delay saved due to incident duration reduction is highest in high duration,
high reduction scenarios, such as the reduction from 60 minutes to 40 minutes. The results vary
by corridor, but all corridors show a positive result in delay savings due to duration reduction.
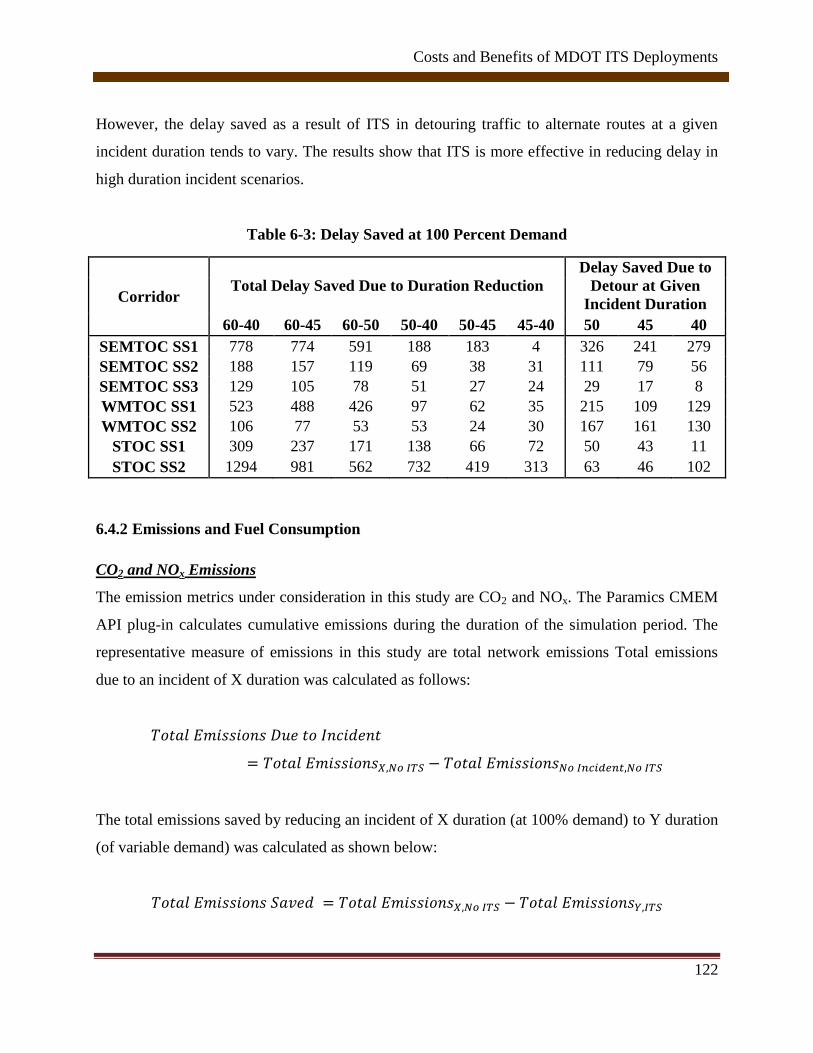
Costs and Benefits of MDOT ITS Deployments
122
However, the delay saved as a result of ITS in detouring traffic to alternate routes at a given
incident duration tends to vary. The results show that ITS is more effective in reducing delay in
high duration incident scenarios.
Table 6-3: Delay Saved at 100 Percent Demand
Corridor Total Delay Saved Due to Duration Reduction
Delay Saved Due to
Detour at Given
Incident Duration
60-40 60-45 60-50 50-40 50-45 45-40 50 45 40
SEMTOC SS1 778 774 591 188 183 4 326 241 279
SEMTOC SS2 188 157 119 69 38 31 111 79 56
SEMTOC SS3 129 105 78 51 27 24 29 17 8
WMTOC SS1 523 488 426 97 62 35 215 109 129
WMTOC SS2 106 77 53 53 24 30 167 161 130
STOC SS1 309 237 171 138 66 72 50 43 11
STOC SS2 1294 981 562 732 419 313 63 46 102
6.4.2 Emissions and Fuel Consumption
CO2 and NOx Emissions
The emission metrics under consideration in this study are CO2 and NOx. The Paramics CMEM
API plug-in calculates cumulative emissions during the duration of the simulation period. The
representative measure of emissions in this study are total network emissions Total emissions
due to an incident of X duration was calculated as follows:
𝑇𝑜𝑡𝑎𝑙𝐸𝑚𝑖𝑠𝑠𝑖𝑜𝑛𝑠𝐷𝑢𝑒𝑡𝑜𝐼𝑛𝑐𝑖𝑑𝑒𝑛𝑡
= 𝑇𝑜𝑡𝑎𝑙𝐸𝑚𝑖𝑠𝑠𝑖𝑜𝑛𝑠𝑋,𝑁𝑜𝐼𝑇𝑆 − 𝑇𝑜𝑡𝑎𝑙𝐸𝑚𝑖𝑠𝑠𝑖𝑜𝑛𝑠𝑁𝑜𝐼𝑛𝑐𝑖𝑑𝑒𝑛𝑡,𝑁𝑜𝐼𝑇𝑆
The total emissions saved by reducing an incident of X duration (at 100% demand) to Y duration
(of variable demand) was calculated as shown below:
𝑇𝑜𝑡𝑎𝑙𝐸𝑚𝑖𝑠𝑠𝑖𝑜𝑛𝑠𝑆𝑎𝑣𝑒𝑑 = 𝑇𝑜𝑡𝑎𝑙𝐸𝑚𝑖𝑠𝑠𝑖𝑜𝑛𝑠𝑋,𝑁𝑜𝐼𝑇𝑆 − 𝑇𝑜𝑡𝑎𝑙𝐸𝑚𝑖𝑠𝑠𝑖𝑜𝑛𝑠𝑌,𝐼𝑇𝑆

Costs and Benefits of MDOT ITS Deployments
123
The total emissions saved as result of incident duration reduction alone at 100 percent demand
(with no ITS influence) was calculated as below:
𝑇𝑜𝑡𝑎𝑙𝐸𝑚𝑖𝑠𝑠𝑖𝑜𝑛𝑠𝑆𝑎𝑣𝑒𝑑𝑑𝑢𝑒𝑡𝑜𝐷𝑢𝑟𝑎𝑡𝑖𝑜𝑛𝑅𝑒𝑑𝑢𝑐𝑡𝑖𝑜𝑛
= 𝑇𝑜𝑡𝑎𝑙𝐸𝑚𝑖𝑠𝑠𝑖𝑜𝑛𝑠𝑋,𝑁𝑜𝐼𝑇𝑆 − 𝑇𝑜𝑡𝑎𝑙𝐸𝑚𝑖𝑠𝑠𝑖𝑜𝑛𝑠𝑌,𝑁𝑜𝐼𝑇𝑆
Finally, the total emissions saved as a result of vehicles detouring due to ITS was calculated as
follows:
𝑇𝑜𝑡𝑎𝑙𝐸𝑚𝑖𝑠𝑠𝑖𝑜𝑛𝑠𝑆𝑎𝑣𝑒𝑑𝑑𝑢𝑒𝑡𝑜𝐼𝑇𝑆
= 𝑇𝑜𝑡𝑎𝑙𝐸𝑚𝑖𝑠𝑠𝑖𝑜𝑛𝑠𝑆𝑎𝑣𝑒𝑑
− 𝑇𝑜𝑡𝑎𝑙𝐸𝑚𝑖𝑠𝑠𝑖𝑜𝑛𝑠𝑆𝑎𝑣𝑒𝑑𝑑𝑢𝑒𝑡𝑜𝐷𝑢𝑟𝑎𝑡𝑖𝑜𝑛𝑅𝑒𝑑𝑢𝑐𝑡𝑖𝑜𝑛
A summary of the emissions saved by corridor at the 100 percent demand scenario is shown in
Table 6-4 and Table 6-5. As seen, greater benefit is typically experienced from duration
reduction in high duration, high reduction scenarios over all corridors. Additionally, total
emissions benefit saved by ITS tends to be highest at higher incident duration scenarios,
regardless of duration reduction.
Table 6-4: CO2 Emissions Saved at 100% Demand
Corridor Total Emissions Saved Due to Duration Reduction, Grams
Total Emissions Saved by ITS at Given
Duration, Grams
60-40 60-45 60-50 50-40 50-45 45-40 50 45 40
SEMTOC SS1 4,129,533 3,547,523 2,637,383 1,492,149 910,139 582,010 1,780,214 1,335,916 1,067,009
SEMTOC SS2 1,173,304 879,978 586,652 586,652 293,326 293,326 812,488 543,255 324,317
SEMTOC SS3 596,178 493,056 342,482 253,696 150,574 103,122 299,700 216,514 181,334
WMTOC SS1 3,058,668 2,912,915 2,487,231 571,437 425,684 145,753 584,980 373,945 363,249
WMTOC SS2 505,320 370,129 266,342 238,978 103,788 135,190 490,834 623,413 424,167
STOC SS1 1,925,212 1,463,234 1,038,905 886,307 424,329 461,978 293,116 224,718 16,025
STOC SS2 2,296,329 1,722,247 1,148,164 1,148,164 574,082 574,082 1,612,707 986,864 510,227

Costs and Benefits of MDOT ITS Deployments
124
Table 6-5: NOx Emissions Saved at 100% Demand
Corridor Total Emissions Saved Due to Duration Reduction, Grams
Total Emissions Saved by ITS
at Given Duration, Grams
60-40 60-45 60-50 50-40 50-45 45-40 50 45 40
SEMTOC SS1 6,858 4,858 3,634 3,225 1,225 2,000 2,683 1,970 655
SEMTOC SS2 2,188 1,641 1,094 1,094 547 547 1,735 1,247 897
SEMTOC SS3 531 462 351 179 110 69 691 597 611
WMTOC SS1 4,704 3,528 2,352 2,352 1,176 1,176 2242 828 144
WMTOC SS2 688 573 445 244 128 116 232 559 235
STOC SS1 3,131 2,399 1,653 1,478 746 732 496 280 158
STOC SS2 1,613 1,210 806 806 403 403 1,573 1,713 1,854
Fuel Consumption
The total fuel consumption saved by vehicles during an incident situation represents another key
potential environmental benefit of ITS. Similar to the emissions outputs, the Paramics CMEM
API Plug-in generates cumulative network wide total vehicle fuel consumption during the
entirety of the simulation period. The fuel consumption saved as result of incident duration
reduction and ITS-influenced detour were calculated in a similar manner as delay and emissions,
as explained earlier. A summary of the fuel consumption saved at the 100% demand scenario by
study corridor is provided in below:
Table 6-6: Fuel Consumption Saved at 100% Demand
Corridor Total Fuel Consumption Saved Due to Duration Reduction
Total Fuel Consumption Saved
by ITS at Given Duration
60-40 60-45 60-50 50-40 50-45 45-40 50 45 40
SEMTOC SS1 1,536,162 1,312,239 977,128 559,034 335,111 223,923 626,992 468,474 366,302
SEMTOC SS2 463,732 380,174 282,370 181,362 97,804 83,558 298,529 212,381 157,988
SEMTOC SS3 215,670 177,211 118,237 97,433 58,974 38,459 116,319 84,164 71,117
WMTOC SS1 1,064,183 1,023,200 875,670 188,513 147,530 40,983 371,594 57,166 170,057
WMTOC SS2 174,151 129,697 92,364 81,787 37,334 44,453 138,624 182,262 107,999
STOC SS1 711,590 541,366 380,189 331,402 161,177 170,224 112,027 78,196 4,914
STOC SS2 846,667 635,000 423,333 423,333 211,667 211,667 660,153 601,623 543,093
Costs and Benefits of MDOT ITS Deployments
125
As seen above, the fuel consumption benefit is highest at high duration, high reduction scenarios,
similar to other studied benefits. Another expected result is that total fuel consumption saved by
ITS tends to be greatest at high incident duration scenarios.
6.5 Conclusion
The simulation study provided valuable insight into the operational performance of ITS on the
corridor level. Analysis determined that ITS was most beneficial in high duration, high reduction
scenarios. Many factors governed the results according to each corridor, namely, traffic volume,
network configuration and ITS device placement. Given the complexity of the analysis and the
random nature of incident occurrence, the results of this study should be viewed as a limited,
representative sample of ITS performance on the corridor-level. However, given that ITS
functions as a cohesive system, rather than in isolation, accurate cost-benefit analysis was
performed on the TOC level, as covered in the following chapter.

Costs and Benefits of MDOT ITS Deployments
126
Chapter 7 Cost and Benefit Analysis
7.1 Introduction
A cost-benefit analysis was performed at two levels: (1) by TOC and (2) by device. For purposes
of cost-benefit analysis, the base year was assumed to be 2012. The analysis period extends for
20 years after base ITS deployment, while applying a 3 percent discount rate over the duration.
All calculation was based on present value as of 2012 by applying the discount rate, as shown in
the equation below:
𝑃𝑉 =𝐹𝑉
(1 + 𝑖)𝑡
Where:
PV= Present discounted value of a future payment from year t
FV = Future Value of payment in year t
i = Discount rate applied
t = Years in the future for payment (where base year of analysis is t = 0)
Three measures are typically used in cost-benefit analysis, as described below:
Benefit-Cost ratio (BCR):
𝐵𝐶𝑅 =𝑃𝑟𝑒𝑠𝑒𝑛𝑡𝑉𝑎𝑙𝑢𝑒𝐼𝑇𝑆𝐵𝑒𝑛𝑒𝑓𝑖𝑡𝑠
𝑃𝑟𝑒𝑠𝑒𝑛𝑡𝑉𝑎𝑙𝑢𝑒𝐼𝑇𝑆𝐶𝑜𝑠𝑡𝑠
Net Present Value (NPV):
𝑁𝑃𝑉 = 𝑃𝑟𝑒𝑠𝑒𝑛𝑡𝑉𝑎𝑙𝑢𝑒𝐵𝑒𝑛𝑒𝑓𝑖𝑡 − 𝑃𝑟𝑒𝑠𝑒𝑛𝑡𝑉𝑎𝑙𝑢𝑒𝐶𝑜𝑠𝑡
Internal Rate of Return (IRR) is a rate of return to measure the profitability of investments. IRR
is the rate that makes the net present value of all cash flows equal to zero. If the IRR is greater
than the discount rate, the project is regarded as acceptable.
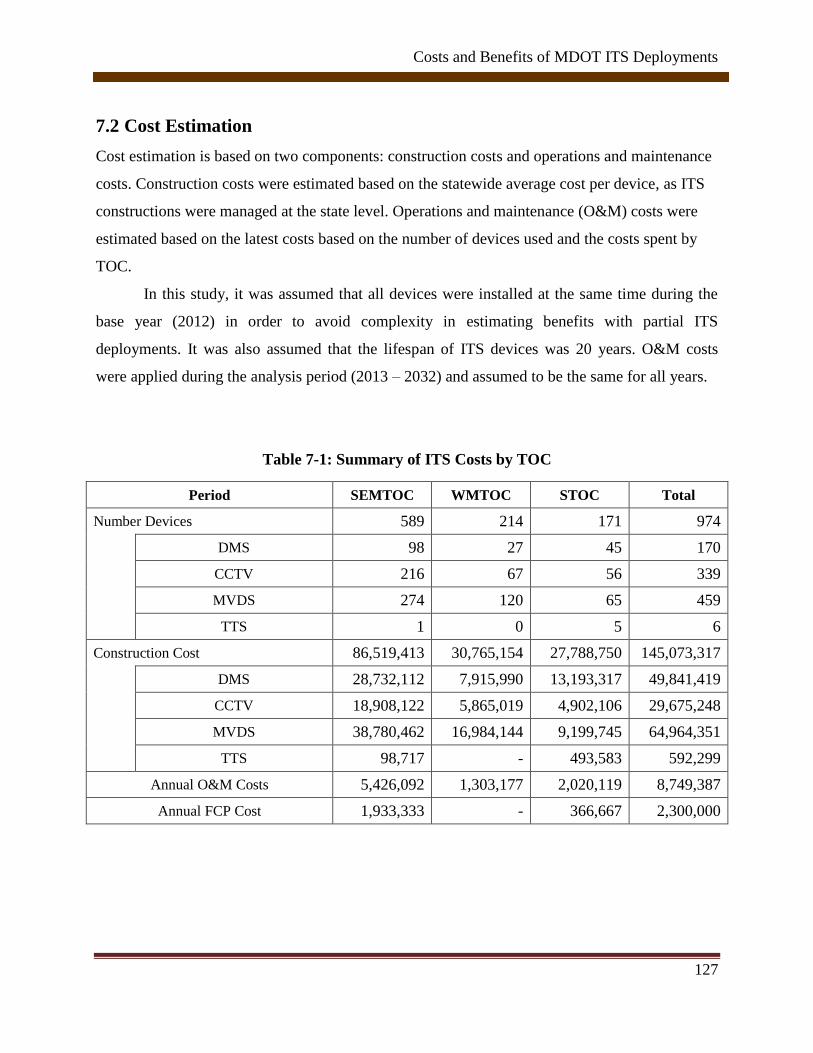
Costs and Benefits of MDOT ITS Deployments
127
7.2 Cost Estimation
Cost estimation is based on two components: construction costs and operations and maintenance
costs. Construction costs were estimated based on the statewide average cost per device, as ITS
constructions were managed at the state level. Operations and maintenance (O&M) costs were
estimated based on the latest costs based on the number of devices used and the costs spent by
TOC.
In this study, it was assumed that all devices were installed at the same time during the
base year (2012) in order to avoid complexity in estimating benefits with partial ITS
deployments. It was also assumed that the lifespan of ITS devices was 20 years. O&M costs
were applied during the analysis period (2013 – 2032) and assumed to be the same for all years.
Table 7-1: Summary of ITS Costs by TOC
Period SEMTOC WMTOC STOC Total
Number Devices 589 214 171 974
DMS 98 27 45 170
CCTV 216 67 56 339
MVDS 274 120 65 459
TTS 1 0 5 6
Construction Cost 86,519,413 30,765,154 27,788,750 145,073,317
DMS 28,732,112 7,915,990 13,193,317 49,841,419
CCTV 18,908,122 5,865,019 4,902,106 29,675,248
MVDS 38,780,462 16,984,144 9,199,745 64,964,351
TTS 98,717 - 493,583 592,299
Annual O&M Costs 5,426,092 1,303,177 2,020,119 8,749,387
Annual FCP Cost 1,933,333 - 366,667 2,300,000

Costs and Benefits of MDOT ITS Deployments
128
7.3 Benefit Estimation
The key focus of MDOT ITS is managing traffic incidents and providing recurrent and non-
recurrent traffic information. In this study, ITS benefits are estimated from these activities. The
benefits of ITS are comprised of travel time saving, secondary incident reduction, fuel
consumption saving, emission cost saving, and crash reduction. Another considered benefit is
using MiDrive to acquire travel information to potentially alter motorist travel decisions.
7.3.1 Travel Delay and Emission Estimation
One of the major benefits of ITS is travel delay saved by reducing incident duration. The time
lapse of an incident consists of six primary stages, which includes reporting time, verification
time, dispatch time, arrival time, clearance time and time to return to normal flow. A figure
depicting these six stages is included below:
Figure 7-1: Timeline of Incidents
In this study, the report time could not be obtained as true time of incident occurrence is
practically impossible to glean from TOC Call Log information. Instead, the first stage of the
incident timeline begins with the reporting of an incident to TOC staff through various means,
either motorist call, police dispatch or FCP patrol vehicle. Once the incident has been reported,
verification can occur through different scenarios, which include TOC operator using a CCTV,

Costs and Benefits of MDOT ITS Deployments
129
FCP patrol vehicle on the scene, or law enforcement personnel on the scene. The time from the
reporting of an incident to verification is classified as verification time, and comprises the entire
incident detection stage. Once an incident has been detected, the response stage begins. The
response stage begins with dispatch time, which is the time from incident verification to FCP or
911 personnel dispatch. In this study, the dispatch time for any particular incident is unknown
due to data limitations. The second component of incident response is the time it takes from
vehicle dispatch to arrive at the incident scene, known as the response time. Once again, in the
present study the true response time is unknown due to data limitations. After a dispatch vehicle
arrives at the scene, the personnel begin clearing the incident. Incident clearance can consist of
two stages: roadway clearance and shoulder clearance. The clearance times obtained from TOC
Call Log information were assumed to be complete incident clearance times. Finally, once the
incident is cleared from the shoulder, roadway traffic begins to return to normal conditions. The
time between incident clearance and the return to normal flow is known as the recovery time. In
the present analysis the “Incident Duration” timespan indicated in Figure 7-1 is considered as the
total time lapse from the reporting of an incident to complete removal according to TOC Call
Log and LCAR database information.
Determining Incident Duration Reduction
Reduction of incident duration was estimated by comparing incident durations from those
incident occurring in the areas with ITS versus those without ITS influence. While the difference
for the SEMTOC area was almost negligible, the difference was evident in WMTOC and STOC.
The determination of incident duration reduction is covered in more detail in Chapter 5 of the
report. A summary of incident duration reduction resulting from ITS is shown in Table 7-2
below:

Costs and Benefits of MDOT ITS Deployments
130
Table 7-2: Estimated Incident Duration Reduction
SEMTOC WMTOC STOC TOTAL
Total Number of Incidents 56,425 1,477 7,458 65,360
LCAR Incidents 8,056 1,477 1,502 11,035
FCP Assisted 48,369 - 5,956 54,325
Average Duration 24.2 54.9 46.5 27.5
LCAR Incidents 47.1 54.9 117.2 57.7
FCP Assisted 20.4 - 28.7 21.3
Average Duration Reduced by ITS 24.5 23.9 32.3 25.38
LCAR Incidents 24.5 23.91)
18.92)
23.66
FCP Assisted 24.5 - 35.7 25.73
1) 24.5 minute reduction for incidents within the ITS dense area; 10 minute reduction for
those outside
2) 44.9 minute reduction for incidents within the ITS dense area; 10 minute reduction for
those outside
Estimation of Incident Delay and Emission
Incident delay was estimated by applying the queue concept in Figure 7-2. As shown in the
figure, the reduced capacity by an incident is the main source of delay. The total delay includes
the time to dissipate the queue after the incident is cleared. The total delay is reduced when the
incident duration is reduced by ITS services.
Based on the concept of queueing, a delay computation model was developed to quantify
the ITS benefit. The model procedure is outlined below:
Step 1: Input incident characteristics
- Location, incident type, incident duration, incident start time
Step 2: Determine location (segment) characteristics from the location data
- Free flow speed, number of lanes, AADT, percentage of commercial vehicles

Costs and Benefits of MDOT ITS Deployments
131
Step 3: Determine capacity and speed reduction factors and set t = 0
Step 4: Run until t > incident duration and queue = 0
4-1: Determine demand based on time-of-day traffic pattern
4-2: Determine capacity, speed, queue length, and delay with/without ITS
4-3: Compute emission and fuel consumption based on the speed
Step 5: Quantify the amount of total delay and emission
Figure 7-2: Estimation of Incident Delay
Traffic demand for each time period (1 minute) is estimated from the 2013 AADT of the
segment and time-of-day traffic pattern. Based on the type of incident, the capacity reduction
Table 7-3) and the speed reduction factor (Table 7-4) are determined. After calculating the
capacity, the number of vehicles in the queue is determined when the demand exceeds the
capacity. Speed of the segment is calculated based on the speed-flow relation in the 2010
Highway Capacity Manual (Figure 7-3) and the amount of emissions is quantified by the
Total delay for in incident with ITS
Delay saving due to ITS

Costs and Benefits of MDOT ITS Deployments
132
emission rates (Figure 7-4) drawn from United States Environmental Protection Agency’s (EPA)
Motor Vehicle Emission Simulator (MOVES).
Table 7-3: Capacity Reduction by Lane Block
Lanes Shoulder Shoulder
Crash
One Lane
Block
Two Lane
Block
Three Lane
Block
1 2 3 4 5
2 0.95 0.81 0.35 0 0
3 0.99 0.83 0.49 0.17 0
4 0.99 0.85 0.58 0.25 0.13
5 0.99 0.87 0.65 0.4 0.2
6 0.99 0.89 0.71 0.5 0.26
7 0.99 0.91 0.75 0.57 0.36
8 0.99 0.93 0.78 0.63 0.41
Source) 2010 Highway Capacity Manual Exhibit 10-17
Table 7-4: Free flow Speed Adjustment Factor
Shoulder One Lane Block Two Lane Block
Non crash 0.99 0.79 0.61
PDO 0.86 0.79 0.61
Injury 0.86 0.79 0.61
Fatal 0.86 0.79 0.61
Source) Guide for Highway Capacity and Operations of Active Transportation and Demand
Management Strategies: Analysis of Operational Strategies under Varying Demand and Capacity
Conditions, June 2013.

Costs and Benefits of MDOT ITS Deployments
133
Figure 7-3: Speed-Flow Relation
Source) 2010 Highway Capacity Manual
Figure 7-4: Emission Rates by Speed
0
5
10
15
20
25
30
0 6 9 12 15 18 21 24 27 30 33 36 39 42 45 48 51 54 57 60 63 66 69
VOC
Nox
CO
PM2.5

Costs and Benefits of MDOT ITS Deployments
134
Table 7-5 summarizes the average delay and saving estimated by each TOC. The delays are
monetized by applying value of time (VOT) suggested by MDOT ($17.7 per hour for passenger
cars and $31.22 for commercial vehicles). The total delay saving estimated is $26.3 Million from
65,360 incidents observed by MDOT ITS.
Table 7-5: Summary of Incident Delay and Saving
SEMTOC WMTOC STOC TOTAL
Average Incident Delay without
ITS (hours / incident) 48.5 234.3 148.6 64.15
LCAR (hours / incident) 307.2 234.3 718.1 353.39
FCP (hours / incident) 5.5 - 5.0 5.40
Average Incident Delay Saving
(hours / incident) 19.3 106.3 24.3 21.80
LCAR (hours / incident) 114.4 106.3 105.3 112.08
FCP (hours / incident) 3.4 - 3.8 3.47
Average Incident Delay Cost
($ / incident) $895 $4,351 $2,772 $1,188
LCAR ($ / incident) $5,667 $4,351 $13,394 $6,543
FCP ($ / incident) $101 - $93 $100
Average Incident Delay Cost
Saving ($ / incident) $355 $1,974 $453 $403
LCAR ($ / incident) $2,110 $1,974 $1,965 $2,072
FCP ($ / incident) $63 - $71 $64
Total Incident Delay Saving ($) $20,053,665 $2,916,013 $3,374,840 $26,344,518
LCAR ($) $16,999,350 $2,916,013 $2,950,967 $22,866,331
FCP ($) $3,054,315 - $423,873 $3,478,188
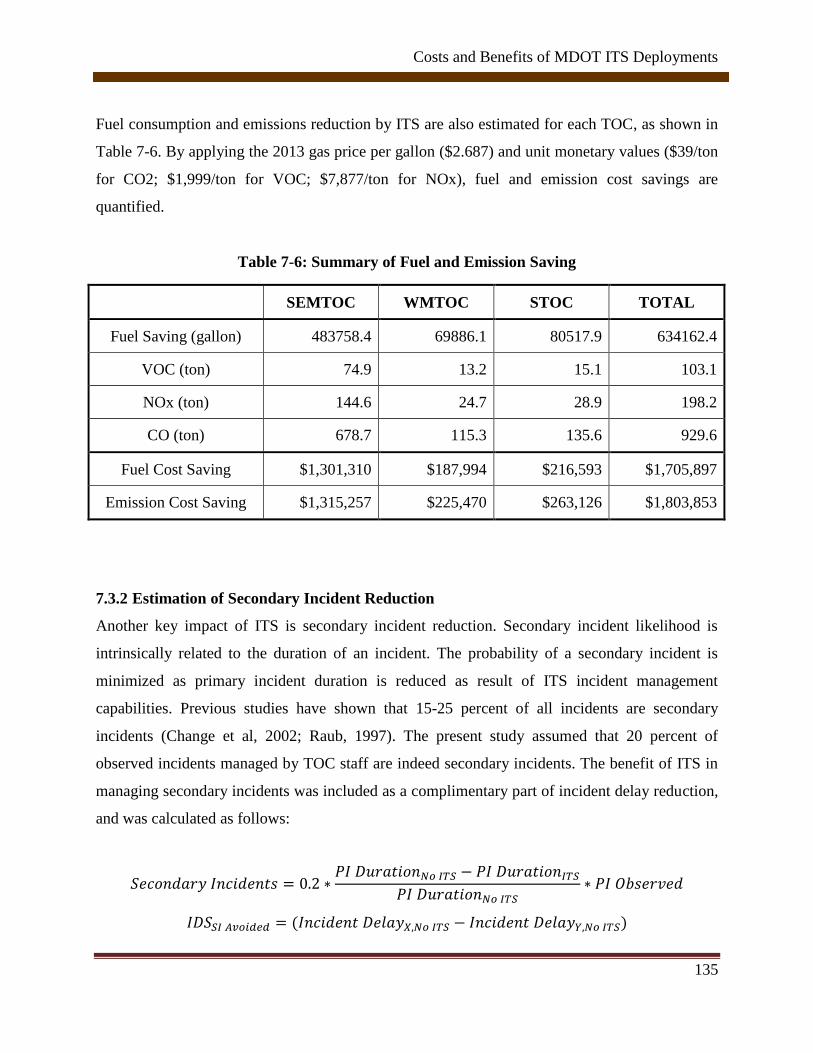
Costs and Benefits of MDOT ITS Deployments
135
Fuel consumption and emissions reduction by ITS are also estimated for each TOC, as shown in
Table 7-6. By applying the 2013 gas price per gallon ($2.687) and unit monetary values ($39/ton
for CO2; $1,999/ton for VOC; $7,877/ton for NOx), fuel and emission cost savings are
quantified.
Table 7-6: Summary of Fuel and Emission Saving
SEMTOC WMTOC STOC TOTAL
Fuel Saving (gallon) 483758.4 69886.1 80517.9 634162.4
VOC (ton) 74.9 13.2 15.1 103.1
NOx (ton) 144.6 24.7 28.9 198.2
CO (ton) 678.7 115.3 135.6 929.6
Fuel Cost Saving $1,301,310 $187,994 $216,593 $1,705,897
Emission Cost Saving $1,315,257 $225,470 $263,126 $1,803,853
7.3.2 Estimation of Secondary Incident Reduction
Another key impact of ITS is secondary incident reduction. Secondary incident likelihood is
intrinsically related to the duration of an incident. The probability of a secondary incident is
minimized as primary incident duration is reduced as result of ITS incident management
capabilities. Previous studies have shown that 15-25 percent of all incidents are secondary
incidents (Change et al, 2002; Raub, 1997). The present study assumed that 20 percent of
observed incidents managed by TOC staff are indeed secondary incidents. The benefit of ITS in
managing secondary incidents was included as a complimentary part of incident delay reduction,
and was calculated as follows:
𝑆𝑒𝑐𝑜𝑛𝑑𝑎𝑟𝑦𝐼𝑛𝑐𝑖𝑑𝑒𝑛𝑡𝑠 = 0.2 ∗𝑃𝐼𝐷𝑢𝑟𝑎𝑡𝑖𝑜𝑛𝑁𝑜𝐼𝑇𝑆 − 𝑃𝐼𝐷𝑢𝑟𝑎𝑡𝑖𝑜𝑛𝐼𝑇𝑆
𝑃𝐼𝐷𝑢𝑟𝑎𝑡𝑖𝑜𝑛𝑁𝑜𝐼𝑇𝑆∗ 𝑃𝐼𝑂𝑏𝑠𝑒𝑟𝑣𝑒𝑑
𝐼𝐷𝑆𝑆𝐼𝐴𝑣𝑜𝑖𝑑𝑒𝑑 = (𝐼𝑛𝑐𝑖𝑑𝑒𝑛𝑡𝐷𝑒𝑙𝑎𝑦𝑋,𝑁𝑜𝐼𝑇𝑆 − 𝐼𝑛𝑐𝑖𝑑𝑒𝑛𝑡𝐷𝑒𝑙𝑎𝑦𝑌,𝑁𝑜𝐼𝑇𝑆)

Costs and Benefits of MDOT ITS Deployments
136
𝐼𝐷𝑆𝐵𝑎𝑠𝑒𝐵𝑒𝑛𝑒𝑓𝑖𝑡 = 𝐼𝐷𝑆𝑆𝐼𝐴𝑣𝑜𝑖𝑑𝑒𝑑 ∗ (𝐶𝑉% ∗ 𝐶𝑉𝑉𝑜𝑇 + 𝑃𝑉% ∗ 𝑃𝑉𝑉𝑜𝑇)
𝑆𝐼𝐵𝑒𝑛𝑒𝑓𝑖𝑡 = 𝐼𝐷𝑆𝐵𝑎𝑠𝑒𝐵𝑒𝑛𝑒𝑓𝑖𝑡 ∗ 𝑆𝑒𝑐𝑜𝑛𝑑𝑎𝑟𝑦𝐼𝑛𝑐𝑖𝑑𝑒𝑛𝑡𝑠
Where:
𝑆𝑒𝑐𝑜𝑛𝑑𝑎𝑟𝑦𝐼𝑛𝑐𝑖𝑑𝑒𝑛𝑡𝑠 = The estimated number of secondary incidents avoided by ITS
𝑃𝐼𝐷𝑢𝑟𝑎𝑡𝑖𝑜𝑛𝑁𝑜𝐼𝑇𝑆= Average duration of incident without ITS
𝑃𝐼𝐷𝑢𝑟𝑎𝑡𝑖𝑜𝑛𝐼𝑇𝑆=Average duration of incident with ITS
𝑃𝐼𝑂𝑏𝑠𝑒𝑟𝑣𝑒𝑑=Observed number of incidents managed by TOC
𝐼𝐷𝑆𝑆𝐼𝐴𝑣𝑜𝑖𝑑𝑒𝑑 =Incident delay saving due to reducing number of secondary incidents
𝐼𝑛𝑐𝑖𝑑𝑒𝑛𝑡𝐷𝑒𝑙𝑎𝑦𝑋,𝑁𝑜𝐼𝑇𝑆=The total incident delay for incident of X duration without ITS
𝐼𝑛𝑐𝑖𝑑𝑒𝑛𝑡𝐷𝑒𝑙𝑎𝑦𝑌,𝑁𝑜𝐼𝑇𝑆=Total incident delay for incident of Y duration without ITS
𝐼𝐷𝑆𝐵𝑎𝑠𝑒𝐵𝑒𝑛𝑒𝑓𝑖𝑡=Monetary incident delay benefit due to base incident duration reduction
𝐶𝑉% =Percentage of commercial vehicle traffic
𝐶𝑉𝑉𝑜𝑇=Commercial vehicle value of time
𝑃𝑉%=Percentage of passenger vehicle traffic
𝑃𝑉𝑉𝑜𝑇 =Passenger vehicle value of time
𝑆𝐼𝐵𝑒𝑛𝑒𝑓𝑖𝑡=Monetary benefit of secondary incident reduction
The secondary incident delay saving by as a result of ITS by TOC is shown in Table 7-7 below:
Table 7-7: Secondary Incident Delay Saving
SEMTOC WMTOC STOC TOTAL
Number of secondary
incidents 11,285 295 1,492 13,072
Number of secondary
incidents avoided 4,479 134 244 4,857
Secondary incident delay
saved (hours) 217,419 31,410 36,188 285,017
Secondary incident delay
saved ($) $4,010,733 $583,203 $674,968 $5,268,904

Costs and Benefits of MDOT ITS Deployments
137
7.3.3 Crash Reduction
Crash analysis was performed to quantify the impact of ITS on the number of crashes observed.
When modeling crash counts, Poisson regression analysis or Negative Binomial (NB) regression
analysis can be used (Yaacob et al, 2011; Zlatoper, 1989; Lord, 2006; Chin and Quddus, 2003;
Miaou and Lum, 1993; and Noland and Quddus, 2004). The relationship between the mean and
the variance dictates the choice between the two model types. If the mean is equal to the variance,
the data is assumed to follow a Poisson distribution, and hence the Poisson regression analysis
can be performed. However, as a result of possible positive correlation between observed
accident frequencies, overdispersion may occur (Hilbe, 2011). Accident frequency observations
are said to be overdispersed if their variance is greater than their mean. If overdispersion is
detected in the data, NB regression analysis should be used. Standard textbooks (for example
Hilbe 2011; Greene 2012; and Washington et al 2011) present clear derivation of the Poisson,
and Negative Binomial (NB) models. According to the Poisson distribution, the probability iyP
of intersection i having iy crashes in a given time period (usually one year) can be written as:
!
)(
i
y
ii
y
EXPyP
i
where i denotes the Poisson parameter for intersection i. By definition, i is equal to the
expected number of crashes in a given time period for intersection i, E[yi]. According to
Washington et al. (2011), the expected number of crash occurrences i , can be related to a vector
of explanatory variables, 𝑿𝑖 as follows:
𝜆𝑖 = 𝐸𝑋𝑃(𝜷𝑿𝑖)
where 𝜷 represents a vector of estimable parameters. Under the Poisson assumption, the mean
and variance of crashes occurring at an intersection in a year are equal (i.e. ii yVaryE ).
With N observations, the parameters of the Poisson model can be estimated by maximum
likelihood method with a function which can be shown to be as follows:

Costs and Benefits of MDOT ITS Deployments
138
𝐿𝐿(𝛽) =∑[−𝐸𝑋𝑃(𝜷𝑿𝑖) + 𝑦𝑖𝜷𝑿𝑖 − ln(𝑦𝑖!)]
𝑁
𝑖=1
The Poisson assumption of equal mean and variance of the observed crash occurrences is not
always true. To handle the cases where the mean and variance of crashes are not equal, the
Poisson model is generalized by introducing an individual, unobserved effect, 𝜀𝑖, in the function
relating crash occurrences and explanatory variables as follows:
𝜆𝑖 = 𝐸𝑋𝑃(𝜷𝑿𝑖 + 𝜀𝑖)
in which iEXP is a gamma-distributed error term with mean one and variance 2 . With such
a modification, the mean i becomes a variable that follows binomial distribution. The mean-
variance relationship becomes:
21 iiiii yEyEyEyEyVar
If α is equal to zero, the negative binomial distribution reduces to Poisson distribution. If α is
significantly different from zero, the crash data are said to be overdispersed (positive value) or
underdispersed (negative value). As stated earlier, overdispersion is a result of possible positive
correlation between observed accident frequencies. When α is significantly different from zero,
the resulting negative binomial probability distribution is:
iy
i
i
ii
i
iy
yyP
11
1
1
11
!
where )(x is a value of the gamma function, iy is the number of crashes for segment i and
is an overdispersion parameter.

Costs and Benefits of MDOT ITS Deployments
139
In this study, crash analysis employed the negative binomial model focusing on the
impact of the number of DMS and other ITS (CCTV and MVDS) on 2013 crashes. Table 7-8
presents the descriptive statistics of the data while Table 7-9 presents the model results.
Table 7-8: Descriptive Statistics
Variable
Description
Min Mean Max
Std.
Dev.
crashes_13 Number of crashes in the segment in 2013 0 13.77 327 17.30
dms_13 Number of DMS in the segment in 2013 0 0.02 3 0.16
other_its_13
Number of other ITS in the segment in
2013 0 0.91 16 0.53
num_lanes Number of lanes of the segment 1 2.53 6 0.84
median_divided Median type (1 = divided, 0 = otherwise) 0 0.44 1 0.50
AADT_13_K Annual Average Daily Traffic (in 1000s) 0 15.45 98.1 16.15
wmtoc West Michigan TOC (1 = yes, 0 = no) 0 0.11 1 0.32
semtoc Southeast Michigan TOC (1 = yes, 0 = no) 0 0.19 1 0.39
length Length of the segment (mi) 0.01 1.66 21.74 1.92
Table 7-9: Model estimation results
crashes_13 Coef. Std. Err. z-Statistic p-Value [95% Conf. Interval]
dms_13 -0.181 0.061 -2.99 0.003 -0.30 -0.06
other_its_13 -0.019 0.017 -1.13 0.257 -0.05 0.01
num_lanes 0.375 0.014 26.92 0.000 0.35 0.40
median_divided -0.176 0.023 -7.71 0.000 -0.22 -0.13
AADT_13_K 0.030 0.001 30.60 0.000 0.03 0.03
wmtoc 0.416 0.030 13.72 0.000 0.36 0.48
semtoc 0.127 0.029 4.40 0.000 0.07 0.18
length 0.274 0.006 46.20 0.000 0.26 0.29
_cons 0.514 0.039 13.07 0.000 0.44 0.59
alpha 0.527 0.010 0.51 0.55
Number of obs = 7233
LR chi2(8) = 4446.83
Prob > chi2 = 0.0000
Log likelihood = -24232.36
Pseudo R2 = 0.0840

Costs and Benefits of MDOT ITS Deployments
140
The model indicates that one DMS is likely to reduce 100*(1-EXP(-0.181)) = 16.6% of crashes
per year, when other factors in the model are controlled. Similarly, the model indicates that one
ITS other than DMS is likely to reduce 100*(1-EXP(-0.019)) = 1.9% of crashes per year, when
other factors in the model are controlled. By using the percentage reduction and the observed
crashes, it was determined that the following (Table 7-10) crashes were most likely reduced by
ITS in 2013.
Table 7-10: Number of crashes reduced by region
Observed
Crashes
Reductions
by DMS
Reductions by
Other ITS
Total
Reduction Segments
SEMTOC 5,559 556 211 767 204
WMTOC 2,543 155 31 286 99
STOC 1,508 116 30 146 73
TOTAL 9,610 827 372 1,199 376
Based on the number of injuries by severity, an average of Michigan crash costs was estimated
as shown in Table 7-11. The crash reduction saving was estimated by multiplying the average
cost of Michigan crashes. As shown in Table 7-12, the total saving from crash reduction by
MDOT ITS was estimated at $20 million.
Table 7-11: Average Crash Cost
Type Crash Cost Number of Injuries in
Michigan Percentage
Fatal $ 4,567,329.60 892 0.2%
Incapacitated $ 239,583.40 4,668 1.0%
Evident $ 63,565.51 14,614 3.0%
Possible Injury $ 29,657.05 41,352 8.5%
PDO $ 2,500.00 427,272 87.4%
Total
488,798 100.0%
Average $ 17,217.62
Source) National Safety Council, Estimating the Costs of Unintentional Injuries, 2012

Costs and Benefits of MDOT ITS Deployments
141
Table 7-12: Crash Reduction Saving
SEMTOC WMTOC STOC TOTAL
Number of crashes
reduced 767 286 146 1199
Total crash reduction
saving $13,205,914 $4,924,239 $2,513,772 $20,643,926
7.3.4 Mi Drive User Benefit
MDOT provides traffic information via the Mi Drive webpage and mobile app. In 2013, there
were a total of 1,707,873 sessions with each session lasting 18.8 minutes on average. The total
amount of time spent was 535,140 hours. The amount of time is regarded as an ITS benefit,
because users willingly spend their time to acquire traffic information worth more than the time
spent. The amount of time spent in Mi Drive is monetized by applying the value of time (VoT)
per person ($12.42) as suggested by the TIGER Benefit-Cost Analysis Resource Guide (2014).
The total benefit from the Mi Drive is estimated at $6,646,434. A time-series chart depicting the
number of Mi Drive hits from 2011 to 2013 is shown in Figure 7-5 below.
Figure 7-5: Number of Sessions Accessed to Mi Drive
0
50000
100000
150000
200000
250000

Costs and Benefits of MDOT ITS Deployments
142
7.3.5 FCP User Satisfaction Benefit
FCP provides assistance to motorists. The benefit is typically valued between $50 - $100 per
assist according to the auto manufacturers and automobile clubs. A previous study (URS, 2006)
conducted a survey in Georgia and obtained an average of $60.25 per assist. In this research, the
user satisfaction benefit was quantified by adopting the same value. Table 7-13 below shows the
estimated user satisfaction benefit obtained for each TOC and in total.
Table 7-13: User Satisfaction Benefit
SEMTOC WMTOC STOC TOTAL
Number of FCP assisted 48,369 0 5,956 5,4325
FCP User Satisfaction Benefit $2,914,232 $0 $358,849 $3,273,081
7.4 Cost and Benefit Analysis Results
7.4.1 Cost and Benefit by TOC
This section summarizes costs and benefits estimated for each TOC. As summarized in Table
7-14, the total annual benefit is estimated at $65.7 million for all three TOCs. Among the three
TOCs, SEMTOC covers more than 70 percent of the total.
Benefit-cost ratios are presented at four different levels of benefits. As shown in Table
7-15, benefit-cost ratios were all greater than 1.0:1, even at the base level, which includes delay,
fuel consumption and emissions savings. When including all benefits, the BCR combined for all
three TOCs was 3.16:1. Among the three TOCs, SEMTOC showed the highest BCR of 3.55:1.
STOC was the lowest, but showed an acceptable BCR of 2.04:1. Based on the estimated costs
and benefits, it can be stated that MDOT’s ITS investment was cost effective, even though its
history was relatively short, except in the SEMTOC coverage area.

Costs and Benefits of MDOT ITS Deployments
143
Table 7-14: Summary of Costs and Benefits
SEMTOC WMTOC STOC TOTAL
Construction Cost $86,519,413 $30,765,154 $27,788,750 $145,073,317
Annual O&M Cost $5,426,092 $1,303,177 $2,020,119 $8,749,387
Annual FCP Cost $1,933,333 $0 $366,667 $2,300,000
Total Annual Benefit $46,764,939 $10,246,404 $8,675,271 $65,686,613
LCAR Delay saving $16,999,350 $2,916,013 $2,950,967 $22,866,331
FCP Delay Saving $3,054,315 $0 $423,873 $3,478,188
Secondary Incident Delay Saving $4,010,733 $583,203 $674,968 $5,268,904
Fuel Saving $1,301,310 $187,994 $216,593 $1,705,897
Emission Saving $1,315,257 $225,470 $263,126 $1,803,853
Crash Saving $13,205,914 $4,924,239 $2,513,772 $20,643,926
MiDrive User Benefit $3,963,827 $1,409,484 $1,273,122 $6,646,434
FCP Satisfaction Benefit $2,914,232 $0 $358,849 $3,273,081
Table 7-15: Summary of Benefit Cost Ratios
SEMTOC WMTOC STOC TOTAL
Sum of Present Value (Cost) $196,009,067 $50,153,131 $63,298,098 $309,460,296
Su
m o
f P
rese
nt
Valu
e (
Ben
efit
) A: Delay + Fuel + Emission $396,945,383 $58,210,798 $67,387,927 $522,544,108
BCR 2.03 1.16 1.06 1.69
B: A + Crash $593,416,042 $131,471,044 $104,786,514 $829,673,599
BCR 3.03 2.62 1.66 2.68
C: B + Mi Drive $652,387,782 $152,440,611 $123,727,361 $928,555,754
BCR 3.33 3.04 1.95 3.00
D: C + FCP Satisfaction $695,744,199 $152,440,611 $129,066,128 $977,250,938
BCR 3.55 3.04 2.04 3.16

Costs and Benefits of MDOT ITS Deployments
144
7.4.2 Costs and Benefits by Device
One of the key characteristics of ITS is integration of transportation information and
management systems to provide benefits to motorists and travelers. ITS devices deployed by
MDOT also work together as a system. However, it may be necessary to investigate costs and
benefits at the individual device level to determine future investment decisions. While it is
difficult to separate ITS benefits by device, there might be differences in utilization of devices
and their effectiveness. In order to identify the difference, the research team conducted phone
interviews with TOC operators to understand the proportion each device type is utilized for daily
operation activities. The overall consensus was that an operator spent 64%, 24% and 12% of
their time for activities related with CCTV, DMS, and MVDS, respectively.
In this study, while the construction costs by device type were estimated by multiplying
the average construction cost, the O&M cost for a device type was estimated by applying the
proportion of the operators’ time for the device type. The benefits were also divided according to
the proportion after allocating the FCP’s portion. The FCP’s portion of benefits was estimated
based on the proportion of delay saving. Crash cost savings were based on the estimated number
of crashes in the crash model.
As shown in Table 7-16, the benefit-cost ratio (BCR) of CCTV was the highest, while
that of MVDS was the lowest. Both FCP and DMS also showed high BCR values. Even though
MVDS are the backbone of ITS through providing basic traffic information, the analysis result
showed a low BCR, due to relatively low utilization. However, it should be noted that TOC
operators are using travel time information obtained from traffic sensors for their proactive
operations decisions.
Table 7-16: Summary of Benefit Cost Ratios by Device
DMS CCTV MVDS FCP
Construction Costs $50,433,719 $29,675,248 $64,964,351 $0
Annual O&M Costs $5,249,632 $2,624,816 $874,939 $2,300,000
Annual Benefits $22,940,145 $28,596,776 $5,361,895 $8,787,797
Sum of PV Cost $89,484,354 $107,776,519 $77,981,230 $34,218,192
Sum of PV Benefit $341,291,433 $425,447,811 $79,771,465 $130,740,229
BCR 3.81 3.95 1.02 3.82
NPV $251,807,079 $317,671,292 $1,790,235 $96,522,037

Costs and Benefits of MDOT ITS Deployments
145
Chapter 8 Conclusion
8.1 Summary of Research
MDOT’s vision for ITS focuses on deploying and maintaining a program which enhances safety,
traffic operations and transportation system integration in a cost-effective and sustainable
manner. As of 2013, three TOCs (SEMTOC, WMTOC and STOC) operate and maintain 149
DMSs, 275 CCTVs and 367 MVDSs, as well as FCP programs, on over 500 miles of Michigan
highways. Given that in recent years, the deployment of new ITS devices into the system has
rapidly escalated, the research team was tasked with evaluating the benefits reaped from MDOT
ITS as a system approach and at the individual device level.
To meet this objective, the research team conducted a comprehensive and rigorous
statewide cost-benefit analysis. A complex spatiotemporal database was developed through GIS
software, fusing 2006-2013 ITS device locations and operation dates, 2006-2013 annual
AADT/CADT, 2010-2012 NAVTEQ minute-by-minute travel time and delay information, 2008-
2013 UD-10 vehicle crash information, 2011-2013 statewide LCAR incident logs and 2007-2013
statewide TOC Call Log data. Further, five ITS device-concentrated regions were defined within
the three TOCs in order to extract the impact of ITS on various performance metrics, including
vehicle delay, crash and incident occurrence, emissions, fuel consumption and others.
A detailed cost analysis was performed based on construction and O&M costs of over 50
MDOT ITS projects between 2006 and 2013. Construction costs included design, construction
and system manager costs, while O&M costs included maintenance, TOC contracts, FCP
contracts, utility costs and MDOT staff costs. All costs were summarized by year and TOC.
Given that traditional cost-benefit analyses purposed for ITS performance evaluation are
limited in their ability to quantify the benefits extracted from travel information dissemination
and motorist behaviors, an online user perception survey was administered to Michigan residents
through the Mi Drive web application. The survey was innovative in its execution and approach
by considering ITS deployments as a cohesive system while gathering responses over an
extended duration across the entire state of Michigan. Statistical analysis was performed on the
survey results to determine interactions between location, time of year, travel behaviors, ITS

Costs and Benefits of MDOT ITS Deployments
146
device familiarity and travel information perceived usefulness and frequency of use. Some key
findings included that DMS, TTS, CCTV and Mi Driver were the most well-known ITS
applications (while familiarity with these devices varied depending on time of year); radio, TV
and Mi Drive were the most frequently used sources of pre-departure travel information; the
overwhelming majority (93 percent) of users at least somewhat trust DMS information and most
often find it to relieve anxiety and guide them to alternate routes (results showed preference
towards prescriptive message types); and FCP assisted motorists were willing to wait at least 15
minutes longer (many up to 30 minutes longer) than actual, experienced wait times.
The previously mentioned ArcGIS database was used to perform a cross-sectional
analysis of the impact of ITS on reducing incident duration, a key player in user delay reduction.
As described, individual LCAR incident and TOC Call Log events were aggregated to their
associated roadway segments. For each of the roughly 7,300 defined MDOT highway segments,
ITS device density (per unit of length in miles) was determined. The study compared 2013
incident and FCP assist durations on segments both with and without ITS influence and obtained
18.9 to 24.5 minute reductions for LCAR incidents and 24.5 to 35.7 minute reductions for FCP
assisted events. These incident duration reductions fall in line with results estimated in other
influential studies. The STOC experienced the largest incident duration reductions as a result of
2013, likely due to mass ITS device deployments in 2012.
In order to better understand the impact of ITS on the operational level, a traffic
microsimulation study was conducted on seven selected study corridors in Michigan. These
corridors were chosen on the basis of ITS density, daily travel volume and system importance.
Simulation scenarios were developed by varying demand level, incident duration, and with vs.
without ITS to estimate the benefits of ITS with respect to vehicle delay, emissions and fuel
consumption according to observed incident duration reductions. The simulation study revealed
that the benefits of ITS as a result of incident duration reduction (through FCP or other means)
are highest in high duration, high reduction scenarios (such as from 60 minutes to 40 minutes)
and that the benefits experienced as result of ITS recommending route detours are greatest in
high incident duration scenarios (50 minutes).
Finally, a cost-benefit analysis was performed at the TOC level as well as by individual
ITS device. The base year was assumed to be 2012 with a one-time initial construction cost of all
Costs and Benefits of MDOT ITS Deployments
147
current ITS devices in operation. The lifespan of all ITS devices was assumed to be 20 years.
O&M costs were applied during the entire analysis and assumed to remain constant. A 3%
discount rate was applied. Costs varied according to TOC. The total 2012 construction cost
ranged from $27,788, 750 in the STOC to $86,519,413 in SEMTOC for a grand statewide total
of $145,073,317. Annual O&M costs ranged from $1,303,177 in WMTOC to $5,426,092 in
SEMTOC for a grand statewide total of $8,749,387. Statewide FCP cost was $2,300,000.
The annual benefits estimated included travel delay savings, secondary incident reduction,
fuel consumption saving, emission cost saving, crash reduction, Mi Drive value of time, and FCP
customer satisfaction. A queuing model was developed to evaluate all 2013 statewide incidents
to ascertain the total travel delay, emissions and fuel consumption benefits on the basis of
reduced capacity resulting from an incident. Total incident delay savings were highest in
SEMTOC at $20,053,665 and the total incident delay saving statewide was $26,344,518.
Similarly, SEMTOC dominated the overall fuel consumption and emissions savings, at
$1,301,310 and $1,315,257, respectively. Statewide, fuel and emissions savings were $1,705,897
and $1,803,853, respectively. The benefits of secondary incident reduction were evaluated as an
additional component of incident delay reduction based on the assumption of TOC managing 20
percent of incidents as secondary incidents. The statewide secondary incident delay savings was
$5,268,904. A crash reduction model was developed based on Negative Binomial regression
analysis. It was determined that one DMS is likely to reduce 16.6 percent of crashes per year
while a single MVDS or CCTV is likely to reduce 1.9 percent of crashes per year. Based on a
calculated average crash cost from Michigan crash frequency and severity, the crash reduction
saving resulting from ITS was estimated at $20,643,926 statewide. Mi Drive user benefit was
estimated based on the number of website hits and browsing duration per access. Total Mi Drive
benefit was estimated at $6,646,434 on the basis of user value of time. Utilizing an average value
of $60.25 per FCP assist, the total FCP user satisfaction benefit was estimated at $3,273,081. The
total statewide annual benefit of ITS was estimated at $65,686,613 for a benefit of 3.16 per
dollar spent. To help aid future investment decisions, an investigation was performed of the costs
and benefits on an individual ITS device basis. Benefits were appropriated by device according
to the utilization proportion of each device by TOC operators, based on phone interviews. Based
on a 64 percent, 24 percent and 12 percent split between CCTV, DMS and MVDS, the estimated

Costs and Benefits of MDOT ITS Deployments
148
BCRs were 3.81, 3.95 and 1.02 per dollar spent, respectively. FCP’s benefit was estimated based
on the proportion of delay spent and resulted in a 3.82:1 BCR.
8.2 Recommendations
While positive and reinforcing, the final estimated statewide MDOT ITS deployment BCR of
3.16:1 is a conservative estimate compared to similar evaluations performed in other states. The
research team believes that this estimate can be greatly improved on execution of a few key
recommendations, as follows:
1. The development and strict operation and maintenance of a consistent statewide incident
database shared between all three MDOT TOCs will aid in communication between
agencies and facilitate ease in cost and benefit estimation for future studies.
2. Deployment of an FCP program in the WMTOC region is expected to result in similar
incident duration reductions as witnessed in the SEMTOC region (up to 24.5 minute
duration reduction).
3. Future investments should focus on DMS and CCTV installation, while deployment of
MVDS needs further studies in conjunction with the coming wake of Connected Vehicle
technology.
4. TV and radio media outlets should focus on exposing safety-related travel information
and operators should tailor Mi Drive information according to seasonal trends.
These recommendations stem from both challenges faced throughout the duration of the study as
well as insight gleaned from the analysis in its entirety.
As a supplemental aid, the research team performed a prescriptive analysis of potential
candidate highway segments best suited for future ITS deployment based on a cost-benefit
analysis. The corridor analysis determined that to reasonably expect a BCR of ITS greater than
1:1 on any given highway segment, the segment should display an accident density in excess of
31.5 crashes/mile. Based on this finding, a hotspot analysis was performed on 2012 MDOT
sufficiency file segments within the STOC region that adhere to this requirement and yet contain
no ITS presence as of 2013, as shown in Figure 8-1.

Costs and Benefits of MDOT ITS Deployments
149
In the figure, regions skewing toward the blue color spectrum display the greatest
concentration of highway segments with highest potential for positive ITS benefit. Individual
segments are highlighted in black which experienced a 2013 AADT in excess of 25,000, another
key indicator of ITS potential according to the simulation corridor cost-benefit analysis. In total,
63 segments were identified and a summary of these segments is included in Appendix 5.
Segments are identified according to 2012 MDOT Sufficiency database PR number pointer
values.
Figure 8-1: ITS Candidate Corridor Hotspots

Costs and Benefits of MDOT ITS Deployments
150
Bibliography
Abdel-Aty, M. A. Using Ordered Probit Modeling to Study the Effect of ATIS on Transit
Ridership. Transportation Research Part C: Emerging Technologies, Vol. 9, No. 4, 2001, pp.
265-277.
Abdel-Aty, M. A., R. Kitamura, and P. P. Jovanis. Using Stated Preference Data for Studying the
Effect of Advanced Traffic Information on Drivers’ Route Choice. Transportation Research
Part C: Emerging Technologies, Vol. 5, No. 1, 1997, pp. 39-50.
Alexiadis, V., B. Cronin, S. Mortensen, and D. Thompson. Integrated Approach: Inside Story on
the ICM Test Corridor. Traffic Technology International, 2009, pp. 46-50.
Berger, C. R., and E. Smith. Intelligent Transportation Systems Provide Operational Benefits for
New York Metropolitan Area Roadways: A Systems Engineering Approach. Systems,
Applications and Technology Conference, 2007, pp. 1-8.
Bergmann Associates. Monroe County New York: ITS Camera Deployment & Systems
Integration Evaluation – Final. Monroe County, NY. August 2006.
Bertini, R., S. Tantiyanugulchai, E. Anderson, R. Lindgren, and M. Leal. Evaluation of Region 2
Incident Response Program Using Archived Data. Transportation Research Group, Portland
State University, 2001.
Bham, G.H. Evaluation of Variable Speed Limits on I-217/I-255 in St. Louis, Missouri DOT.
Jefferson City, MO. October 2010.
Bifulco, G. N., R. Di Pace, and F. Viti. Evaluating the Effects of Information Reliability on
Traveller’s Route Choice. European Transport Research Review, Vol. 6, No. 1, 2014, pp.
61-70.
Briglia, Jr., ITS Evaluation Framework - Phase 2 Continuation (2009) Seventeen Projects.
Washington State DOT. Seattle, WA. June 2009.
Cambridge Systematics. Integrated Corridor Management: Analysis, Modeling, and Simulation
Results for the Test Corridor, U.S. DOT. September 2008.
Change, G-L., D. Shrestha, J. Yves Point-Du-Jour. Performance Evaluation of CHART –An
Incident Management Program – in 1997. May 2002

Costs and Benefits of MDOT ITS Deployments
151
Chen, X., T. Kong, and D. Xie. Evaluation of variable message signs on urban expressway. 2010
International Conference on Logistics Engineering and Intelligent Transportation Systems,
2010, pp. 1-3.
Chou, C., E. Miller-Hooks, and I. Promisel. Benefit-Cost Analysis of Freeway Service Patrol
Programs: Methodology and Case Study. Advances in Transportation Studies, Vol. 20, 2010,
pp. 81-96.
Chowdhury, M., R. Fries, Y. Ma, A. Dunning, A. C. Hamlin, K. Ozbay, J. Ogle, and W. Sarasua.
Benefit–Cost Analysis of Accelerated Incident Clearance: Final Report. Prepared for the
Federal Highway Administration and the South Carolina Department of Transportation.
Report No. FHWA-SC-07-01, 2007.
Cuciti, P. and B. Janson. Incident Management Via Courtesy Patrol: Evaluation of a Pilot
Program in Colorado. Presented at 74th Annual Meeting of the Transportation Research
Board, 1995.
Dougald, L. E. A Return on Investment Study of the Hampton Roads Safety Service Patrol
Program. Prepared for Virginia Department of Transportation. Virginia Transportation
Research Council, June 2007.
Eidswick, J. Grand Canyon National Park Dynamic Message Sign (DMS) Highway Advisory
Radio (HAR) Pilot Deployment Evaluation. Prepared for the U.S. Federal Lands Highway
Division, 2009.
Fenno, D. Technical Support for Traffic Management, TravelerInformation, and ITS Initiatives; I
ncident Management Support Materials;Freeway Service Patrols: A Nationwide Assessment
Prepared for Federal Highway Administration. PB Farradyne Inc. in association with Texas
Transportation Institute, 1997.
FHWA. Moving Ahead for Progress in the 21st Century Act (MAT-21) A Summary of Highway
Provisions. Office of Policy and Governmental Affairs, Federal Highway Administration.
July 2012. Online available http://www.fhwa.dot.gov/map21/summaryinfo.cfm
Fudala, N. J. and M. D. Fontaine. Work Zone Variable Speed Limit Systems: Effectiveness and
System Design Issues. Virginia Transportation Research Council, Prepared for Virginia
Department of Transportation and Federal Highway Administration. March 2010.

Costs and Benefits of MDOT ITS Deployments
152
Gates, T.G., P.T. Savolainen, and R. G. Todd. Transportation Reliability and Trip Satisfaction.
Publication RC-1584. RAO, Michigan Department of Transportation, 2012.
Hadi, M., L. Shen, C. Zhan, Y. Xiao, S. Corbin, and D. Chen. Operation Data for Evaluating
Benefits and Costs of Advanced Traffic Management Components. Transportation Research
Record: Journal of the Transportation Research Board, Vol. 2086, No. 1, 2008, pp. 48-55.
Hagen, L., H. Zhou, H. Singh. Raod Ranger Benefit Cost Analysis. Prepared for Florida
Department of Transportation, Office of Project Management, Research & Development,
November 2005.
Halkias, J. and M. Schauer. Red Light, Green Light. Public Roads Journal, US DOT.
November/December 2004.
http://www.fhwa.dot.gov/publications/publicroads/04nov/07.cfm
Hawkins, P. “Evaluation of the Southwest Freeway Motorist Assistance Program in Houston”.
Prepared for Texas Department of Transportation. Texas Transportation Institute, 1993.
He, J., Z. Zeng, and Z. Li. Benefit evaluation framework of intelligent transportation systems.
Journal of Transportation Systems Engineering and Information Technology, Vol. 10, No. 1,
2010, pp. 81-87.
Hedden, C., D. Krechmer, S. Van Hecke, and A. Toppen. Strategies for Improving Traveler
Information. Publication RC-1559. RAO, Michigan Department of Transportation, 2011.
IBI Group. ITS Implementation Plan. Flint Mass Transportation Authority. Flint, MI. June 2005.
Juan, Z., J. Wu, and M. McDonald. Socio-economic impact assessment of intelligent transport
systems. Tsinghua Science & Technology Vol. 11, No. 3, 2006, pp. 339-350.
Khattak, A. J. and N. Rouphail. Incident Management Assistance Patrols: Assessment of
Investment Benefits and Costs. Federal Highway Administration. Report No.
FHWA/NC/2005-02, 2005.
Kimley Horn. MDOT I-75, US-127, I-94 Triangle ATIS Plan: Final Concept of Operations.
Prepared for MDOT. May 2010.
Krechmer, D. Benefit–Cost Evaluation Techniques for Rural ITS Deployments, Michigan DOT.
January 2010,
Latoski, S., R. Pal and K. Sinha. Cost-Effectiveness Evaluation of Hoosier Helper Freeway
Service Patrol. Journal of Transportation Engineering, Vol. 125, No. 5, 1999, pp. 429-438.

Costs and Benefits of MDOT ITS Deployments
153
Leviäkangas, P., and J. Lähesmaa. Profitability Evaluation of Intelligent Transport System
Investments. Journal of Transportation Engineering, Vol. 128, No. 3, 2002, pp. 276-286.
Luttrell, T. Comparative Analysis Report: The Benefits of Using Intelligent Transportation
Systems in Work Zones. Federal Highway Administration. Report No. FHWA-HOP-09-002,
October 2008.
Minnesota Department of Transportation. Highway Helper Summary Report. Freeway
Operations Section, Office of Traffic and Maintenance Operations, 2000.
Moss, S. D. A Benefit Cost Model for Traffic Incident Management. Master's Thesis, University
of Tennessee, 2012.
Muizelaar, T. J. and B. van Arem. Drivers’ Preferences for Traffic Information for Nonreccurent
Traffic Situations. In Transportation Research Record: Journal of the Transportation
Research Board, No. 2018, Transportation Research Board of the National Academies,
Washington, D.C., 2007, pp. 72-79.
Nee, J. and M. E. Hallenbeck. Evaluation of the Service Patrol Program in the Puget
Sound Region. Prepared for the Research Office of the Washington State Department of
Transportation. Washington State Transportation Center, September 2001.
Ozbay, K., W. Xiao, G. Jaiswal, and B. Bartin. Evaluation of Incident Management Strategies.
Prepared for Federal Highway Administration and New Jersey Department of
Transportation. November 2005.
Park, B. and Y. Chen. Quantifying the Benefits of Coordinated Actuated Traffic Signal Systems:
A Case Study. Prepared by the University of Virginia for the Virginia DOT, Report No.
VTRC 11-CR2. Charlottesville, VA. September, 2010.
Peng, Z., E. Beimborn, and M. Neluheni. A framework for the evaluation of the benefits of
intelligent transportation systems. No. Final Report. Wisconsin Department of
Transportation, 2000.
Peng, Z., N. Guequierre, and J. C. Blakeman. Motorist Response to Arterial Variable Message
Signs. In Transportation Research Record: Journal of the Transportation Research Board,
No. 1899, Transportation Research Board of the National Academies, Washington, D.C.
2004, pp. 55-63.
Costs and Benefits of MDOT ITS Deployments
154
Petrov, A., P. Lin, N. Zou, G. Chang, and J. Y. Point-Du-Jour. Evaluation Of The Benefits Of A
Real-Time Incident Response System. In 9th World Congress on Intelligent Transport
Systems, 2002.
Raub, R. A. Occurrence of Secondary Crashes on Urban Arterial Roadways. In Transportation
Research Record: Journal of the Transportation Research Board, No. 1581, Transportation
Research Board of the National Academies, Washington, D.C., 1997, pp. 53-58.
Razo, M. and S. Gao. A Rank-Dependent Expected Utility Model for Strategic Route Choice
with Stated Preference Data. Transportation Research Part C: Emerging Technologies, Vol.
27, 2013, pp. 117-130.
Research and Innovative Technology Administration. Intelligent Transportation Systems
Benefits, Costs, Deployment, and Lessons Learned Desk Reference: 2011 Update. No.
FHWA-JPO-11-140. 2011.
Richards, A. and M. McDonald. Questionnaire Surveys to Evaluate User Response to Variable
Message Signs in an Urban Network. IET Intelligent Transport Systems, Vol. 1, No. 3, 2007,
pp. 177-185.
Robinson, M. R. and A. Khattak. Selection of Source and Use of Traffic Information in
Emergency Situations. In Transportation Research Record: Journal of the Transportation
Research Board, No. 2234, Transportation Research Board of the National Academies,
Washington, D.C., 2011, pp. 71-78.
Rodier, C. J., and S. A. Shaheen. Transit–Based Smart Parking in the U.S.: Behavioral Analysis
of San Francisco Bay Area Field Test, Institute of Transportation Studies, University of
California, Report No. UCD-ITS-RR-06-19. Davis, CA. December 2006.
Ryan, T., V. Chilukuri, T. Trueblood and C. Sun. Interim Report: Evaluation of Arterial Service
Patrol Programs (I-64 Traffic Response), Missouri DOT. Jefferson City, MO. 2009.
Sadek, A., S. Morse, J. Ivan, and W. El–Dessouki. Case–Based Reasoning for Assessing
Intelligent Transportation Systems Benefits. Computer‐Aided Civil and Infrastructure
Engineering. Vol. 18, No. 3, 2003, pp. 173-183.
Sayer, J. Integrated Vehicle-Based Safety Systems Field Operational Test Final Program Report.
U.S. DOT Research and Innovative Technology Administration, Report No. DOT HS 811
482. June 2011

Costs and Benefits of MDOT ITS Deployments
155
Schrank, D., B. Eisele, T. Lomax. TTI’s 2013 Urban Mobility Report Powered by INRIX Traffic
Data, Texas A&M Transportation Institute, December 2012
Skabardonis, A., H. Noeimi, K. Petty, D. Rydzewski, P. Varaiya, and H. Al-Deek. Freeway
Service Patrol Evaluation. Institute of Transportation Studies, University of California
Berkeley, 1995.
Southwestern Pennsylvania Commission, Robinson Town Centre Boulevard/Summit Drive Park
SINC Project Summary, August 2011.
Stamatiadis, C., N. Gartner and J. Winn. Evaluation of the Massachusetts Motorist Assistance
Program: An Assessment of the Impacts of this Project on Congestion and Air Quality.
Prepared for Massachusetts Highway Department. University of Massachusetts
Transportation Center, 1997.
Sun, C. Evaluation of Freeway Motorist Assist Program: Final Report, Missouri DOT. February
2010.
Tay, R. and A. De Barros. Effectiveness of Road Safety Messages on Variable Message Signs.
Journal of Transportation Systems Engineering and Information Technology, Vol. 10, No. 3,
2010, pp. 18-23.
U.S. DOT. Evaluation of Intelligent Cruise Control System: Volume I – Study Results. Report
No. DOT-VNTSC-NHTSA-98-3, EDL No. 11843. October 1999.
URS Corporation. Task Order 5.2: Benefits Analysis for the Georgia Department of
Transportation NaviGAtor Program. Prepared for GDOT. August 2006.
Washington State Department of Transportation. The 2014 Corridor Capacity Report. October
2014.
Yang, S., L. Shen, and M. Hadi. Risk Analysis to Account for Uncertainty in Benefit-Cost
Evaluations of Intelligent Transportation Systems Transportation Research Record: Journal
of the Transportation Research Board, Vol. 2035, No. 1, 2007, pp. 187-194.

Costs and Benefits of MDOT ITS Deployments
156
Appendix

Costs and Benefits of MDOT ITS Deployments
157
Appendix 1: Survey Questionnaire
Background Information
1. From which source of information did you find out about this survey?
a. While exploring information from MiDrive
b. Invited by E-mail request
c. Pamphlet/Poster in rest area
d. Referral card from Freeway Courtesy Patrol
e. Other
2. How many hours per day you normally travel on freeways?
a. 0-30 minutes
b. 30 minutes - 1 hour
c. 1 hour - 2 hours
d. 2+ hours
3. What are your major concerns during your daily travel?
a. Recurrent congestion
b. Non-recurrent congestion (due to incidents/accidents)
c. Congestion due to highway work zones
d. Traffic crashes and safety
e. Other
4. Are you familiar with each of the following?
No, I do not
know at all.
I have heard
about it, but do
not know well.
Yes, I know
well.
Freeway Courtesy Patrol (FCP) ❏ ❏ ❏ Dynamic Message Signs (DMS) ❏ ❏ ❏
Travel Time Signs (TTS) ❏ ❏ ❏
Highway Advisory Radio (HAR) ❏ ❏ ❏ Closed-Circuit Television Cameras (CCTV) ❏ ❏ ❏ Road Weather Information Systems (RWIS) ❏ ❏ ❏ MiDrive traffic website or mobile application ❏ ❏ ❏

Costs and Benefits of MDOT ITS Deployments
158
Pre-trip Information (MiDrive)
5. How often do you typically obtain travel information before your departure from the following sources?
Daily Weekly Monthly Yearly Never
MiDrive ❏ ❏ ❏ ❏ ❏ Other Websites (e.g. Google Maps) ❏ ❏ ❏ ❏ ❏
Television ❏ ❏ ❏ ❏ ❏ Radio ❏ ❏ ❏ ❏ ❏
6. Please rate the importance of the following types of information before your departure?
No Need Not
Important
Good to
Have
Important Essential
Travel Time ❏ ❏ ❏ ❏ ❏ Current Speeds ❏ ❏ ❏ ❏ ❏
Road Work Locations ❏ ❏ ❏ ❏ ❏
Incident Locations ❏ ❏ ❏ ❏ ❏ Road Weather Information ❏ ❏ ❏ ❏ ❏
Planned Special Events ❏ ❏ ❏ ❏ ❏ Freeway Camera Images ❏ ❏ ❏ ❏ ❏
7. Based on the types of travel information in the previous question, how often do you typically make the following
changes in your travel behaviors?
Never Sometimes Often Very
Frequently
N/A
Reschedule the trip ❏ ❏ ❏ ❏ ❏ Change departure time ❏ ❏ ❏ ❏ ❏
Change route to use ❏ ❏ ❏ ❏ ❏ Change transportation mode ❏ ❏ ❏ ❏ ❏

Costs and Benefits of MDOT ITS Deployments
159
En Route Trip Information (MiDrive)
8. How frequently do you use the following devices to receive travel information while traveling?
Never Sometimes Often Very
Frequently
N/A
Smart Phone ❏ ❏ ❏ ❏ ❏ Car Navigation ❏ ❏ ❏ ❏ ❏
Radio ❏ ❏ ❏ ❏ ❏ Dynamic Message Signs ❏ ❏ ❏ ❏ ❏
Other ❏ ❏ ❏ ❏ ❏
9. How helpful are the following types of information displayed on Dynamic Message Signs?
Very
Unhelpful
Unhelpful Somewhat
Helpful
Very Helpful N/A
Accident Ahead: Expect Congestion ❏ ❏ ❏ ❏ ❏ Incident Ahead: Use Detour Exit 35 ❏ ❏ ❏ ❏ ❏
30 Minutes to Battle Creek ❏ ❏ ❏ ❏ ❏ To Detroit: 30 Minutes via I-94, 25 Minutes via M-14 ❏ ❏ ❏ ❏ ❏
10. Which of the following were impacts of Dynamic Message Signs (DMS) on your travel? (Select all that apply)
a. Helped me in revising my schedule by providing delay information
b. Helped me in avoiding congestion by guiding alternative routes
c. Reduced my anxiety by informing reasons for congestion
d. Did not impact on my travel
e. I have not had any experience with DMS
f. Other
11. How much do you trust the information displayed on Dynamic Message Signs (DMS)?
a. Very trustful
b. Somewhat trustful
c. Not trustful
d. I do not know

Costs and Benefits of MDOT ITS Deployments
160
12. Have you ever been assisted by Freeway Courtesy Patrol (FCP) services?
a. Yes
b. No (Skip questions 13-15)
13. How long have you waited for FCP service?
a. Less than 15 minutes
b. 15-30 minutes
c. 30-45 minutes
d. 45-60 minutes
e. More than 60 minutes
14. Were you satisfied with FCP service?
a. I was satisfied with the response time and service.
b. I was satisfied, but hoped for quicker service.
c. I had to wait too long for service.
15. How long would you be willing to wait for the service?
a. Less than 15 minutes
b. 15-30 minutes
c. 30-45 minutes
d. 45-60 minutes
e. More than 60 minutes
Additional Information
16. Please provide your comments or suggestions for better ITS services:
17. Please enter your home zip code:
18. What is your sex?
a. Male
b. Female

Costs and Benefits of MDOT ITS Deployments
161
19. What is your age?
a. 16-20
b. 21-35
c. 36-50
d. 51-65
e. Over 65
20. Please provide your contact information if you are willing to be contacted regarding your comments:
First Name
Last Name
Phone
Email Address

Costs and Benefits of MDOT ITS Deployments
162
Appendix 2: MDOT ITS Performance Data
Table A-1: 2008-2013 SEMTOC Number of FCP Assists
SEMTOC
Annual
Number of
FCP Assists 2008 2009 2010 2011 2012 2013
Type of
Assist Number
of
Assists
Percent
of
Assists
Number
of
Assists
Percent
of
Assists
Number
of
Assists
Percent
of
Assists
Number
of
Assists
Percent
of
Assists
Number
of
Assists
Percent
of
Assists
Number
of
Assists
Percent
of
Assists
Mechanical 10873 22% 11561 23% 11705 23% 11525 23% 8935 19% 4216 9% Flat Tire 9120 18% 9377 18% 9218 18% 9294 19% 7264 16% 5151 11% Debris 1773 4% 2868 6% 3172 6% 2602 5% 2486 5% 2112 4%
Accident 2961 6% 2483 5% 2443 5% 2395 5% 3185 7% 5909 12% Abandoned
Vehicles 13826 28% 13959 27% 12777 25% 10988 22% 10489 23% 10172 21%
Out of Gas 6851 14% 5780 11% 6731 13% 7559 15% 6604 14% 6234 13% Other* 1662 3% 5352 10% 5402 11% 5163 10% 7653 16% 5131 11%
Declined 2960 6% Gone on
Arrival 2645 5% 3790 8%
Non-FCP
Tow 1728 4%
Multiple 966 2% Total 49498 100% 51384 100% 51452 100% 49571 100% 46619 100% 48369 100%
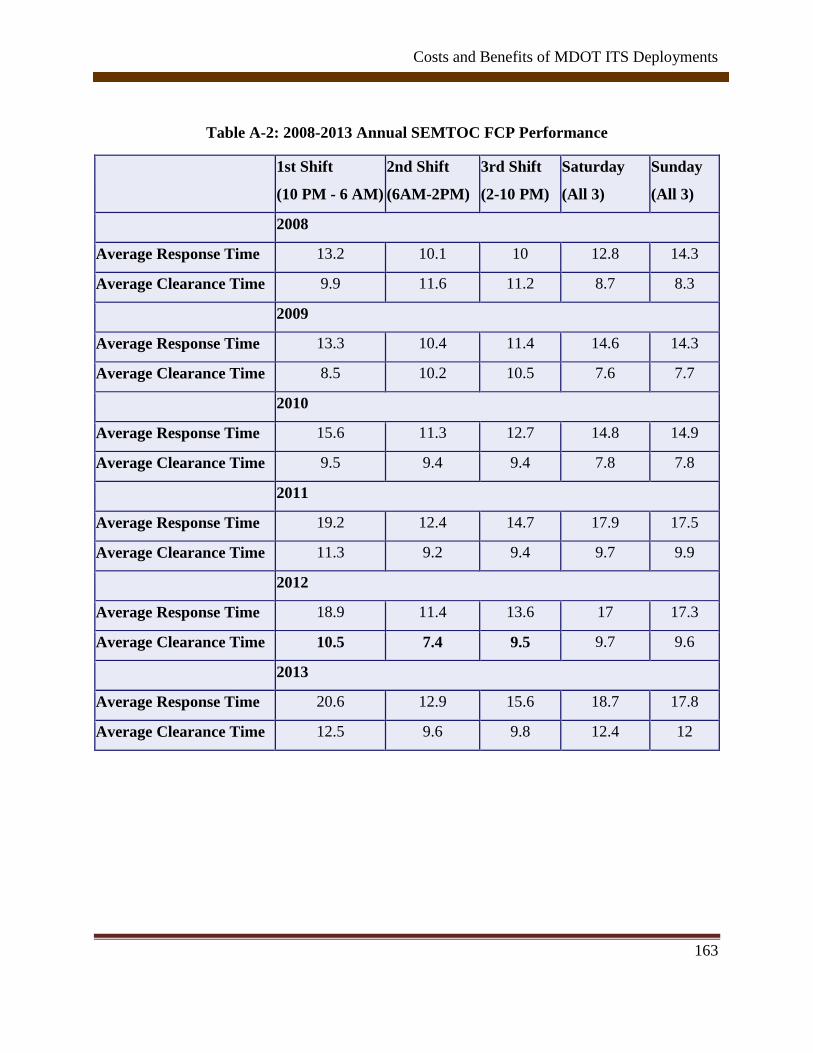
Costs and Benefits of MDOT ITS Deployments
163
Table A-2: 2008-2013 Annual SEMTOC FCP Performance
1st Shift
(10 PM - 6 AM)
2nd Shift
(6AM-2PM)
3rd Shift
(2-10 PM)
Saturday
(All 3)
Sunday
(All 3)
2008
Average Response Time 13.2 10.1 10 12.8 14.3
Average Clearance Time 9.9 11.6 11.2 8.7 8.3
2009
Average Response Time 13.3 10.4 11.4 14.6 14.3
Average Clearance Time 8.5 10.2 10.5 7.6 7.7
2010
Average Response Time 15.6 11.3 12.7 14.8 14.9
Average Clearance Time 9.5 9.4 9.4 7.8 7.8
2011
Average Response Time 19.2 12.4 14.7 17.9 17.5
Average Clearance Time 11.3 9.2 9.4 9.7 9.9
2012
Average Response Time 18.9 11.4 13.6 17 17.3
Average Clearance Time 10.5 7.4 9.5 9.7 9.6
2013
Average Response Time 20.6 12.9 15.6 18.7 17.8
Average Clearance Time 12.5 9.6 9.8 12.4 12

Costs and Benefits of MDOT ITS Deployments
164
Table A-3: 2009-2013 WMTOC Incidents by Type
WMTOC Incidents
by Type 2009 2010 2011 2012 2013
Abandoned Vehicle 5% 17% 10% 11% 8%
Disabled Vehicle 39% 42% 31% 29% 29%
Debris 1% 2% 2% 2% 2%
Crashes 53% 37% 58% 57% 61%
Other 1% 1% 1% 1% 1%
Total 606 1192 1015 1373 1477

Costs and Benefits of MDOT ITS Deployments
165
Appendix 3: MDOT ITS Cost Data
Table A-4: WMTOC Costs
Previously
installed
devices
2006 2007 2008 2009 2010 2011 2012 2013
Co
nst
ruct
ion
Ph
ase
Co
sts
Construction Contract
for ITS Devices $2,815,258 $- $982,454 $836,209 $439,494 $9,240,291 $- $1,056,827
DMS Cost (statewide
procurement contract) $- $- $- $- $- $- $- $53,000
Supporting Infrastructure
Construction Cost $ - $- $- $- $- $845,741 $- $-
New CCTV Quantity 10 7 0 0 6 3 41 0 0
New MVDS Quantity 0 0 0 42 0 0 78 0 0
New DMS Quantity 7 3 0 0 1 1 15 0 0
Estimated Design Cost $408,212 $- $142,456 $121,250 $63,727 $1,462,475 $- $160,925
Estimated System
Manager Cost $239,297 $- $83,509 $71,078 $37,357 $857,313 $- $94,335
Mai
nte
nan
ce &
Op
erat
ion
s
Co
sts
Maintenance Contract
Cost / As-Needed
System Manager Cost
$45,000 $45,000 $81,000 $113,833 $97,520 $60,112 $363,702 $329,370
TOC Operations
Contract Cost $166,376 $332,752 $326,903 $357,602 $370,444 $399,665 $527,662 $472,141
Utility Cost (power) $21,352 $33,933 $33,933 $38,289 $47,118 $52,154 $130,736 $130,736 $130,736
Utility Cost
(communication) $16,402 $27,199 $27,199 $42,319 $51,009 $55,533 $145,929 $145,929 $145,929
MDOT Staff Cost (3
full-time) $225,000 $225,000 $225,000 $225,000 $225,000 $225,000 $225,000 $225,000

Costs and Benefits of MDOT ITS Deployments
166
Table A-5: SEMTOC Costs
Previously
installed
devices
2006 2007 2008 2009 2010 2011 2012 2013
Co
nst
ruct
ion
Ph
ase
Co
sts
Construction Contract
for ITS Devices $- $461,854 $- $8,452,901 $5,317,751 $11,464,490 $10,210,048 $8,443,289
DMS Cost (statewide
procurement contract) $- $- $- $- $- $636,000 $- $742,000
Supporting
Infrastructure
Construction Cost
$- $- $- $- $499,288 $2,897,817 $5,594,083 $3,380,763
New CCTV Quantity 92 0 14 0 34 7 22 17 30
New MVDS Quantity 52 0 0 0 56 17 67 49 33
New DMS Quantity 48 0 0 0 14 7 12 6 11
New TTS Quantity 0 0 0 0 0 0 0 0 1
Estimated Design Cost $- $66,969 $- $1,225,671 $843,471 $2,174,755 $2,291,599 $1,822,078
Estimated System
Manager Cost $- $39,258 $- $718,497 $494,448 $1,274,856 $1,343,351 $1,068,114
Mai
nte
nan
ce &
Op
erat
ion
s C
ost
s Maintenance Contract
Cost $500,000 $500,000 $613,144 $1,839,432 $2,283,157 $2,329,000 $1,958,571 $1,983,005
TOC Operations
Contract Cost $1,404,051 $1,197,030 $1,581,544 $1,440,204 $1,728,350 $1,799,884 $1,963,979 $2,022,946
Utility Cost (power) $181,419 $181,418.96 $199,116 $199,116 $265,324 $284,646 $334,336 $368,373 $423,510
Utility Cost
(communication) $163,714 $163,714.03 $183,149 $183,149 $255,547 $273,905 $332,885 $376,284 $434,130
MDOT Staff Cost (7.5
full-time) $562,500 $562,500 $562,500 $562,500 $562,500 $562,500 $562,500 $562,500
Freeway Courtesy
Patrol Contract Cost $1,933,333 $1,933,333 $1,933,333 $1,933,333 $1,933,333 $1,933,333 $1,933,333 $1,933,333

Costs and Benefits of MDOT ITS Deployments
167
Table A-6: STOC Costs
Previously
installed
devices
2006 2007 2008 2009 2010 2011 2012 2013
Co
nst
ruct
ion
Ph
ase
Co
sts
Construction Contract
for ITS Devices $- $453,850 $- $- $605,438 $9,386,551 $5,209,444 $3,844,366
DMS Cost (statewide
procurement contract) $- $- $- $- $- $- $530,000 $477,000
Supporting
Infrastructure
Construction Cost
$- $- $- $- $- $- $- $-
New CCTV Quantity 0 0 0 0 0 0 19 21 16
New MVDS Quantity 0 0 0 0 0 0 31 24 10
New DMS Quantity 0 0 2 0 0 4 16 14 9
New TTS Quantity 0 0 0 0 0 0 0 3 2
Estimated Design Cost $- $65,808 $- $- $87,789 $1,361,050 $832,219 $626,598
Estimated System
Manager Cost $- $38,577 $- $- $51,462 $797,857 $487,853 $367,316
Mai
nte
nan
ce &
Op
erat
ion
s C
ost
s Maintenance Contract
Cost $- $- $- $- $105,547 $220,000 $324,586 $414,211
TOC Operations
Contract Cost $- $- $- $- $- $638,641 $698,043 $883,974
Utility Cost (power) $- $2,489 $2,489 $2,489 $7,466 $54,609 $101,376 $134,045
Utility Cost
(communication) $- $720 $720 $720 $2,160 $45,456 $89,368 $119,139
MDOT Staff Cost
(6.25) $- $18,750 $18,750 $18,750 $56,250 $468,750 $468,750 $468,750
Freeway Courtesy
Patrol Contract Cost $- $- $- $- $- $- $- $366,667

Costs and Benefits of MDOT ITS Deployments
168
Table A-7: IPO Costs
2006 2007 2008 2009 2010 2011 2012 2013
MDOT Staff Cost (4.5) $337,500 $337,500 $337,500 $337,500 $337,500 $337,500 $337,500 $337,500
IPO Support Contract Cost $250,000 $250,000 $250,000 $250,000 $250,000 $250,000 $250,000 $250,000

Costs and Benefits of MDOT ITS Deployments
169
Table A-8: WMTOC Project Costs
Year MDOT
Project
Number
Project Description DMS CCTV MVDS Smart
Sign
RWIS Final Construction
Cost
2006 72044 Implementation of WMTOC and ITS
Installation along I-96, I-196 3 7 0
$2,815,258.29
Subtotal 3 7 0 0 0
2007
Subtotal 0 0 0 0 0
2008 87663 Grand Rapids Detector 0 0 42
$982,453.87
Subtotal 0 0 42 0 0
2009 87662 ITS Repairs along US-131, I-96, I-196 1 6
$836,209.08
Subtotal 1 6 0 0 0
2010 100377 ITS Installation along US-31 1 3
$439,493.54
Subtotal 1 3 0 0 0
2011 100492 GVMC ITS Expansion 6 41 78
$6,952,319.35
105798 Fiber Installation along I-96, M-6
$845,740.78
105799 ITS Installation on I-96, I-196, M-6 9
$2,287,971.83
Subtotal 15 41 78 0 0
2013 106328 DMS replacement & repair along US-131,
I-96, I-196 1
$690,464.11
109687 NB Auxiliary Lane from Leonard to Ann -1 0 0
$366,362.83
Subtotal 0 0 0 0 0
Grand Total 20 57 120 0 0

Costs and Benefits of MDOT ITS Deployments
170
Table A-9: SEMTOC Project Costs
Year
MDOT
Project
Number
Project Description DMS CCTV MVDS Smart
Sign RWIS
Final Construction
Cost (ITS only,
where applicable)
2006
Subtotal 0 0 0 0 0
2007 86518 ITS Improvements along M-10 0 14 0
$461,853.84
Subtotal 0 14 0 0 0
2008
Subtotal 0 0 0 0 0
2009 47171 ITS Portion of I-96, I-696 Freeway
Reconstruction 1 0 23
$2,146,314.23
59637 ITS Installation along I-69, I-94, I-96, I-275 13 34 33
$6,306,586.38
Subtotal 14 34 56 0 0
2010 51492 ITS Portion of M-10 Freeway Reconstruction 0
2
$364,296.73
88401
ITS Communications Upgrade on I-94, I-75,
and I-696 $499,288.09
55850 ITS Portion of M-59 Freeway Reconstruction 2 5 6
$1,447,495.80
100535 Speed Warning Systems 5 2 9
$1,698,464.90
101266
DMS Replacement along I-75, I-94, I-375,
I-696 and M-10 0
$1,807,493.77
Subtotal 7 7 17 0 0
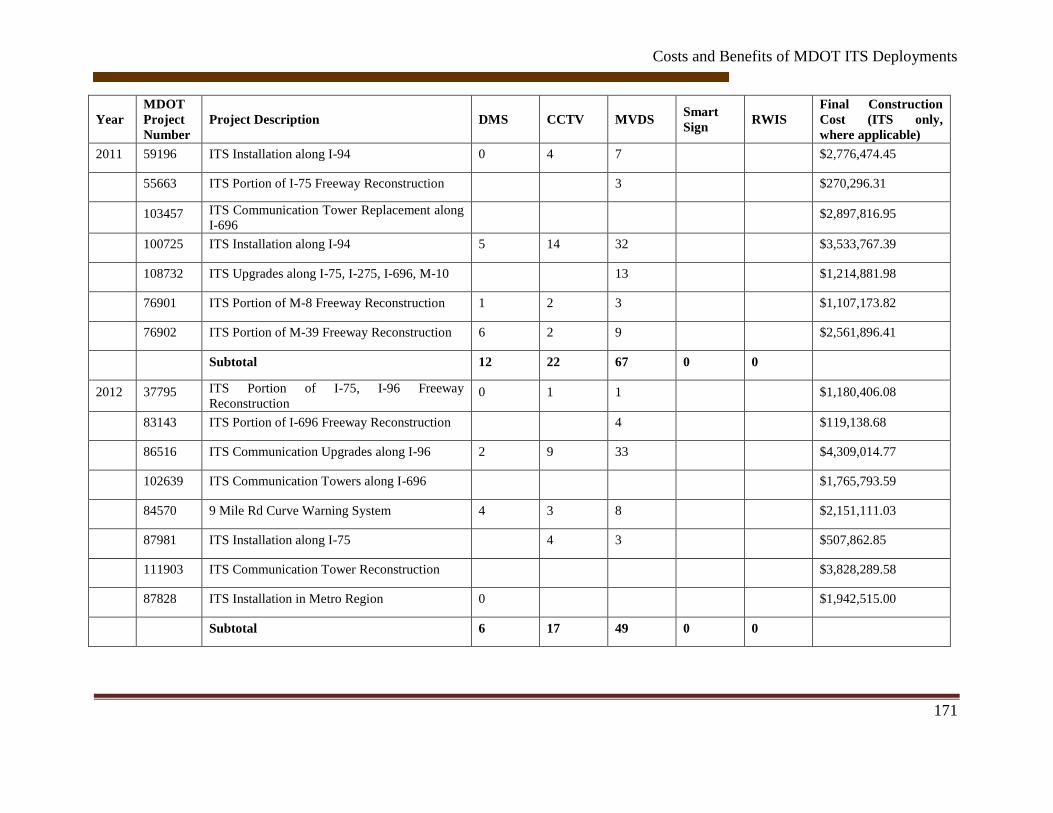
Costs and Benefits of MDOT ITS Deployments
171
Year
MDOT
Project
Number
Project Description DMS CCTV MVDS Smart
Sign RWIS
Final Construction
Cost (ITS only,
where applicable)
2011 59196 ITS Installation along I-94 0 4 7
$2,776,474.45
55663 ITS Portion of I-75 Freeway Reconstruction
3
$270,296.31
103457 ITS Communication Tower Replacement along
I-696 $2,897,816.95
100725 ITS Installation along I-94 5 14 32
$3,533,767.39
108732 ITS Upgrades along I-75, I-275, I-696, M-10
13
$1,214,881.98
76901 ITS Portion of M-8 Freeway Reconstruction 1 2 3
$1,107,173.82
76902 ITS Portion of M-39 Freeway Reconstruction 6 2 9
$2,561,896.41
Subtotal 12 22 67 0 0
2012 37795 ITS Portion of I-75, I-96 Freeway
Reconstruction 0 1 1
$1,180,406.08
83143 ITS Portion of I-696 Freeway Reconstruction
4
$119,138.68
86516 ITS Communication Upgrades along I-96 2 9 33
$4,309,014.77
102639 ITS Communication Towers along I-696
$1,765,793.59
84570 9 Mile Rd Curve Warning System 4 3 8
$2,151,111.03
87981 ITS Installation along I-75
4 3
$507,862.85
111903 ITS Communication Tower Reconstruction
$3,828,289.58
87828 ITS Installation in Metro Region 0
$1,942,515.00
Subtotal 6 17 49 0 0

Costs and Benefits of MDOT ITS Deployments
172
Year
MDOT
Project
Number
Project Description DMS CCTV MVDS Smart
Sign RWIS
Final Construction
Cost (ITS only,
where applicable)
2013 106649 Metro I-75 ITS 6 13 7
$2,080,389.96
107609 ITS Fiber Installation along M-10
2
$624,369.76
111643 ITS Installation along I-275, I-94 5 15 26
$5,676,057.77
110938 Fiber Installation along M-10, I-75, I-94
0 0
$3,380,763.09
106682 Triangle Phase I 0 0
1
$62,471.25
Subtotal 11 30 33 1 0
Grand Total 50 124 222 1 0

Costs and Benefits of MDOT ITS Deployments
173
Table A-10: STOC Project Costs
Year
MDOT
Project
Number
Project Description DMS CCTV MVDS Smart
Sign RWIS
Final Construction
Cost
2006
Subtotal 0 0 0 0 0
2007 86806 ITS Installation along I-75 2
$453,850.16
Subtotal 2 0 0 0 0
2008
Subtotal 0 0 0 0 0
2009
Subtotal 0 0 0 0 0
2010 104021 ITS Installation along M-28, US-2 4
$605,438.26
Subtotal 4 0 0 0 0
2011 87775 Genesee Phase I 2 2 18
$2,684,629.65
88138 Brighton ITS 7 10 5
$2,525,017.40
100523 ITS Installation along I-75, I-675 3 7 8
$1,845,515.27
105846 ITS Installation In Superior Region 4
12 $2,331,388.34
Subtotal 16 19 31 0 0
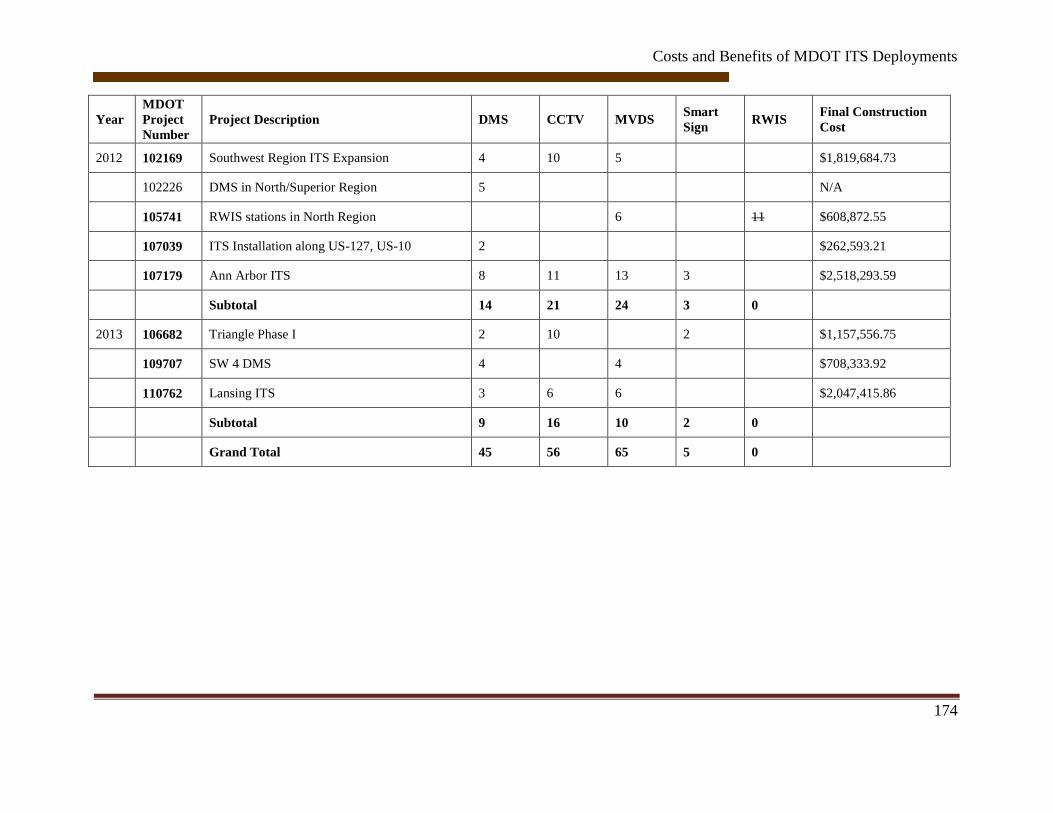
Costs and Benefits of MDOT ITS Deployments
174
Year
MDOT
Project
Number
Project Description DMS CCTV MVDS Smart
Sign RWIS
Final Construction
Cost
2012 102169 Southwest Region ITS Expansion 4 10 5
$1,819,684.73
102226 DMS in North/Superior Region 5
N/A
105741 RWIS stations in North Region
6
11 $608,872.55
107039 ITS Installation along US-127, US-10 2
$262,593.21
107179 Ann Arbor ITS 8 11 13 3
$2,518,293.59
Subtotal 14 21 24 3 0
2013 106682 Triangle Phase I 2 10
2
$1,157,556.75
109707 SW 4 DMS 4
4
$708,333.92
110762 Lansing ITS 3 6 6
$2,047,415.86
Subtotal 9 16 10 2 0
Grand Total 45 56 65 5 0
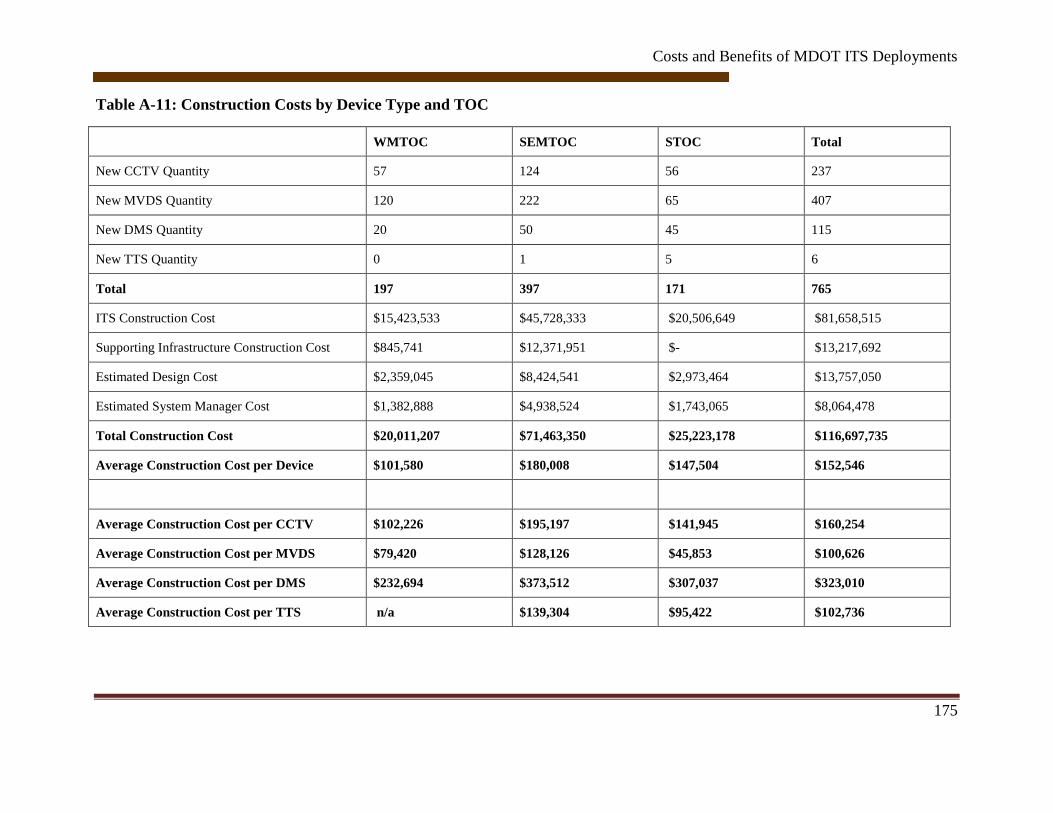
Costs and Benefits of MDOT ITS Deployments
175
Table A-11: Construction Costs by Device Type and TOC
WMTOC SEMTOC STOC Total
New CCTV Quantity 57 124 56 237
New MVDS Quantity 120 222 65 407
New DMS Quantity 20 50 45 115
New TTS Quantity 0 1 5 6
Total 197 397 171 765
ITS Construction Cost $15,423,533 $45,728,333 $20,506,649 $81,658,515
Supporting Infrastructure Construction Cost $845,741 $12,371,951 $- $13,217,692
Estimated Design Cost $2,359,045 $8,424,541 $2,973,464 $13,757,050
Estimated System Manager Cost $1,382,888 $4,938,524 $1,743,065 $8,064,478
Total Construction Cost $20,011,207 $71,463,350 $25,223,178 $116,697,735
Average Construction Cost per Device $101,580 $180,008 $147,504 $152,546
Average Construction Cost per CCTV $102,226 $195,197 $141,945 $160,254
Average Construction Cost per MVDS $79,420 $128,126 $45,853 $100,626
Average Construction Cost per DMS $232,694 $373,512 $307,037 $323,010
Average Construction Cost per TTS n/a $139,304 $95,422 $102,736

Costs and Benefits of MDOT ITS Deployments
176
Table A-12: Operations & Maintenance Costs by Device Type and TOC
WMTOC SEMTOC STOC Total
Total CCTV Quantity 301 1162 115 1578
Total MVDS Quantity 486 1096 151 1733
Total DMS Quantity 134 541 115 790
Total TTS Quantity 0 1 8 9
Total (Device-Year) 921 2800 389 4110
Maintenance Contract Cost $1,135,537 $12,006,309 $1,064,344 $14,206,190
TOC Operations Cost $2,953,545 $13,137,988 $2,220,658 $18,312,191
Utility Cost (power) $597,636 $2,255,840 $304,964 $3,158,440
Utility Cost (communication) $641,047 $2,202,764 $258,283 $3,102,093
MDOT Staff Cost $1,800,000 $4,500,000 $1,518,750 $7,818,750
IPO Cost (MDOT + Support Contract) $1,566,667 $1,566,667 $1,566,667 $4,700,000
Total O&M Cost $8,694,432 $35,669,568 $6,933,664 $51,297,664
Average O&M Cost per Device $9,440 $12,739 $17,824 $12,481
Freeway Courtesy Patrol Cost $- $15,466,667 $366,667 $15,833,333
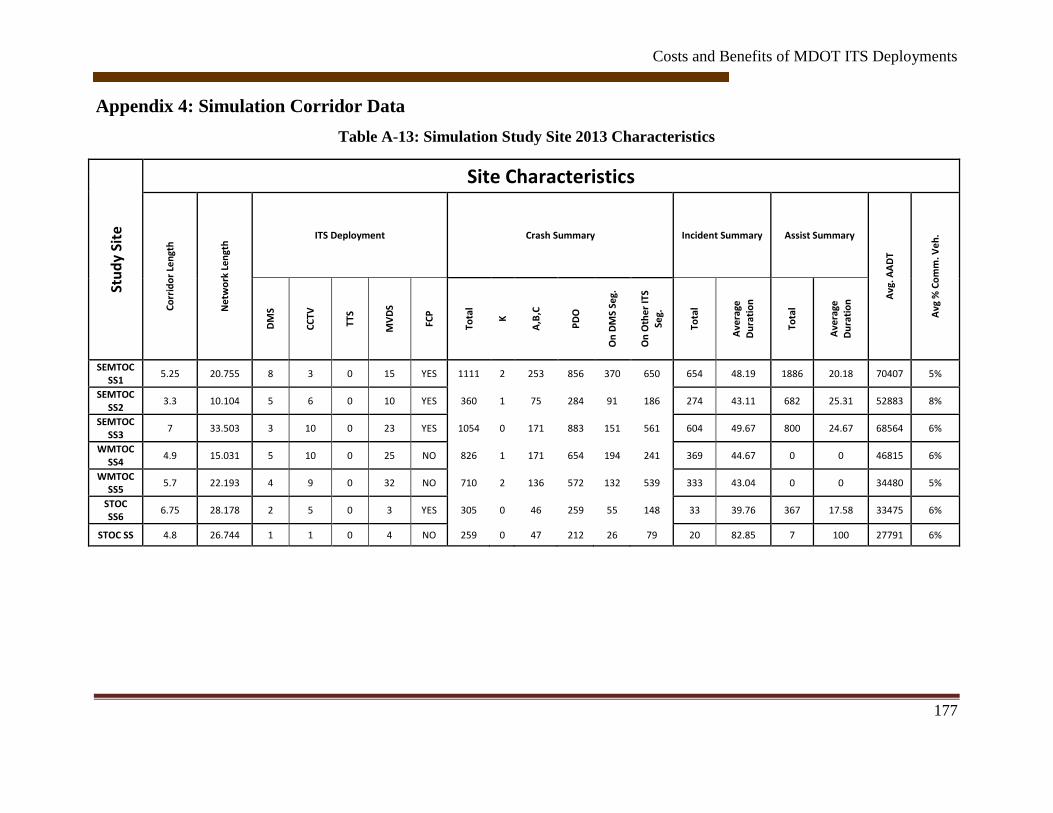
Costs and Benefits of MDOT ITS Deployments
177
Appendix 4: Simulation Corridor Data
Table A-13: Simulation Study Site 2013 Characteristics
Stu
dy
Site
Site Characteristics C
orr
ido
r Le
ngt
h
Ne
two
rk L
engt
h ITS Deployment Crash Summary Incident Summary Assist Summary
Avg
. AA
DT
Avg
% C
om
m. V
eh
.
DM
S
CC
TV
TTS
MV
DS
FCP
Tota
l
K
A,B
,C
PD
O
On
DM
S Se
g.
On
Oth
er
ITS
Seg.
Tota
l
Ave
rage
Du
rati
on
Tota
l
Ave
rage
D
ura
tio
n
SEMTOC SS1
5.25 20.755 8 3 0 15 YES 1111 2 253 856 370 650 654 48.19 1886 20.18 70407 5%
SEMTOC SS2
3.3 10.104 5 6 0 10 YES 360 1 75 284 91 186 274 43.11 682 25.31 52883 8%
SEMTOC SS3
7 33.503 3 10 0 23 YES 1054 0 171 883 151 561 604 49.67 800 24.67 68564 6%
WMTOC SS4
4.9 15.031 5 10 0 25 NO 826 1 171 654 194 241 369 44.67 0 0 46815 6%
WMTOC SS5
5.7 22.193 4 9 0 32 NO 710 2 136 572 132 539 333 43.04 0 0 34480 5%
STOC SS6
6.75 28.178 2 5 0 3 YES 305 0 46 259 55 148 33 39.76 367 17.58 33475 6%
STOC SS 4.8 26.744 1 1 0 4 NO 259 0 47 212 26 79 20 82.85 7 100 27791 6%

Costs and Benefits of MDOT ITS Deployments
178
Figure A-1: 2013 SEMTOC SS1 ITS Devices
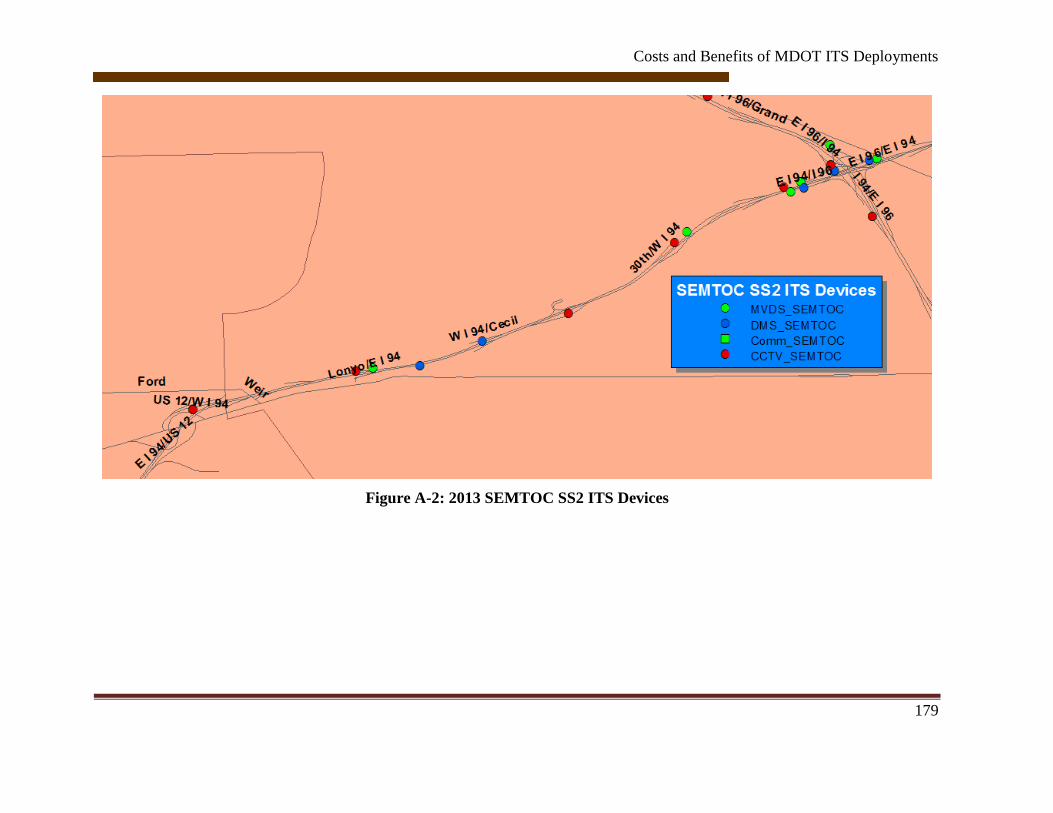
Costs and Benefits of MDOT ITS Deployments
179
Figure A-2: 2013 SEMTOC SS2 ITS Devices

Costs and Benefits of MDOT ITS Deployments
180
Figure A-3: 2013 SEMTOC SS3 ITS Devices

Costs and Benefits of MDOT ITS Deployments
181
Figure A-4: 2013 WMTOC SS4 ITS Devices

Costs and Benefits of MDOT ITS Deployments
182
Figure A-5: 2013 WMTOC SS5 ITS Devices
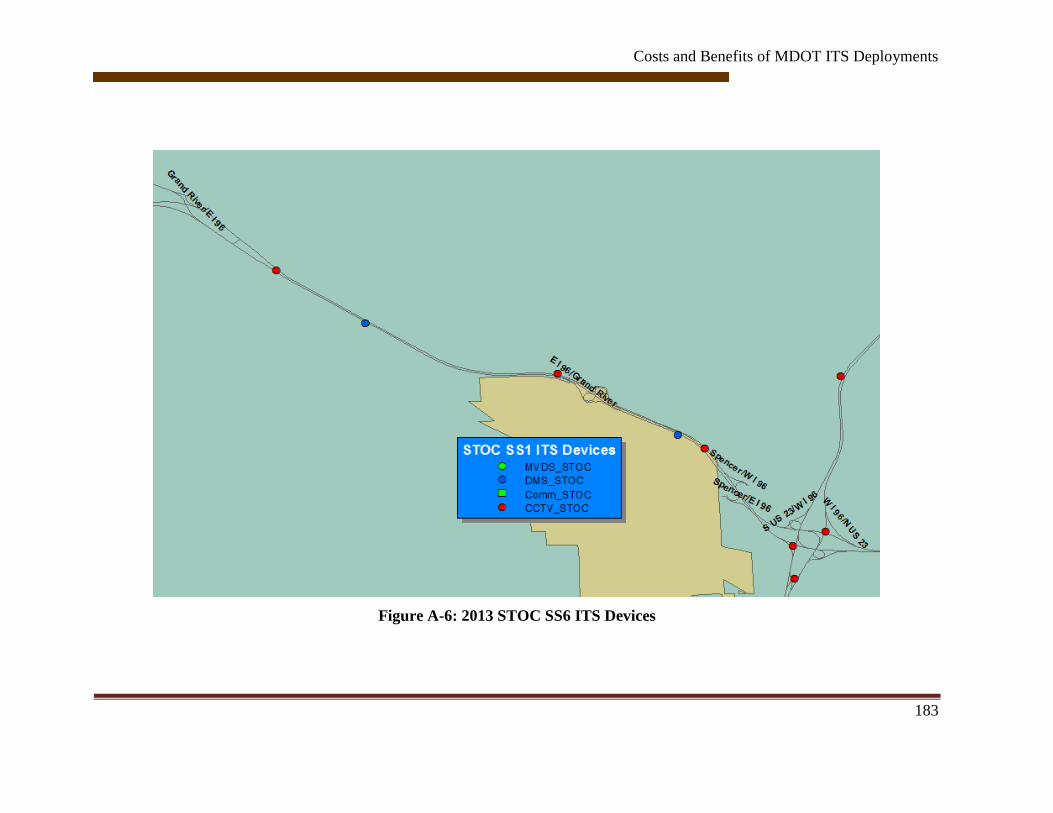
Costs and Benefits of MDOT ITS Deployments
183
Figure A-6: 2013 STOC SS6 ITS Devices

Costs and Benefits of MDOT ITS Deployments
184
Figure A-7: 2013 STOC SS7 ITS Devices
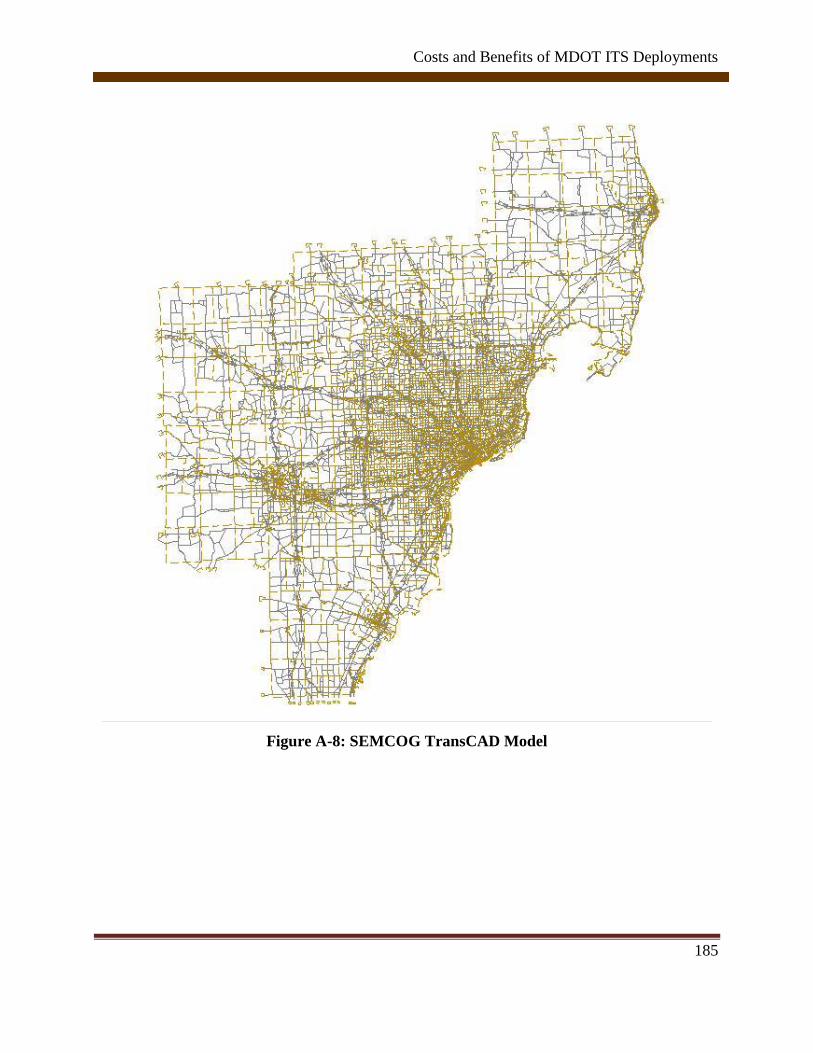
Costs and Benefits of MDOT ITS Deployments
185
Figure A-8: SEMCOG TransCAD Model
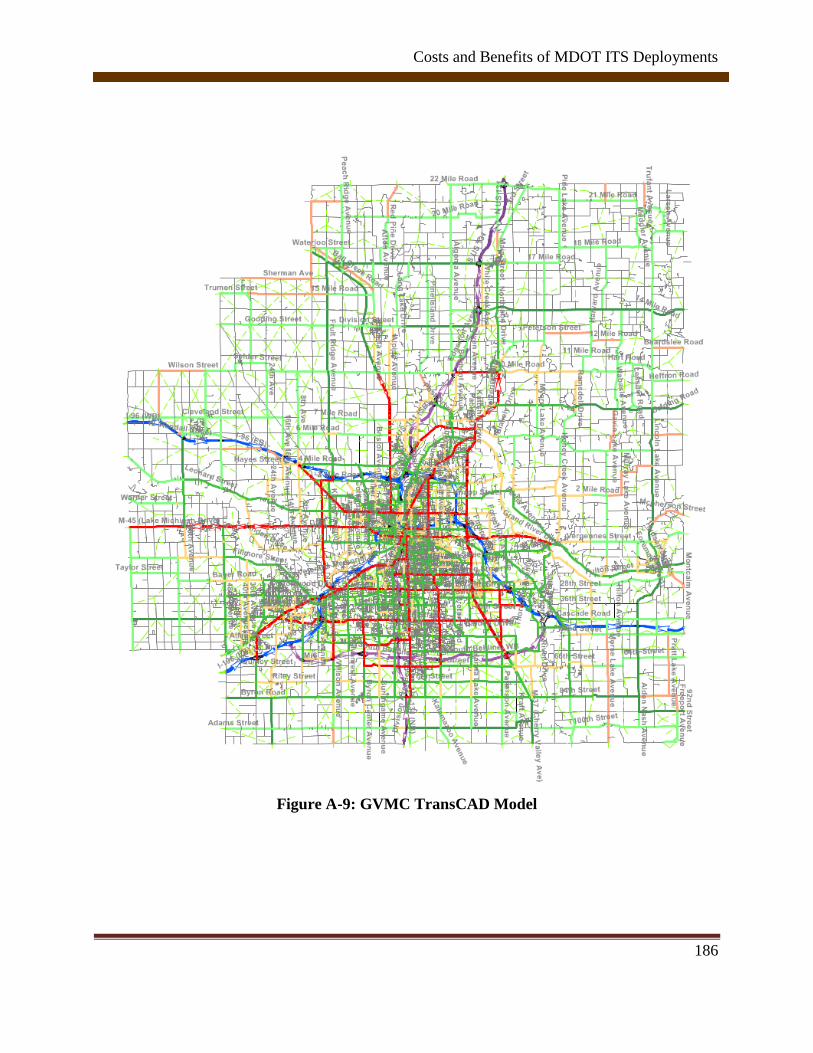
Costs and Benefits of MDOT ITS Deployments
186
Figure A-9: GVMC TransCAD Model
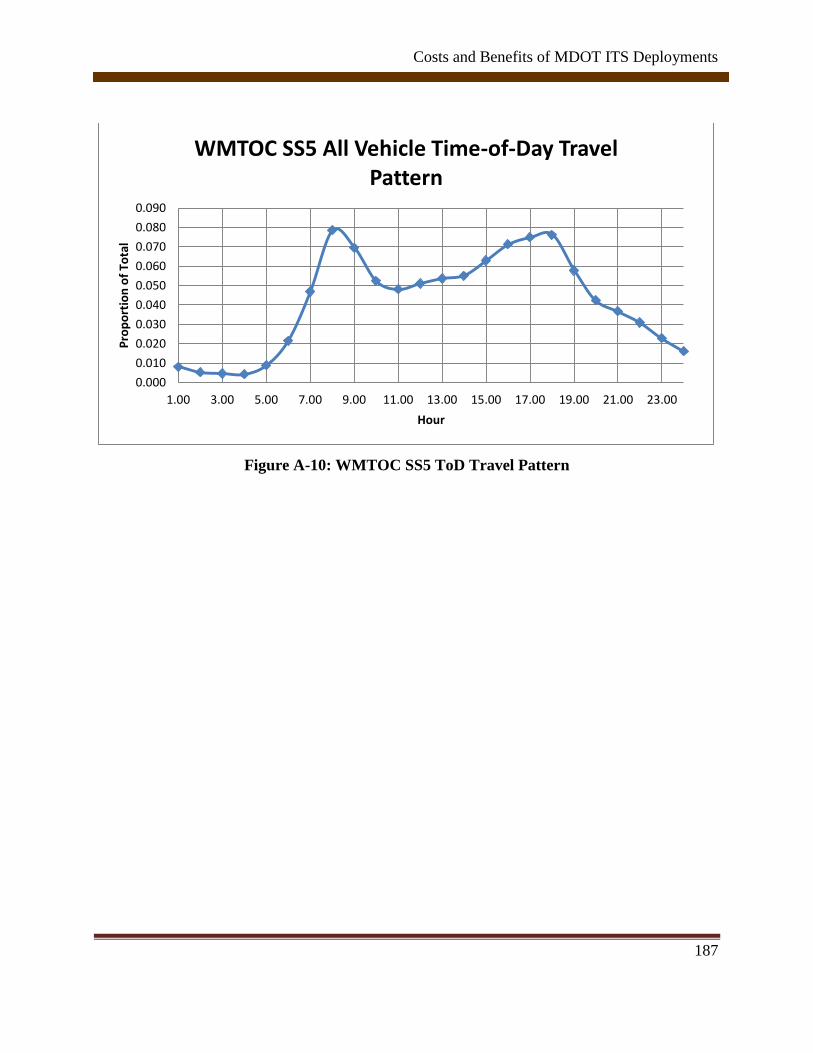
Costs and Benefits of MDOT ITS Deployments
187
Figure A-10: WMTOC SS5 ToD Travel Pattern
0.000
0.010
0.020
0.030
0.040
0.050
0.060
0.070
0.080
0.090
1.00 3.00 5.00 7.00 9.00 11.00 13.00 15.00 17.00 19.00 21.00 23.00
Pro
po
rtio
n o
f To
tal
Hour
WMTOC SS5 All Vehicle Time-of-Day Travel Pattern

Costs and Benefits of MDOT ITS Deployments
188
Appendix 5: Candidate ITS Corridors
PR LENGTH BPT EPT SEG_BEG SEG_END CRASHES_13 AADT_13 Crash_Mi
992703 0.547 28003525 28002929 13.259 13.806 47 25775 85.9
993209 0.157 28001897 28001937 0.995 1.152 17 29441 108.3
1431003 0.267 81004953 81004597 0.752 1.019 14 32500 52.4
935105 0.63 47015068 47015150 22.998 23.628 20 45700 31.7
1427301 0.99 81019910 81019519 11.56 12.55 41 27554 41.4
1426109 0.582 81016772 81024409 28.609 29.191 27 53200 46.4
992703 1.591 28004546 28003525 11.668 13.259 83 26921 52.2
993610 0.744 28002057 28002030 3.95 4.694 90 34178 121.0
1427301 0.326 81018143 81017946 16.802 17.128 20 30297 61.3
994002 1.108 28003098 28003316 1.824 2.932 48 25505 43.3
4300001 0.321 58007669 58007225 16.38 16.701 40 30011 124.6
1427301 0.664 81018473 81018143 16.138 16.802 72 26536 108.4
355110 0.137 33005281 33005223 0.984 1.121 7 25100 51.1
1426109 0.517 81024409 81016280 29.191 29.708 21 50700 40.6
992703 0.857 28002929 28002058 13.806 14.663 88 25212 102.7
1427301 0.729 81018861 81018473 15.409 16.138 63 25204 86.4
355110 0.781 33005584 33006764 5.015 5.796 32 30650 41.0
935207 0.794 47014812 47015127 23.002 23.796 27 45700 34.0
767610 0.5 9006883 9006065 4.362 4.862 31 26578 62.0
1501502 0.361 25012034 25025580 10.241 10.602 35 30803 97.0
767610 0.228 9007240 9006883 4.134 4.362 21 26986 92.1
1427706 1.046 81013119 81013703 3.586 4.632 80 25553 76.5
1427706 0.157 81013035 81013119 3.429 3.586 30 25553 191.1
349805 0.11 33003181 33002997 1.32 1.43 7 34427 63.6
349804 0.254 33004535 33004119 0.583 0.837 14 34427 55.1
1494107 1.182 25014265 25014187 7.909 9.091 90 28623 76.1
349804 0.103 33003183 33003003 1.338 1.441 5 34427 48.5
335601 0.498 33004696 33004970 5.554 6.052 37 28806 74.3
567503 0.342 23001568 23010720 19.111 19.453 25 25062 73.1
21502 0.957 39005469 39005428 4.286 5.243 48 26136 50.2
567503 1.015 23001548 23001531 21.105 22.12 72 25952 70.9
335601 0.304 33004526 33004696 5.25 5.554 25 28806 82.2
1497008 0.172 25012968 25012635 7.333 7.505 15 25656 87.2
466004 0.683 73007654 73007639 16.011 16.694 23 25864 33.7
335601 0.529 33004310 33004526 4.721 5.25 64 26677 121.0

Costs and Benefits of MDOT ITS Deployments
189
21502 0.751 39005316 39005340 6.244 6.995 35 30420 46.6
567503 0.306 23001560 23001556 19.799 20.105 25 26464 81.7
21502 0.212 39005313 39005316 6.032 6.244 29 28808 136.8
335601 1.038 33004970 33005522 6.052 7.09 43 25794 41.4
567503 0.346 23010720 23001560 19.453 19.799 35 25062 101.2
21502 0.789 39005428 39005313 5.243 6.032 72 25058 91.3
352303 0.518 33008088 33007533 3.709 4.227 33 25846 63.7
460105 0.499 73002311 73001895 2.738 3.237 27 26086 54.1
459605 0.822 73005073 73005086 2.71 3.532 69 31540 83.9
459605 0.752 73005086 73005100 3.532 4.284 28 27461 37.2
460105 0.994 73003346 73002311 1.744 2.738 54 25291 54.3
7405 0.641 39005599 39005569 0.628 1.269 56 25494 87.4
22207 1.845 39008859 39008151 6.388 8.233 126 27504 68.3
341208 0.548 33003064 33002732 5.086 5.634 32 29366 58.4
1426704 1.125 81007279 81005680 3.658 4.783 62 28582 55.1
341208 0.091 33003137 33003064 4.995 5.086 16 29103 175.8
1427706 0.634 81012727 81013035 2.795 3.429 120 36324 189.3
7405 0.125 39005605 39005599 0.503 0.628 11 25494 88.0
1227004 0.14 58009610 58009438 14.776 14.916 11 25608 78.6
1427706 0.81 81012469 81012727 1.985 2.795 83 33253 102.5
4604878 0.207 81009812 81009933 0.428 0.635 24 27413 115.9
341208 0.619 33002426 33002384 6.171 6.79 28 31352 45.2
1427103 1.067 81007208 81005729 3.668 4.735 41 28582 38.4
4603186 0.671 81008666 81007532 2.187 2.858 46 26940 68.6
932910 0.88 47009806 47010292 15.692 16.572 54 32990 61.4
22207 0.123 39005569 39005557 10.739 10.862 17 26129 138.2
341208 0.537 33002732 33002426 5.634 6.171 21 32860 39.1
932910 0.612 47009580 47009806 15.08 15.692 39 29486 63.7