Embed Size (px)
Citation preview
United States General Accounting Office
GAO Report to Congressional Requesters
July 1996 TRANSPORTATIONENHANCEMENTS
Status of the $2.4Billion Authorized forNonmotorizedTransportation
G OA
years1921 - 1996
GAO/RCED-96-156

GAO United States
General Accounting Office
Washington, D.C. 20548
Resources, Community, and
Economic Development Division
B-271840
July 26, 1996
The Honorable John H. ChafeeChairmanThe Honorable Max S. BaucusRanking Minority MemberCommittee on Environment and Public WorksUnited States Senate
The Honorable John W. WarnerChairman, Subcommittee on Transportation and InfrastructureCommittee on Environment and Public WorksUnited States Senate
The Intermodal Surface Transportation Efficiency Act of 1991 (ISTEA)included a $24 billion, 6-year authorization that created a new federal-aidhighway program—the surface transportation program. This programincluded a requirement that states set aside at least 10 percent of the$24 billion exclusively for 10 categories of “transportation enhancements,”such as pedestrian walkways, bikeways, scenic easements, or historicpreservation projects. Such enhancements are designed to strengthen thecultural, aesthetic, or environmental aspects of transportation or toencourage greater use of nonmotorized transportation.
The transportation enhancement set-aside, like the other provisions ofISTEA, is scheduled for reauthorization in 1997. You asked us to provideyou with information and analysis to assist in your deliberations on theenhancement program.1 Specifically, we are reporting on the followingfour questions:
• How do the obligation rates for transportation enhancement funds forfiscal years 1992-95 compare with the obligation rates for other majorhighway programs?2
• How do the obligation rates for transportation enhancement funds vary bystate, and what factors have affected the states’ use of these funds?
1A set-aside from the surface transportation program is used to fund transportation enhancementprojects, and funding for this category of projects is referred to throughout this report as atransportation enhancement set-aside or as constituting a transportation enhancement program.
2An obligation represents a commitment made by a federal agency to pay out money, as distinct froman actual payment.
GAO/RCED-96-156 Transportation EnhancementsPage 1
B-271840
• What types of projects are being funded with transportation enhancementfunds?
• What are stakeholders’ views on reauthorizing the transportationenhancement set-aside?
To address these questions, we analyzed national data and supplementedthis analysis by interviewing transportation officials in 16 states,representatives of five national organizations with an interest in thetransportation enhancement set-aside, and four local sponsors ofenhancement projects. Appendix I discusses our scope and methodologyin more detail.
Results in Brief During fiscal years 1992-95, the states obligated their transportationenhancement funds more slowly than their funds for other federal-aidhighway programs, including other programs established at the same timeas the transportation enhancement program. During fiscal year 1992, thefirst funding year for the transportation enhancement program, the statesobligated 22 percent of the available funds. By the end of fiscal year 1995,the overall rate of obligation had risen to 55 percent. In comparison, byfiscal year 1995, the obligation rate for another newly established highwayprogram—the congestion, mitigation, and air quality improvementprogram—was about 70 percent, and the rates for long-standing programs,such as the bridge program, were above 90 percent.
The obligation rates for transportation enhancement funds varysubstantially from state to state. At the end of fiscal year 1995, WashingtonState had obligated 99 percent of its available enhancement funds, whileIowa had obligated 7 percent. Factors hindering the states’ obligation ofenhancement funds include the time and staff resources required toimplement a new program, the nontraditional nature of transportationenhancement projects, and sponsors’ lack of familiarity with theadministrative requirements of federal-aid highway programs.
The Federal Highway Administration’s (FHWA) data on transportationenhancement projects have significant problems. These data indicate thatover 50 percent of the enhancement funding for fiscal year 1995—the firstyear FHWA collected such data—was apparently used for ineligibleactivities. To determine why, FHWA reviewed a sample of projects in fourstates and found that the funds were generally spent correctly but the stateor FHWA division offices miscoded the projects when entering them intothe data system. Also, although FHWA obtained some estimates from the
GAO/RCED-96-156 Transportation EnhancementsPage 2
B-271840
states, it did not begin to collect actual financial data on the types ofprojects funded by the enhancement set-aside until fiscal year 1995.Historical enhancement project data have, however, been developed bythe Rails-to-Trails Conservancy.3 Data from the Conservancy show thatfrom fiscal year 1992 through February 1996, 4 of the 10 eligible categorieshave received over 80 percent of the obligated funding. Bicycle andpedestrian projects have received more than one-third of the obligatedfunds, while rail-to-trail conversions, restorations of historictransportation facilities, and landscaping projects have each receivedapproximately 15 to 17 percent.
State transportation officials, representatives of national interest groups,and local project sponsors expressed mixed views on reauthorizing thetransportation enhancement set-aside. Twelve of the 16 state officials weinterviewed said they would prefer more flexibility in deciding how muchfederal aid to devote to transportation enhancement activities. Theyvoiced general support for such activities but considered them lessimportant than improving highway capacity or mobility. The fourremaining state officials, as well as the five interest group representativesand four project sponsors we contacted, said they supported the existingset-aside. They said that not having a set percentage for transportationenhancements would result in substantially less funding for such activities.
Background Funds provided under ISTEA’s surface transportation program maygenerally be used by states and localities for any road on the federal-aidhighway network.4 The transportation enhancement set-aside is anexception. Over ISTEA’s 6-year life, the set-aside authorizes $2.4 billion for10 categories of eligible projects, including bikeways, pedestrianwalkways, and historic preservation projects. Appendix II lists the 10categories and provides an example of the types of projects funded undereach. An enhancement project may be a separate project or a distinct partof a larger transportation project.
Funds for the transportation enhancement program, like the funds forother federal-aid highway programs, are annually made available to thestates by the Department of Transportation’s FHWA. The states thenobligate these funds for specific projects. An obligation represents a
3The purpose of the Rails-to-Trails Conservancy, a public interest organization, is to convertabandoned rail corridors into public multiuse trails.
4The nation has approximately 3.9 million miles of highways, about 950,000 miles of which aredesignated as federal-aid highways and are therefore eligible for federal highway funds.
GAO/RCED-96-156 Transportation EnhancementsPage 3

B-271840
commitment by FHWA, met through a reimbursement to a state, to pay thefederal share of a project’s cost. The states are not required to obligate thefunds in the year in which they are made available but may, subject tocertain restrictions, carry them forward for potential obligation insubsequent years.
Each state’s department of transportation is responsible for administeringthe state’s transportation enhancement program, but the sponsors oftransportation enhancement projects are often local governments or, insome cases, nonprofit organizations, according to an FHWA official. Thestate transportation department, often in cooperation with metropolitanplanning organizations,5 decides which transportation projects will befunded in the next year or two and incorporates the decision in a multiyearstatewide transportation plan. Like many federal-aid highway programs,this program generally requires the state or local agency to provide20 percent of a project’s funding.
States’ Obligation ofEnhancement FundsHas Been RelativelySlow but ShowsImprovement
In fiscal year 1992, the first year of funding for the transportationenhancement program, most states moved slowly to obligate the funds. Bythe end of the fiscal year, the states had obligated $79 million of the$353 million available, or 22 percent. Nine states had not obligated any oftheir available funding for enhancements; 34 states had obligated25 percent or less.
By the end of fiscal year 1995, after 4 fiscal years, the states had more thandoubled the percentage of funds they had obligated for transportationenhancements. Specifically, they had obligated $887 million, or 55 percent,of the $1.6 billion available since the program’s inception. All but six stateshad obligated at least 25 percent of their total available funding forenhancements.
While representing a significant improvement over the earlier obligationrates, the 55-percent obligation rate was considerably lower than theobligation rates for the other highway programs we reviewed. Forexample, the obligation rate for the bridge program, a long-standingsurface transportation program, was approximately 90 percent during all 4fiscal years. Similarly, programs such as the interstate maintenanceprogram, which existed before ISTEA’s enactment but were modified by thislegislation, had obligation rates of about 90 percent during all 4 fiscal
5A metropolitan planning organization represents an entity designated by a governor as responsible,together with a state, for transportation planning in an urbanized area.
GAO/RCED-96-156 Transportation EnhancementsPage 4
B-271840
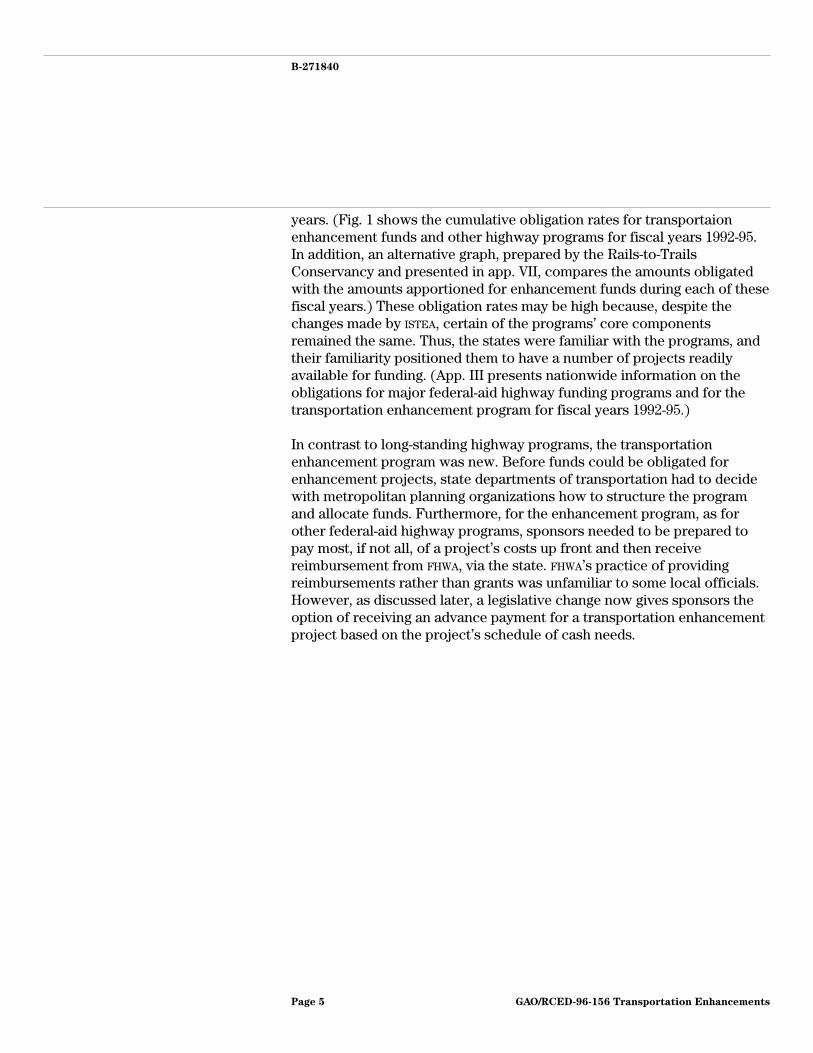
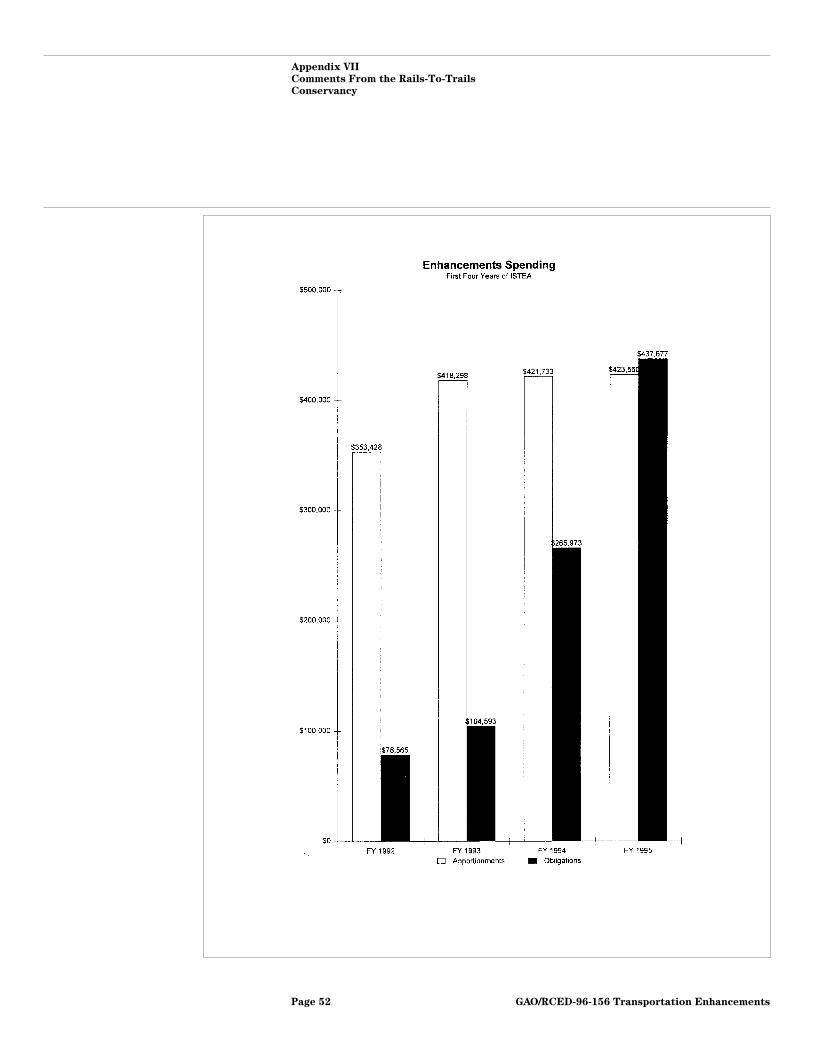
years. (Fig. 1 shows the cumulative obligation rates for transportaionenhancement funds and other highway programs for fiscal years 1992-95.In addition, an alternative graph, prepared by the Rails-to-TrailsConservancy and presented in app. VII, compares the amounts obligatedwith the amounts apportioned for enhancement funds during each of thesefiscal years.) These obligation rates may be high because, despite thechanges made by ISTEA, certain of the programs’ core componentsremained the same. Thus, the states were familiar with the programs, andtheir familiarity positioned them to have a number of projects readilyavailable for funding. (App. III presents nationwide information on theobligations for major federal-aid highway funding programs and for thetransportation enhancement program for fiscal years 1992-95.)
In contrast to long-standing highway programs, the transportationenhancement program was new. Before funds could be obligated forenhancement projects, state departments of transportation had to decidewith metropolitan planning organizations how to structure the programand allocate funds. Furthermore, for the enhancement program, as forother federal-aid highway programs, sponsors needed to be prepared topay most, if not all, of a project’s costs up front and then receivereimbursement from FHWA, via the state. FHWA’s practice of providingreimbursements rather than grants was unfamiliar to some local officials.However, as discussed later, a legislative change now gives sponsors theoption of receiving an advance payment for a transportation enhancementproject based on the project’s schedule of cash needs.
GAO/RCED-96-156 Transportation EnhancementsPage 5
B-271840
Figure 1: Cumulative Obligation Rates for Transportation Enhancement Funds and Other Selected Highway Programs,Fiscal Years 1992-95
0
10
20
30
40
50
60
70
80
90
100
TransportationEnhancements
SurfaceTransportationProgram
Congestion AirQuality andMitigationProgram
National HighwaySystem
Bridge InterstateMaintenance
fy 92
fy 93
fy 94
fy 95
Note: The selected programs represent major federal-aid highway programs and account forapproximately 70 percent of the highway funds authorized by ISTEA.
Source: GAO’s presentation of data from FHWA’s information system.
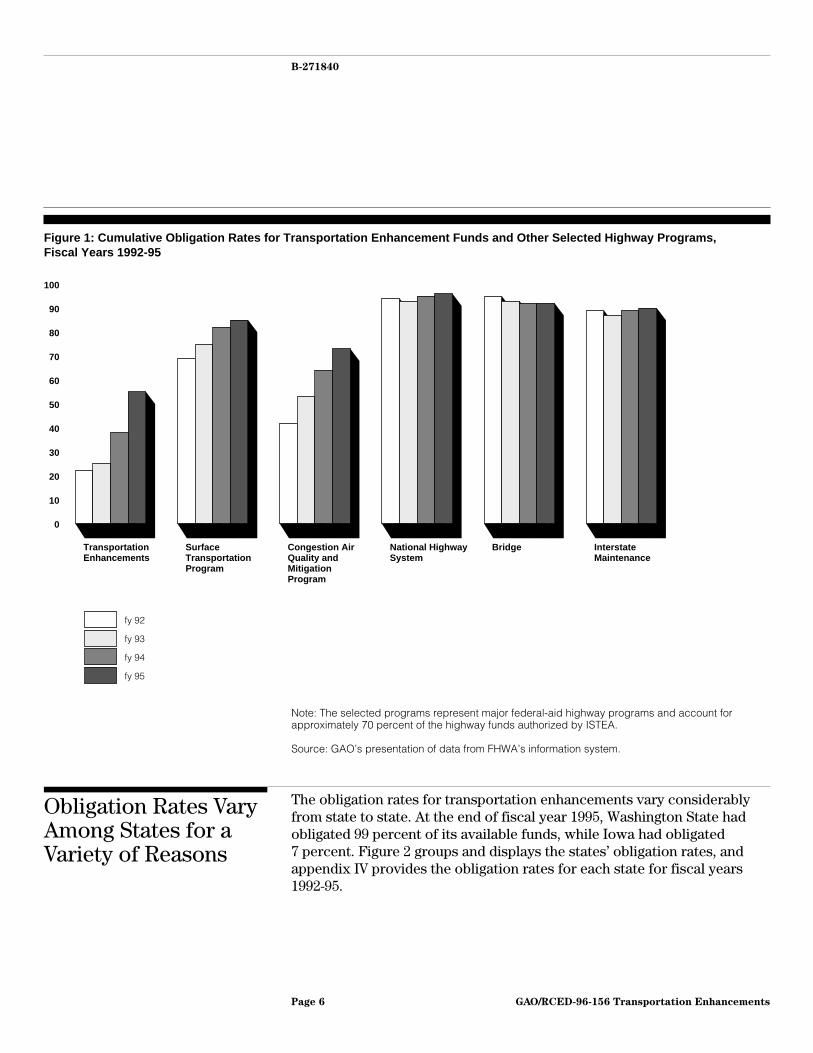
Obligation Rates VaryAmong States for aVariety of Reasons
The obligation rates for transportation enhancements vary considerablyfrom state to state. At the end of fiscal year 1995, Washington State hadobligated 99 percent of its available funds, while Iowa had obligated7 percent. Figure 2 groups and displays the states’ obligation rates, andappendix IV provides the obligation rates for each state for fiscal years1992-95.
GAO/RCED-96-156 Transportation EnhancementsPage 6
B-271840
Figure 2: Cumulative Obligation Rates for Transportation Enhancement Funds, Fiscal Years 1992-95
Obligated 0-25% of Enhancement Funds
Obligated 26-50% of Enhancement Funds
Obligated 51-75% of Enhancement Funds
Obligated 76-100% of Enhancement Funds
Source: GAO’s presentation of data from FHWA’s information system.
GAO/RCED-96-156 Transportation EnhancementsPage 7
B-271840
We asked transportation department officials from 16 states, as well asrepresentatives from five interest groups and four sponsoringorganizations, what difficulties they had encountered in obligatingenhancement funds. They mentioned four major factors: (1) Localsponsors were unfamiliar with federal-aid highway programs’administrative procedures, (2) programs mandated by ISTEA took time todevelop, (3) administering a large number of low-cost projects wasperceived as burdensome, and (4) state transportation departments lackedthe staff or expertise needed to administer enhancement projects, sincesuch projects differed significantly in scope and nature from traditionalhighway construction projects. In addition, the Rails-to-Trails Conservancymentioned a fifth factor—a limit imposed by federal budgetary constraintson the total amount a state can obligate in a given year. Because this limitapplies to the federal-aid highway program as a whole and the states havethe discretion to allocate their available authority among the individualhighway programs, transportation enhancement projects are competingfor funds with higher-priority traditional highway projects and findthemselves at a disadvantage, according to Conservancy officials. AWisconsin transportation enhancement program manager told us thatbecause of the federal limit on obligations, the state has restricted itsobligations for transportation enhancements to approximately 40 percentof the funds apportioned for enhancements in recent years. (App. Vdiscusses these factors in more detail.)
The process for obtaining enhancement funds was eased throughprovisions of the National Highway System Designation Act of 1995,enacted in November of that year. This legislation permits the streamliningof environmental and historic preservation reporting requirements fortransportation enhancement projects. It also gives sponsors the option ofreceiving advance payments for transportation enhancement projects.These payments, FHWA officials noted, are based on the projects’ schedulesof cash needs.
To promote transportation enhancement projects, FHWA is currentlyproviding the states and local sponsors with additional guidance onfederal-aid highway and other relevant federal regulatory requirements,according to an FHWA official. FHWA also helped sponsor a conference ontransportation enhancements in 1994 that was attended by over 300stakeholders from 49 states. The intent of the conference was to assess theachievements realized to date and brainstorm what changes might beneeded to maximize the benefits of transportation enhancement funding.A second conference, held in June 1996, was intended to showcase
GAO/RCED-96-156 Transportation EnhancementsPage 8
B-271840
successful enhancement projects and demonstrate why such efforts areessential for developing effective community-based transportationsystems.
Data on Uses ofEnhancement Funds
FHWA’s data on the types of projects being funded with transportationenhancement moneys are limited and have significant problems. However,data collected by the Rails-to-Trails Conservancy indicate that nearly all ofthe projects for which funds were obligated from October 1, 1992, throughFebruary 1996 fell into 4 of the 10 eligible categories: bicycle/pedestrianfacilities, rail-to-trail conversions, landscaping projects, and therehabilitation of historic transportation buildings or facilities. In addition,the states and FHWA division offices have variously interpreted the linkbetween transportation and the rehabilitation of historic buildings andfacilities.
FHWA’s Data onTransportationEnhancement ProjectsRaises Concerns
From fiscal year 1992 through fiscal year 1994, FHWA formally trackedinformation only on the states’ overall obligations for transportationenhancement funds. FHWA did not track the obligations for specificprojects, but it did ask the states to estimate the amounts they obligated toeach of the 10 transportation enhancement categories beginning in fiscalyear 1992. FHWA recognized that, because of incomplete and perhapsinaccurate reporting, the data were of limited use.6
In fiscal year 1995, however, FHWA began to collect data on the obligationsfor individual enhancement projects. Our analysis of these data showedthat over 50 percent of the transportation enhancement funds hadapparently been used for ineligible activities.7 Specifically, according toFHWA’s data, transportation enhancement funds were used for constructionengineering, training, highway and bridge raw materials, and trafficsignals, but these types of activities are not eligible for enhancementfunding unless they are linked to one of the 10 categories listed inappendix II.
After we advised FHWA of this problem, FHWA began an investigation in fourstates where a high proportion of transportation enhancement funds hadapparently been used for ineligible activities. According to a program
6We attempted, but were unable, to reconcile these data with the states’ actual obligations oftransportation enhancement funds.
7For closed projects, 57 percent of the obligations were listed as applied to apparently ineligibleactivities; for active projects, 55 percent of the obligations were listed as applied to such activities.
GAO/RCED-96-156 Transportation EnhancementsPage 9
B-271840
official, FHWA’s preliminary findings, based on a sample of projects in eachstate, indicate that in most cases state and/or FHWA officials did not codethe projects for the proper statistical category in FHWA’s database. In otherwords, the projects were eligible, but they were coded in the wrongcategory. In one instance, funds were obligated to the wrong programcategory, but the responsible state has corrected this misobligation offunds. A program official stated that FHWA’s review of this issue is nowcomplete and the problems have been corrected for the projects sampledfrom the four states. However, the problem is not limited to the fourstates; it occurred nationwide and involved over 50 percent of thetransportation enhancement funds obligated in fiscal year 1995.
FHWA officials told us they will be sending a memorandum to their fieldoffices instructing the staff to be more diligent in the future when codingtransportation enhancement projects. They are also consideringincorporating edit checks into the transportation enhancement codingprocess, if appropriate, after an FHWA task force completes an ongoingreview of the entire financial information system. However, the officialsimplied that although they may consider incorporating edit checks, theywill probably not do so, since the task force is expected to recommend areduction in the number of codes requiring choices on the part of dataentry clerks. FHWA expects this streamlining to improve the accuracy of thedata throughout its information system. However, FHWA officials alsoobserved that the streamlining could eliminate coding for transportationenhancement projects altogether.
Since FHWA has corrected the data for only the sampled projects in the fourstates it reviewed, reliable information on obligations for enhancementprojects, from fiscal year 1995 (when FHWA began collecting the data) tothe present does not exist. Therefore, FHWA will not have data to report tothe Congress on how the funds authorized for transportationenhancements have been used.
Four Types of ProjectsReceived Most of theFunding
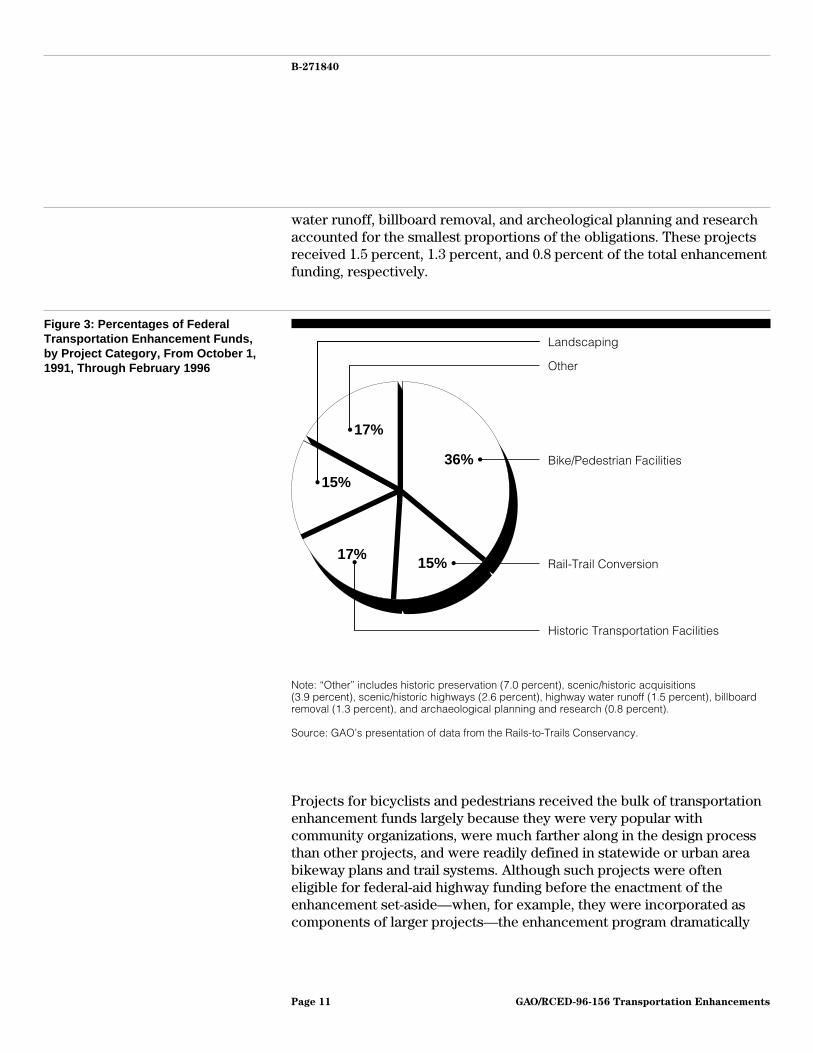
According to data collected by the Rails-to-Trails Conservancy, projectsinvolving facilities for bicyclists or pedestrians accounted for about36 percent of the obligations for transportation enhancements during the4-year period. (See fig. 3.) Rail-to-trail conversions, restorations of historictransportation facilities, and landscaping projects have each accounted forapproximately 15 to 17 percent of the obligations. (See app. VI forexamples of the types of transportation enhancement projects fundedmost frequently during fiscal years 1992-95.) Projects involving highway
GAO/RCED-96-156 Transportation EnhancementsPage 10
B-271840
water runoff, billboard removal, and archeological planning and researchaccounted for the smallest proportions of the obligations. These projectsreceived 1.5 percent, 1.3 percent, and 0.8 percent of the total enhancementfunding, respectively.
Figure 3: Percentages of FederalTransportation Enhancement Funds,by Project Category, From October 1,1991, Through February 1996
36% • Bike/Pedestrian Facilities
15% • Rail-Trail Conversion17%•
Historic Transportation Facilities
15%•
Landscaping
17%•
Other
Note: “Other” includes historic preservation (7.0 percent), scenic/historic acquisitions(3.9 percent), scenic/historic highways (2.6 percent), highway water runoff (1.5 percent), billboardremoval (1.3 percent), and archaeological planning and research (0.8 percent).
Source: GAO’s presentation of data from the Rails-to-Trails Conservancy.
Projects for bicyclists and pedestrians received the bulk of transportationenhancement funds largely because they were very popular withcommunity organizations, were much farther along in the design processthan other projects, and were readily defined in statewide or urban areabikeway plans and trail systems. Although such projects were ofteneligible for federal-aid highway funding before the enactment of theenhancement set-aside—when, for example, they were incorporated ascomponents of larger projects—the enhancement program dramatically
GAO/RCED-96-156 Transportation EnhancementsPage 11
B-271840
increased the amounts designated specifically for them. Between 1973 and1991, the states spent a total of $40.7 million on such projects; from fiscalyear 1992 through February 1996, the states had awarded approximately$581 million, according to data from the Rails-to-Trails Conservancy.
As previously mentioned, FHWA helped sponsor a conference ontransportation enhancements in June 1996 that was intended to showcasesuccessful enhancement projects and demonstrate why such efforts areessential for developing effective community-based transportationsystems. The conference featured 25 of the best projects, chosen fromover 80 that were nominated. Some of these projects include the following:
• In San Francisco, California, transportation enhancement funds are beingused to support preliminary engineering, design, and construction work onthe long-neglected Ferry Building. This effort is intended to reestablish thebuilding as a major intermodal transportation and mixed-use complex,emphasizing the historic and public nature of the building and improvingconnections between transportation by land and water.
• In rural Liberty County, Georgia, transportation enhancement funds arebeing used to link five heritage tourism sites of statewide and nationalhistoric significance. The sites, which commemorate African-American lifefrom slavery through more recent times, are linked through directionaland interpretive signage, a common travel brochure, and a joint marketingeffort.
• In Minneapolis, Minnesota, transportation enhancement funds were usedto rehabilitate a once-closed bridge as a short-line trolley, bicycle, andpedestrian corridor. A survey conducted last summer indicated that over12,000 people per week were using the bridge; of these, nearly half werecommuting to and from the downtown business district. The bridge alsoconnects the downtown with the University of Minnesota.
Some EnhancementProjects May Not Have aDirect Link toTransportation
According to many of the state officials and some of the interest grouprepresentatives we contacted, the eligibility criteria for funding someenhancement projects—especially historic preservation projects—havebeen variously interpreted. ISTEA’s definition of historic preservation isbroad and general: It simply lists historic preservation as an activityeligible for enhancement funding. FHWA’s implementing guidance requiresthat to be eligible for funding, any transportation enhancementproject—including a historical preservation project—must have a directlink to an intermodal transportation system by function, proximity, or
GAO/RCED-96-156 Transportation EnhancementsPage 12
B-271840
impact.8 However, the states and FHWA’s division offices have interpretedthis link in different ways. According to a 1994 FHWA review ofenhancement programs in nine states,9
“[t]here was a rather wide variety of eligibility decisions made in the historic preservationcategory and it was not unusual to find actions that had been approved in one State anddenied in another. This was generally due to varying interpretations of what constituted adirect relationship to the intermodal transportation system.”
Some interpretations have resulted in the funding of historic preservationprojects that appear to have little or no link to transportation. Thequestionable link to transportation is shown in the following examples,which we identified through discussions with state officials and interestgroup representatives.
• Rehabilitation of grandstands at the Iowa State Fair. Iowa’s transportationdepartment and FHWA’s division office approved $750,000 to renovate thehistoric Iowa State Fair grandstand, built in 1927. This renovation, a$4.3 million project to be completed in four phases, will restore thegrandstand to its original condition. According to a state transportationofficial, some groups within the state, such as bicycle advocates, opposedthe use of enhancement funds for this project because they believed it hadno direct link to transportation.
• Purchase and renovation of Oddfellows’ Building in Griffin, Georgia.Georgia’s transportation department and FHWA’s division office approved$1 million to restore the Oddfellows’ Building and convert it into an operahouse and meeting hall in 1994. Local officials saw the rehabilitation asproviding space for meetings and theater performances as well as boostingtourism in the downtown area. A Georgia transportation official suggeststhat this project would probably not be approved for funding todaybecause more is known about the guidance requiring a direct link totransportation.
8According to ISTEA, “the term ’transportation enhancement activities’ means, with respect to anyproject or the area to be served by the project, provision of facilities for pedestrians andbicycles . . .[and the other nine categories of eligible activities].” FHWA interpreted the overall contextof the phrase “with respect to any project” to mean that the proposed transportation enhancementproject or activity must have a direct relationship to the intermodal transportation system, but notnecessarily to a currently planned highway project. The guidance specified that this relationshipshould be one of function, proximity, or impact but did not further define these terms except to giveexamples of eligible projects, such as an independent bike path and the removal of outdooradvertising.
9See The Implementation of Transportation Enhancements, FHWA, Office of Program Review andOffice of Environment and Planning (Aug. 1994).
GAO/RCED-96-156 Transportation EnhancementsPage 13
B-271840
The written proceedings of a June 1994 workshop on transportationenhancements—attended by officials from over 300 federal, state, andlocal governments, as well as representatives of private organizationsinterested in transportation enhancements—highlighted stakeholders’concerns about the link to transportation. The document noted that duringthe workshop, questions arose about Maryland’s justification for usingenhancement funds to restore a Civil War battlefield. In response to aquestion about the link between the battlefield and transportation, aMaryland state representative explained that “you can see the battlefieldwhen you drive down the road.” Furthermore, this official’s advice was tonot worry about drawing the line on a project’s eligibility, but rather topush until stopped by FHWA. During the discussion, a representative fromthe Office of the Secretary of Transportation concurred with the stateofficial and noted the Department was encouraging creativity.
Although officials from the Rails-to-Trails Conservancy estimated that theproblem extended to only a small fraction of the historic preservationprojects, FHWA released additional guidance in June 1995 on the eligibilityrequirements for historic preservation projects. This guidance reads asfollows:
“. . . In the case of non-transportation historic properties, the concept of direct relationshiphas been very widely interpreted. For example, some have interpreted it very broadly,allowing virtually any historic property to be rehabilitated using transportationenhancement funds. Others have interpreted this language more narrowly, requiring asubstantial transportation linkage in order for an undertaking to be considered eligible. Webelieve this latter interpretation reflects the legislative intent.”
Some stakeholders, however, believe that further guidance is stillwarranted. Among the state transportation officials and interest grouprepresentatives we contacted, several said additional clarification wasneeded because interpretations of what constitutes a direct link totransportation continue to vary. According to several officials, the criteriaare still too subjective and each state or FHWA division office has its ownopinion on how to interpret this requirement.
GAO/RCED-96-156 Transportation EnhancementsPage 14
B-271840
Views Are Mixed onReauthorizingTransportationEnhancementSet-Aside
Twelve of the 16 state officials we interviewed favored greater flexibility indeciding how much federal aid to use for transportation enhancements.They wanted to see ISTEA’s 10-percent set-aside modified. The other fourstate officials and all of the interest group representatives and projectsponsors we contacted wanted to see the set-aside reauthorized to ensurecontinued support for enhancement activities.
Transportation officials who favored modification of the set-aside wantedto see it replaced with another funding mechanism. Many said it restrictedtheir state’s ability to spend surface transportation funds on otherhigher-priority infrastructure or highway projects, and they stressed theneed to spend increasingly scarce resources on projects for improvinghighway capacity or mobility. The manager of Georgia’s enhancementprogram said, for example, that the fixed-percentage requirement wasdiverting scarce resources from highway preservation andcapacity-enhancement projects, which were 40-percent underfunded in hisstate.
Many of the state officials who favored modification of the set-aside saidthat transportation enhancement projects were needed and wouldcontinue to receive some funding if the set-aside were lifted. Several saidthe enhancement program fostered good public relations and helped themforge new partnerships with organizations that often opposedtransportation departments’ actions on more traditional highwayconstruction projects. The managers for the Delaware and Georgiaenhancement programs said, for example, that their programs broughttheir departments together with many community, environmental, andother organizations to plan and develop enhancement projects. However,many of these officials acknowledged that if the set-aside were eliminated,the funding for transportation enhancements would be reduced.
Supporters of the set-aside indicated they were generally to very satisfiedwith it because it provides a fixed amount of funding to complementtraditional highway projects. Almost one-half the supporters said itensured that enhancements would retain a share of the increasingly scarcefederal funds for transportation infrastructure. Without it, they said, thestates’ funding for enhancements would likely be curtailed significantly.
Interest group representatives said that enhancement projects havereceived strong public support, improved safety and mobility forpedestrians and cyclists, and provided various other benefits, such as abetter quality of life, increased civic pride, and more livable communities.
GAO/RCED-96-156 Transportation EnhancementsPage 15
B-271840
As proof of the projects’ popularity, a representative of the Rails-to-TrailsConservancy said that some 10,000 projects have been proposednationwide and local sponsors have been willing to contribute an averageof 29 percent of the projects’ costs in local matching funds, well above thegeneral minimum matching requirement of 20 percent.
FHWA found a similar split in opinion between state transportation officials,who generally opposed the fixed-percentage set-aside, and local sponsorsand interest groups, who generally supported it.10 FHWA interviewedrepresentatives of 9 state transportation departments, 39 localgovernments or metropolitan planning organizations, and 16 specialinterest groups. The state transportation officials acknowledged that theset-aside would have to be retained to ensure that enhancement projectswould be implemented. Although some enhancements would continue tobe funded through other transportation projects, the funding for themwould not be tracked separately from the overall funding for the projects.Furthermore, according to eight of the nine state transportation officialsFHWA contacted, if the set-aside were eliminated, the states could notcommit themselves to funding their enhancement programs at currentlevels because their infrastructure and highway capacity needs far exceedtheir financial resources. In contrast, virtually all of the local sponsors andinterest groups contacted by FHWA favored continuing the set-aside beyondISTEA’s 6-year authorization period because they believe the program needsa longer incubation period.
Conclusions The relatively slow rate of obligation for transportation enhancementfunds may reflect the difficulty of implementing a new and nontraditionalprogram. Also, as officials from the Rails-to-Trails Conservancy noted, thisdifficulty may be compounded by the fact that transportationenhancement projects have to compete with more traditional programs foravailable obligation authority, which is subject to an overall limitationimposed by budgetary constraints. Thus, obligations for transportationenhancements continue to be lower than for other transportationprograms, although substantial progress has been made in obligating fundsfor enhancements.
Although transportation officials differed over whether the transportationset-aside should be continued, they agreed that without the set-aside, thefunding for transportation enhancements would be reduced. Whetherfunding should continue to be reserved for transportation enhancements
10See the FHWA report cited in footnote 6.
GAO/RCED-96-156 Transportation EnhancementsPage 16
B-271840
and, if so, how much are policy questions for the Congress to consider inreauthorizing ISTEA.
State officials frequently point to the gap between infrastructure needs andavailable resources. In light of this gap, enhancement projects need tohave a strong link to transportation to justify allocating surfacetransportation resources for them. Such a link has been tenuous for somehistoric preservation projects. Although FHWA has revised its guidance toclarify the link, its efforts may not be sufficient, since the key phrase“substantial transportation linkage” is not clearly defined in the revisedguidance. Monitoring the field offices’ implementation of the revisedguidance and further clarifying the definition, if necessary, couldencourage consistent interpretations by state and FHWA division officeofficials.
It is unclear whether a memorandum directing staff to be more diligentwhen coding transportation enhancement projects for entry into the datasystem will encourage greater accuracy. Changes to FHWA’s coding or dataentry procedures could help to limit miscoding in the future. Unless suchchanges are made and the data entered since the start of fiscal year 1995are corrected, we see no point in continuing to collect data that appear tobe largely inaccurate on transportation enhancement projects. Onedisadvantage of eliminating the data is that FHWA will not be able to reportto the Congress on how funds are being used for transportationenhancements.
Recommendation We recommend that the Secretary of Transportation require theAdministrator of FHWA to (1) revise FHWA’s coding or data entry proceduresto ensure that transportation enhancement funds can be programmed onlyfor eligible activities and (2) correct previous coding and misobligationinformation from fiscal year 1995 to the present. Alternatively, if action isnot taken to improve the quality of the transportation enhancement data,we recommend that the collection of data on specific transportationenhancement projects be discontinued.
Agency Comments We provided a draft of this report to FHWA for its review and comment. Wealso provided a draft to the Rails-to-Trails Conservancy, since we wererelying in part on its information on transportation enhancements. Toobtain FHWA’s comments, we met with the Associate Administrator forProgram Development, the former and current Chiefs of the
GAO/RCED-96-156 Transportation EnhancementsPage 17
B-271840
Environmental Programs Branch, and other FHWA officials. According tothese officials, our statement that transportation enhancement funds areoften being used for apparently ineligible activities is misleading, sinceFHWA’s four-state review disclosed that the problem consisted largely ofcoding mistakes. We discuss the results of FHWA’s four-state review andemphasize that the projects were generally eligible but coding errors weremade. Whether the problem consisted largely of coding mistakes in theother 46 states remains to be determined.
In responding to our recommendation, FHWA officials said, as previouslynoted, that they would issue a memorandum directing their field offices topay closer attention to the quality of the transportation enhancement dataentered into the information system. However, these officials doubted thatpreviously entered transportation enhancement data would be revised.They said that recoding all prior projects, especially those that predatedthe 1995 project coding requirements, would create an undue burden. Wedid not intend to suggest that projects predating FHWA’s fiscal year 1995coding requirements should be recoded, and we have explicitly limited ourrecommendation to data from fiscal year 1995 to the present. We believethat these data need to be corrected to comply with the reportingrequirements in effect at that time. Furthermore, these data would furnishthe Congress with information on the uses of transportation enhancementfunds as it considers reauthorizing highway and related activities.
FHWA officials stated that they would consider installing edit checks afteran FHWA task force completes its review of the whole information system.They further noted that the task force is trying to streamline theinformation system, and this streamlining may eliminate the collection ofdata on specific transportation enhancement projects.
One of the major concerns expressed by officials from the Rails-to-TrailsConservancy was that we were not adequately recognizing the progressmade in obligating transportation enhancement funds by the end of fiscalyear 1995. While our draft report did note this progress, our final reportfurther highlights this information. Conservancy officials also identifiedanother reason—a limit on obligations—that can impede the obligation ofenhancement funds. We recognize this limit in our final report. Commentsfrom the Rails-to-Trails Conservancy and our responses appear inappendix VII.
Technical and clarifying comments provided by FHWA and theRails-to-Trails Conservancy have been incorporated where appropriate.
GAO/RCED-96-156 Transportation EnhancementsPage 18
B-271840
We performed our review from July 1995 through June 1996 in accordancewith generally accepted government auditing standards.
As arranged with your offices, unless you publicly announce its contentsearlier, we plan no further distribution of this report until 14 days after thedate of this letter. At that time, we will send copies to the Secretary ofTransportation, the Administrator of FHWA, the President of theRails-to-Trails Conservancy, and other interested parties. We will alsomake copies available to others on request.
Please call me at (202) 512-2834 if you or your staff have any furtherquestions. Major contributors to this report are listed in appendix VIII.
John H. Anderson, Jr.Director, Transportation and Telecommunications Issues
GAO/RCED-96-156 Transportation EnhancementsPage 19
Contents
Letter 1
Appendix I Scope andMethodology
24
Appendix II Categories ofTransportationEnhancementProjects
26
Appendix III Cumulative ObligationRates forTransportationEnhancement Fundsand Other SelectedFederal-Aid HighwayPrograms, FiscalYears 1992-95
28
Appendix IV Cumulative ObligationRates forTransportationEnhancement Funds,by State, Fiscal Years1992-95
30
GAO/RCED-96-156 Transportation EnhancementsPage 20
Contents
Appendix V Factors That Slowedthe Use ofEnhancement Funds
34Local Sponsors Were Unfamiliar With Federal-Aid Highway
Administrative Procedures34
ISTEA-Mandated Programs Took Time to Develop 35Administering a Large Number of Low-Cost Projects Was
Burdensome36
State Transportation Departments Lacked Staff or Expertise toAdminister Nontraditional Projects
36
Appendix VI Examples ofTransportationEnhancementProjects
37Facilities for Pedestrians and Bicyclists 37Rail-To-Trail Conversions 39Rehabilitation of Historic Transportation Buildings or Facilities 41Landscaping 41Enhancement Projects That Include Elements From Several
Categories42
Appendix VII Comments From theRails-To-TrailsConservancy
44GAO Comments 53
Appendix VIII Major Contributors toThis Report
56
Figures Figure 1: Cumulative Obligation Rates for TransportationEnhancement Funds and Other Selected Highway Programs,Fiscal Years 1992-95
6
Figure 2: Cumulative Obligation Rates for TransportationEnhancement Funds, Fiscal Years 1992-95
7
Figure 3: Percentages of Federal Transportation EnhancementFunds, by Project Category, From October 1, 1991, ThroughFebruary 1996
11
Figure VI.1: Multiuse Trail in Everett, Washington 38Figure VI.2: Bicycle Racks Installed in Tacoma, Washington 39Figure VI.3: Site Before the Railroad Right-of-Way Was Converted
to a Trail in Cheshire, Connecticut40
GAO/RCED-96-156 Transportation EnhancementsPage 21
Contents
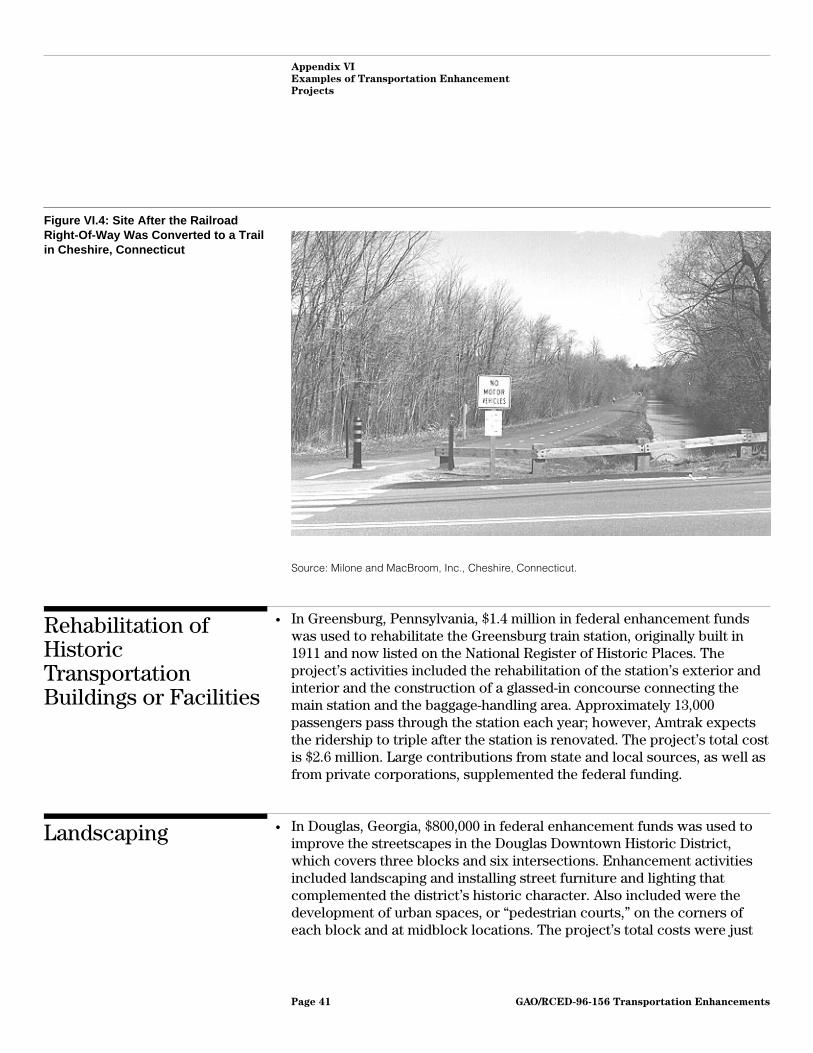
Figure VI.4: Site After the Railroad Right-of-Way Was Convertedto a Trail in Cheshire, Connecticut
41
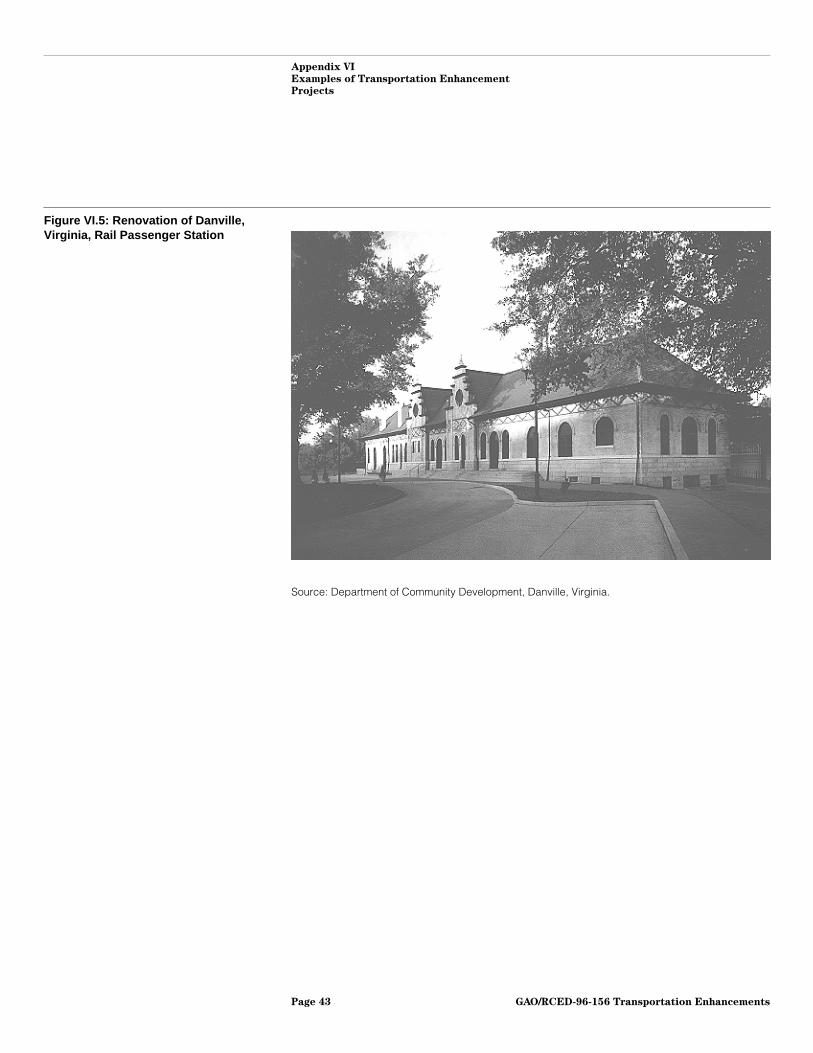
Figure VI.5: Renovation of Danville, Virginia, Rail PassengerStation
43
Abbreviations
FHWA Federal Highway AdministrationISTEA Intermodal Surface Transportation Efficiency Act of 1991
GAO/RCED-96-156 Transportation EnhancementsPage 22

GAO/RCED-96-156 Transportation EnhancementsPage 23
Appendix I
Scope and Methodology
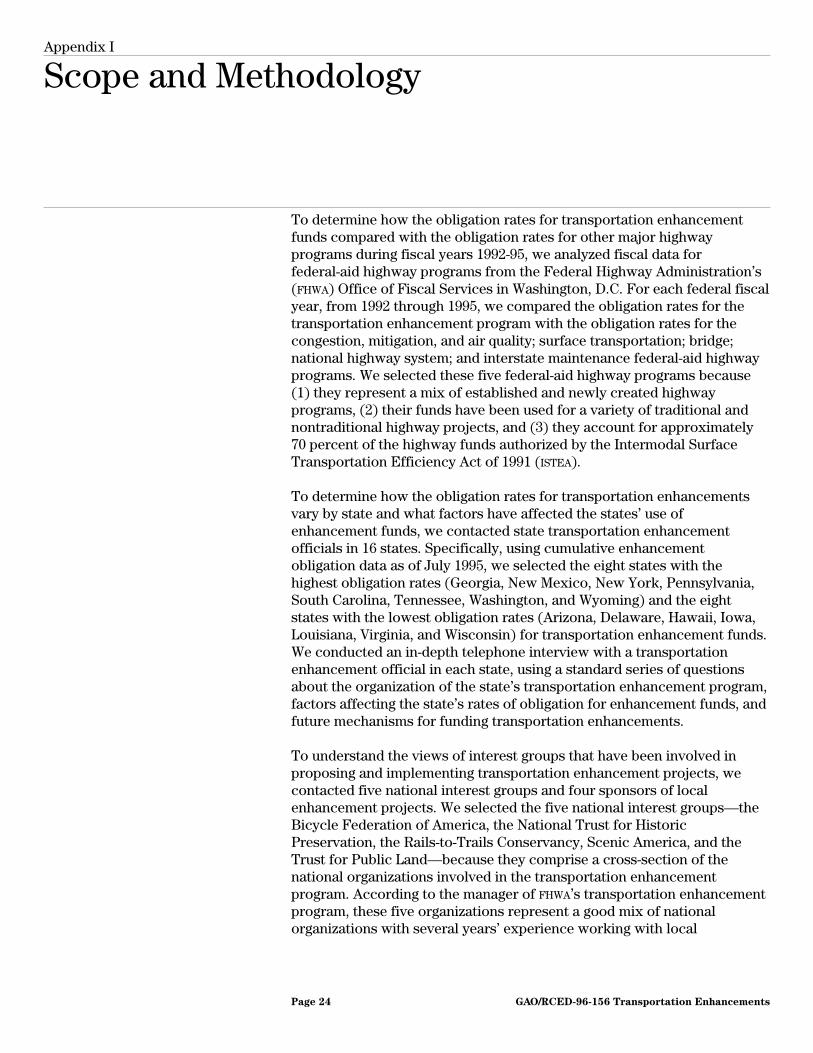
To determine how the obligation rates for transportation enhancementfunds compared with the obligation rates for other major highwayprograms during fiscal years 1992-95, we analyzed fiscal data forfederal-aid highway programs from the Federal Highway Administration’s(FHWA) Office of Fiscal Services in Washington, D.C. For each federal fiscalyear, from 1992 through 1995, we compared the obligation rates for thetransportation enhancement program with the obligation rates for thecongestion, mitigation, and air quality; surface transportation; bridge;national highway system; and interstate maintenance federal-aid highwayprograms. We selected these five federal-aid highway programs because(1) they represent a mix of established and newly created highwayprograms, (2) their funds have been used for a variety of traditional andnontraditional highway projects, and (3) they account for approximately70 percent of the highway funds authorized by the Intermodal SurfaceTransportation Efficiency Act of 1991 (ISTEA).
To determine how the obligation rates for transportation enhancementsvary by state and what factors have affected the states’ use ofenhancement funds, we contacted state transportation enhancementofficials in 16 states. Specifically, using cumulative enhancementobligation data as of July 1995, we selected the eight states with thehighest obligation rates (Georgia, New Mexico, New York, Pennsylvania,South Carolina, Tennessee, Washington, and Wyoming) and the eightstates with the lowest obligation rates (Arizona, Delaware, Hawaii, Iowa,Louisiana, Virginia, and Wisconsin) for transportation enhancement funds.We conducted an in-depth telephone interview with a transportationenhancement official in each state, using a standard series of questionsabout the organization of the state’s transportation enhancement program,factors affecting the state’s rates of obligation for enhancement funds, andfuture mechanisms for funding transportation enhancements.
To understand the views of interest groups that have been involved inproposing and implementing transportation enhancement projects, wecontacted five national interest groups and four sponsors of localenhancement projects. We selected the five national interest groups—theBicycle Federation of America, the National Trust for HistoricPreservation, the Rails-to-Trails Conservancy, Scenic America, and theTrust for Public Land—because they comprise a cross-section of thenational organizations involved in the transportation enhancementprogram. According to the manager of FHWA’s transportation enhancementprogram, these five organizations represent a good mix of nationalorganizations with several years’ experience working with local
GAO/RCED-96-156 Transportation EnhancementsPage 24

Appendix I
Scope and Methodology
organizations that have been implementing transportation enhancementprojects.
To understand the concerns of local sponsors, we contacted thecoordinators of transportation enhancement projects with localgovernments in Cheshire, Connecticut; Douglas, Georgia; Danville,Virginia; and Seattle, Washington. We selected these sponsors becausetheir locations were geographically diverse and each had experience witha project in one of the four most frequently funded transportationenhancement categories. We asked the representatives of the five nationalorganizations and the four local sponsors the same questions we asked thestate transportation enhancement program managers about the factorsaffecting obligation rates for enhancement funds and future fundingmechanisms for transportation enhancements.
We also reviewed several studies on transportation enhancements,including an August 1994 study of transportation enhancement programsin nine states conducted by FHWA’s Office of Program Review; theproceedings of a June 1994 National Transportation EnhancementsWorkshop attended by representatives of 328 federal, state, and localgovernments, as well as private organizations or companies with aninterest in transportation enhancements; several national studies on theimplementation of transportation enhancements by the Rails-to-TrailsConservancy, which included detailed state-by-state data on enhancementprojects, funding, and policies and procedures obtained throughcontacting each state’s transportation enhancement coordinator; and abook published jointly in 1995 by FHWA and the National Trust for HistoricPreservation, Building on the Past—Traveling to the Future: APreservationist’s Guide to the ISTEA Transportation EnhancementProvision.
In addition, we discussed FHWA’s policies, plans, and activities for thetransportation enhancement program with the official responsible foradministering the transportation enhancement program in FHWA’sEnvironmental Programs Branch, Environmental Operations Division,Office of Environment and Planning. We also discussed FHWA’s policiesand procedures for reporting fiscal data for transportation enhancementsand other major federal-aid highway programs with the Chief, InformationManagement and Systems Control Branch, Office of Fiscal Services, FHWA.
GAO/RCED-96-156 Transportation EnhancementsPage 25
Appendix II
Categories of Transportation EnhancementProjects
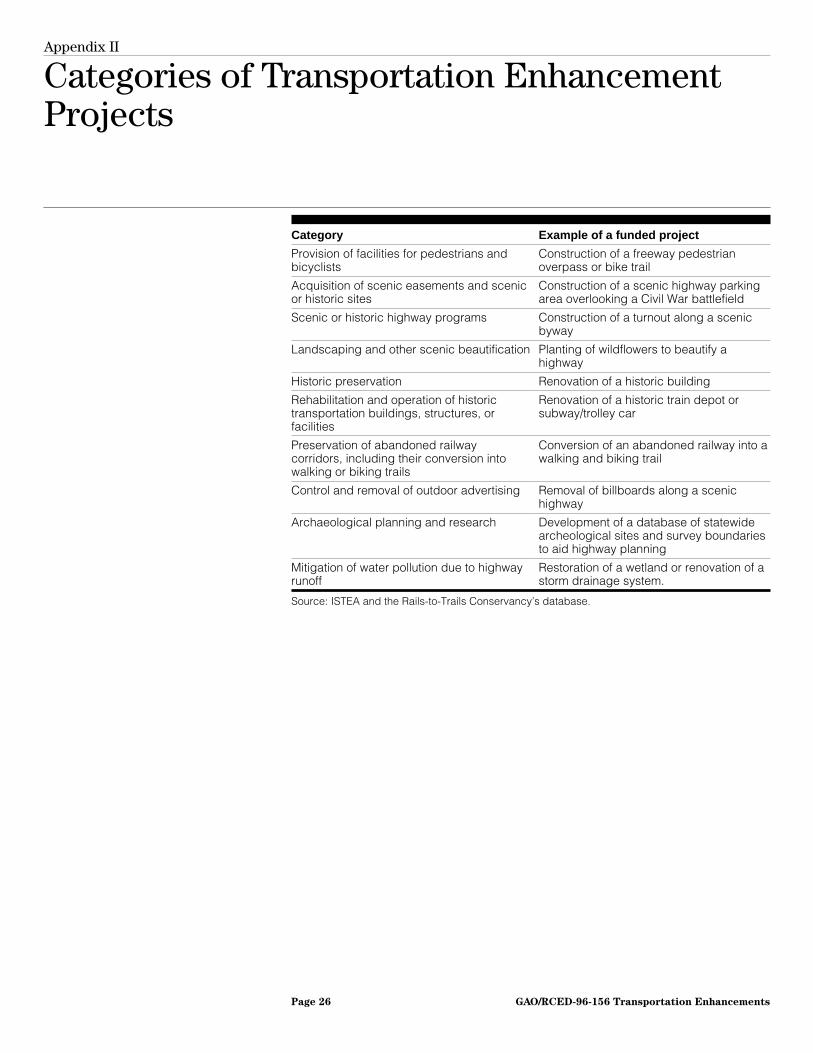
Category Example of a funded project
Provision of facilities for pedestrians andbicyclists
Construction of a freeway pedestrianoverpass or bike trail
Acquisition of scenic easements and scenicor historic sites
Construction of a scenic highway parkingarea overlooking a Civil War battlefield
Scenic or historic highway programs Construction of a turnout along a scenicbyway
Landscaping and other scenic beautification Planting of wildflowers to beautify ahighway
Historic preservation Renovation of a historic building
Rehabilitation and operation of historictransportation buildings, structures, orfacilities
Renovation of a historic train depot orsubway/trolley car
Preservation of abandoned railwaycorridors, including their conversion intowalking or biking trails
Conversion of an abandoned railway into awalking and biking trail
Control and removal of outdoor advertising Removal of billboards along a scenichighway
Archaeological planning and research Development of a database of statewidearcheological sites and survey boundariesto aid highway planning
Mitigation of water pollution due to highwayrunoff
Restoration of a wetland or renovation of astorm drainage system.
Source: ISTEA and the Rails-to-Trails Conservancy’s database.
GAO/RCED-96-156 Transportation EnhancementsPage 26

GAO/RCED-96-156 Transportation EnhancementsPage 27
Appendix III
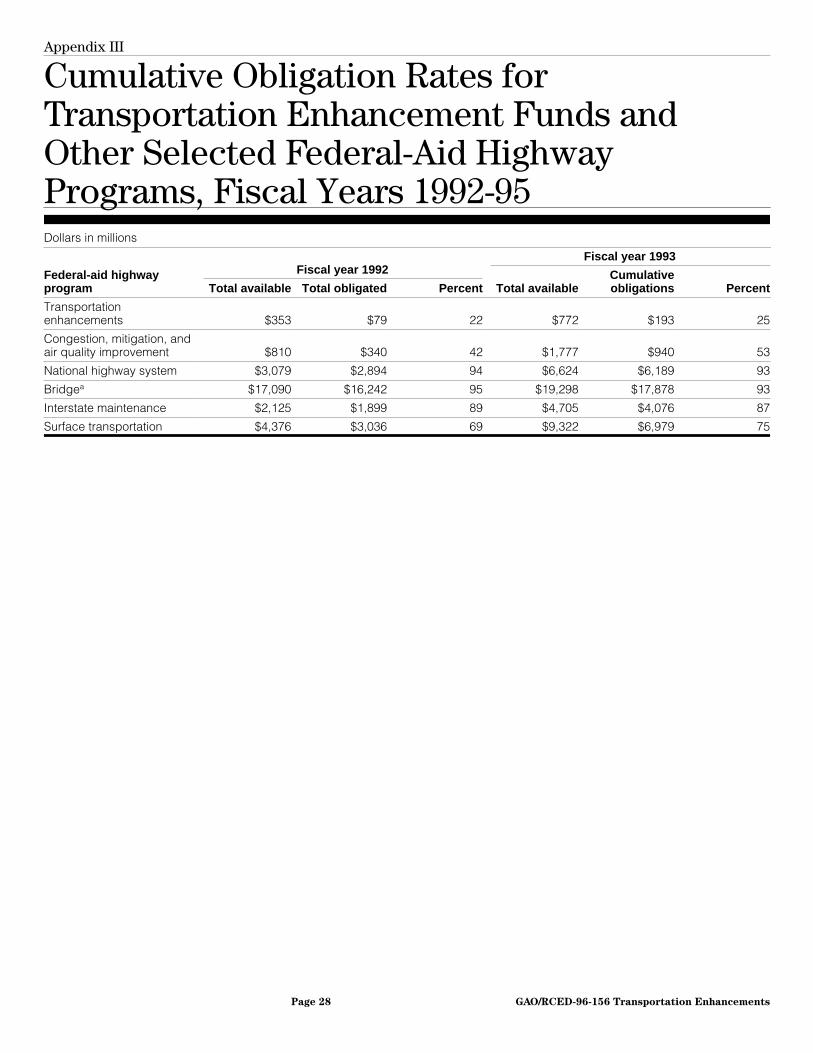
Cumulative Obligation Rates forTransportation Enhancement Funds andOther Selected Federal-Aid HighwayPrograms, Fiscal Years 1992-95
Fiscal year 1992Fiscal year 1993
Dollars in millions
Federal-aid highwayprogram Total available Total obligated Percent Total available
Cumulativeobligations Percent
Transportationenhancements $353 $79 22 $772 $193 25
Congestion, mitigation, andair quality improvement $810 $340 42 $1,777 $940 53
National highway system $3,079 $2,894 94 $6,624 $6,189 93
Bridgea $17,090 $16,242 95 $19,298 $17,878 93
Interstate maintenance $2,125 $1,899 89 $4,705 $4,076 87
Surface transportation $4,376 $3,036 69 $9,322 $6,979 75
GAO/RCED-96-156 Transportation EnhancementsPage 28
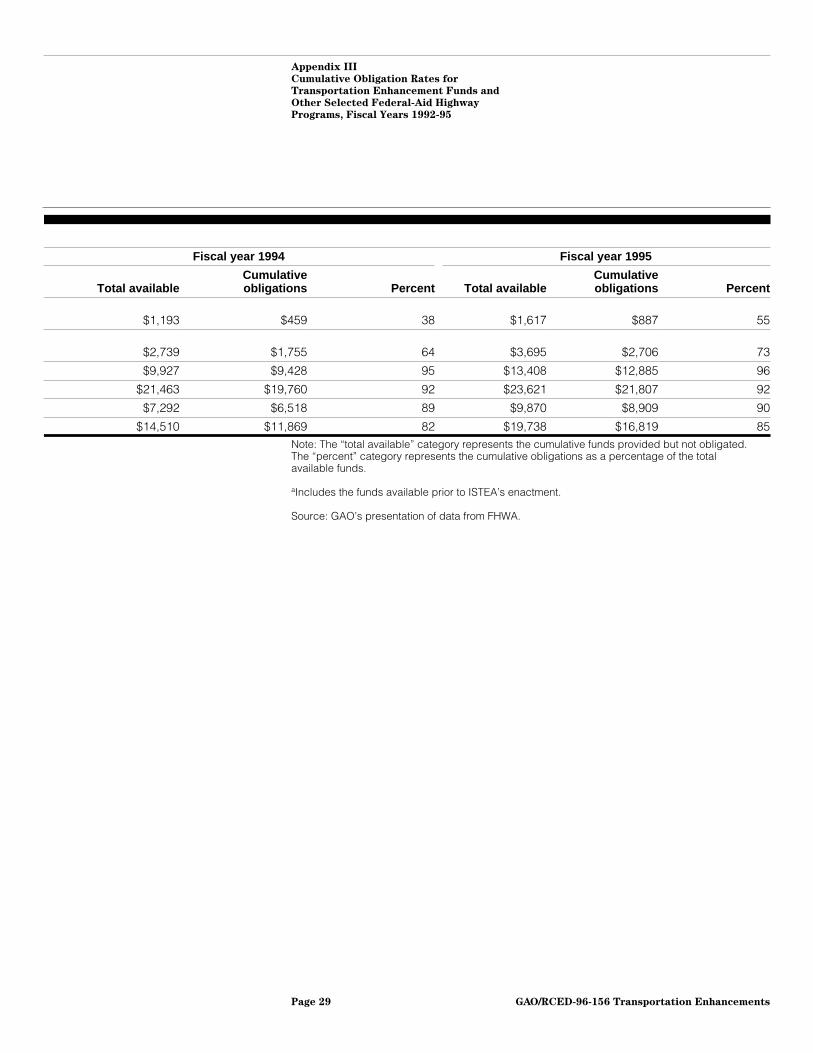
Appendix III
Cumulative Obligation Rates for
Transportation Enhancement Funds and
Other Selected Federal-Aid Highway
Programs, Fiscal Years 1992-95
Fiscal year 1994 Fiscal year 1995
t Total availableCumulativeobligations Percent Total available
Cumulativeobligations Percent
5 $1,193 $459 38 $1,617 $887 55
3 $2,739 $1,755 64 $3,695 $2,706 73
3 $9,927 $9,428 95 $13,408 $12,885 96
3 $21,463 $19,760 92 $23,621 $21,807 92
7 $7,292 $6,518 89 $9,870 $8,909 90
5 $14,510 $11,869 82 $19,738 $16,819 85Note: The “total available” category represents the cumulative funds provided but not obligated.The “percent” category represents the cumulative obligations as a percentage of the totalavailable funds.
aIncludes the funds available prior to ISTEA’s enactment.
Source: GAO’s presentation of data from FHWA.
GAO/RCED-96-156 Transportation EnhancementsPage 29
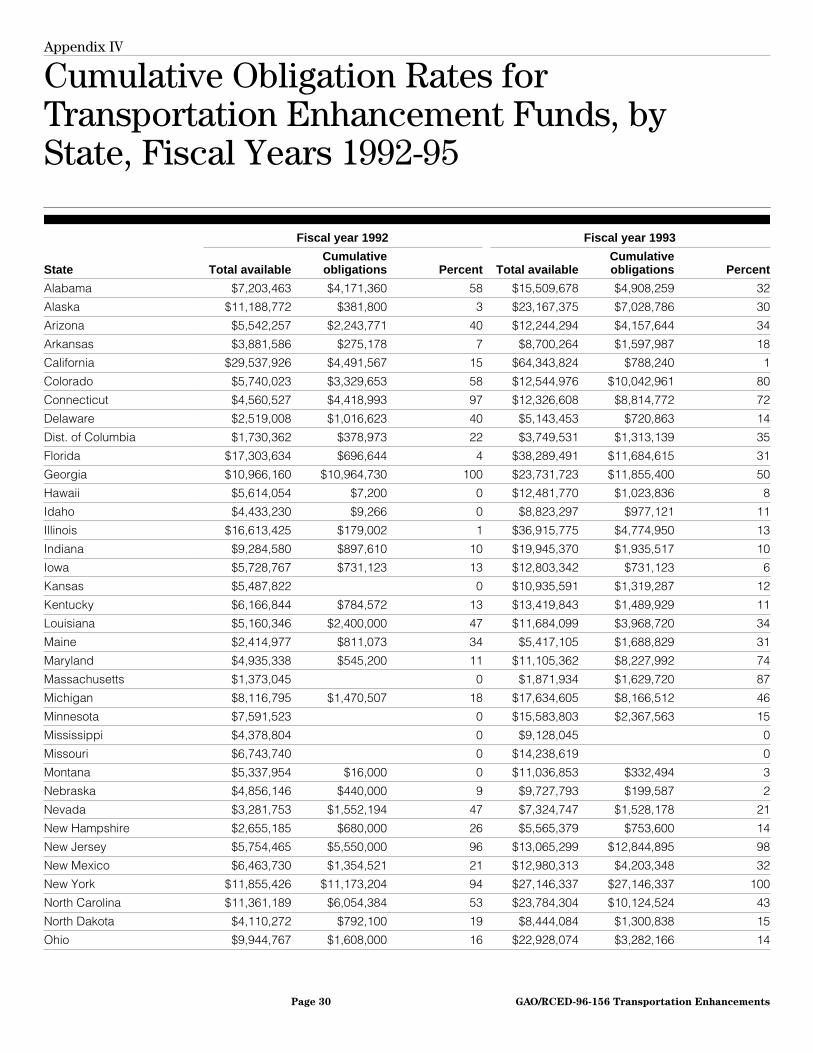
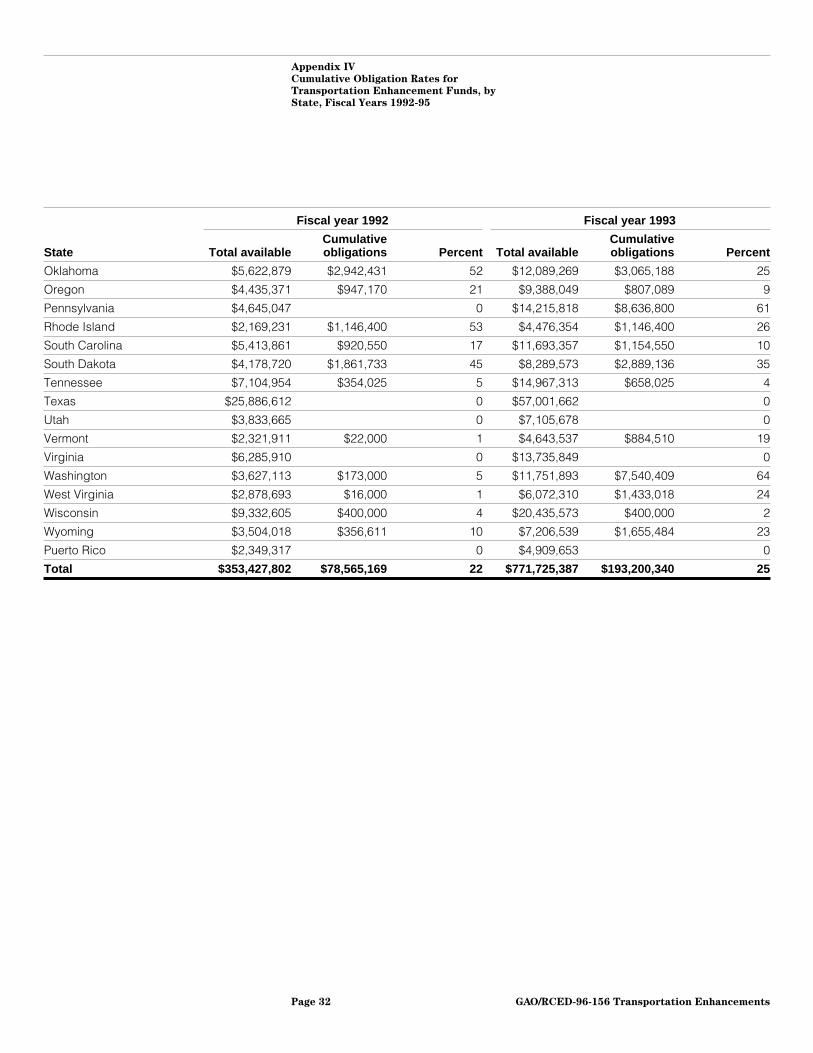
Appendix IV
Cumulative Obligation Rates forTransportation Enhancement Funds, byState, Fiscal Years 1992-95
Fiscal year 1992 Fiscal year 1993
State Total availableCumulativeobligations Percent Total available
Cumulativeobligations Percent
Alabama $7,203,463 $4,171,360 58 $15,509,678 $4,908,259 32
Alaska $11,188,772 $381,800 3 $23,167,375 $7,028,786 30
Arizona $5,542,257 $2,243,771 40 $12,244,294 $4,157,644 34
Arkansas $3,881,586 $275,178 7 $8,700,264 $1,597,987 18
California $29,537,926 $4,491,567 15 $64,343,824 $788,240 1
Colorado $5,740,023 $3,329,653 58 $12,544,976 $10,042,961 80
Connecticut $4,560,527 $4,418,993 97 $12,326,608 $8,814,772 72
Delaware $2,519,008 $1,016,623 40 $5,143,453 $720,863 14
Dist. of Columbia $1,730,362 $378,973 22 $3,749,531 $1,313,139 35
Florida $17,303,634 $696,644 4 $38,289,491 $11,684,615 31
Georgia $10,966,160 $10,964,730 100 $23,731,723 $11,855,400 50
Hawaii $5,614,054 $7,200 0 $12,481,770 $1,023,836 8
Idaho $4,433,230 $9,266 0 $8,823,297 $977,121 11
Illinois $16,613,425 $179,002 1 $36,915,775 $4,774,950 13
Indiana $9,284,580 $897,610 10 $19,945,370 $1,935,517 10
Iowa $5,728,767 $731,123 13 $12,803,342 $731,123 6
Kansas $5,487,822 0 $10,935,591 $1,319,287 12
Kentucky $6,166,844 $784,572 13 $13,419,843 $1,489,929 11
Louisiana $5,160,346 $2,400,000 47 $11,684,099 $3,968,720 34
Maine $2,414,977 $811,073 34 $5,417,105 $1,688,829 31
Maryland $4,935,338 $545,200 11 $11,105,362 $8,227,992 74
Massachusetts $1,373,045 0 $1,871,934 $1,629,720 87
Michigan $8,116,795 $1,470,507 18 $17,634,605 $8,166,512 46
Minnesota $7,591,523 0 $15,583,803 $2,367,563 15
Mississippi $4,378,804 0 $9,128,045 0
Missouri $6,743,740 0 $14,238,619 0
Montana $5,337,954 $16,000 0 $11,036,853 $332,494 3
Nebraska $4,856,146 $440,000 9 $9,727,793 $199,587 2
Nevada $3,281,753 $1,552,194 47 $7,324,747 $1,528,178 21
New Hampshire $2,655,185 $680,000 26 $5,565,379 $753,600 14
New Jersey $5,754,465 $5,550,000 96 $13,065,299 $12,844,895 98
New Mexico $6,463,730 $1,354,521 21 $12,980,313 $4,203,348 32
New York $11,855,426 $11,173,204 94 $27,146,337 $27,146,337 100
North Carolina $11,361,189 $6,054,384 53 $23,784,304 $10,124,524 43
North Dakota $4,110,272 $792,100 19 $8,444,084 $1,300,838 15
Ohio $9,944,767 $1,608,000 16 $22,928,074 $3,282,166 14
GAO/RCED-96-156 Transportation EnhancementsPage 30
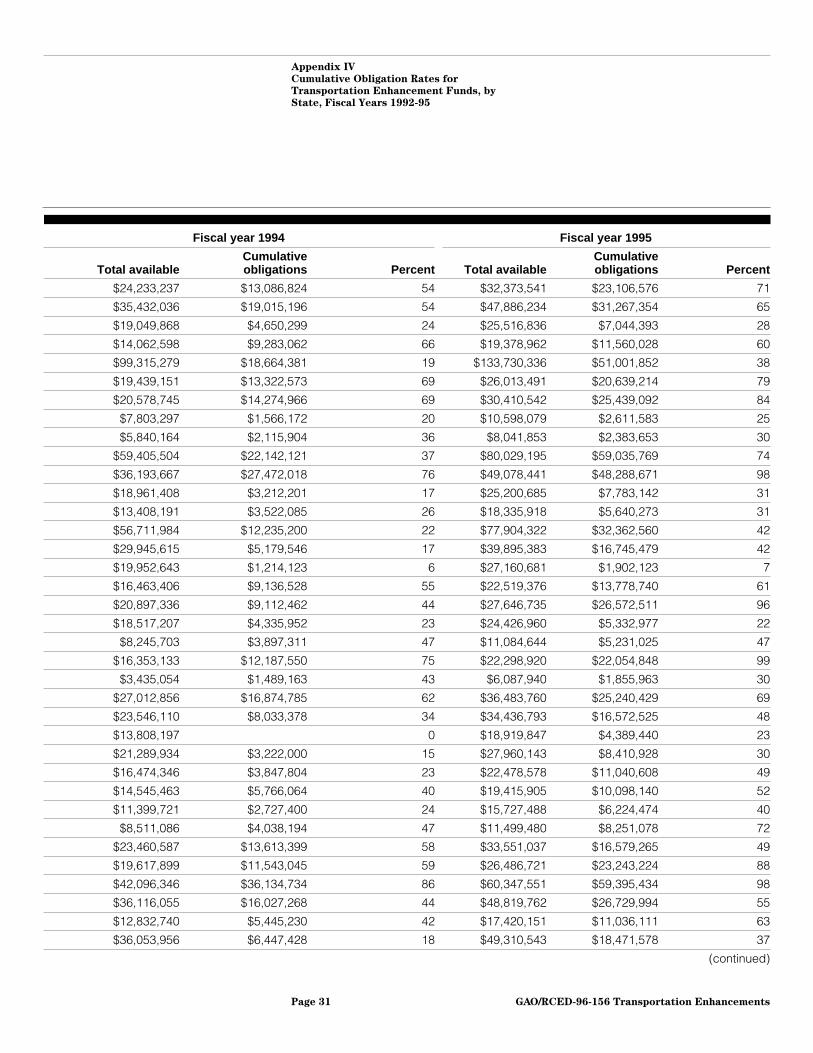
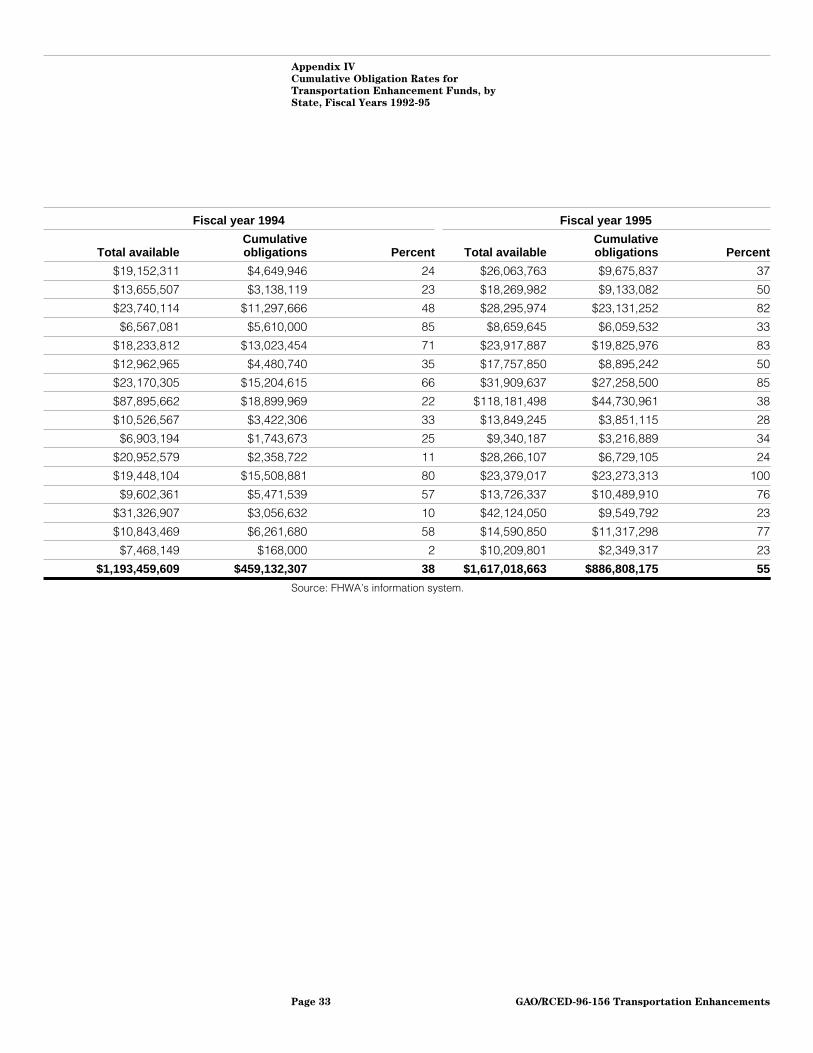
Appendix IV
Cumulative Obligation Rates for
Transportation Enhancement Funds, by
State, Fiscal Years 1992-95
Fiscal year 1994 Fiscal year 1995
t Total availableCumulativeobligations Percent Total available
Cumulativeobligations Percent
2 $24,233,237 $13,086,824 54 $32,373,541 $23,106,576 71
0 $35,432,036 $19,015,196 54 $47,886,234 $31,267,354 65
4 $19,049,868 $4,650,299 24 $25,516,836 $7,044,393 28
8 $14,062,598 $9,283,062 66 $19,378,962 $11,560,028 60
$99,315,279 $18,664,381 19 $133,730,336 $51,001,852 38
0 $19,439,151 $13,322,573 69 $26,013,491 $20,639,214 79
2 $20,578,745 $14,274,966 69 $30,410,542 $25,439,092 84
4 $7,803,297 $1,566,172 20 $10,598,079 $2,611,583 25
5 $5,840,164 $2,115,904 36 $8,041,853 $2,383,653 30
$59,405,504 $22,142,121 37 $80,029,195 $59,035,769 74
0 $36,193,667 $27,472,018 76 $49,078,441 $48,288,671 98
8 $18,961,408 $3,212,201 17 $25,200,685 $7,783,142 31
$13,408,191 $3,522,085 26 $18,335,918 $5,640,273 31
3 $56,711,984 $12,235,200 22 $77,904,322 $32,362,560 42
0 $29,945,615 $5,179,546 17 $39,895,383 $16,745,479 42
6 $19,952,643 $1,214,123 6 $27,160,681 $1,902,123 7
2 $16,463,406 $9,136,528 55 $22,519,376 $13,778,740 61
$20,897,336 $9,112,462 44 $27,646,735 $26,572,511 96
4 $18,517,207 $4,335,952 23 $24,426,960 $5,332,977 22
$8,245,703 $3,897,311 47 $11,084,644 $5,231,025 47
4 $16,353,133 $12,187,550 75 $22,298,920 $22,054,848 99
7 $3,435,054 $1,489,163 43 $6,087,940 $1,855,963 30
6 $27,012,856 $16,874,785 62 $36,483,760 $25,240,429 69
5 $23,546,110 $8,033,378 34 $34,436,793 $16,572,525 48
0 $13,808,197 0 $18,919,847 $4,389,440 23
0 $21,289,934 $3,222,000 15 $27,960,143 $8,410,928 30
3 $16,474,346 $3,847,804 23 $22,478,578 $11,040,608 49
2 $14,545,463 $5,766,064 40 $19,415,905 $10,098,140 52
$11,399,721 $2,727,400 24 $15,727,488 $6,224,474 40
4 $8,511,086 $4,038,194 47 $11,499,480 $8,251,078 72
8 $23,460,587 $13,613,399 58 $33,551,037 $16,579,265 49
2 $19,617,899 $11,543,045 59 $26,486,721 $23,243,224 88
0 $42,096,346 $36,134,734 86 $60,347,551 $59,395,434 98
3 $36,116,055 $16,027,268 44 $48,819,762 $26,729,994 55
5 $12,832,740 $5,445,230 42 $17,420,151 $11,036,111 63
4 $36,053,956 $6,447,428 18 $49,310,543 $18,471,578 37
(continued)
GAO/RCED-96-156 Transportation EnhancementsPage 31
Appendix IV
Cumulative Obligation Rates for
Transportation Enhancement Funds, by
State, Fiscal Years 1992-95
Fiscal year 1992 Fiscal year 1993
State Total availableCumulativeobligations Percent Total available
Cumulativeobligations Percent
Oklahoma $5,622,879 $2,942,431 52 $12,089,269 $3,065,188 25
Oregon $4,435,371 $947,170 21 $9,388,049 $807,089 9
Pennsylvania $4,645,047 0 $14,215,818 $8,636,800 61
Rhode Island $2,169,231 $1,146,400 53 $4,476,354 $1,146,400 26
South Carolina $5,413,861 $920,550 17 $11,693,357 $1,154,550 10
South Dakota $4,178,720 $1,861,733 45 $8,289,573 $2,889,136 35
Tennessee $7,104,954 $354,025 5 $14,967,313 $658,025 4
Texas $25,886,612 0 $57,001,662 0
Utah $3,833,665 0 $7,105,678 0
Vermont $2,321,911 $22,000 1 $4,643,537 $884,510 19
Virginia $6,285,910 0 $13,735,849 0
Washington $3,627,113 $173,000 5 $11,751,893 $7,540,409 64
West Virginia $2,878,693 $16,000 1 $6,072,310 $1,433,018 24
Wisconsin $9,332,605 $400,000 4 $20,435,573 $400,000 2
Wyoming $3,504,018 $356,611 10 $7,206,539 $1,655,484 23
Puerto Rico $2,349,317 0 $4,909,653 0
Total $353,427,802 $78,565,169 22 $771,725,387 $193,200,340 25
GAO/RCED-96-156 Transportation EnhancementsPage 32
Appendix IV
Cumulative Obligation Rates for
Transportation Enhancement Funds, by
State, Fiscal Years 1992-95
Fiscal year 1994 Fiscal year 1995
t Total availableCumulativeobligations Percent Total available
Cumulativeobligations Percent
5 $19,152,311 $4,649,946 24 $26,063,763 $9,675,837 37
9 $13,655,507 $3,138,119 23 $18,269,982 $9,133,082 50
$23,740,114 $11,297,666 48 $28,295,974 $23,131,252 82
6 $6,567,081 $5,610,000 85 $8,659,645 $6,059,532 33
0 $18,233,812 $13,023,454 71 $23,917,887 $19,825,976 83
5 $12,962,965 $4,480,740 35 $17,757,850 $8,895,242 50
4 $23,170,305 $15,204,615 66 $31,909,637 $27,258,500 85
0 $87,895,662 $18,899,969 22 $118,181,498 $44,730,961 38
0 $10,526,567 $3,422,306 33 $13,849,245 $3,851,115 28
9 $6,903,194 $1,743,673 25 $9,340,187 $3,216,889 34
0 $20,952,579 $2,358,722 11 $28,266,107 $6,729,105 24
4 $19,448,104 $15,508,881 80 $23,379,017 $23,273,313 100
4 $9,602,361 $5,471,539 57 $13,726,337 $10,489,910 76
2 $31,326,907 $3,056,632 10 $42,124,050 $9,549,792 23
3 $10,843,469 $6,261,680 58 $14,590,850 $11,317,298 77
0 $7,468,149 $168,000 2 $10,209,801 $2,349,317 23
5 $1,193,459,609 $459,132,307 38 $1,617,018,663 $886,808,175 55
Source: FHWA’s information system.
GAO/RCED-96-156 Transportation EnhancementsPage 33
Appendix V
Factors That Slowed the Use ofEnhancement Funds
We asked the 16 state transportation department officials and the fiveinterest group and four sponsoring organization representatives weinterviewed what difficulties they encountered in obligating transportationenhancement funds. They mentioned four major factors: (1) local sponsorswere unfamiliar with federal-aid highway administrative procedures,(2) programs mandated by ISTEA took time to develop, (3) administering alarge number of low-cost projects was perceived as burdensome, and(4) state transportation departments lacked the staff or expertise toadminister nontraditional transportation projects. The following sectionsdiscuss these factors in more detail.
Local Sponsors WereUnfamiliar WithFederal-Aid HighwayAdministrativeProcedures
The factor mentioned most frequently,1 and the one cited as the greatesthindrance to obligation,2 was the lack of familiarity on the part of localsponsors, mainly local governments, with the administrative proceduresrequired for transportation enhancement projects. Although manyenhancement projects are smaller and less costly than traditional highwayprojects, the same administrative rules and requirements apply to a$10,000 enhancement project as to a multimillion-dollar highway project.Such administrative or regulatory requirements include compliance withthe National Environmental Policy Act, the National Historic PreservationAct, and federal regulations for property acquisition, competitive bidding,and FHWA’s oversight of project approvals. Also, the timing of paymentswas confusing to some local sponsors, since the federal-aid highwayprogram operates on a reimbursement basis. This meant that sponsors hadto be prepared to pay most, if not all, of their projects’ costs up front andthen receive reimbursement from the federal government. FHWA’s reviewshave also identified these requirements as hindering the obligation oftransportation enhancement funds.
Some of these concerns were addressed in the National Highway SystemDesignation Act of 1995. This legislation allows for relaxing orstreamlining the environmental and historic preservation reportingrequirements for transportation enhancement projects. The legislation alsogives sponsors the option of receiving an advance payment for atransportation enhancement project based on the project’s schedule ofcash needs. In addition, FHWA is developing additional guidance on the
1Fifteen of the 16 states, all five interest groups, and three of the four project sponsors said that thisfactor hindered the states’ obligation of enhancement funds.
2Nine of the 16 states, two of the five interest groups, and all four of the project sponsors said that thisfactor hindered the states’ obligation of enhancement funds to a great or very great extent.
GAO/RCED-96-156 Transportation EnhancementsPage 34
Appendix V
Factors That Slowed the Use of
Enhancement Funds
regulatory requirements associated with enhancement funding for stateand local sponsors.
Washington, the state with the highest percentage of enhancement fundsalready obligated, was little affected by the concerns that hampered otherstates in their use of these funds. The state has a history of passingfederal-aid highway funds directly through to metropolitan planningorganizations and local governments. Hence, the local sponsors were veryfamiliar with the regulatory requirements involved in administeringenhancement projects, according to a Washington official. In Iowa,however, where the lowest percentage of enhancement funds has beenobligated, the local sponsors did not initially understand the complexitiesof the program. As a result, they needed more time to get their projects upand running, according to the state’s enhancement program manager.
ISTEA-MandatedPrograms Took Timeto Develop
Most of those interviewed3 said the amount of time required to implementthe new programs mandated by ISTEA, such as the transportationenhancement program, hindered the states’ obligation of enhancementfunds. While this factor hindered the states with low and high obligationrates more or less equally, the states with higher obligation rates tended toimplement their programs faster than the states with lower obligationrates. The eight high-obligation states had, on average, fully implementedtheir enhancement programs in 13 months, compared with an average of18 months for the low-obligation states.4 For example, Washington State’sprogram was established in 9 months, according to the state’senhancement program manager. In contrast, Iowa took 2 years toimplement its program because, according to the state’s enhancementprogram manager, considerable time was spent seeking public input onhow the program should be structured, among other factors.
3Eleven of the 16 states, three of the five interest groups, and all four project sponsors said that thisfactor hindered the states’ obligation of enhancement funds.
4This figure does not include Hawaii, one of the eight low-obligation states, which had not fullyimplemented its enhancement program as of September 1995.
GAO/RCED-96-156 Transportation EnhancementsPage 35
Appendix V
Factors That Slowed the Use of
Enhancement Funds
Administering a LargeNumber of Low-CostProjects WasBurdensome
Most of the persons5 we interviewed said the length of time required toadminister so many enhancement projects was a hindrance in obligatingfunds. The states fund a large number of enhancement projects that arerelatively small in scope compared with more traditional highway projects.According to FHWA’s data for fiscal years 1992-95, 2,300 (or about61 percent) of the 3,786 projects that used funds from the enhancementset-aside were projects costing less than $50,000. While traditionalhighway projects also include a relatively large number of projects costingless than $50,000, the percentage is somewhat lower than for theenhancement set-aside. For instance, during the same period of time, 3,282(or 43 percent) of the 7,632 more traditional highway projects thatreceived National Highway System funds cost less than $50,000.Respondents said the nature of transportation enhancement projectscreated a burden on state transportation departments, which were notused to administering, or lacked sufficient staff to effectively administer, alarge number of low-cost enhancement projects. Unlike large highwayprojects, small enhancement projects have a small financial base forsupporting the necessary administrative overhead.
State TransportationDepartments LackedStaff or Expertise toAdministerNontraditionalProjects
Most of those6 we interviewed said the nontraditional nature ofenhancement projects hindered the states’ obligation of funds. Becausemany enhancement projects differed significantly in scope and type fromtraditional highway construction projects, several of the 16 state officialswe contacted said their transportation departments lacked sufficient staff,or staff with the necessary technical expertise, to review or approvecertain types of enhancement projects, especially those involving historicpreservation or building renovation. State enhancement programmanagers in Georgia and Wisconsin said, for example, that theirtransportation departments had to bring in specialists from outside thedepartment to review historic preservation projects because they did nothave this ability in-house. When local enhancement projects came on line,the Delaware transportation department had to hire a consultant to helpits staff get up to speed on FHWA’s administrative requirements because itlacked in-house staff to manage the program.
5Eleven of the 16 states, four of the five interest groups, and all four project sponsors said that thisfactor hindered the states’ obligation of enhancement funds.
6Ten of the 16 states, four of the five interest groups, and two of the four project sponsors said that thisfactor hindered the states’ obligation of enhancement funds.
GAO/RCED-96-156 Transportation EnhancementsPage 36
Appendix VI
Examples of Transportation EnhancementProjects
As we previously noted, most of the funds for transportation enhancementprojects have been obligated in 4 of the 10 project categories: facilities forpedestrians and bicyclists, rail-to-trail conversions, rehabilitation ofhistoric transportation buildings or facilities, and landscaping. Thisappendix provides examples of transportation enhancement projects inthese four commonly funded categories.
Facilities forPedestrians andBicyclists
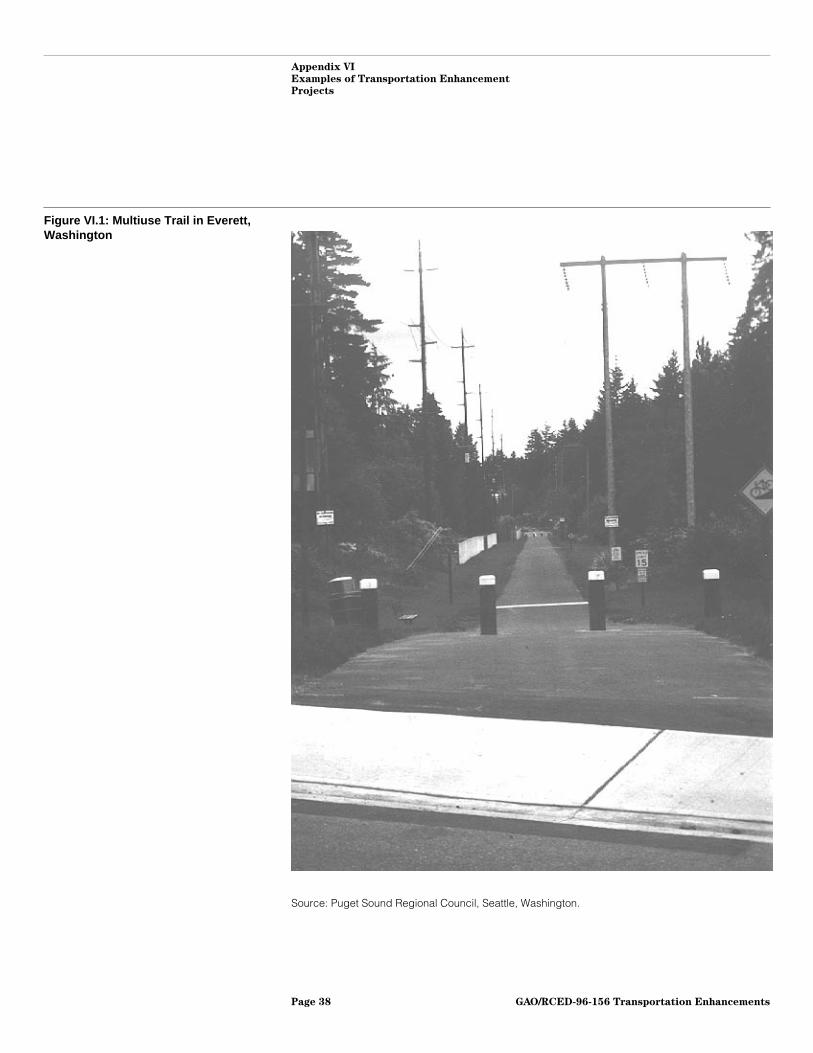
• In Everett, Washington, $1.6 million in federal enhancement funds wasused to build a 9-mile multiuse trail that connects two park-and-ride lots tomass transit service. This trail is expected to alleviate increasing vehicularcongestion by providing an alternative, contiguous connection betweenretail and employment centers and a number of parks and other trails inthe area north of Seattle. The trail, as shown in figure VI.1, is part of theInterurban Trail Project, a multijurisdictional effort to design andconstruct missing pieces of a regional trail system that, when completed,will span an 18-mile stretch that runs largely within the historic InterurbanRailroad right-of-way, for which the trail is named.
GAO/RCED-96-156 Transportation EnhancementsPage 37
Appendix VI
Examples of Transportation Enhancement
Projects
Figure VI.1: Multiuse Trail in Everett,Washington
Source: Puget Sound Regional Council, Seattle, Washington.
GAO/RCED-96-156 Transportation EnhancementsPage 38

Appendix VI
Examples of Transportation Enhancement
Projects
• Another project, shown in figure VI.2, involved the installation of bicycleracks in neighborhood business districts in Tacoma, Washington.Washington State used $7,000 in enhancement funds on this project infiscal years 1992-93. The bicycle racks are the first phase of a project torevitalize neighborhood business districts through streetscape projectsthat also include the installation of benches, trash receptacles, and otheramenities for pedestrians.
Figure VI.2: Bicycle Racks Installed inTacoma, Washington
Source: Puget Sound Regional Council, Seattle, Washington.
Rail-To-TrailConversions
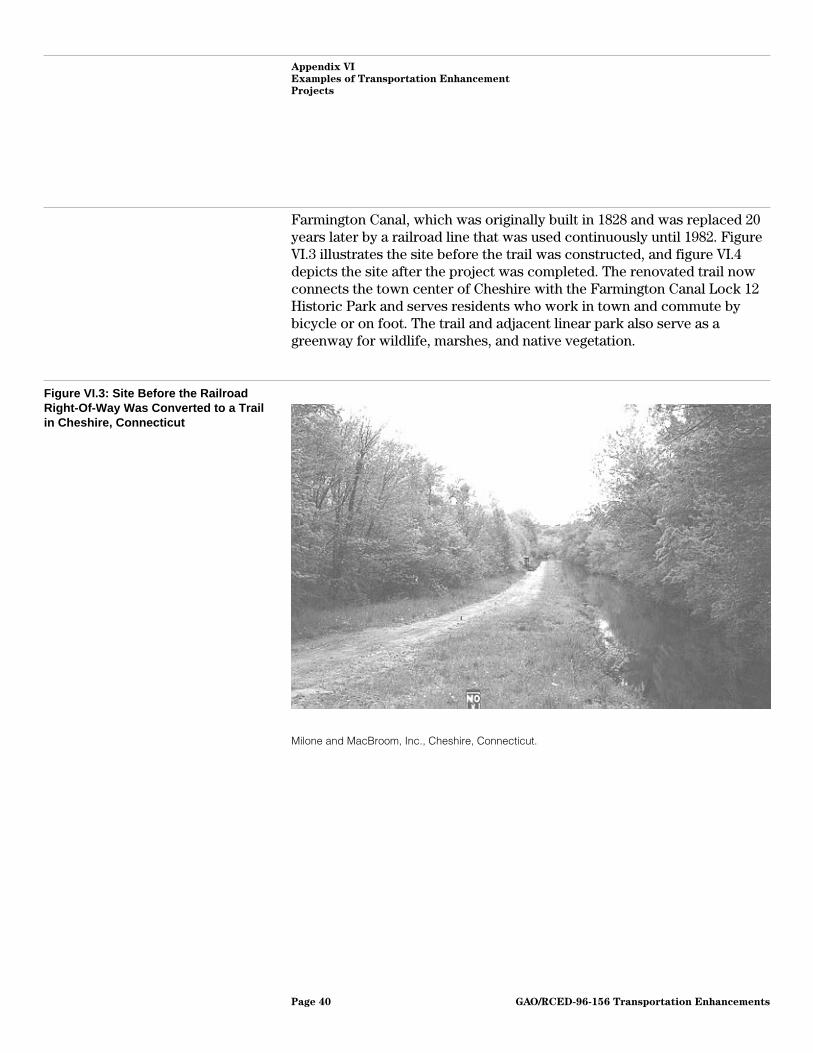
• In Cheshire, Connecticut, $900,000 in federal enhancement funds was usedto convert the abandoned Farmington Canal and Boston and MainRailroad right-of-way into a recreational and open space corridor. Thisproject included the construction of a 3.3-mile path for bicyclists andpedestrians with stone edging, split-rail fences, benches, and otherlandscaping amenities. The converted trail parallels the historic
GAO/RCED-96-156 Transportation EnhancementsPage 39
Appendix VI
Examples of Transportation Enhancement
Projects
Farmington Canal, which was originally built in 1828 and was replaced 20years later by a railroad line that was used continuously until 1982. FigureVI.3 illustrates the site before the trail was constructed, and figure VI.4depicts the site after the project was completed. The renovated trail nowconnects the town center of Cheshire with the Farmington Canal Lock 12Historic Park and serves residents who work in town and commute bybicycle or on foot. The trail and adjacent linear park also serve as agreenway for wildlife, marshes, and native vegetation.
Figure VI.3: Site Before the RailroadRight-Of-Way Was Converted to a Trailin Cheshire, Connecticut
Milone and MacBroom, Inc., Cheshire, Connecticut.
GAO/RCED-96-156 Transportation EnhancementsPage 40
Appendix VI
Examples of Transportation Enhancement
Projects
Figure VI.4: Site After the RailroadRight-Of-Way Was Converted to a Trailin Cheshire, Connecticut
Source: Milone and MacBroom, Inc., Cheshire, Connecticut.
Rehabilitation ofHistoricTransportationBuildings or Facilities
• In Greensburg, Pennsylvania, $1.4 million in federal enhancement fundswas used to rehabilitate the Greensburg train station, originally built in1911 and now listed on the National Register of Historic Places. Theproject’s activities included the rehabilitation of the station’s exterior andinterior and the construction of a glassed-in concourse connecting themain station and the baggage-handling area. Approximately 13,000passengers pass through the station each year; however, Amtrak expectsthe ridership to triple after the station is renovated. The project’s total costis $2.6 million. Large contributions from state and local sources, as well asfrom private corporations, supplemented the federal funding.
Landscaping • In Douglas, Georgia, $800,000 in federal enhancement funds was used toimprove the streetscapes in the Douglas Downtown Historic District,which covers three blocks and six intersections. Enhancement activitiesincluded landscaping and installing street furniture and lighting thatcomplemented the district’s historic character. Also included were thedevelopment of urban spaces, or “pedestrian courts,” on the corners ofeach block and at midblock locations. The project’s total costs were just
GAO/RCED-96-156 Transportation EnhancementsPage 41
Appendix VI
Examples of Transportation Enhancement
Projects
over $1 million. The Downtown Development Authority contributed alocal match of about $217,300 to the federal funding.
EnhancementProjects That IncludeElements FromSeveral Categories
Many enhancement projects include elements from more than 1 of the 10eligible categories. For example, the Stone Arch Bridge in Minneapolis,Minnesota, a 2,100-foot-long historic rail bridge across the MississippiRiver, was rehabilitated and opened for use by a short-line trolley,bicyclists, and pedestrians. It also improved local residents’ and tourists’access to the nearby St. Anthony Falls area. The funding for this$2.8 million project came from several categories, including those forbikeways and pedestrian facilities, historic preservation, the rehabilitationof historic transportation facilities, and rail-to-trail conversions.
Similarly, the renovation of the 94-year-old Danville, Virginia, railpassenger station includes enhancements from several funding categories.Connections to the site for pedestrians and bicyclists have been improved,and local businesses have raised funds to create a Science Center at thestation, a satellite facility for the Science Museum of Virginia. A secondphase of the enhancement project will convert a nearby freight depot intoa farmers’ market and festival area. Funding for this $2.6 million project,shown in figure VI.5, came from the categories for bikeways andpedestrian facilities, scenic easements, historic preservation, and therehabilitation of historic transportation facilities. According to theRails-to-Trails Conservancy, up to 20 percent of all enhancement projectsobtain funding through more than one category.
GAO/RCED-96-156 Transportation EnhancementsPage 42
Appendix VI
Examples of Transportation Enhancement
Projects
Figure VI.5: Renovation of Danville,Virginia, Rail Passenger Station
Source: Department of Community Development, Danville, Virginia.
GAO/RCED-96-156 Transportation EnhancementsPage 43

Appendix VII
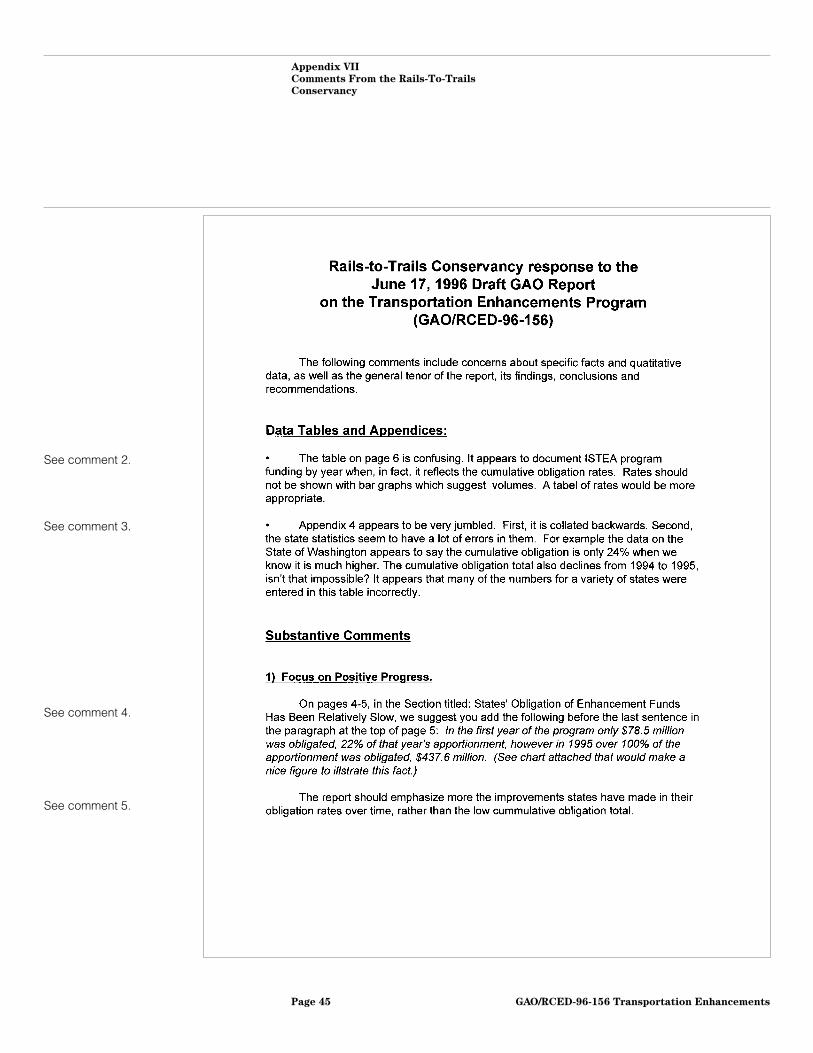
Comments From the Rails-To-TrailsConservancy
Note: GAO commentssupplementing those in thereport text appear at theend of this appendix.References to specificindividuals have beendeleted.
See comment 1.
GAO/RCED-96-156 Transportation EnhancementsPage 44
Appendix VII
Comments From the Rails-To-Trails
Conservancy
See comment 2.
See comment 3.
See comment 4.
See comment 5.
GAO/RCED-96-156 Transportation EnhancementsPage 45
Appendix VII
Comments From the Rails-To-Trails
Conservancy
See comment 6.
See comment 7.
GAO/RCED-96-156 Transportation EnhancementsPage 46
Appendix VII
Comments From the Rails-To-Trails
Conservancy
See comment 7.
See comment 8.
GAO/RCED-96-156 Transportation EnhancementsPage 47
Appendix VII
Comments From the Rails-To-Trails
Conservancy
See comment 9.
See comment 10.
GAO/RCED-96-156 Transportation EnhancementsPage 48
Appendix VII
Comments From the Rails-To-Trails
Conservancy
See comment 11.
See comment 12.
See comment 13.
GAO/RCED-96-156 Transportation EnhancementsPage 49
Appendix VII
Comments From the Rails-To-Trails
Conservancy
See comment 14.
GAO/RCED-96-156 Transportation EnhancementsPage 50
Appendix VII
Comments From the Rails-To-Trails
Conservancy
GAO/RCED-96-156 Transportation EnhancementsPage 51
Appendix VII
Comments From the Rails-To-Trails
Conservancy
GAO/RCED-96-156 Transportation EnhancementsPage 52

Appendix VII
Comments From the Rails-To-Trails
Conservancy
The following are GAO’s comments on the Rails-to-Trails Conservancy’sletter dated July 2, 1996.
GAO Comments 1. According to the Rails-to-Trails Conservancy, some of the examples andconclusions in our draft report are inaccurate or inconclusive. In its moredetailed comments, the Conservancy suggests that we broaden our effortto address other enhancement issues and concerns. The examples arebased on findings from our audit work. The conclusions are drawn fromour principal findings and cannot be broadened beyond the scope of ourwork.
2. Figure 1 illustrates the statement, made on the previous page, that bythe end of fiscal year 1995, the states had obligated $887 million, or 55percent, of the $1.6 billion available since the enhancement program’sinception. While this statement refers to the cumulative nature ofenhancement obligations, we have further clarified the content of thegraph by indicating in the figure title that the obligations representcumulative rates. Since the numbers reflected in a bar graph or presentedin a table would be the same, we continue to display the cumulative datain a bar graph. However, we also refer to the annual data depicted in theRails-to-Trails Conservancy’s graph in appendix VII.
3. A typographical error, causing the misalignment of data for some statesin appendix IV, has been corrected.
4. Because the funds obligated in fiscal year 1995 include fundsapportioned in earlier years, we continue to present information oncumulative obligations. Furthermore, the cumulative obligation rates fortransportation enhancement funds shown in figure 1 of our report exhibitthe same relative increase over time as the annual information displayed inthe alternative chart. However, we refer in our final report to the annualinformation presented in the chart suggested by the Rails-to-TrailsConservancy (see comment 2).
5. Our report does recognize the improvement that states have made intheir obligation rates over time. As both our draft and final reportsobserve, by the end of fiscal year 1995, after 4 fiscal years, the states hadmore than doubled the percentage of funds obligated for transportationenhancements. To further emphasize this progress, we have added thestatement in our final report that the fiscal year 1995 obligation raterepresents a significant improvement over earlier obligation rates.
GAO/RCED-96-156 Transportation EnhancementsPage 53
Appendix VII
Comments From the Rails-To-Trails
Conservancy
Nevertheless, the obligation rate for transportation enhancement fundsremains relatively low compared with the obligation rates for otherhighway programs. This fact was recognized by the Rails-to-TrailsConservancy in its June 1, 1996, report entitled Enhancing America’sCommunities. According to this report, “compared to other programswithin ISTEA, the [transportation enhancement] obligation rate remains oneof the lowest.”
6. The examples are presented to show that the eligibility criteria forfunding some enhancement projects—especially historic preservationprojects—have been variously interpreted. In 1994, FHWA arrived at thesame finding after reviewing enhancement programs in nine states.However, we have modified our report to include the Rails-to-TrailsConservancy’s estimate that eligibility problems extended to only a smallfraction of the historic preservation projects.
7. The background section of our report recognizes that each state’sdepartment of transportation is responsible for administering the state’stransportation enhancement program. Nonetheless, FHWA remainsresponsible for overseeing the states’ uses of transportation enhancementfunds.
8. We have added to our final report a fifth factor that the Rails-to-TrailsConservancy noted could hamper the obligation of enhancement funds—alimit on the total amount that a state can obligate in a given year.
9. Our intent was not to determine why FHWA did not initially collecttransportation enhancement project information. However, our finalreport does recognize that while FHWA did not initially track information onobligations for specific projects, it did ask the states to estimate theamounts they obligated to each of the 10 transportation enhancementcategories beginning in fiscal year 1992. FHWA later recognized that thisinformation was of limited use because of incomplete and possiblyinaccurate reporting. Therefore, in fiscal year 1995, FHWA began to collectdata on obligations for individual enhancement projects. As our reportexplains, this information has also proved problematic: According to thedata, over 50 percent of the enhancement funds have apparently been usedfor ineligible activities. As our report further points out, FHWA’s assessmentof a sample of projects in four states has shown that these projects weregenerally eligible; however, they were incorrectly coded and thereforeappeared ineligible in FHWA’s database.
GAO/RCED-96-156 Transportation EnhancementsPage 54
Appendix VII
Comments From the Rails-To-Trails
Conservancy
It was not within the scope of our review to address the transportationenhancement data collected and disseminated by states to citizens.
10. Our report notes that one of the factors that slowed the rate ofobligation for transportation enhancement funds was the lack offamiliarity on the part of local sponsors, mainly local governments, withthe administrative procedures required for transportation enhancementprojects. Our report further notes that some of the concerns we identifiedwere addressed in the National Highway System Designation Act of 1995.Whether the states are taking advantage of the opportunities forstreamlining afforded by this act’s provisions is an open question, but themuch-improved obligation rate for transportation enhancement fundssuggests that progress is being made.
11. We have updated our data on the types of enhancement projectsfunded from fiscal years 1992-95 to include data through February 1996.
12. Our objectives did not include evaluating the impact of enhancementprojects; therefore, we did not address this issue in the report.
13. The conclusions in our report are based on the findings we developedin response to our objectives; they cannot be broadened beyond theirfactual base.
14. Similarly, our recommendation is limited to the scope of our work.Furthermore, neither our draft report nor our final report advocates a “onesize fits all approach.” Instead, our report recognizes that FHWA has revisedits guidance for historic preservation projects but has not clearly definedthe key phase “substantial transportation linkage.” We are thereforesuggesting that FHWA monitor its field offices’ implementation of therevised guidance and provide further clarification if needed.
GAO/RCED-96-156 Transportation EnhancementsPage 55
Appendix VIII
Major Contributors to This Report
Resources,Community, andEconomicDevelopmentDivision, Washington,D.C.
Phyllis F. ScheinbergGary L. JonesYvonne Pufahl
Seattle Field Office Brian A. EstesStanley G. StenersenAdrian Gonzales
(342915) GAO/RCED-96-156 Transportation EnhancementsPage 56
Ordering Information
The first copy of each GAO report and testimony is free.
Additional copies are $2 each. Orders should be sent to the
following address, accompanied by a check or money order
made out to the Superintendent of Documents, when
necessary. VISA and MasterCard credit cards are accepted, also.
Orders for 100 or more copies to be mailed to a single address
are discounted 25 percent.
Orders by mail:
U.S. General Accounting Office
P.O. Box 6015
Gaithersburg, MD 20884-6015
or visit:
Room 1100
700 4th St. NW (corner of 4th and G Sts. NW)
U.S. General Accounting Office
Washington, DC
Orders may also be placed by calling (202) 512-6000
or by using fax number (301) 258-4066, or TDD (301) 413-0006.
Each day, GAO issues a list of newly available reports and
testimony. To receive facsimile copies of the daily list or any
list from the past 30 days, please call (202) 512-6000 using a
touchtone phone. A recorded menu will provide information on
how to obtain these lists.
For information on how to access GAO reports on the INTERNET,
send an e-mail message with "info" in the body to:
or visit GAO’s World Wide Web Home Page at:
http://www.gao.gov
PRINTED ON RECYCLED PAPER

United StatesGeneral Accounting OfficeWashington, D.C. 20548-0001
Official BusinessPenalty for Private Use $300
Address Correction Requested
Bulk RatePostage & Fees Paid
GAOPermit No. G100