Embed Size (px)
Citation preview
R&D SDM 1Metrics
How to measure and assess software engineering?
2009Theo Schouten
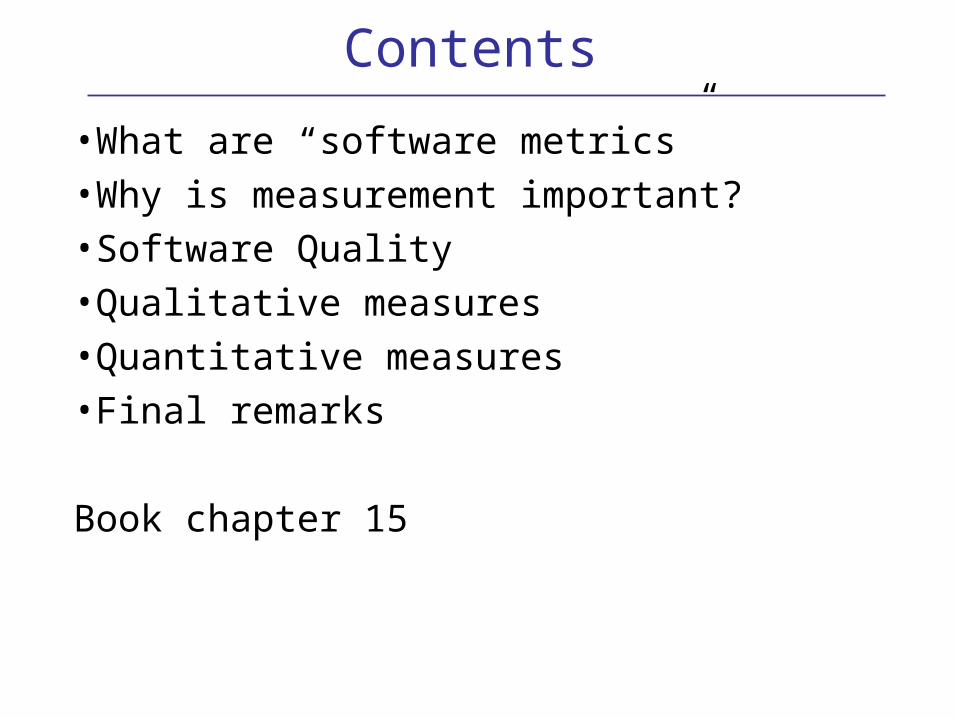
Contents
•What are “software metrics”
•Why is measurement important?
•Software Quality
•Qualitative measures
•Quantitative measures
•Final remarks
Book chapter 15

Metrics
•What is a metric?
–“A quantitative measure of the degree to which a system, component or process pocesses a given attribute” (IEEE Software Engineering Standards 1993) : Software Quality
•Different from
–Measure (size of a system, component e.d)
–Measurement (act of determining a measure)
•Metrics
–Qualitative Metrics
–Quantitative Metrics

Why important, difficult
• Why is measurement difficult?
–No “exact” measure (‘measure the unmeasurable’, subjective factors)
–Dependent on technical environment
–Dependent on organizational environment
–Dependent on application and ‘fitness for use’
Why is measurement important•to characterize•to evaluate•to predict•to improve

Quality definition
Requirements are the foundation to measure software quality
Standards define the development criteria for software engineering
Software quality should conform to explicit and implicit requirements
(degree of) conformance to:•explicitly stated functional and performance requirements•explicitly documented developments standards•implicit characteristics that are expected of all professional developed software.

Software quality attributes
Product Revision Product Transition
MaintainabilityFlexibilityTestability
PortabilityReusabilityInteroperability
Product Operation
Software Quality Factors (McCall, 1977):
Correctness Usability Efficiency Reliability Integrity
Software Quality: Qualitative Measures
McCall: Metrics that affect cq influence software quality factors:
–Software Quality Factors are the dependent, metrics are the independent variable
–Metrics: audibility, accuracy, communication commonality, completeness, consistency, data commonality, error tolerance, execution efficiency, expandability, generality, hardware independence, instrumentation, modularity, operability, security, self-documentation, simplicity, software system independence, traceability, training.
–Software quality factor = c1 m1 + c2 m2 + … + cn mn
–Cn is a regression coefficient based on empirical data
–Software quality factor gives an indication of the quality of the software

McCall Matrix

FURPS, Quality Factors•Developed at Hewlett-Packard (Grady, Caswell, 1987)
•Functionality:–Feature set and capability of the system–Generality of the functions - Security of the overall system
•Usability:–Human factors (aesthetics, consistency and documentation)
•Reliability:–Frequency and severity of failure–Accuracy of output–MTTF - Failure recovery and predictability
•Performance:–Speed, response time, resource consumption, throughput and efficiency
•Supportability:–Extensibility, Maintainability, Configurability, Etc.

ISO 9126 Quality Factors6 key quality attributes, each with several sub-attributes
•Functionality
•Reliability
•Usability
•Efficiency
•Maintainability
•Portability
Also often not direct measurable, but gives ideas for indirect measures and checklists.
defect : The nonfulfilment of intended usage requirements nonconformity : The nonfulfilment of specified requirements
superseded by the new project SQuaRE, ISO 25000:200
Quantitative MetricsDesired attributes of Metrics (Ejiogu, 1991)
–Simple and computable–Empirical and intuitively persuasive–Consistent and objective–Consistent in the use of units and dimensions–Independent of programming language, so directed at models (analysis, design, test, etc.) or structure of program–Effective mechanism for quality feedback
Type of Metrics:–Size oriented
•Focused on the size of the software (LinesOfCode, Errors, Defects, size of documentation, etc.)•independent of programming language?
–Function oriented•Focused on the realization of a function of a system
Product Metrics Landscape• See chapter 15.2.6• Metrics for the analysis model• Metrics for the design model• Metrics for the source code• Metrics for testing
Function Oriented MetricsFunction Point Analysis (FPA)
a method for the measurement of the final functions of an information system from the perspective of an end user
–method to determine size of a system on basis of a functional specification
–method is independent of programming language and operational environment
–its empirical parameters are not.
–Usable for
•estimate cost or effort to design, code and test the software
•predict number of components or Lines of Code
•predict the number of errors encountered during testing
•determining a ‘productivity measure’ after delivery

Function Point AnalysisBasis is the Function Punt Index (FPI) of a system to build:
.
Amount of work = Function Point Index * Resource factor
Resource factor depends on:
–development environment
–experience of project team with environment and tools
–size of the team
Benchmarks and measurements of previous projects are used to estimate the resource factor.
Function Point Index
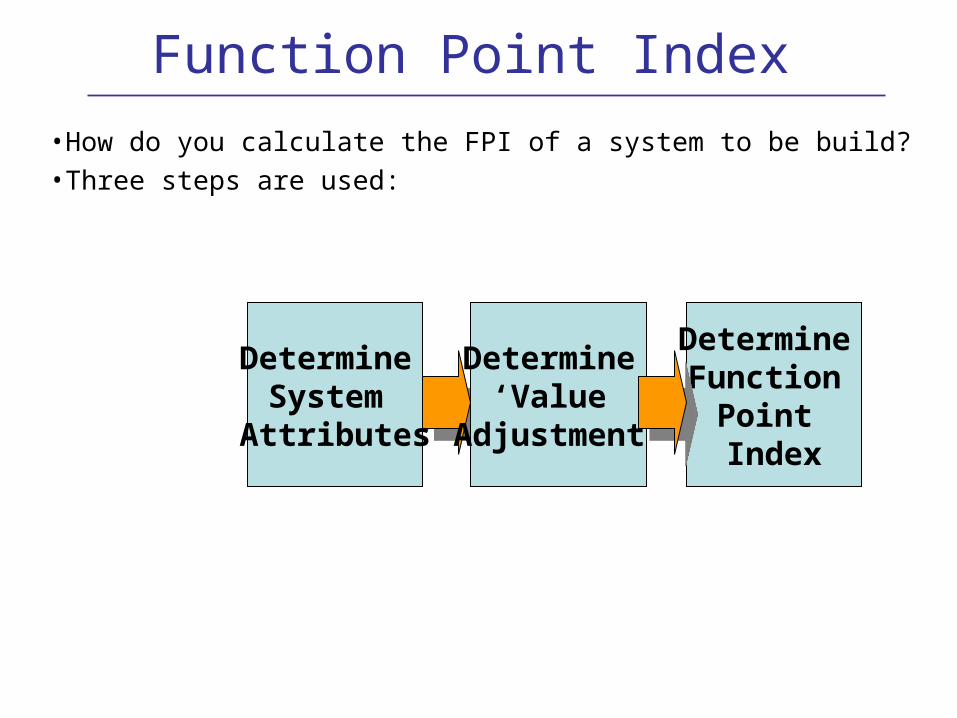
•How do you calculate the FPI of a system to be build?
•Three steps are used:
Determine Function
Point Index
Determine System
Attributes
Determine ‘Value
Adjustment”

FPA: System Attributes• Count the number of each ‘system attribute’ :
1. User (Human or other system) External Inputs (EI)
2. User External Outputs (EO)
3. User External Inquiries (EQ)
4. Internal Logical Master Files (MF)
5. Interfaces to other systems (IF)
System Environment Other Systems
Transactions
External User
Transactions
Interface
MFs
EI
EI
EO
EO
EQ
EQ
IF

FPA: System Atributes weighting•Determine per system attribute how difficult it is:
–Low–Medium–High
•Use the following matrix to determine the weighting factor:
•Calculate the weighted sum of the system attributes:the ‘Unadjusted Function Point Index’ (UFPI)
System Attribute Low Medium High
User External Input 3 4 6
User External Output 4 5 7
User External Inquiry 3 4 6
User Logical Master File 7 10 15
Interfaces 5 7 10

FPA: Value Adjustment•The UFPI needs to be adapted to the environment in which the system has to operate. The ‘degree of influence’ is determined for the 14 ‘values adjustment ‘ factors:.
–Data Communications–Distributed Processing–Performance Objectives–Tight Configuration–Transaction Volume–On-line Data Entry–End User Efficiency–Logical File Updates–Complex Processing–Design for Re-usability–Conversion and Installation Ease–Multiple Site Implementation–Ease of Change and Use
Value between 0 and 5
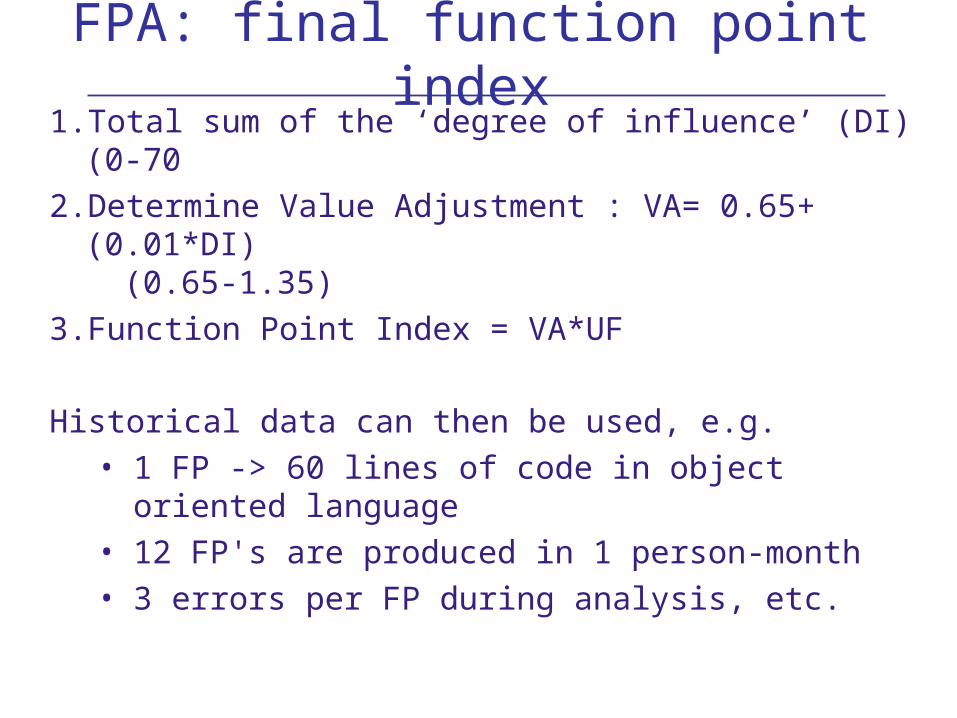
FPA: final function point index1. Total sum of the ‘degree of influence’ (DI) (0-70
2. Determine Value Adjustment : VA= 0.65+ (0.01*DI) (0.65-1.35)
3. Function Point Index = VA*UF
Historical data can then be used, e.g.
• 1 FP -> 60 lines of code in object oriented language
• 12 FP's are produced in 1 person-month
• 3 errors per FP during analysis, etc.
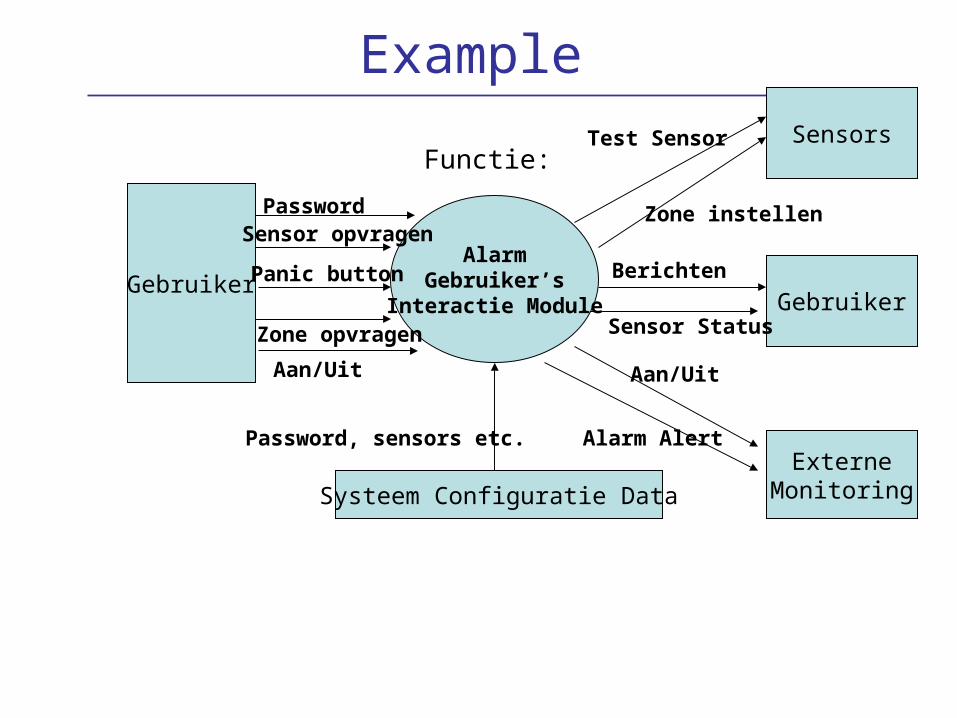
Example
AlarmGebruiker’s
Interactie Module
Functie:
Gebruiker
PasswordSensor opvragen
Panic button
Zone opvragen
Aan/Uit
Systeem Configuratie Data
Sensors
Gebruiker
ExterneMonitoring
Test Sensor
Zone instellen
Berichten
Sensor Status
Aan/Uit
Alarm AlertPassword, sensors etc.

Unadjusted Function Point IndexDetermine the number of system attributes:
1. User External Inputs (EI)
2. User External Outputs (EO)
3. User External Inquiries (IQ)
4. User Logical Master Files (MF)
5. Interfaces to other systems (IF)System Attribute Number Low Medium High Total
User External Input 3 3 4 6 9User External Output 2 4 5 7 8User External Inquiry 2 3 4 6 6User Logical Master File 1 7 10 15 7Interfaces 4 5 7 10 20Total 50
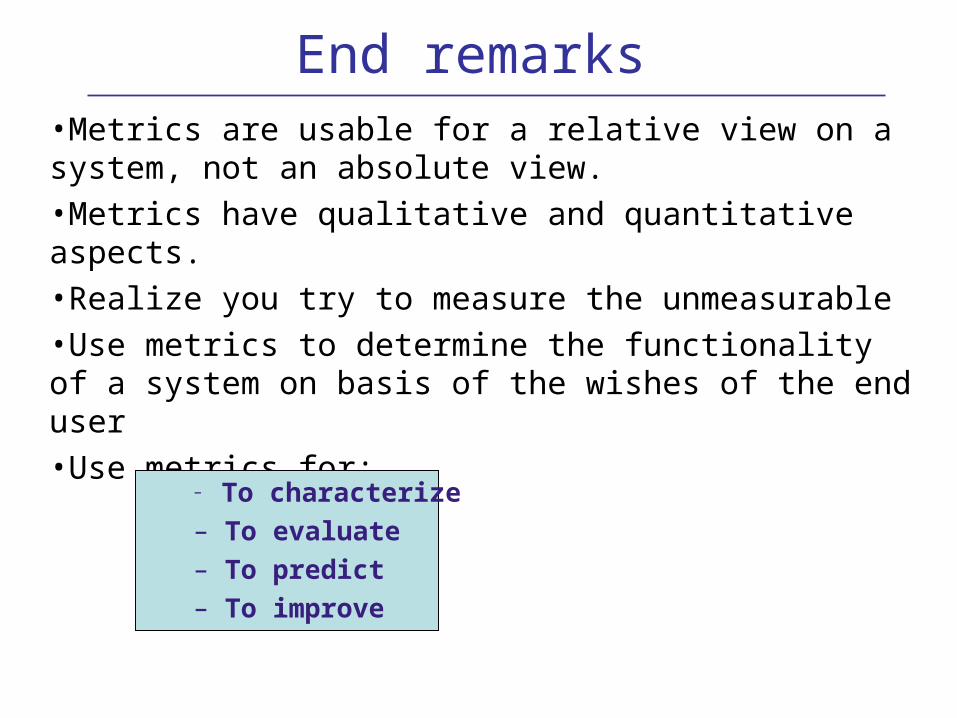
End remarks•Metrics are usable for a relative view on a system, not an absolute view.
•Metrics have qualitative and quantitative aspects.
•Realize you try to measure the unmeasurable
•Use metrics to determine the functionality of a system on basis of the wishes of the end user
•Use metrics for:
– To characterize
– To evaluate
– To predict
– To improve