Embed Size (px)
Citation preview

T:\2013\ILM\3.038-ILM39\12-VMC Apr-Dec 2013 Capitation Rate Documentation-FINAL.doc
Milliman makes no representations or warranties regarding the contents of this letter to third parties. Likewise, third parties are instructed that they are to place no reliance upon this letter prepared for HFS by Milliman that would result in the creation of any duty or liability under any theory of law by Milliman or its employees to third parties. Other parties receiving this letter must rely upon their own experts in drawing conclusions about the capitation rates, assumptions, and trends.
Offices in Principal Cities Worldwide
Chase Center/Circle 111 Monument Circle Suite 601 Indianapolis, IN 46204-5128 USA
Tel +1 317 639 1000 Fax +1 317 639 1001
milliman.com
March 26, 2013 Mr. James Parker Illinois Department of Healthcare and Family Services Prescott Bloom Building 201 S. Grand Avenue East, 2nd Floor Springfield, IL 62763-0001 RE: APRIL 1, 2013 CAPITATION RATES - VOLUNTARY MANAGED CARE PROGRAM Dear Jim: Milliman, Inc. (Milliman) has been retained by the State of Illinois, Department of Healthcare and Family Services (HFS) to provide actuarial and consulting services related to the development of capitation rates for the voluntary managed care (VMC) program for the TANF population for the period of April 1, 2013 through December 31, 2013. In our analyses, we have developed capitation rates for each geographic region and rate cell. This letter provides the documentation for the development of the actuarially sound capitation rates. The documentation has been developed to address the items outlined in the Centers for Medicare and Medicaid Services rate setting checklist for Regional Offices regarding 42 CFR 438.6(c) for capitated Medicaid managed care plans. The attached rate certification and Data Book should be submitted to CMS for their review and approval. LIMITATIONS The services provided for this project were performed under the contract extension between Milliman and HFS dated September 27, 2012. The information contained in this letter, including the enclosures, has been prepared for the State of Illinois, Department of Healthcare and Family Services and their consultants and advisors. It is our understanding that the information contained in this letter may be utilized in a public document. To the extent that the information contained in this letter is provided to third parties, the letter should be distributed in its entirety. Any user of the data must possess a certain level of expertise in actuarial science and healthcare modeling so as not to misinterpret the data presented.

Mr. James Parker March 26, 2013
Page 2
T:\2013\ILM\3.038-ILM39\12-VMC Apr-Dec 2013 Capitation Rate Documentation-FINAL.doc
Milliman makes no representations or warranties regarding the contents of this letter to third parties. Likewise, third parties are instructed that they are to place no reliance upon this letter prepared for HFS by Milliman that would result in the creation of any duty or liability under any theory of law by Milliman or its employees to third parties. Other parties receiving this letter must rely upon their own experts in drawing conclusions about the HFS’s capitation rates, assumptions, and trends.
Milliman makes no representations or warranties regarding the contents of this letter to third parties. Likewise, third parties are instructed that they are to place no reliance upon this letter prepared for HFS by Milliman that would result in the creation of any duty or liability under any theory of law by Milliman or its employees to third parties. Other parties receiving this letter must rely upon their own experts in drawing conclusions about the capitation rates, assumptions, and trends. The information contained in this letter was prepared as documentation of the actuarially sound capitation rates for Medicaid managed care health plans participating in the voluntary managed care (VMC) program for the TANF population in the State of Illinois. The information may not be appropriate for any other purpose. Although the capitation rates have been certified as actuarially sound, the capitation rates may not be appropriate for any individual health plan. DATA RELIANCE The rate development assumptions contained in this letter are based upon data and information provided by the State of Illinois, Department of Healthcare and Family Services (HFS). Although the data were reviewed for reasonableness, we have accepted the data without audit. To the extent that the data provided to Milliman was not complete or accurate, the capitation rates presented in this letter may need to be modified. It should be emphasized that capitation rates are a projection of future costs based on a set of assumptions. Results will differ if actual experience is different from the assumptions contained in this letter. Specifically, we relied upon the following information provided by HFS to develop the actuarially sound capitation rates for the April 1, 2013 through December 31, 2013 contract period:
1. Detail data extract of claim and eligibility information for the FFS program for a population comparable to those enrolled with MCOs;
2. June 2012 health plan enrollment; 3. Fee schedule information including historical changes in reimbursement for covered services
of the managed care program; and, 4. Data and information related to SMART Act policy and program changes, including provider
notice documentation and estimated total impact amounts.

Mr. James Parker March 26, 2013
Page 3
T:\2013\ILM\3.038-ILM39\12-VMC Apr-Dec 2013 Capitation Rate Documentation-FINAL.doc
Milliman makes no representations or warranties regarding the contents of this letter to third parties. Likewise, third parties are instructed that they are to place no reliance upon this letter prepared for HFS by Milliman that would result in the creation of any duty or liability under any theory of law by Milliman or its employees to third parties. Other parties receiving this letter must rely upon their own experts in drawing conclusions about the HFS’s capitation rates, assumptions, and trends.
EXECUTIVE SUMMARY The State of Illinois operates for a voluntary managed care program for TANF-eligible populations. Capitation rates have been developed for the period of April 1, 2013 through December 31, 2013. For maternity services, Milliman developed a maternity case rate. In the development of the capitation rates, Milliman relied on data extracts prepared by HFS. The capitation rates for the new rating period reflect a rate re-basing methodology. The capitation rates were developed from base period FFS experience from state fiscal year (SFY) 2010 and 2011, July 1, 2009 through June 30, 2011. Table 1 illustrates the proposed monthly capitation rates and per delivery case rate payments for Regions 1 through 5.
Table 1
State of Illinois
Department of Healthcare and Family Services Effective April 1, 2013 through December 31, 2013
Monthly Capitation Rates
Rate Cell Region 1 Region 2 Region 3 Region 4 Region 5 0 Thru 90 Days $ 1,400.01 $ 1,290.37 $ 1,249.89 $ 1,687.63 $ 1,214.55 91 Days Thru 1 Year 153.41 175.18 188.38 194.00 164.45 2 Thru 5 Years 71.61 83.21 88.40 84.93 76.76 6 Thru 13 Years 70.18 81.25 76.01 53.35 55.91 14 Thru 20 Male 93.28 110.27 97.29 75.02 77.59 14 Thru 20 Female 125.75 142.10 139.83 98.04 98.21 21 Thru 44 Male 143.76 158.96 163.26 128.31 134.12 21 Thru 44 Female 190.69 205.48 218.56 171.10 187.02 45+ Years 297.40 343.67 338.18 264.73 266.40
Delivery Case Rate Payments
Rate Cell Region 1 Region 2 Region 3 Region 4 Region 5 Delivery $3,538.04 $3,399.92 $3,569.38 $4,501.14 $3,812.33

Mr. James Parker March 26, 2013
Page 4
T:\2013\ILM\3.038-ILM39\12-VMC Apr-Dec 2013 Capitation Rate Documentation-FINAL.doc
Milliman makes no representations or warranties regarding the contents of this letter to third parties. Likewise, third parties are instructed that they are to place no reliance upon this letter prepared for HFS by Milliman that would result in the creation of any duty or liability under any theory of law by Milliman or its employees to third parties. Other parties receiving this letter must rely upon their own experts in drawing conclusions about the HFS’s capitation rates, assumptions, and trends.
Table 2 illustrates the impact of assumption changes to the capitation rates between the February through March 2013 rates and the April through December 2013 rates.
Table 2
State of Illinois Department of Healthcare and Family Services
Effective April 1, 2013 through December 31, 2013
Capitation Rate Changes Assumption
Non-Maternity
Maternity
Rebasing 22.6% 10.9% Remove IP Supplemental Payments (4.0%) (7.4%) SMART and Fee Screen Changes (0.7%) (0.2%) Rx Carve-in 15.3% 0.0% Selection Adjustment (5.2%) 0.0% MC adjustment (7.6%) (1.3%) Admin (0.6%) 0.0%
Total Rate Change 17.4% 1.2% Notes: 1. Impacts are multiplicative in nature and will not add to the total rate
change. 2. Rebasing includes update of base data to SFY 2010 and 2011 experience. 3. Rx Carve-in includes addition of pharmacy benefit at a managed care
level and changes in administrative cost due to this addition. An actuarial certification is provided by Milliman as an enclosure to this letter and signed by Robert M. Damler, FSA, a Principal and Consulting Actuary in the Indianapolis office of Milliman, Inc. Mr. Damler is a Member of the American Academy of Actuaries and meets the qualification standards established by the American Academy of Actuaries. Enclosure 1 contains an actuarial certification regarding the actuarial soundness of the capitation rates. Enclosure 2 contains the April 1, 2013 through December 31, 2013 capitation rates and projected expenditures for each rate cell and geographic region. Enclosure 3 provides the Data Book containing the documentation of the April 1, 2013 through December 31, 2013 capitation rates. This letter should be provided in its entirety, including the Data Book, to CMS for their review and approval of the capitation rates.

Mr. James Parker March 26, 2013
Page 5
T:\2013\ILM\3.038-ILM39\12-VMC Apr-Dec 2013 Capitation Rate Documentation-FINAL.doc
Milliman makes no representations or warranties regarding the contents of this letter to third parties. Likewise, third parties are instructed that they are to place no reliance upon this letter prepared for HFS by Milliman that would result in the creation of any duty or liability under any theory of law by Milliman or its employees to third parties. Other parties receiving this letter must rely upon their own experts in drawing conclusions about the HFS’s capitation rates, assumptions, and trends.
CAPITATION RATE DEVELOPMENT METHODOLOGY The capitation rates were developed based on the state fiscal year (SFY) 2010 and 2011 FFS data with trend information from SFY 2008 through 2011, the Milliman Medicaid Cost Guidelines (Guidelines), other Milliman proprietary data, and our actuarial judgment. The capitation rates were developed on an actuarially sound basis using fee-for-service (FFS) claim experience with adjustments for healthcare management, trend, and health plan administration. The actuarially sound capitation rates were developed following the requirements outlined in the rate setting checklist CMS developed for its Regional Offices regarding 42 CFR 438.6(c) for capitated Medicaid managed care plans. This section of the letter follows the checklist and provides the required documentation. AA.1. – Overview of Rate Setting Methodology AA.1.0. – Overview of Rate Setting Methodology HFS contracted with Milliman to determine actuarially sound capitation rates for the voluntary managed care (VMC) program for the TANF population. The actuarially sound capitation rates were developed from historical FFS claims and enrollment data. The FFS population has been limited to a comparable population enrolled with the risk based managed care health plans. The historical experience was converted to a per member per month basis and stratified by region, age / gender rating cell, and category of service. The historical experience was trended forward based on projected trend rates to a center point of August 15, 2013 for the nine month contract period. The historical experience was adjusted to reflect the utilization and average cost per service that would be expected in a managed care program. The resulting expected claim costs were increased to reflect the administration load of the health plans. The capitation rate setting methodology is a rate rebasing from the current capitation rates. The rate rebase reflects state fiscal year (SFY) 2010 and 2011 baseline experience with trend rates developed from SFY 2008 through SFY 2011 experience. Population and medical cost experience grew significantly between this analysis and the previously rebased capitation rates, which used SFY 2007 data. Although the cost increased in the base data, the risk adjustment factors have decreased offsetting much of the increase in rebased cost. AA.1.1. – Actuarial Certification An actuarial certification has been included in Enclosure 1 of this letter. The letter has been signed by Robert M. Damler, FSA, a Principal and Consulting Actuary in the Indianapolis office of Milliman, Inc. Mr. Damler is a Member of the American Academy of Actuaries and meets the qualification standards established by the American Academy of Actuaries. This letter has been used to supplement the Actuarial Certification by outlining a detailed description of the rate setting methodology and the applicable checklist. Enclosure 2 provides an illustration of the capitation rate calculations by rate cell for each geographic region.

Mr. James Parker March 26, 2013
Page 6
T:\2013\ILM\3.038-ILM39\12-VMC Apr-Dec 2013 Capitation Rate Documentation-FINAL.doc
Milliman makes no representations or warranties regarding the contents of this letter to third parties. Likewise, third parties are instructed that they are to place no reliance upon this letter prepared for HFS by Milliman that would result in the creation of any duty or liability under any theory of law by Milliman or its employees to third parties. Other parties receiving this letter must rely upon their own experts in drawing conclusions about the HFS’s capitation rates, assumptions, and trends.
AA.1.2. – Projection of Expenditures In aggregate, the capitation rates for the nine month period reflect a rate increase of 17.4% in relation to the current capitation rates, excluding maternity case rate payments. The maternity case rates for the period reflect a rate increase of 1.2% in relation to the current capitation rates. The estimated composite impact is 16.4%. Table 3 illustrates the expenditure impact using June 2012 MCO enrollment and extrapolating the value to represent nine months.
Table 3
State of Illinois
Department of Healthcare and Family Services Voluntary Managed Care Program for the TANF-eligible population
Contract Period Impact of Capitation Rate Increase {Dollars shown in Millions}
Fiscal Basis Estimated
Enrollment Current
Expenditures Proposed
Expenditures
% Change State and Federal 217,123 $ 244.2 $ 284.2 16.4%
Federal Only 217,123 $ 122.1 $ 142.1 16.4% Note: Federal share calculated using an FMAP rate of 50.00%. AA.1.3. – Procurement, Prior Approval and Rate Setting HFS signs contracts with entities meeting the technical programmatic requirements of the state. The entities agree to accept the actuarially sound, state-determined rate. AA.1.5. – Risk Contracts The capitation rates in Table 1 are intended as payment in full for VMC covered services when combined with any cost sharing from the members. The contracting entity will assume risk for the cost of services covered under the contract and will incur losses if the cost of furnishing the services exceeds the payments under the contract. AA.1.6. – Limit on Payment to Other Providers This section is a contractual issue between HFS and the health plans. AA.1.7. – Rate Modifications The April 1, 2013 through December 31, 2013 capitation rates reflect a re-basing of experience.

Mr. James Parker March 26, 2013
Page 7
T:\2013\ILM\3.038-ILM39\12-VMC Apr-Dec 2013 Capitation Rate Documentation-FINAL.doc
Milliman makes no representations or warranties regarding the contents of this letter to third parties. Likewise, third parties are instructed that they are to place no reliance upon this letter prepared for HFS by Milliman that would result in the creation of any duty or liability under any theory of law by Milliman or its employees to third parties. Other parties receiving this letter must rely upon their own experts in drawing conclusions about the HFS’s capitation rates, assumptions, and trends.
AA.2. – Base Year Utilization and Cost Data AA.2.0. – Base Year Utilization and Cost Data The base year data summaries were derived from Illinois FFS experience for the population eligible to enroll with the risk-based managed care health plans as defined in Section A.A.2.1. HFS provided detail FFS claims and enrollment experience for SFY 2008 through 2011. The base year utilization and cost was developed from SFY 2010 and SFY 2011 experience data. AA.2.1. – Medicaid Eligibles under the Contract HFS limited the historical expenditures and enrollment to a population that would be comparable to the population that is eligible to enroll in the VMC program. HFS excluded the following populations:
• Members residing in a long-term care facility • HMO enrolled members • Spend-down eligible population • Medicare eligible population • Members with significant third-party liability coverage • Retroactive eligibility periods • Initial enrollment periods • Members eligible for Waivers • SSI eligible children
AA.2.2 – Dual Eligibles Medicare Dual Eligibles are not eligible for the VMC program and were not included in the base data. AA.2.3 – Spenddown Spenddown Eligibles are not eligible for the VMC program and were not included in the base data. AA.2.4. – State Plan Services Only The capitation rates were developed from FFS data that included only state plan approved services that the health plans are required to provide under the contract. AA.2.5. – Capitated Entity Services Milliman did not include any adjustments to the FFS data to reflect additional services that may be covered by the managed care organizations from the contract savings.
Mr. James Parker March 26, 2013
Page 8
T:\2013\ILM\3.038-ILM39\12-VMC Apr-Dec 2013 Capitation Rate Documentation-FINAL.doc
Milliman makes no representations or warranties regarding the contents of this letter to third parties. Likewise, third parties are instructed that they are to place no reliance upon this letter prepared for HFS by Milliman that would result in the creation of any duty or liability under any theory of law by Milliman or its employees to third parties. Other parties receiving this letter must rely upon their own experts in drawing conclusions about the HFS’s capitation rates, assumptions, and trends.
AA.3. – Adjustments to the Base Year Data AA.3.1 – Benefit Differences The FFS data were adjusted to remove services that are excluded from the Medicaid managed care covered services for the VMC. Beginning April 1, 2013, pharmacy expenditures will be included as a benefit covered within the VMC program. Milliman has included pharmacy utilization and cost in the base data summaries as well the rate development cost model summaries. Nursing facility services are covered under the VMC program for the first 90 days a member is residing in the facility. HFS routinely updates the fee schedules for nursing facility rates. The capitation rates were adjusted to reflect fee changes between the base data period and the contract period of April 1, 2013 through December 31, 2013. This adjustment includes the SMART Act provider rate decrease of 2.7%. In January 2013, the Affordable Care Act requires an increase in the Medicaid physician fee schedule for certain providers for all Evaluation and Management (E&M) and certain vaccine administration services to 100% of the Medicare physician fee schedule. It is our understanding that HFS will reimburse providers for the additional fee amount outside of the capitated program for VMC-enrolled individuals. As such, we have not made an adjustment to reflect a physician fee schedule increase within the capitation payment rates. Additionally, in May 2012, the General Assembly passed the Save Medicaid Access and Resources Together Act (SMART). This legislation reduces benefits and reimbursement levels for the Medicaid program for certain services, effective for the VMC program on February 1, 2013. A detailed list and the impact to the capitation rates of the adjustments discussed above are included in Section VI.b of the attached Data Book. AA.3.2. – Administrative Cost Allowance Calculations In the development of the actuarially sound capitation rates, Milliman has included an administrative cost allowance of 13.25% for the non-maternity capitation rates and 3.5% for the delivery case rate. The administrative cost allowance was developed to be appropriate for a managed care capitation payment which includes both medical and pharmacy benefits. The capitation rate was determined by dividing the projected managed care claim cost by one minus the administrative cost allowance (e.g., 1 minus 13.25%). By determining the capitation rate in this manner, the administrative allowance may be expressed as a percentage of the capitation rate. In the establishment of the administrative cost allowance, we have utilized a value that is representative of Medicaid managed care organizations. The administrative cost allowance includes administration, profit / contingency margin, and contribution to surplus.

Mr. James Parker March 26, 2013
Page 9
T:\2013\ILM\3.038-ILM39\12-VMC Apr-Dec 2013 Capitation Rate Documentation-FINAL.doc
Milliman makes no representations or warranties regarding the contents of this letter to third parties. Likewise, third parties are instructed that they are to place no reliance upon this letter prepared for HFS by Milliman that would result in the creation of any duty or liability under any theory of law by Milliman or its employees to third parties. Other parties receiving this letter must rely upon their own experts in drawing conclusions about the HFS’s capitation rates, assumptions, and trends.
AA.3.3.-AA.3.4. – Special Populations’ Adjustments and Eligibility Adjustments The base data reflect the population that is eligible to participate in the VMC program. AA.3.5. – DSH Payments DSH payments were not included in the development of the actuarially sound capitation rates. The claims information used in developing the capitation rates excluded DSH payments. AA.3.6. – Third Party Liability Milliman used FFS experience which was net of third party liability recoveries to develop the base data for VMC services. The estimated third party liability recovery rate is expected to be consistent with that experienced by the health plans, excluding claim avoidance. Additionally, the FFS experience excluded individuals with material amounts of third-party liability coverage. HFS determined the population that would qualify under this exclusion. AA.3.7. – Copayments The health plans may collect copayments consistent with the FFS program. A policy change adjustment was included to reflect increasing copayment levels between the base data period and the contract period. A detailed discussion about this change and its impact to the capitation rates is included in Section VI.b of the Data Book. AA.3.8. – Graduate Medical Education Graduate medical education payments are not included in the capitation rates. AA.3.9. – FQHC and RHC Reimbursement Milliman did not adjust the FFS data for FQHC and RHC reimbursement in the development of the capitation rates. AA.3.10. – Cost Trending / Inflation The historical experience for the base year data was trended to the midpoint of the contract rate period. The contract will be for the period April 1, 2013 through December 31, 2013, with a midpoint of August 15, 2013. A historical trend analysis was developed from SFY 2008 through SFY 2011 FFS claims and enrollment data. Trend rates by category of service and rate cell are illustrated in Section VI.e of the attached Data Book.

Mr. James Parker March 26, 2013
Page 10
T:\2013\ILM\3.038-ILM39\12-VMC Apr-Dec 2013 Capitation Rate Documentation-FINAL.doc
Milliman makes no representations or warranties regarding the contents of this letter to third parties. Likewise, third parties are instructed that they are to place no reliance upon this letter prepared for HFS by Milliman that would result in the creation of any duty or liability under any theory of law by Milliman or its employees to third parties. Other parties receiving this letter must rely upon their own experts in drawing conclusions about the HFS’s capitation rates, assumptions, and trends.
AA.3.11. – Utilization Adjustments Milliman adjusted the FFS utilization and reimbursement rates per service to reflect the managed care environment. Milliman calculated percentage reductions to reflect the utilization differential between a moderately managed population and a FFS population. The percentage reductions were applied to the FFS experience. In addition to adjusting utilization rates to reflect healthcare management, Milliman adjusted the average reimbursement rates to reflect changes in the mix / intensity of services due to the management of health care. The adjustments are illustrated by population and category of service in the capitation rate calculations in Attachment 4 of the Data Book. AA.3.12. –Utilization and Cost Assumptions Through the selection process of the populations from the FFS experience, HFS has developed a data extract of the population that may voluntarily enroll with the health plans. Based on this process, it is anticipated that the morbidity of the FFS population would be consistent with the population that will enroll if the program were mandatory. Due to the voluntary nature of the managed care program, it can be expected that those who choose to enroll in the program will be healthier that those who remain in the FFS environment. We have quantified the historical selection differences between the FFS and managed care population using a risk adjustment methodology for pharmacy data gathered for both groups. We have included two adjustments to adjust the FFS experience to reflect the population that will be enrolled with the health plans: Non-Maternity Selection Adjustment and Newborn Adjustment. These adjustments are illustrated in Section VI.e of the Data Book. In addition to the selection adjustments, Milliman added a PCCM administration fee to the historical experience. The PCCM administration fee was included to allow for the managed care plans to offer reimbursement to primary care physicians in a manner consistent with the FFS environment. AA.3.13. – Post-eligibility Treatment of Income Milliman did not adjust the data to reflect post-eligibility treatment of income. The expenditures included in the capitation rate reflect the net liability for HFS. AA.3.14. – Incomplete Data Adjustment Milliman used FFS data for services incurred from July 1, 2008 through June 30, 2011, paid through June 2012 to develop completion factors to be applied to the base data summaries. Separate claim completion factors were applied to the services incurred during SFY 2010 and SFY 2011. Completion factors were applied to the base utilization amounts as illustrated in Section VI.a of the Data Book.

Mr. James Parker March 26, 2013
Page 11
T:\2013\ILM\3.038-ILM39\12-VMC Apr-Dec 2013 Capitation Rate Documentation-FINAL.doc
Milliman makes no representations or warranties regarding the contents of this letter to third parties. Likewise, third parties are instructed that they are to place no reliance upon this letter prepared for HFS by Milliman that would result in the creation of any duty or liability under any theory of law by Milliman or its employees to third parties. Other parties receiving this letter must rely upon their own experts in drawing conclusions about the HFS’s capitation rates, assumptions, and trends.
AA.4.0. – Rate Category Groupings AA.4.1. and AA.4.2 – Age and Gender Rating Categories The following table illustrates the age / gender rating categories used for the development of the FFS data book values, as well as the capitation rates.
Table 4
State of Illinois Department of Healthcare and Family Services
Voluntary Managed Care Program for the TANF-eligible population Rate Cell Definition
Age Range Gender
0 through 90 days Unisex 91 days through 1 year Unisex 2 years through 5 years Unisex 6 years through 13 years Unisex 14 years through 20 years Male / Female 21 years through 44 years Male / Female 45 years and over Unisex
Delivery Case Rate Female - All Ages AA.4.3. and AA.4.4. – Locality / Region and Eligibility Categories Locality / Region and eligibility rating categories have been defined by HFS. The counties included in each region are listed in Section IV of the Data Book. AA.5.0., AA.5.1, and AA.5.2. – Data Smoothing Milliman and HFS reviewed the historical experience and did not identify any necessary adjustments for large claims or data distortions. AA.5.3. – Risk-Adjustment The managed care health plans will receive reimbursement on an age, gender, and geographic region basis. No additional risk adjustment method will be used.

Mr. James Parker March 26, 2013
Page 12
T:\2013\ILM\3.038-ILM39\12-VMC Apr-Dec 2013 Capitation Rate Documentation-FINAL.doc
Milliman makes no representations or warranties regarding the contents of this letter to third parties. Likewise, third parties are instructed that they are to place no reliance upon this letter prepared for HFS by Milliman that would result in the creation of any duty or liability under any theory of law by Milliman or its employees to third parties. Other parties receiving this letter must rely upon their own experts in drawing conclusions about the HFS’s capitation rates, assumptions, and trends.
AA.6.0. – Stop Loss, Reinsurance, or Risk-sharing Arrangements HFS does not provide any reinsurance provision. AA.6.1 – Commercial Reinsurance HFS does not require the health plans to maintain any specific reinsurance. AA.6.2 – Simple Stop Loss Program HFS does not provide for any of these provisions in the terms of their contract with the managed care organizations. AA.6.3 – Risk Corridor Program HFS does not have a risk corridor program. AA.7.0 – Incentive Arrangements Under the terms of the contract, HFS will withhold 1% of the capitation rates certified in this letter. The withhold plus up to 0.5% of submitted capitation rates will be returned to the health plans based on meeting specified HEDIS measure improvements. All incentives will utilize an actuarially sound methodology. The capitation rates certified in this letter have been determined to be actuarially sound in the event that the 1% withhold amount is not returned to the health plans.
♦ ♦ ♦ ♦
Guidelines issued by the American Academy of Actuaries require actuaries to include their professional qualifications in all actuarial communications. I am a member of the American Academy of Actuaries, and I meet the qualification standards for performing the analyses in this report. If you have any questions regarding the enclosed information, please do not hesitate to contact me at (317) 524-3512. Sincerely, Robert M. Damler, FSA, MAAA Principal and Consulting Actuary RMD/lrb Enclosures

T:\2013\ILM\3.038-ILM39\12-VMC Apr-Dec 2013 Capitation Rate Documentation-FINAL.doc
Milliman makes no representations or warranties regarding the contents of this letter to third parties. Likewise, third parties are instructed that they are to place no reliance upon this letter prepared for HFS by Milliman that would result in the creation of any duty or liability under any theory of law by Milliman or its employees to third parties. Other parties receiving this letter must rely upon their own experts in drawing conclusions about the HFS’s capitation rates, assumptions, and trends.
ENCLOSURE 1

T:\2013\ILM\3.038-ILM39\12-VMC Apr-Dec 2013 Capitation Rate Documentation-FINAL.doc
Milliman makes no representations or warranties regarding the contents of this letter to third parties. Likewise, third parties are instructed that they are to place no reliance upon this letter prepared for HFS by Milliman that would result in the creation of any duty or liability under any theory of law by Milliman or its employees to third parties. Other parties receiving this letter must rely upon their own experts in drawing conclusions about the HFS’s capitation rates, assumptions, and trends.
STATE OF ILLINOIS DEPARTMENT OF HEALTHCARE AND FAMILY SERVICES
Voluntary Risk Based Managed Care Program Capitation Rates Effective April 1, 2013 through December 31, 2013
Actuarial Certification
I, Robert M. Damler, am a Principal and Consulting Actuary with the firm of Milliman, Inc. I am a Fellow of the Society of Actuaries and a Member of the American Academy of Actuaries. I was retained by the State of Illinois, Department of Healthcare and Family Services to perform an actuarial review and certification regarding the development of the capitation rates for the Voluntary Risk Based Managed Care Program for the TANF population to be effective for the contract period of April 1, 2013 through December 31, 2013. I have experience in the examination of financial calculations for Medicaid programs and meet the qualification standards for rendering this opinion. I reviewed the historical claims experience for reasonableness and consistency. I have developed certain actuarial assumptions and actuarial methodologies regarding the projection of healthcare expenditures into future periods. I have complied with the elements of the rate setting checklist CMS developed for its Regional Offices regarding 42 CFR 438.6(c) for capitated Medicaid managed care plans. The capitation rates provided with this certification are effective for the nine month rating period beginning April 1, 2013 through December 31, 2013. At the end of the period, the capitation rates will be updated for calendar year 2014. The update may be based on FFS experience, managed care utilization and trend experience, policy and procedure changes, and other changes in the health care market. A separate certification will be provided with the updated rates. The capitation rates provided with this certification are considered actuarially sound, defined as:
• the capitation rates have been developed in accordance with generally accepted actuarial principles and practices;
• the capitation rates are appropriate for the populations to be covered, and the services to be
furnished under the contract; and,
• the capitation rates meet the requirements of 42 CFR 438.6(c).
This certification is intended for the State of Illinois and should not be relied on by other parties. The reader should be advised by actuaries or other professionals competent in the area of actuarial projections of the type in this certification, so as to properly interpret the projection results. It should be emphasized that capitation rates are a projection of future costs based on a set of assumptions. Actual costs will be dependent on each contracted health plan’s situation and experience.

Actuarial Certification March 26, 2013
Page 2
T:\2013\ILM\3.038-ILM39\12-VMC Apr-Dec 2013 Capitation Rate Documentation-FINAL.doc
Milliman makes no representations or warranties regarding the contents of this letter to third parties. Likewise, third parties are instructed that they are to place no reliance upon this letter prepared for HFS by Milliman that would result in the creation of any duty or liability under any theory of law by Milliman or its employees to third parties. Other parties receiving this letter must rely upon their own experts in drawing conclusions about the HFS’s capitation rates, assumptions, and trends.
This actuarial certification has been based on the actuarial methods, considerations, and analyses promulgated from time to time through the Actuarial Standards of Practice by the Actuarial Standards Board. Robert M. Damler, FSA Member, American Academy of Actuaries March 26, 2013 Date

T:\2013\ILM\3.038-ILM39\12-VMC Apr-Dec 2013 Capitation Rate Documentation-FINAL.doc
Milliman makes no representations or warranties regarding the contents of this letter to third parties. Likewise, third parties are instructed that they are to place no reliance upon this letter prepared for HFS by Milliman that would result in the creation of any duty or liability under any theory of law by Milliman or its employees to third parties. Other parties receiving this letter must rely upon their own experts in drawing conclusions about the HFS’s capitation rates, assumptions, and trends.
ENCLOSURE 2

3/26/20132:26 PM
State of IllinoisDepartment of Healthcare and Family Services
Capitation Rate ComparisonContract Period: 4/1/2013 - 12/31/2013
June 2012 Current Current Proposed Proposed Percentage DollarRegion: 1 Population Distribution Cap Rate Expenditures Cap Rate Expenditures Change Change
0 Thru 90 Days 24 $ 1,291.79 $ 279,000 $ 1,400.01 $ 302,000 8.4% $ 23,00091 Days Thru 1 Year 87 124.28 97,000 153.41 120,000 23.4% 23,000 2 Thru 5 Years 89 52.03 42,000 71.61 57,000 37.6% 15,000 6 Thru 13 Years 156 46.91 66,000 70.18 99,000 49.6% 33,000 14 Thru 20 Male 33 79.95 24,000 93.28 28,000 16.7% 4,000 14 Thru 20 Female 46 129.17 53,000 125.75 52,000 (2.6%) (1,000) 21 Thru 44 Male 51 111.39 51,000 143.76 66,000 29.1% 15,000 21 Thru 44 Female 145 165.23 216,000 190.69 249,000 15.4% 33,000 45+ Years 28 228.43 58,000 297.40 75,000 30.2% 17,000
Composite 659 $ 149.29 $ 886,000 $ 176.69 $ 1,048,000 18.4% $ 162,000
June 2012 Current Current Proposed Proposed Percentage DollarRegion: 2 Population Distribution Cap Rate Expenditures Cap Rate Expenditures Change Change
0 Thru 90 Days 13 $ 1,301.60 $ 152,000 $ 1,290.37 $ 151,000 (0.9%) $ (1,000)91 Days Thru 1 Year 45 142.44 58,000 175.18 71,000 23.0% 13,000 2 Thru 5 Years 60 57.58 31,000 83.21 45,000 44.5% 14,000 6 Thru 13 Years 52 54.88 26,000 81.25 38,000 48.1% 12,000 14 Thru 20 Male 8 86.99 6,000 110.27 8,000 26.8% 2,000 14 Thru 20 Female 12 139.34 15,000 142.10 15,000 2.0% - 21 Thru 44 Male 24 121.04 26,000 158.96 34,000 31.3% 8,000 21 Thru 44 Female 74 167.15 111,000 205.48 137,000 22.9% 26,000 45+ Years 17 251.49 38,000 343.67 53,000 36.7% 15,000
Composite 305 $ 169.04 $ 463,000 $ 201.07 $ 552,000 18.9% $ 89,000
June 2012 Current Current Proposed Proposed Percentage DollarRegion: 3 Population Enrollment Cap Rate Expenditures Cap Rate Expenditures Change Change
0 Thru 90 Days 115 $ 1,166.45 $ 1,207,000 $ 1,249.89 $ 1,294,000 7.2% $ 87,00091 Days Thru 1 Year 415 153.95 575,000 188.38 704,000 22.4% 129,000 2 Thru 5 Years 1,430 63.98 823,000 88.40 1,138,000 38.2% 315,000 6 Thru 13 Years 2,977 54.23 1,453,000 76.01 2,037,000 40.2% 584,000 14 Thru 20 Male 752 96.02 650,000 97.29 658,000 1.3% 8,000 14 Thru 20 Female 820 143.03 1,056,000 139.83 1,032,000 (2.2%) (24,000) 21 Thru 44 Male 432 139.38 542,000 163.26 635,000 17.1% 93,000 21 Thru 44 Female 2,020 184.66 3,357,000 218.56 3,973,000 18.4% 616,000 45+ Years 314 293.48 829,000 338.18 956,000 15.2% 127,000
Composite 9,275 $ 125.70 $ 10,492,000 $ 148.86 $ 12,427,000 18.4% $ 1,935,000
June 2012 Current Current Proposed Proposed Percentage DollarRegion: 4 Population Enrollment Cap Rate Expenditures Cap Rate Expenditures Change Change
0 Thru 90 Days 3,981 $ 1,460.40 $ 52,325,000 $ 1,687.63 $ 60,466,000 15.6% $ 8,141,00091 Days Thru 1 Year 14,332 142.30 18,355,000 194.00 25,023,000 36.3% 6,668,000 2 Thru 5 Years 38,431 58.45 20,215,000 84.93 29,375,000 45.3% 9,160,000 6 Thru 13 Years 62,368 43.61 24,478,000 53.35 29,947,000 22.3% 5,469,000 14 Thru 20 Male 15,769 66.62 9,454,000 75.02 10,647,000 12.6% 1,193,000 14 Thru 20 Female 19,050 105.77 18,135,000 98.04 16,809,000 (7.3%) (1,326,000) 21 Thru 44 Male 3,159 111.42 3,168,000 128.31 3,648,000 15.2% 480,000 21 Thru 44 Female 38,608 156.40 54,346,000 171.10 59,454,000 9.4% 5,108,000 45+ Years 5,133 221.74 10,244,000 264.73 12,230,000 19.4% 1,986,000
Composite 200,831 $ 116.58 $ 210,720,000 $ 136.99 $ 247,599,000 17.5% $ 36,879,000
June 2012 Current Current Proposed Proposed Percentage DollarRegion: 5 Population Distribution Cap Rate Expenditures Cap Rate Expenditures Change Change
0 Thru 90 Days 152 $ 1,191.25 $ 1,630,000 $ 1,214.55 $ 1,662,000 2.0% $ 32,00091 Days Thru 1 Year 546 128.33 631,000 164.45 808,000 28.1% 177,000 2 Thru 5 Years 1,021 53.43 491,000 76.76 705,000 43.7% 214,000 6 Thru 13 Years 1,810 43.76 713,000 55.91 911,000 27.8% 198,000 14 Thru 20 Male 395 80.26 285,000 77.59 276,000 (3.3%) (9,000) 14 Thru 20 Female 459 105.13 434,000 98.21 406,000 (6.6%) (28,000) 21 Thru 44 Male 321 154.78 447,000 134.12 387,000 (13.3%) (60,000) 21 Thru 44 Female 1,102 162.82 1,615,000 187.02 1,855,000 14.9% 240,000 45+ Years 247 267.96 596,000 266.40 592,000 (0.6%) (4,000)
Composite 6,053 $ 125.58 $ 6,842,000 $ 139.54 $ 7,602,000 11.1% $ 760,000
All Region Member Months June 2012 Current Current Proposed Proposed Percentage DollarStatewide Population Enrollment Cap Rate Expenditures Cap Rate Expenditures Change Change
0 Thru 90 Days 4,285 $ 1,441.54 $ 55,593,000 $ 1,656.29 $ 63,875,000 14.9% $ 8,282,00091 Days Thru 1 Year 15,425 142.02 19,716,000 192.52 26,726,000 35.6% 7,010,000 2 Thru 5 Years 41,031 58.50 21,602,000 84.81 31,320,000 45.0% 9,718,000 6 Thru 13 Years 67,363 44.10 26,735,000 54.48 33,031,000 23.5% 6,296,000 14 Thru 20 Male 16,957 68.27 10,419,000 76.12 11,617,000 11.5% 1,198,000 14 Thru 20 Female 20,387 107.33 19,693,000 99.82 18,314,000 (7.0%) (1,379,000) 21 Thru 44 Male 3,987 118.00 4,234,000 132.95 4,771,000 12.7% 537,000 21 Thru 44 Female 41,949 157.98 59,644,000 173.94 65,668,000 10.1% 6,024,000 45+ Years 5,739 227.77 11,765,000 269.22 13,905,000 18.2% 2,140,000
Composite 217,123 $ 117.39 $ 229,401,000 $ 137.77 $ 269,227,000 17.4% $ 39,826,000
ENCLOSURE 2 Milliman, Inc. Page 1 of 2

3/26/20132:26 PM
State of IllinoisDepartment of Healthcare and Family Services
Delivery Rate ComparisonContract Period: 4/1/2013 - 12/31/2013
Monthly Current Current Proposed Proposed Percentage DollarPopulation Deliveries Cap Rate Expenditures Cap Rate Expenditures Change ChangeRegion 1 1 $ 3,755.59 $ 34,000 $ 3,538.04 $ 32,000 (5.8%) $ (2,000)
Region 2 1 3,585.62 32,000 3,399.92 31,000 (5.2%) (1,000)
Region 3 16 3,857.71 556,000 3,569.38 514,000 (7.5%) (42,000)
Region 4 344 4,425.10 13,700,000 4,501.14 13,936,000 1.7% 236,000
Region 5 12 3,988.78 431,000 3,812.33 412,000 (4.4%) (19,000)
Composite 374 $ 4,382.79 $ 14,753,000 $ 4,433.66 $ 14,925,000 1.2% $ 172,000
ENCLOSURE 2 Milliman, Inc. Page 2 of 2

T:\2013\ILM\3.038-ILM39\12-VMC Apr-Dec 2013 Capitation Rate Documentation-FINAL.doc
Milliman makes no representations or warranties regarding the contents of this letter to third parties. Likewise, third parties are instructed that they are to place no reliance upon this letter prepared for HFS by Milliman that would result in the creation of any duty or liability under any theory of law by Milliman or its employees to third parties. Other parties receiving this letter must rely upon their own experts in drawing conclusions about the HFS’s capitation rates, assumptions, and trends.
ENCLOSURE 3

T:\2013\ILM\3.038-ILM39\12-VMC Apr-Dec 2013 Capitation Rate Documentation-FINAL - Enc 3.doc
Milliman makes no representations or warranties regarding the contents of this letter to third parties. Likewise, third parties are instructed that they are to place no reliance upon this letter prepared for HFS by Milliman that would result in the creation of any duty or liability under any theory of law by Milliman or its employees to third parties. Other parties receiving this letter must rely upon their own experts in drawing conclusions about the capitation rates, assumptions, and trends.
STATE OF ILLINOIS DEPARTMENT OF HEALTHCARE AND FAMILY SERVICES
DATA BOOK
APRIL 1, 2013 – DECEMBER 31, 2013
VOLUNTARY MANAGED CARE PROGRAM FOR THE TANF POPULATION
March 26, 2013
Prepared by:
Milliman, Inc.
Robert M. Damler, FSA, MAAA Jennifer L. Gerstorff, ASA, MAAA

T:\2013\ILM\3.038-ILM39\12-VMC Apr-Dec 2013 Capitation Rate Documentation-FINAL - Enc 3.doc
Milliman makes no representations or warranties regarding the contents of this letter to third parties. Likewise, third parties are instructed that they are to place no reliance upon this letter prepared for HFS by Milliman that would result in the creation of any duty or liability under any theory of law by Milliman or its employees to third parties. Other parties receiving this letter must rely upon their own experts in drawing conclusions about the capitation rates, assumptions, and trends.
TABLE OF CONTENTS
I. Introduction ............................................................................................................ 3 II. Limitations & Data Reliance ................................................................................. 4
III. Actuarial Models .................................................................................................... 5 IV. Covered Population ................................................................................................ 7 V. Base Data Stratification ......................................................................................... 9 VI. Adjustments to Experience Data in Rate Development Process .......................... 11 Attachment 1: Illustration of Rate Development Methodology Attachment 2: Category of Service Definitions Attachment 3: State Fiscal Year 2010/2011 FFS Summaries
Attachment 4: Capitation Rate Development Summaries
Attachment 5: Current vs. Proposed Capitation Rate Comparison

VMC Data Book Apr-Dec 2013 Capitation Rates
Page 3
T:\2013\ILM\3.038-ILM39\12-VMC Apr-Dec 2013 Capitation Rate Documentation-FINAL - Enc 3.doc
Milliman makes no representations or warranties regarding the contents of this letter to third parties. Likewise, third parties are instructed that they are to place no reliance upon this letter prepared for HFS by Milliman that would result in the creation of any duty or liability under any theory of law by Milliman or its employees to third parties. Other parties receiving this letter must rely upon their own experts in drawing conclusions about the capitation rates, assumptions, and trends.
I. INTRODUCTION The State of Illinois, Department of Healthcare and Family Services (HFS) currently provides a voluntary managed care (VMC) program for the TANF-eligible population. This Data Book has been prepared by Milliman, Inc. (Milliman) under the direction of HFS to provide historical data and information to the health plans for contract rates for the VMC program. The contractors will be offered the enclosed capitation rates to be effective for the period of April 1, 2013 through December 31, 2013. The Data Book consists of a series of actuarial models which develop the contract capitation rates. The base data models include historical fee-for-service (FFS) claim experience. The final models include the capitation rates. The Data Book provides a series of actuarial models by category of service for each rate cell, region, and time period stratification.

VMC Data Book Apr-Dec 2013 Capitation Rates
Page 4
T:\2013\ILM\3.038-ILM39\12-VMC Apr-Dec 2013 Capitation Rate Documentation-FINAL - Enc 3.doc
Milliman makes no representations or warranties regarding the contents of this letter to third parties. Likewise, third parties are instructed that they are to place no reliance upon this letter prepared for HFS by Milliman that would result in the creation of any duty or liability under any theory of law by Milliman or its employees to third parties. Other parties receiving this letter must rely upon their own experts in drawing conclusions about the capitation rates, assumptions, and trends.
II. LIMITATIONS AND DATA RELIANCE The services provided for this project were performed under the contract extension between Milliman and HFS dated September 27, 2012. The information contained in the Data Book has been prepared for the State of Illinois, Department of Healthcare and Family Services (HFS) and their consultants and advisors. It is our understanding that the information contained in Data Book may be utilized in a public document. To the extent that the information contained in this document is provided to third parties, the document should be distributed in its entirety. Any user of the data must possess a certain level of expertise in actuarial science and healthcare modeling so as not to misinterpret the data presented. Milliman makes no representations or warranties regarding the contents of this document to third parties. Likewise, third parties are instructed that they are to place no reliance upon this document prepared for HFS by Milliman that would result in the creation of any duty or liability under any theory of law by Milliman or its employees to third parties. Other parties receiving this document must rely upon their own experts in drawing conclusions about the capitation rates, assumptions, and trends. The information contained in this Data Book was prepared as documentation of the capitation rates for the VMC program and to provide historical data and information to the health plans for contract rates for the TANF population. This information may not be appropriate for any other purpose. Although the capitation rates have been certified as actuarially sound, the capitation rates may not be appropriate for any individual health plan. The Data Book has been developed from data and information provided to Milliman by HFS. Although the data were reviewed for reasonableness, we have accepted the data without audit. To the extent the information provided to Milliman was not complete or accurate, the capitation rates presented in this letter may need to be modified. It should be emphasized that capitation rates are a projection of future costs based on a set of assumptions. Results will differ if actual experience is different from the assumptions contained in this document. HFS and Milliman provide no guarantee, either written or implied, that the data and information is 100% accurate or error free.

VMC Data Book Apr-Dec 2013 Capitation Rates
Page 5
T:\2013\ILM\3.038-ILM39\12-VMC Apr-Dec 2013 Capitation Rate Documentation-FINAL - Enc 3.doc
Milliman makes no representations or warranties regarding the contents of this letter to third parties. Likewise, third parties are instructed that they are to place no reliance upon this letter prepared for HFS by Milliman that would result in the creation of any duty or liability under any theory of law by Milliman or its employees to third parties. Other parties receiving this letter must rely upon their own experts in drawing conclusions about the capitation rates, assumptions, and trends.
III. ACTUARIAL MODELS The Data Book describes the development of the April 1, 2013 through December 31, 2013 capitation rates for the Voluntary Managed Care (VMC) Program for the TANF-eligible population. Actuarial models for base year data and capitation rates with detailed category of service definitions are provided as attachments to the Data Book. The following paragraphs provide a description of each of the actuarial models and attachments. The following sections of the Data Book provide the detailed methodology used in the development of actuarially sound capitation rates for the TANF-eligible population with reference to the actuarial models and attachments described in this section. The Data Book Attachments are listed below:
• Attachment 1: Illustration of Rate Development Methodology • Attachment 2: Category of Service Definitions
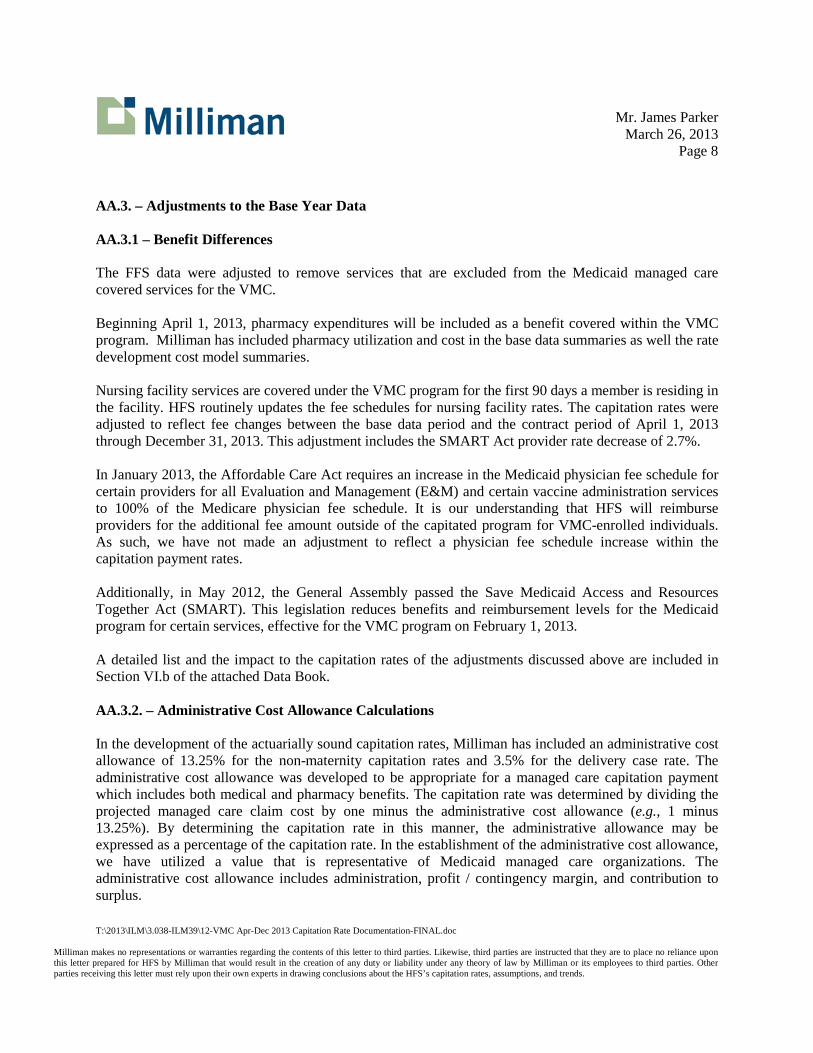
• Attachment 3: State Fiscal Year 2010/2011 FFS Summaries
• Attachment 4: Capitation Rate Development Summaries
• Attachment 5: Current vs. Proposed Capitation Rate Comparison
Attachment 1 contains an illustrative chart outlining the methodology that was used to develop the April 1, 2013 through December 31, 2013 capitation rates for the VMC program. Attachment 2 contains the category of service definitions included in the development of the capitation rates. The category of service definitions rely upon service category definitions contained in the detailed data extracts provided by HFS, as well as commonly defined Medicare DRGs, UB-92 revenue codes, CPT-4 codes, and HCPCS codes. Attachment 3 provides the historical experience for SFY 2010 and SFY 2011 for the FFS population on a service category and geographic region basis. For each year, utilization, average cost per service, and PMPM values are shown. Attachment 3 reflects only the population eligible to enroll in the VMC program. The composite cost model summaries are calculated using the June 2012 HMO enrollment distribution for consistency in comparison. Attachment 4 contains the SFY 2011 adjusted base experience and the projected contract period capitation rates for each rate cell and geographic region. The base data reflected in Attachment 4 were adjusted for completion and policy and program changes and trended forward to the SFY 2011 period. The SFY 2011 base utilization and cost per service rates are then trended forward to August 15, 2013 and adjusted for managed care efficiency and contractual arrangements between the managed care entities and healthcare providers. The resulting PMPM, after adjustment for completion, medical inflation, policy and program changes, and managed care adjustments establishes the regional adjusted claim cost for the health plans in the contract period. The non-claim items, such as administrative cost allowance and

VMC Data Book Apr-Dec 2013 Capitation Rates
Page 6
T:\2013\ILM\3.038-ILM39\12-VMC Apr-Dec 2013 Capitation Rate Documentation-FINAL - Enc 3.doc
Milliman makes no representations or warranties regarding the contents of this letter to third parties. Likewise, third parties are instructed that they are to place no reliance upon this letter prepared for HFS by Milliman that would result in the creation of any duty or liability under any theory of law by Milliman or its employees to third parties. Other parties receiving this letter must rely upon their own experts in drawing conclusions about the capitation rates, assumptions, and trends.
PCCM fee, are applied to the adjusted claim cost to develop the contract period capitation rates. The composite cost model summaries are calculated using the June 2012 HMO enrollment distribution for consistency in comparison. Attachment 5 compares the April 1, 2013 through December 31, 2013 proposed capitation rates with the current February through March 2013 capitation rates based on the estimated 2013 HMO contract period enrollment distribution by region. The comparison has been illustrated on a PMPM and total expenditure basis.

VMC Data Book Apr-Dec 2013 Capitation Rates
Page 7
T:\2013\ILM\3.038-ILM39\12-VMC Apr-Dec 2013 Capitation Rate Documentation-FINAL - Enc 3.doc
Milliman makes no representations or warranties regarding the contents of this letter to third parties. Likewise, third parties are instructed that they are to place no reliance upon this letter prepared for HFS by Milliman that would result in the creation of any duty or liability under any theory of law by Milliman or its employees to third parties. Other parties receiving this letter must rely upon their own experts in drawing conclusions about the capitation rates, assumptions, and trends.
IV. COVERED POPULATION The population has been divided into five geographic regions. The counties within each region are identified as: • Region 1 – Northwestern Illinois (Boone, Bureau, Carroll, DeKalb, Fulton, Henderson, Henry, Jo
Daviess, Knox, La Salle, Lee, Marshall, Mercer, Ogle, Peoria, Putnam, Rock Island, Stark, Stephenson, Tazewell, Warren, Whiteside, Winnebago, and Woodford)
• Region 2 – Central Illinois (Adams, Brown, Calhoun, Cass, Champaign, Christian, Clark, Coles, Cumberland, De Witt, Douglas, Edgar, Ford, Greene, Hancock, Iroquois, Jersey, Livingston, Logan, Macon, Macoupin, Mason, McDonough, McLean, Menard, Montgomery, Morgan, Moultrie, Piatt, Pike, Sangamon, Schuyler, Scott, Shelby, and Vermilion)
• Region 3 – Southern Illinois (Alexander, Bond, Clay, Clinton, Crawford, Edwards, Effingham, Fayette, Franklin, Gallatin, Hamilton, Hardin, Jackson, Jasper, Jefferson, Johnson, Lawrence, Madison, Marion, Massac, Monroe, Perry, Pope, Pulaski, Randolph, Richland, Saline, St Clair, Union, Wabash, Washington, Wayne, White, and Williamson)
• Region 4 – Chicago (Cook)
• Region 5 – Collar Counties (DuPage, Grundy, Kane, Kankakee, Kendall, Lake, McHenry, and Will)
In addition, the population has been stratified into nine distinct populations. Individuals were assigned a specific population category based on their age and gender. These nine rate cells are; • 0 through 90 days • 91 days through 1 year • 2 years through 5 years • 6 years through 13 years • 14 years through 20 years, male • 14 years through 20 years, female • 21 years through 44 years, male • 21 years through 44 years, female • 45 years and over

VMC Data Book Apr-Dec 2013 Capitation Rates
Page 8
T:\2013\ILM\3.038-ILM39\12-VMC Apr-Dec 2013 Capitation Rate Documentation-FINAL - Enc 3.doc
Milliman makes no representations or warranties regarding the contents of this letter to third parties. Likewise, third parties are instructed that they are to place no reliance upon this letter prepared for HFS by Milliman that would result in the creation of any duty or liability under any theory of law by Milliman or its employees to third parties. Other parties receiving this letter must rely upon their own experts in drawing conclusions about the capitation rates, assumptions, and trends.
The population is limited to those TANF individuals who are eligible to enroll in the VMC program. HFS excluded the following populations:
• Members residing in a long-term care facility • HMO enrolled members • Spend-down eligible population • Medicare eligible population • Members with significant third-party liability coverage • Retroactive eligibility periods • Initial enrollment periods • Members eligible for Waivers • SSI eligible children
Attachments 3 and 4 illustrate member months for each population and time period. An individual member month was assigned for each month a member was eligible.

VMC Data Book Apr-Dec 2013 Capitation Rates
Page 9
T:\2013\ILM\3.038-ILM39\12-VMC Apr-Dec 2013 Capitation Rate Documentation-FINAL - Enc 3.doc
Milliman makes no representations or warranties regarding the contents of this letter to third parties. Likewise, third parties are instructed that they are to place no reliance upon this letter prepared for HFS by Milliman that would result in the creation of any duty or liability under any theory of law by Milliman or its employees to third parties. Other parties receiving this letter must rely upon their own experts in drawing conclusions about the capitation rates, assumptions, and trends.
V. BASE DATA STRATIFICATION The base FFS experience for SFY 2010 and SFY 2011 included in each actuarial model reflects claims paid through June 2012. The historical expenditures were stratified using date of service, HFS assigned category of service, provider type, DRGs, revenue codes, CPT-4 codes, and HCPCS codes. The following provides additional details regarding the expenditures.
• Date of Service – The data have been stratified into state fiscal years which begin on July 1st and end on June 30th. The date of service was assigned to the fiscal year based on the first date of service. In the base data, if a hospital inpatient admission extended beyond the end of the fiscal year, all days of the admission were assigned to the fiscal year associated with the date of admission.
• Category of Service – Expenditures were stratified by the category of service assigned and maintained by HFS in the MMIS claim system. A list of category of service codes and descriptions is included in Attachment 2.
• Provider Type – Expenditures were stratified by provider type. The provider type includes hospital, physician, and ancillary services. The following provides additional information regarding the provider type.
o Hospital services were stratified between inpatient and outpatient services. Inpatient services include all services performed and billed on the hospital facility claim, including any outpatient services that may have occurred in conjunction with that inpatient admission. This would include emergency room services that may have been incurred if the individual was admitted to the hospital.
Hospital Inpatient services were allocated to individual categories of service
based on the DRG on the claim. Utilization rates have been shown for the number of admissions, length of stay, and days.
Hospital Outpatient services were allocated to individual categories of service based on the revenue codes on the claim. All line items on an individual claim were allocated to a single category of service. This is a result of the reimbursement method used by HFS. Utilization represents the number of hospital outpatient cases.
o Covered Nursing Facility services reflect nursing facility expenditures for the first 90
days of a nursing facility stay in a year. The nursing facility admission is not required to follow a hospitalization in order to be covered under the VMC program. All nursing facility expenditures beginning with the 91st day are excluded from the historical experience.

VMC Data Book Apr-Dec 2013 Capitation Rates
Page 10
T:\2013\ILM\3.038-ILM39\12-VMC Apr-Dec 2013 Capitation Rate Documentation-FINAL - Enc 3.doc
Milliman makes no representations or warranties regarding the contents of this letter to third parties. Likewise, third parties are instructed that they are to place no reliance upon this letter prepared for HFS by Milliman that would result in the creation of any duty or liability under any theory of law by Milliman or its employees to third parties. Other parties receiving this letter must rely upon their own experts in drawing conclusions about the capitation rates, assumptions, and trends.
o Physician services were stratified by CPT-4 code and HFS category of service. Milliman relied on the HFS category of service codes for several categories. Milliman performed additional stratifications for physician services by CPT-4 code to provide details regarding the services provided. Utilization represents the number of units on each individual claim. The current rates include 50% of the DMHDD/DASA category FFS cost on a per member per month basis. Claims expenditures associated with PCCM fees were included as a fixed $2.00 PMPM fee in the final rate development.
o Pharmacy services will be included in the VMC program as of April 1, 2013. Utilization for pharmacy services represents the number of individual prescriptions.
o Ancillary services were stratified by HCPCS code and HFS category of service.
Utilization for ancillary services represents the number of units on each individual claim.
Actuarial Modeling Each actuarial model illustrates annual utilization rates per 1,000, average cost per service, and per member per month claims cost developed using FFS data. Attachment 3 contains actuarial models for services incurred during SFY 2010 and SFY 2011, paid through June 2012. The following provides a brief description of each of the data fields. Attachment 4 contains actuarial models for the adjusted, trended base period data as well as the final capitation rates.
• Annual Utilization Per 1,000 – This value represents the annual utilization rates per 1,000 by type of service. The value was calculated by dividing the total units for each service category by the member months in the corresponding period and multiplying by 12 times 1,000.
• Average Cost Per Service – This value represents the net paid amount per unit of service. The value is net of third party liability recoveries and does not include adjustments to hospital payments for DSH.
• Member Months – This value represents the number of enrollee months in each rate cell during
each experience period. Each enrollee was assumed to be eligible for the entire month.
• PMPM – The per member per month (PMPM) value represents the net claim cost for each type of service. The value was calculated by multiplying the annual utilization per 1,000 times the average cost per service and dividing by the product of 12 times 1,000.

VMC Data Book Apr-Dec 2013 Capitation Rates
Page 11
T:\2013\ILM\3.038-ILM39\12-VMC Apr-Dec 2013 Capitation Rate Documentation-FINAL - Enc 3.doc
Milliman makes no representations or warranties regarding the contents of this letter to third parties. Likewise, third parties are instructed that they are to place no reliance upon this letter prepared for HFS by Milliman that would result in the creation of any duty or liability under any theory of law by Milliman or its employees to third parties. Other parties receiving this letter must rely upon their own experts in drawing conclusions about the capitation rates, assumptions, and trends.
VI. ADJUSTMENTS TO EXPERIENCE DATA IN RATE DEVELOPMENT PROCESS Adjustments were made to the base experience data to develop the April 1, 2013 through December 31, 2013 capitation rates. The following outlines each of the adjustments applied in development of the capitation rates. a. Completion Factors
Milliman used FFS data for services incurred from July 1, 2009 through June 30, 2011, paid through June 2012. Because of the significant claims run-out included in the analysis, applied completion adjustments were minimal. Milliman applied separate claim completion factors to the services incurred during SFY 2010 and SFY 2011. The claim completion factors were developed by service category and population, and have been applied to the base utilization amounts. Table 1 illustrates the aggregate impact to base claims data of the completion adjustments.
Table 1
State of Illinois
Department of Healthcare and Family Services Voluntary Managed Care Program for the TANF-eligible population
Aggregate Completion Impact
Category of Service SFY 2010
SFY 2011 Inpatient Hospital 0.00% 0.14% Outpatient Hospital 0.00% 0.01% Pharmacy 0.00% 0.04% Ancillary 0.00% 0.00% Professional 0.00% 0.00%
Total 0.00% 0.19%
b. Policy and Program Changes In January 2013, the Affordable Care Act requires an increase in the Medicaid physician fee schedule for certain providers for all Evaluation and Management (E&M) and certain vaccine administration services to 100% of the Medicare physician fee schedule. It is our understanding that HFS will reimburse providers for the additional fee amount outside of the capitated program for VMC-enrolled individuals. As such, we have not made an adjustment to reflect a physician fee schedule increase within the capitation payment rates

VMC Data Book Apr-Dec 2013 Capitation Rates
Page 12
T:\2013\ILM\3.038-ILM39\12-VMC Apr-Dec 2013 Capitation Rate Documentation-FINAL - Enc 3.doc
Milliman makes no representations or warranties regarding the contents of this letter to third parties. Likewise, third parties are instructed that they are to place no reliance upon this letter prepared for HFS by Milliman that would result in the creation of any duty or liability under any theory of law by Milliman or its employees to third parties. Other parties receiving this letter must rely upon their own experts in drawing conclusions about the capitation rates, assumptions, and trends.
We have not included an adjustment related to the Health Insurer Assessment fee established by the Affordable Care Act based on current guidance. The fee will be collected in 2014 and assessed on 2013 premium values. In May 2012, the General Assembly passed the Save Medicaid Access and Resources Together Act (SMART). This legislation reduces benefits and reimbursement levels for the Medicaid program for the following services, effective for the voluntary managed care program February 1, 2013: • Maximum copayments. Copayment adjustments were limited to the adult population. The full federally-allowable co-pays for all eligible services will be charged as the maximum allowable $3.65 for Inpatient Hospital, Physician, FQHC/RHC, Podiatric services, and Brand drugs; and $2.00 for Generic drugs. Currently applicable co-pays are $3.00 for hospital services, $2.00 for professional services, $3.00 for brand drugs, $0.00 for generic drugs, and $0.00 for FQHC & RHC encounters. An aggregate PMPM adjustment was made to the adult capitation rates to reflect the reduced claim expenditures expected due to the difference between the member copays reflected in the base claims data and the maximum copay amounts that will be charged.
• Elimination of adult chiropractic services. Medicaid participants under age 21 years will continue to receive coverage for spinal manipulation procedures to correct subluxations of the spine. Participants age 21 years and older will no longer receive chiropractic services. An adjustment was applied to the “Chiropractor” service category for adult rate groups to remove the utilization and cost of these services.
• Limitation of adult podiatry services. Claims submitted for participants who are age 21 years and older must include a primary diagnosis of diabetes (ICD-9-CM 259.xx range) and a secondary diagnosis code reflecting the condition being treated. An adjustment was applied to the “Podiatrist” service category for adults to remove the utilization and cost of these services for non-diabetic participants.
• Limitation of adult therapy services. An annual cap of 20 visits per discipline per fiscal year for physical, speech, and occupational therapy services has been implemented for participants who are age 21 years and older. An adjustment was applied to the “Other Professional” service category for adults to remove the utilization and cost of services in excess of 20 visits per year.
• Monthly prescription limit for pharmaceuticals. A prior approval for brand or generic prescriptions will be required for a client after a client has filled four prescriptions in a 30 day period. There will be exceptions to the limit for drugs for which a prescription limit isn’t logical. Examples are drugs such as antibiotics, total parenteral nutrition combinations, over-the-counter drugs, and non-drug items such as blood glucose test strips. The projected “Pharmacy” service category has been adjusted to limit the cost and utilization to reflect the removal of excess prescriptions during the period. The applied adjustment was reduced from the full impact adjustment to reflect the nature of the denial rate of the prior approval process.
• Incontinence supply quantity limit. The DME Fee Schedule has been revised to change maximum quantity for incontinence supplies from 300 per month to 200 per month. The following procedure codes are affected: T4521-T4535, T4541-T4543. An adjustment was applied to the “DME/Prosthetics/Orthotics” service category to reflect the expected reduction in utilization.

VMC Data Book Apr-Dec 2013 Capitation Rates
Page 13
T:\2013\ILM\3.038-ILM39\12-VMC Apr-Dec 2013 Capitation Rate Documentation-FINAL - Enc 3.doc
Milliman makes no representations or warranties regarding the contents of this letter to third parties. Likewise, third parties are instructed that they are to place no reliance upon this letter prepared for HFS by Milliman that would result in the creation of any duty or liability under any theory of law by Milliman or its employees to third parties. Other parties receiving this letter must rely upon their own experts in drawing conclusions about the capitation rates, assumptions, and trends.
• Institutional provider rate reductions. A 3.5% reduction to Medicaid reimbursement for hospital inpatient and outpatient services, excluding Safety Net Hospitals or Critical Access Hospitals, is effective during the contract period for these capitation rates. An adjustment was applied to the inpatient and outpatient hospital service categories for both non-maternity and maternity services to reflect the expected reduction in cost.
• General medical provider rate reductions. A 2.7% rate reduction to Medicaid reimbursement for audiologists, chiropractors, durable medical equipment and supplies providers, home health agencies, hospitals billing non-institutional FFS claims (including Safety Net and Critical Access hospitals), imaging centers, independent laboratories, independent diagnostic testing facilities, physical therapists, occupational therapists, optometrists (non-physician claim codes), opticians, optical companies, podiatrists, speech therapists, and transportation providers is effective during the contract period for these capitation rates. An adjustment was applied to ancillary and professional service categories for non-maternity services to reflect the expected reduction in cost. Nursing facility services are covered under the VMC program for the first 90 days a member is residing in the facility. HFS routinely updates the fee schedules for nursing facility rates. The capitation rates were adjusted to reflect fee changes between the base data period and the contract period of April 1, 2013 through December 31, 2013. This adjustment includes the SMART Act provider rate decrease of 2.7%. Table 2 below illustrates the total impact as a percentage of the capitation rates for each of the program adjustments by geographic region for adult rate groups, children rate groups, and maternity rates.

VMC Data Book Apr-Dec 2013 Capitation Rates
Page 14
T:\2013\ILM\3.038-ILM39\12-VMC Apr-Dec 2013 Capitation Rate Documentation-FINAL - Enc 3.doc
Milliman makes no representations or warranties regarding the contents of this letter to third parties. Likewise, third parties are instructed that they are to place no reliance upon this letter prepared for HFS by Milliman that would result in the creation of any duty or liability under any theory of law by Milliman or its employees to third parties. Other parties receiving this letter must rely upon their own experts in drawing conclusions about the capitation rates, assumptions, and trends.
Table 2
State of Illinois Department of Healthcare and Family Services
Summary of Policy and Program Change PMPM Impacts
Children Region 1 Region 2 Region 3 Region 4 Region 5 Incontinence Supply Limit 0.0% (0.1%) (0.1%) (0.1%) (0.1%) General Provider Rate Cuts (0.2%) (0.2%) (0.3%) (0.5%) (0.4%) Hospital Rate Cuts (1.2%) (1.2%) (1.7%) (2.0%) (1.9%) Nursing Facility Fee Change 0.0% 0.0% 0.0% 0.0% 0.0%
Adults
Region 1 Region 2 Region 3 Region 4 Region 5 Copayment Increase (0.7%) (0.8%) (1.3%) (1.1%) (0.7%) Chiropractic Benefit Cut (0.1%) 0.0% (0.1%) 0.0% 0.0% Podiatry Benefit Cut 0.0% 0.0% 0.0% 0.0% 0.0% PT/ST/OT Benefit Cut 0.0% 0.0% 0.0% 0.0% 0.0% Pharmacy Prescription Limit (0.5%) (0.6%) (0.6%) (0.4%) (0.3%) Incontinence Supply Limit 0.0% 0.0% 0.0% 0.0% 0.0% General Provider Rate Cuts (0.1%) (0.1%) (0.1%) (0.1%) (0.1%) Hospital Rate Cuts (0.6%) (0.6%) (0.5%) (0.4%) (0.4%) Nursing Facility Fee Change 0.0% 0.0% 0.0% 0.0% 0.0%
Maternity
Region 1 Region 2 Region 3 Region 4 Region 5 General Provider Rate Cuts 0.0% 0.0% 0.0% 0.0% 0.0% Hospital Rate Cuts (2.4%) (2.3%) (2.2%) (2.0%) (2.3%)
c. Managed Care Adjustments
Milliman calculated percentage adjustments to the FFS base experience data to reflect the utilization differential between the base experience and the levels targeted for the managed care environment. Milliman developed the targeted managed care utilization adjustments through review and analysis of the Milliman Medicaid Cost Guidelines (Guidelines) and other Milliman proprietary data. In addition to adjusting utilization rates to reflect healthcare management targets, Milliman correspondingly adjusted the average reimbursement rates to reflect changes in the mix / intensity of services due to the management of health care. The aggregate impact of non-pharmacy adjustments to the non-maternity managed care capitation rates was (10.7%). Additionally, we included an adjustment to pharmacy to reduce cost per script values by 20% for Region 4 and 5% for all other regions.

VMC Data Book Apr-Dec 2013 Capitation Rates
Page 15
T:\2013\ILM\3.038-ILM39\12-VMC Apr-Dec 2013 Capitation Rate Documentation-FINAL - Enc 3.doc
Milliman makes no representations or warranties regarding the contents of this letter to third parties. Likewise, third parties are instructed that they are to place no reliance upon this letter prepared for HFS by Milliman that would result in the creation of any duty or liability under any theory of law by Milliman or its employees to third parties. Other parties receiving this letter must rely upon their own experts in drawing conclusions about the capitation rates, assumptions, and trends.
For maternity case rate payments, Milliman calculated a managed care adjustment for deliveries based on a reduction of the cesarean section delivery rate. The FFS base experience reflected a 27% cesarean rate in Region 4 and 30% cesarean rate in all other Regions. The capitation rates include a cesarean rate target of 24% for Region 4 and 27% for all other regions. These adjustments result in an aggregate impact of (1.3%) to the maternity managed care capitation case rates.
d. Cost Trending / Inflation Trend rates were developed to adjust the current capitation rates to reflect changes in medical cost inflation. The trend rate adjustments were applied from the midpoint of the current rate period to the midpoint of the new contract period. The trend rates were developed from historical FFS claims and enrollment data incurred in state fiscal years 2008 through 2011 and paid through June 2012. The HMO enrolled population is comparable to the FFS population used in the development of the trend rates. The experience data were adjusted by the following factors: claims completion, fee screen changes, and changes in rate cell mix of the population. We performed exponential regression analysis and an ARIMA time-series forecast using the adjusted experience data to calculate historical and projected trend rate estimates. We also reviewed trend rates used in other programs as well as National Health Expenditure projections published by CMS. Table 3 illustrates our assumed trend rates by major category of service.
Table 3
State of Illinois Department of Healthcare and Family Services
Annual Trend Rates
Non-Delivery Rate Cell Inpatient Outpatient Rx Ancillary Physician NF 0 Thru 90 Days 3.0% 0.5% 6.0% 1.0% 1.0% 0.0% 91 Days Thru 1 Year 1.0% 0.5% 6.0% 1.0% 2.0% 0.0% 2 Thru 5 Years 1.0% 0.5% 6.0% 1.0% 2.0% 0.0% 6 Thru 13 Years 1.0% 0.5% 6.0% 1.0% 2.0% 0.0% 14 Thru 20 Male 1.5% 1.0% 6.0% 0.5% 1.5% 0.0% 14 Thru 20 Female 1.5% 1.0% 6.0% 0.5% 1.5% 0.0% 21 Thru 44 Male 0.5% 1.0% 6.0% 0.5% 1.0% 0.0% 21 Thru 44 Female 0.5% 1.0% 6.0% 0.5% 1.0% 0.0% 45+ Years 0.5% 1.0% 6.0% 0.5% 1.0% 0.0%

VMC Data Book Apr-Dec 2013 Capitation Rates
Page 16
T:\2013\ILM\3.038-ILM39\12-VMC Apr-Dec 2013 Capitation Rate Documentation-FINAL - Enc 3.doc
Milliman makes no representations or warranties regarding the contents of this letter to third parties. Likewise, third parties are instructed that they are to place no reliance upon this letter prepared for HFS by Milliman that would result in the creation of any duty or liability under any theory of law by Milliman or its employees to third parties. Other parties receiving this letter must rely upon their own experts in drawing conclusions about the capitation rates, assumptions, and trends.
Delivery
Category of Service Annual
Trend Rate Inpatient 1.0% Physician / Clinic 0.5%
e. Selection Adjustment
Through the selection process of the populations from the FFS experience, HFS has developed a data extract of the population that may voluntarily enroll with the health plans. Based on this process, it is anticipated that the morbidity of the FFS population would be consistent with the population that will enroll if the program were mandatory. Due to the voluntary nature of the managed care program, it can be expected that those who choose to enroll in the program will be healthier that those who remain in the FFS environment. We have quantified the historical selection differences between the FFS and managed care population using a risk adjustment methodology for pharmacy data gathered for both groups. We have included two adjustments to adjust the FFS experience to reflect the population that will be enrolled with the health plans: Non-Maternity Selection Adjustment and Newborn Adjustment. Non-Maternity Selection Adjustment Milliman developed selection adjustments to the base FFS experience to reflect the morbidity differences between HMO enrollees compared to the FFS population. Milliman collected eligibility and pharmacy claim experience for state fiscal years 2010 and 2011 for the FFS and HMO enrolled population to calculate the risk scores of the populations. Milliman used the Medicaid Rx risk adjustment tool to perform this analysis. The selection factors were developed separately for children and adults, with additional stratification within the child rate cells. Newborns and deliveries were excluded from the selection adjustment calculation. The results of the Medicaid Rx analysis reflect the total morbidity differences between the populations on an age and gender neutral basis. Milliman used the full selection factors to adjust the rates for each rate cell. Table 4 provides the selection adjustments implemented by rate cell.

VMC Data Book Apr-Dec 2013 Capitation Rates
Page 17
T:\2013\ILM\3.038-ILM39\12-VMC Apr-Dec 2013 Capitation Rate Documentation-FINAL - Enc 3.doc
Milliman makes no representations or warranties regarding the contents of this letter to third parties. Likewise, third parties are instructed that they are to place no reliance upon this letter prepared for HFS by Milliman that would result in the creation of any duty or liability under any theory of law by Milliman or its employees to third parties. Other parties receiving this letter must rely upon their own experts in drawing conclusions about the capitation rates, assumptions, and trends.
Table 4
State of Illinois Department of Healthcare and Family Services
Selection Adjustment Assumptions
Rate Cell Selection Adjustment 0 Thru 90 Days 0.0% 91 Days Thru 1 Year 0.0% 2 Thru 5 Years (11.3%) 6 Thru 13 Years (24.0%) 14 Thru 20 Male (25.8%) 14 Thru 20 Female (16.5%) 21 Thru 44 Male (13.8%) 21 Thru 44 Female (13.8%) 45+ Years (13.8%)
Newborn Selection Adjustment Milliman included an adjustment to the 0 thru 90 day rate cell to reflect the timing of managed care enrollment as compared to FFS. The primary cost component of this rate cell is the birth which occurs at month 0. As such, the cost of the HMO enrollees will be different from the FFS population to the extent that the HMO enrollees have a different proportion of month 0 enrollees. A morbidity adjustment of (10.0%) was applied to the 0 thru 90 day rate cell. This adjustment was calculated using newborn enrollment for ages 0 thru 90 days and segmenting the population between FFS and HMO member months. A cost curve by age month was used to determine the relative cost expected for this rate cell due to delayed enrollment in HMO for newborns.
f. Administrative Allowance In the development of the actuarially sound capitation rates, Milliman has included an administrative cost allowance of 13.25% for the non-maternity capitation rates and 3.5% for the delivery case rate. The administrative cost allowance was developed to be appropriate for a managed care capitation payment which includes both medical and pharmacy benefits. The capitation rate was determined by dividing the projected managed care claim cost by one minus the administrative cost allowance (e.g., 1 minus 13.25%). By determining the capitation rate in this manner, the administrative allowance may be expressed as a percentage of the capitation rate. In the establishment of the administrative cost allowance, we have utilized a value that is representative of Medicaid managed care organizations. The administrative cost allowance includes administration, profit/contingency margin, and contribution to surplus.

VMC Data Book Apr-Dec 2013 Capitation Rates
Page 18
T:\2013\ILM\3.038-ILM39\12-VMC Apr-Dec 2013 Capitation Rate Documentation-FINAL - Enc 3.doc
Milliman makes no representations or warranties regarding the contents of this letter to third parties. Likewise, third parties are instructed that they are to place no reliance upon this letter prepared for HFS by Milliman that would result in the creation of any duty or liability under any theory of law by Milliman or its employees to third parties. Other parties receiving this letter must rely upon their own experts in drawing conclusions about the capitation rates, assumptions, and trends.
g. PCCM Management Fee A $2.00 PCCM has been added to each rate cell to reflect fees that may be paid to primary care physicians for their participation in risk-based managed care.
h. Capitation Rate The capitation rate was calculated using the following formula. FFS Claims for included services
less Copay Adjustment PMPM plus Administrative Load equals Total Capitation Rate (effective April 1, 2013)
♦ ♦ ♦ ♦

T:\2013\ILM\3.038-ILM39\12-VMC Apr-Dec 2013 Capitation Rate Documentation-FINAL - Enc 3.doc
Milliman makes no representations or warranties regarding the contents of this letter to third parties. Likewise, third parties are instructed that they are to place no reliance upon this letter prepared for HFS by Milliman that would result in the creation of any duty or liability under any theory of law by Milliman or its employees to third parties. Other parties receiving this letter must rely upon their own experts in drawing conclusions about the capitation rates, assumptions, and trends.
ATTACHMENT 1

T:\2013\ILM\3.038-ILM39\12-VMC Apr-Dec 2013 Capitation Rate Documentation-FINAL - Enc 3.doc
Milliman makes no representations or warranties regarding the contents of this letter to third parties. Likewise, third parties are instructed that they are to place no reliance upon this letter prepared for HFS by Milliman that would result in the creation of any duty or liability under any theory of law by Milliman or its employees to third parties. Other parties receiving this letter must rely upon their own experts in drawing conclusions about the capitation rates, assumptions, and trends.
Base Experience Utilization, Cost Per Service, and Per Member Per Month
SFY 2010/2011 Fee For Service
Incomplete Data Adjustments (Service Category)
Policy and Program Adjustments (Service Category)
Trend to SFY 2011 Adjustments (Service Category)
SFY 2011 Utilization, Cost Per Service, and Per Member Per Month
Blended SFY 2011 Fee For Service
Managed Care Adjustments (Service Category)
Contract Period Utilization, Cost Per Service, and Per Member Per Month April 1, 2013 through December 31, 2013
Trend Adjustment to Contract Period Midpoint August 15, 2013
(Service Category)
April – December 2013 Base Capitation Rates
PCCM Fee
Administrative Cost Allowance
Blend Base Years

T:\2013\ILM\3.038-ILM39\12-VMC Apr-Dec 2013 Capitation Rate Documentation-FINAL - Enc 3.doc
Milliman makes no representations or warranties regarding the contents of this letter to third parties. Likewise, third parties are instructed that they are to place no reliance upon this letter prepared for HFS by Milliman that would result in the creation of any duty or liability under any theory of law by Milliman or its employees to third parties. Other parties receiving this letter must rely upon their own experts in drawing conclusions about the capitation rates, assumptions, and trends.
ATTACHMENT 2

3/26/20132:34 PM
State of IllinoisDepartment of Healthcare and Family Services
Voluntary Managed Care Program for TANF Population - Rate DevelopmentService Category Mapping
Category/Sub-Category Primary Criteria Secondary Criteria Unit Counting MethodologyInpatient Hospital
Medical/SurgicalDRG = 001-369, 392-424, 439-520, 524-579 Days
Well NewbornDRG = 391 Days
Other NewbornDRG = 385-390, 985-987, 989 Days
Maternity Non-DeliveryDRG = 376-384 Days
Psychiatric/Substance AbuseDRG = 425-438, 521-523 Days
Long Term CareProvider Type Code = 033, 038 Limited to first 90 days of nursing facility stay Days
Other InpatientAll other claims where CatgOfServiceCd = 020, 021, 022 Days
ATTACHMENT 2 Milliman, Inc. Page 1

3/26/20132:34 PM
State of IllinoisDepartment of Healthcare and Family Services
Voluntary Managed Care Program for TANF Population - Rate DevelopmentService Category Mapping
Category/Sub-Category Primary Criteria Secondary Criteria Unit Counting MethodologyOutpatient Hospital
Emergency RoomCatgOfServiceCd = 024, 025 ANDRevenue Code = 450-459, 981
Encounters
General OutpatientAll other CatgOfServiceCd = 024 Encounters
End-Stage Renal DiseaseAll other CatgOfServiceCd = 025 Encounters
ATTACHMENT 2 Milliman, Inc. Page 2

3/26/20132:34 PM
State of IllinoisDepartment of Healthcare and Family Services
Voluntary Managed Care Program for TANF Population - Rate DevelopmentService Category Mapping
Category/Sub-Category Primary Criteria Secondary Criteria Unit Counting MethodologyAncillary
Prescription DrugsCatgOfServiceCd = 040 Scripts
TransportationCatgOfServiceCd = 050, 051, 052, 053, 054, 055, 056 Claim Lines
DME/Prosthetics/OrthoticsCatgOfServiceCd = 041, 044, 048 Reported Units (EISServiceUnitsNbr)
Home Health/HospiceCatgOfServiceCd = 010, 016, 060, 066 Reported Units (EISServiceUnitsNbr)
Other AncillariesCatgOfServiceCd = 014 Reported Units (EISServiceUnitsNbr)
ATTACHMENT 2 Milliman, Inc. Page 3

3/26/20132:34 PM
State of IllinoisDepartment of Healthcare and Family Services
Voluntary Managed Care Program for TANF Population - Rate DevelopmentService Category Mapping
Category/Sub-Category Primary Criteria Secondary Criteria Unit Counting MethodologyPhysician
SurgeryProcedureCode = 10021-69020, 69100-69990, 92973-92974, 92980-93462, 93501-93533, 93580-93581, G0104-G0105, G0127, G0168-G0173, G0251, G0259, G0267, G0269, G0289-G0291, G0297-G0343, G0364, G0392-G0393, G0412-G0419, G0440-G0441, M0301, S0400, S0601, S2053-S2118, S2135-S2152, S2205-S2235, S2270-S2900, S9034
CatgOfServiceCd <> 004, 005, 011, 012, 013, 014, 017, 034, 035, 041, 044, 048, 058, 059
Claim Lines
AnesthesiaCatgOfServiceCd = 017 Claim Lines
Hospital Inpatient VisitsProcedureCode = 90816-99233, 99238-99239, 99251-99255, 99289-99318, 99356-99357, 99436-99440, 99464-99476, 99478-99480, G0390, G0406-G0408, G0425-G0427, S0310
CatgOfServiceCd <> 004, 005, 011, 012, 013, 014, 017, 034, 035, 041, 044, 048, 058, 059
Claim Lines
Office Visits/ConsultsProcedureCode = 98966-98969, 99201-99215, 99241-99245, 99324-99355, 99358-99359, 99361-99362, 99366-99380, 99441-99444, 99499, G0179-G0182, G0337, S0220-S0260, S0273-S0274
CatgOfServiceCd <> 004, 005, 011, 012, 013, 014, 017, 034, 035, 041, 044, 048, 058, 059
Reported Units (EISServiceUnitsNbr)
Well Baby Exams/Physical ExamsCatgOfServiceCd = 030ORProcedureCode = 99381-99435, 99460-99463, G0101-G0102, G0344, G0366-G0368, G0402-G0405, G0438-G0439, S0302, S0605-S0613
CatgOfServiceCd <> 004, 005, 011, 012, 013, 014, 017, 034, 035, 041, 044, 048, 058, 059
Reported Units (EISServiceUnitsNbr)
Emergency Room VisitsProcedureCode = 99217-99220, 99224-99226, 99234-99236, 99281-99288, G0378-G0384
CatgOfServiceCd <> 004, 005, 011, 012, 013, 014, 017, 034, 035, 041, 044, 048, 058, 059
Reported Units (EISServiceUnitsNbr)
Clinic Visits/ServicesCatgOfServiceCd = 026, 027, 028, 029 Reported Units (EISServiceUnitsNbr)
Radiology and PathologyProcedureCode = 70000-79999, 0066T, G0130, G0202-G0235, G0252, G0275-G0278, G0288, G0389, Q0092, R0070-R0076, S8030-S8037, S8042-S8092, S9024
CatgOfServiceCd <> 004, 005, 011, 012, 013, 014, 017, 034, 035, 041, 044, 048, 058, 059
Reported Units (EISServiceUnitsNbr)
Outpatient Behavioral HealthCatgOfServiceCd = 058, 059 ORProcedureCode = 90801-90815, 90845-90899, G0129, G0176-G0177, G0409-G0411, H0031-H0037, H0041-H0046, H1011, H2013-H2014, H2017-H2018, H2023-H2032, M0064, S0201, S3005, S9476-S9485
Reported Units (EISServiceUnitsNbr)
ATTACHMENT 2 Milliman, Inc. Page 4

3/26/20132:34 PM
State of IllinoisDepartment of Healthcare and Family Services
Voluntary Managed Care Program for TANF Population - Rate DevelopmentService Category Mapping
Category/Sub-Category Primary Criteria Secondary Criteria Unit Counting Methodology
MaternityCatgOfServiceCd = 018, 067 Non-Delivery claims with ProcedureCode not listed for above categories Reported Units (EISServiceUnitsNbr)
ChiropractorCatgOfServiceCd = 005 Reported Units (EISServiceUnitsNbr)
PodiatristCatgOfServiceCd = 004 Reported Units (EISServiceUnitsNbr)
Vision - EyeCare & EyewearExcluded from VMC benefits Reported Units (EISServiceUnitsNbr)
DMHDD/DASACatgOfServiceCd = 034, 035 Reported Units (EISServiceUnitsNbr)
Other ProfessionalAll other professional claims not assigned elsewhere Reported Units (EISServiceUnitsNbr)
ATTACHMENT 2 Milliman, Inc. Page 5

3/26/20132:34 PM
State of IllinoisDepartment of Healthcare and Family Services
Voluntary Managed Care Program for TANF Population - Rate DevelopmentService Category Mapping
Category/Sub-Category Primary Criteria Secondary Criteria Unit Counting MethodologyInpatient Hospital
Maternity DeliveriesDRG = 370-375 Days
Physician
Normal DeliveryProcedureCode = 59400-59414, 59610-59614 Claim Lines
Cesarean DeliveryProcedureCode = 59510-59515, 59618-59622 Claim Lines
ATTACHMENT 2 Milliman, Inc. Page 6

3/26/20132:34 PM
State of IllinoisDepartment of Healthcare and Family Services
HFS Service Category Codes
CatgOfServiceCd Definition Benefit Exclusions001 Physician Services002 Dental Services EXCLUDED003 Optometric Services EXCLUDED004 Podiatric Services005 Chiropractic Services006 Physicians Psychiatric Services EXCLUDED007 Development Therapy, Orientation and Mobility Services (Waivers)008 DSCC Counseling/Fragile Children EXCLUDED009 DCFS Rehab Option Services EXCLUDED010 Nursing service011 Physical Therapy Services012 Occupational Therapy Services013 Speech Therapy/Pathology Services014 Audiology Services015 Sitter Services EXCLUDED016 Home Health Aides EXCLUDED017 Anesthesia Services018 Midwife Services019 Genetic Counseling EXCLUDED020 Inpatient Hospital Services (General)021 Inpatient Hospital Services (Psychiatric)022 Inpatient Hospital Services (Physical Rehabilitation)023 Inpatient Hospital Services (ESRD) EXCLUDED024 Outpatient Services (General)025 Outpatient Services (ESRD)026 General Clinic Services027 Psychiatric Clinic Services (Type 'A')028 Psychiatric Clinic Services (Type 'B')028 Psychiatric Clinic Services (Type 'B')030 Healthy Kids Services031 Early Intervention Services EXCLUDED032 Environmental modifications (waiver) EXCLUDED033 Mental Health Clinic Option Services EXCLUDED034 Mental Health Rehab Option Services035 Alcohol and Substance Abuse Rehab. Services036 Juvenile Rehabilitation EXCLUDED037 Skilled Care - Hospital Residing EXCLUDED038 Exceptional Care FIRST 90 DAYS ONLY039 DD/MI Non-Acute Care - Hospital Residing EXCLUDED040 Pharmacy Services (Drug and OTC)041 Medical equipment/prosthetic devices042 Family planning service043 Clinical Laboratory Services044 Portable X-Ray Services045 Optical Supplies EXCLUDED046 Psychiatric Drugs EXCLUDED047 Targeted case management service (mental health) EXCLUDED048 Medical Supplies049 DCFS Targeted Case Management Services EXCLUDED050 Emergency Ambulance Transportation051 Non-Emergency Ambulance Transportation052 Medicar Transportation053 Taxicab Services054 Service Car055 Auto transportation (private)056 Other Transportation057 Nurse Practitioners Services058 Social work service059 Psychologist service060 Home Care061 General Inpatient EXCLUDED062 Continuous Care Nursing EXCLUDED063 Respite Care EXCLUDED064 Other Behavioral Health Services EXCLUDED065 LTC Full Medicare Coverage EXCLUDED066 Home Health Services067 All Kids application agent (valid on provider file only)068 Targeted case management service (early intervention)069 Subacute Care Program EXCLUDED070 LTC - Skilled FIRST 90 DAYS ONLY
ATTACHMENT 2 Milliman, Inc. Page 7

3/26/20132:34 PM
State of IllinoisDepartment of Healthcare and Family Services
HFS Service Category Codes
CatgOfServiceCd Definition Benefit Exclusions071 LTC - Intermediate FIRST 90 DAYS ONLY072 LTC--NF skilled (partial Medicare coverage) FIRST 90 DAYS ONLY073 LTC--ICF/MR EXCLUDED074 LTC--ICF/MR skilled pediatric EXCLUDED075 LTC - MI Recipient age 22-64 EXCLUDED076 LTC - Specialized Living Center - Intermediate MR EXCLUDED077 SOPF--MI recipient over 64 years of age EXCLUDED078 SOPF--MI recipient under 22 years of age EXCLUDED079 SOPF--MI recipient non-matchable EXCLUDED080 Rehabilitation option service (special LEA service) EXCLUDED081 Capitation Services EXCLUDED082 LTC--Developmental training (level I) EXCLUDED083 LTC--Developmental training (level II) EXCLUDED084 LTC--Developmental training (level III) EXCLUDED085 LTC - Recipient 22-64 in IMD not MI or MR EXCLUDED086 LTC SLF Dementia Care EXCLUDED087 LTC - Supportive Living Facility (Waivers) EXCLUDED088 LTC - MR Recipient between ages 21-65 EXCLUDED089 LTC - MR Recipient - Inappropriately Placed EXCLUDED090 Case Management EXCLUDED091 Homemaker EXCLUDED092 Agency Providers RN, LPN, CNA and Therapies EXCLUDED093 Individual Providers PA, RN, LPN, CNA and Therapies EXCLUDED094 Adult Day Health EXCLUDED095 Habilitation Services EXCLUDED096 Respite Care EXCLUDED097 Other HCFA Approved Services EXCLUDED098 Electronic Home Response/EHR Installation(MARS), MPE Certification(Provider) EXCLUDED099 Transplants EXCLUDED100 Genetic counseling102 Fluoride varnish
ATTACHMENT 2 Milliman, Inc. Page 8

T:\2013\ILM\3.038-ILM39\12-VMC Apr-Dec 2013 Capitation Rate Documentation-FINAL - Enc 3.doc
Milliman makes no representations or warranties regarding the contents of this letter to third parties. Likewise, third parties are instructed that they are to place no reliance upon this letter prepared for HFS by Milliman that would result in the creation of any duty or liability under any theory of law by Milliman or its employees to third parties. Other parties receiving this letter must rely upon their own experts in drawing conclusions about the capitation rates, assumptions, and trends.
ATTACHMENT 3

3/26/20132:36 PM
State of IllinoisDepartment of Healthcare and Family Services
VMC Base Data
Region: 1 Member Months: 38,123 Member Months: 36,226 Ratecell: 0 thru 90 days
Fiscal Year 2010 Fiscal Year 2011Average Average
Admits Length Utilization Cost per Admits Length Utilization Cost perType of Service Per 1,000 of Stay Per 1,000 Service PMPM Per 1,000 of Stay Per 1,000 Service PMPM
Inpatient HospitalMedical/Surgical 180.0 5.2 938.3 $ 1,771.22 $ 138.49 153.4 4.1 635.7 $ 1,947.81 $ 103.19Well Newborn 17.6 2.2 39.3 837.79 2.74 2.7 2.1 5.6 2,101.46 0.98 Other Newborn 1,002.9 6.9 6,959.9 1,797.86 1,042.74 1,011.0 7.0 7,027.2 1,765.89 1,034.10 Maternity Non-Delivery - - - - - - - - - - Psychiatric/Substance Abuse - - - - - - - - - - Long Term Care - - - - - - - - - - Other Inpatient - - - - - - - - - -
Subtotal 1,200.5 6.6 7,937.6 $ 1,789.94 $ 1,183.98 1,167.0 6.6 7,668.5 $ 1,781.21 $ 1,138.27
Outpatient HospitalGeneral Outpatient 318.2 255.57 6.78 316.0 260.10 6.85 Emergency Room 1,138.8 97.89 9.29 1,136.2 102.60 9.71 End-Stage Renal Disease - - - 1.0 1,586.26 0.13
Subtotal 1,457.1 $ 132.31 $ 16.07 1,453.2 $ 137.87 $ 16.70
AncillariesPrescription Drugs 3,266.7 37.26 10.14 3,192.6 42.84 11.40 Transportation 358.8 69.58 2.08 347.8 58.67 1.70 DME/Prosthetics/Orthotics 469.0 93.85 3.67 436.6 109.20 3.97 Home Health/Hospice 321.1 62.10 1.66 278.6 63.45 1.47 Other Ancillary 78.7 47.67 0.31 100.4 47.02 0.39
Subtotal 4,494.3 $ 47.70 $ 17.87 4,356.0 $ 52.17 $ 18.94
PhysicianSurgery 1,343.8 120.32 13.47 1,317.4 108.71 11.93 Anesthesia 101.4 252.98 2.14 84.8 234.72 1.66 Hospital Inpatient Visits 8,963.1 100.42 75.01 9,225.1 101.67 78.16 Office Visits/Consults 3,507.8 46.35 13.55 3,494.7 45.89 13.36 Well Baby Exams/Physical Exams 17,035.4 31.74 45.06 17,413.3 31.48 45.69 Emergency Room Visits 1,040.3 39.91 3.46 1,006.7 40.55 3.40 Clinic Visit/Services 2,815.3 94.26 22.11 3,136.3 93.54 24.45 Radiology and Pathology 26,360.5 5.60 12.30 26,379.7 5.27 11.58 Outpatient Behavioral Health 0.3 56.08 0.00 - - - Maternity 1.9 49.70 0.01 3.6 50.61 0.02 Chiropractor 51.6 10.48 0.05 62.3 10.51 0.05 Podiatrist 14.2 58.80 0.07 7.0 58.22 0.03 Vision - EyeCare & Eyewear - - - - - - Other Professional 3,537.4 19.62 5.78 4,641.5 16.67 6.45 DMHDD / DASA - - - - - - PCCM Fee - - - - - -
Subtotal 64,772.9 $ 35.76 $ 193.01 66,772.5 $ 35.36 $ 196.78
Total Claims/Benefit Cost 78,661.9 $ 215.24 $ 1,410.93 80,250.2 $ 204.96 $ 1,370.69
ATTACHMENT 3 Milliman, Inc.Page 1 of 50

3/26/20132:36 PM
State of IllinoisDepartment of Healthcare and Family Services
VMC Base Data
Region: 1 Member Months: 170,346 Member Months: 168,239 Ratecell: 91 days thru 1 Year
Fiscal Year 2010 Fiscal Year 2011Average Average
Admits Length Utilization Cost per Admits Length Utilization Cost perType of Service Per 1,000 of Stay Per 1,000 Service PMPM Per 1,000 of Stay Per 1,000 Service PMPM
Inpatient HospitalMedical/Surgical 67.3 3.6 240.1 $ 1,776.71 $ 35.55 65.3 3.6 235.6 $ 1,767.02 $ 34.69Well Newborn - - - - - - - - - - Other Newborn 0.4 10.5 4.2 1,510.24 0.53 0.3 7.7 2.3 2,961.97 0.57 Maternity Non-Delivery - - - - - - - - - - Psychiatric/Substance Abuse 0.1 2.0 0.2 1,703.51 0.03 - - - - - Long Term Care - - - - - - - - - - Other Inpatient - - - - - - - - - -
Subtotal 67.8 3.6 244.6 $ 1,771.35 $ 36.11 65.6 3.6 237.9 $ 1,778.57 $ 35.26
Outpatient HospitalGeneral Outpatient 157.6 306.94 4.03 164.1 392.81 5.37 Emergency Room 1,293.6 85.96 9.27 1,264.6 93.03 9.80 End-Stage Renal Disease 0.4 196.54 0.01 - - -
Subtotal 1,451.6 $ 109.98 $ 13.30 1,428.7 $ 127.46 $ 15.17
AncillariesPrescription Drugs 5,311.4 33.36 14.77 5,434.6 39.96 18.10 Transportation 194.8 42.86 0.70 184.6 50.35 0.77 DME/Prosthetics/Orthotics 423.8 88.22 3.12 402.2 89.70 3.01 Home Health/Hospice 64.7 85.78 0.46 60.7 70.75 0.36 Other Ancillary 52.1 27.02 0.12 68.9 27.14 0.16
Subtotal 6,046.8 $ 38.02 $ 19.16 6,151.0 $ 43.68 $ 22.39
PhysicianSurgery 169.5 167.67 2.37 186.2 149.05 2.31 Anesthesia 77.8 161.02 1.04 81.5 148.89 1.01 Hospital Inpatient Visits 417.7 74.36 2.59 395.4 76.68 2.53 Office Visits/Consults 3,356.3 45.65 12.77 3,360.4 45.07 12.62 Well Baby Exams/Physical Exams 8,409.2 23.65 16.57 8,597.9 23.57 16.89 Emergency Room Visits 1,138.4 35.22 3.34 1,078.3 35.61 3.20 Clinic Visit/Services 4,178.5 35.07 12.21 3,666.3 40.20 12.28 Radiology and Pathology 5,165.0 9.30 4.00 5,096.9 8.98 3.82 Outpatient Behavioral Health - - - 0.1 80.00 0.00 Maternity 4.6 49.77 0.02 3.6 49.53 0.01 Chiropractor 59.0 10.68 0.05 66.7 10.47 0.06 Podiatrist 4.4 36.96 0.01 4.9 31.36 0.01 Vision - EyeCare & Eyewear - - - - - - Other Professional 9,358.9 8.38 6.53 9,977.6 7.91 6.58 DMHDD / DASA - - - 0.1 59.63 0.00 PCCM Fee - - - - - -
Subtotal 32,339.4 $ 22.83 $ 61.52 32,515.8 $ 22.63 $ 61.33
Total Claims/Benefit Cost 40,082.4 $ 38.95 $ 130.09 40,333.4 $ 39.91 $ 134.15
ATTACHMENT 3 Milliman, Inc.Page 2 of 50

3/26/20132:36 PM
State of IllinoisDepartment of Healthcare and Family Services
VMC Base Data
Region: 1 Member Months: 334,014 Member Months: 339,271 Ratecell: 2 thru 5 Years
Fiscal Year 2010 Fiscal Year 2011Average Average
Admits Length Utilization Cost per Admits Length Utilization Cost perType of Service Per 1,000 of Stay Per 1,000 Service PMPM Per 1,000 of Stay Per 1,000 Service PMPM
Inpatient HospitalMedical/Surgical 27.8 2.8 76.5 $ 1,475.95 $ 9.41 23.9 3.1 74.7 $ 1,682.11 $ 10.47Well Newborn - - - - - - - - - - Other Newborn - - 0.2 2,830.95 0.05 - - 0.1 1,131.29 0.01 Maternity Non-Delivery - - - - - - - - - - Psychiatric/Substance Abuse 0.5 11.4 5.7 777.47 0.37 0.5 9.6 4.8 658.87 0.26 Long Term Care - - - - - - - - - - Other Inpatient - - 2.5 8,309.83 1.73 - - - - -
Subtotal 28.5 3.0 84.9 $ 1,633.48 $ 11.56 24.5 3.2 79.6 $ 1,619.72 $ 10.74
Outpatient HospitalGeneral Outpatient 113.0 383.02 3.61 106.4 441.76 3.92 Emergency Room 753.1 91.01 5.71 724.2 99.18 5.99 End-Stage Renal Disease - - - 0.3 1,483.89 0.04
Subtotal 866.1 $ 129.11 $ 9.32 830.9 $ 143.55 $ 9.94
AncillariesPrescription Drugs 3,611.3 41.34 12.44 3,634.1 41.19 12.47 Transportation 115.5 38.69 0.37 108.3 43.52 0.39 DME/Prosthetics/Orthotics 153.3 114.50 1.46 174.4 120.59 1.75 Home Health/Hospice 12.5 577.81 0.60 14.4 432.83 0.52 Other Ancillary 60.7 25.80 0.13 69.2 26.21 0.15
Subtotal 3,953.3 $ 45.56 $ 15.01 4,000.4 $ 45.86 $ 15.29
PhysicianSurgery 165.7 118.35 1.63 164.8 118.60 1.63 Anesthesia 64.5 148.07 0.80 60.6 149.50 0.75 Hospital Inpatient Visits 114.1 38.19 0.36 98.4 38.45 0.32 Office Visits/Consults 2,134.3 45.94 8.17 2,117.1 45.19 7.97 Well Baby Exams/Physical Exams 2,001.6 30.05 5.01 2,078.4 29.31 5.08 Emergency Room Visits 645.4 34.11 1.83 597.3 34.68 1.73 Clinic Visit/Services 3,232.3 22.53 6.07 3,020.3 24.24 6.10 Radiology and Pathology 3,486.4 8.57 2.49 3,433.1 8.46 2.42 Outpatient Behavioral Health 5.7 58.80 0.03 10.0 51.44 0.04 Maternity 3.3 49.54 0.01 2.4 50.84 0.01 Chiropractor 69.9 10.63 0.06 83.9 10.56 0.07 Podiatrist 4.1 38.10 0.01 7.4 42.11 0.03 Vision - EyeCare & Eyewear - - - - - - Other Professional 9,571.8 7.91 6.31 9,917.4 7.40 6.11 DMHDD / DASA 91.5 70.64 0.54 92.3 77.53 0.60 PCCM Fee - - - - - -
Subtotal 21,590.5 $ 18.53 $ 33.33 21,683.3 $ 18.18 $ 32.86
Total Claims/Benefit Cost 26,494.8 $ 31.35 $ 69.22 26,594.2 $ 31.06 $ 68.83
ATTACHMENT 3 Milliman, Inc.Page 3 of 50

3/26/20132:36 PM
State of IllinoisDepartment of Healthcare and Family Services
VMC Base Data
Region: 1 Member Months: 610,486 Member Months: 638,243 Ratecell: 6 thru 13 Years
Fiscal Year 2010 Fiscal Year 2011Average Average
Admits Length Utilization Cost per Admits Length Utilization Cost perType of Service Per 1,000 of Stay Per 1,000 Service PMPM Per 1,000 of Stay Per 1,000 Service PMPM
Inpatient HospitalMedical/Surgical 16.0 3.2 51.2 $ 1,546.47 $ 6.60 15.5 3.1 48.0 $ 1,749.16 $ 7.00Well Newborn - - - - - - - - - - Other Newborn - - - - - - - - - 0.00 Maternity Non-Delivery - - - - - - - - - - Psychiatric/Substance Abuse 11.0 10.4 114.7 686.06 6.56 8.7 11.4 99.3 706.40 5.85 Long Term Care - - - - - - - - - - Other Inpatient - - - - - - - - - -
Subtotal 27.0 6.1 165.9 $ 951.60 $ 13.16 24.2 6.1 147.3 $ 1,046.33 $ 12.84
Outpatient HospitalGeneral Outpatient 97.0 391.63 3.17 95.7 404.27 3.22 Emergency Room 489.1 98.24 4.00 464.0 107.60 4.16 End-Stage Renal Disease - - 0.00 - - -
Subtotal 586.2 $ 146.79 $ 7.17 559.7 $ 158.32 $ 7.38
AncillariesPrescription Drugs 4,715.7 77.44 30.43 4,850.2 81.14 32.80 Transportation 99.8 45.78 0.38 155.2 31.42 0.41 DME/Prosthetics/Orthotics 126.7 134.79 1.42 156.1 123.54 1.61 Home Health/Hospice 13.2 251.19 0.28 10.3 511.13 0.44 Other Ancillary 26.1 21.86 0.05 28.4 23.68 0.06
Subtotal 4,981.5 $ 78.43 $ 32.56 5,200.2 $ 81.47 $ 35.31
PhysicianSurgery 149.4 126.26 1.57 146.2 122.58 1.49 Anesthesia 40.5 154.13 0.52 40.3 158.52 0.53 Hospital Inpatient Visits 147.4 31.38 0.39 139.9 32.38 0.38 Office Visits/Consults 1,666.5 46.55 6.47 1,657.2 45.93 6.34 Well Baby Exams/Physical Exams 782.9 32.67 2.13 773.0 33.20 2.14 Emergency Room Visits 423.0 34.89 1.23 390.9 35.36 1.15 Clinic Visit/Services 3,052.8 18.26 4.65 2,883.5 20.22 4.86 Radiology and Pathology 2,488.4 9.86 2.04 2,637.5 9.66 2.12 Outpatient Behavioral Health 80.0 40.97 0.27 92.9 41.27 0.32 Maternity 1.7 51.69 0.01 1.3 50.23 0.01 Chiropractor 98.0 10.63 0.09 110.2 10.60 0.10 Podiatrist 22.6 42.26 0.08 21.4 43.26 0.08 Vision - EyeCare & Eyewear - - - - - - Other Professional 8,689.4 3.18 2.30 9,150.5 3.31 2.52 DMHDD / DASA 648.9 72.25 3.91 678.4 72.10 4.08 PCCM Fee - - - - - -
Subtotal 18,291.7 $ 16.83 $ 25.65 18,723.3 $ 16.74 $ 26.12
Total Claims/Benefit Cost 24,025.3 $ 39.23 $ 78.53 24,630.5 $ 39.78 $ 81.65
ATTACHMENT 3 Milliman, Inc.Page 4 of 50

3/26/20132:36 PM
State of IllinoisDepartment of Healthcare and Family Services
VMC Base Data
Region: 1 Member Months: 167,324 Member Months: 173,662 Ratecell: 14 thru 20 Male
Fiscal Year 2010 Fiscal Year 2011Average Average
Admits Length Utilization Cost per Admits Length Utilization Cost perType of Service Per 1,000 of Stay Per 1,000 Service PMPM Per 1,000 of Stay Per 1,000 Service PMPM
Inpatient HospitalMedical/Surgical 23.7 3.6 85.6 $ 2,139.16 $ 15.26 20.7 3.6 75.3 $ 1,818.10 $ 11.41Well Newborn - - - - - - - - - - Other Newborn - - - - - - - - - - Maternity Non-Delivery - - - - - - - - - - Psychiatric/Substance Abuse 26.2 8.6 226.4 640.77 12.09 22.2 10.0 220.9 653.30 12.03 Long Term Care 0.1 7.0 0.7 113.25 0.01 0.3 28.0 8.4 138.06 0.10 Other Inpatient 0.2 25.5 5.1 5,262.20 2.24 - - - - -
Subtotal 50.1 6.3 317.8 $ 1,117.37 $ 29.59 43.1 7.1 304.6 $ 927.04 $ 23.53
Outpatient HospitalGeneral Outpatient 153.0 413.72 5.27 145.8 411.02 4.99 Emergency Room 591.2 116.98 5.76 545.1 125.97 5.72 End-Stage Renal Disease 1.1 3,190.90 0.29 1.0 2,087.17 0.17
Subtotal 745.3 $ 182.43 $ 11.33 691.9 $ 188.87 $ 10.89
AncillariesPrescription Drugs 5,180.3 81.38 35.13 5,169.4 90.49 38.98 Transportation 293.9 41.61 1.02 428.8 30.20 1.08 DME/Prosthetics/Orthotics 129.5 111.81 1.21 148.4 112.46 1.39 Home Health/Hospice 10.8 62.32 0.06 10.1 77.13 0.06 Other Ancillary 6.4 26.95 0.01 8.8 26.31 0.02
Subtotal 5,620.9 $ 79.90 $ 37.43 5,765.5 $ 86.45 $ 41.53
PhysicianSurgery 208.1 143.70 2.49 198.3 143.00 2.36 Anesthesia 45.3 170.56 0.64 41.2 176.81 0.61 Hospital Inpatient Visits 282.2 30.11 0.71 259.9 30.68 0.66 Office Visits/Consults 1,387.5 46.35 5.36 1,375.9 45.60 5.23 Well Baby Exams/Physical Exams 617.0 37.81 1.94 621.1 38.45 1.99 Emergency Room Visits 507.3 37.04 1.57 462.3 37.76 1.45 Clinic Visit/Services 3,148.7 17.71 4.65 3,013.9 19.19 4.82 Radiology and Pathology 3,158.1 12.45 3.28 3,114.5 12.28 3.19 Outpatient Behavioral Health 137.8 44.55 0.51 141.7 42.88 0.51 Maternity 1.9 50.29 0.01 0.8 47.51 0.00 Chiropractor 135.6 10.40 0.12 146.9 10.25 0.13 Podiatrist 45.0 49.05 0.18 40.4 50.31 0.17 Vision - EyeCare & Eyewear - - - - - - Other Professional 8,284.1 3.45 2.38 8,740.2 3.32 2.42 DMHDD / DASA 2,733.6 111.12 25.31 2,297.8 122.10 23.38 PCCM Fee - - - - - -
Subtotal 20,692.2 $ 28.51 $ 49.16 20,454.8 $ 27.53 $ 46.92
Total Claims/Benefit Cost 27,376.2 $ 55.89 $ 127.51 27,216.8 $ 54.18 $ 122.87
ATTACHMENT 3 Milliman, Inc.Page 5 of 50

3/26/20132:36 PM
State of IllinoisDepartment of Healthcare and Family Services
VMC Base Data
Region: 1 Member Months: 192,768 Member Months: 196,405 Ratecell: 14 thru 20 Female
Fiscal Year 2010 Fiscal Year 2011Average Average
Admits Length Utilization Cost per Admits Length Utilization Cost perType of Service Per 1,000 of Stay Per 1,000 Service PMPM Per 1,000 of Stay Per 1,000 Service PMPM
Inpatient HospitalMedical/Surgical 27.0 2.8 75.8 $ 1,879.42 $ 11.87 24.6 3.6 89.4 $ 1,846.19 $ 13.75Well Newborn - - - - - - - - - - Other Newborn - - - - - - - - - - Maternity Non-Delivery 13.4 2.9 39.4 534.99 1.76 13.0 2.8 36.0 747.20 2.24 Psychiatric/Substance Abuse 27.6 8.7 241.0 605.62 12.16 27.0 9.0 241.9 639.44 12.89 Long Term Care - - - - - - - - - - Other Inpatient - - - - - - - - - -
Subtotal 68.0 5.2 356.2 $ 868.87 $ 25.79 64.5 5.7 367.4 $ 943.47 $ 28.89
Outpatient HospitalGeneral Outpatient 387.5 280.89 9.07 373.1 307.24 9.55 Emergency Room 962.0 117.07 9.39 919.2 127.41 9.76 End-Stage Renal Disease - - - - - -
Subtotal 1,349.4 $ 164.12 $ 18.46 1,292.3 $ 179.33 $ 19.31
AncillariesPrescription Drugs 7,397.0 49.25 30.36 7,349.1 52.82 32.35 Transportation 327.5 45.57 1.24 418.6 39.93 1.39 DME/Prosthetics/Orthotics 167.3 108.04 1.51 177.9 107.01 1.59 Home Health/Hospice 13.3 53.44 0.06 25.3 75.75 0.16 Other Ancillary 7.1 27.06 0.02 7.6 26.92 0.02
Subtotal 7,912.3 $ 50.33 $ 33.18 7,978.5 $ 53.40 $ 35.50
PhysicianSurgery 218.3 138.11 2.51 217.2 136.83 2.48 Anesthesia 118.5 234.05 2.31 116.1 247.41 2.39 Hospital Inpatient Visits 327.0 31.59 0.86 375.3 31.99 1.00 Office Visits/Consults 2,343.4 44.23 8.64 2,299.4 43.63 8.36 Well Baby Exams/Physical Exams 742.3 37.14 2.30 773.0 36.53 2.35 Emergency Room Visits 845.8 39.53 2.79 802.8 40.13 2.68 Clinic Visit/Services 3,905.1 30.46 9.91 3,728.8 30.97 9.62 Radiology and Pathology 10,485.9 12.67 11.07 10,104.9 12.29 10.35 Outpatient Behavioral Health 129.0 45.45 0.49 136.1 47.27 0.54 Maternity 70.2 45.95 0.27 122.7 45.63 0.47 Chiropractor 223.5 10.17 0.19 215.6 10.28 0.18 Podiatrist 30.8 47.94 0.12 42.9 44.39 0.16 Vision - EyeCare & Eyewear - - - - - - Other Professional 9,809.3 11.29 9.23 10,062.0 10.00 8.38 DMHDD / DASA 1,464.6 95.57 11.66 1,395.0 99.56 11.57 PCCM Fee - - - - - -
Subtotal 30,713.6 $ 24.36 $ 62.35 30,391.9 $ 23.91 $ 60.55
Total Claims/Benefit Cost 40,331.5 $ 41.59 $ 139.78 40,030.1 $ 43.24 $ 144.25
ATTACHMENT 3 Milliman, Inc.Page 6 of 50

3/26/20132:36 PM
State of IllinoisDepartment of Healthcare and Family Services
VMC Base Data
Region: 1 Member Months: 123,318 Member Months: 129,384 Ratecell: 21 thru 44 Male
Fiscal Year 2010 Fiscal Year 2011Average Average
Admits Length Utilization Cost per Admits Length Utilization Cost perType of Service Per 1,000 of Stay Per 1,000 Service PMPM Per 1,000 of Stay Per 1,000 Service PMPM
Inpatient HospitalMedical/Surgical 57.8 3.4 198.3 $ 2,518.15 $ 41.61 66.2 3.6 240.1 $ 2,389.51 $ 47.81Well Newborn - - - - - - - - - - Other Newborn - - - - - - - - - - Maternity Non-Delivery 0.2 1.5 0.3 703.97 0.02 0.1 1.0 0.1 1,043.24 0.01 Psychiatric/Substance Abuse 17.9 3.7 67.0 411.81 2.30 13.4 4.2 56.2 397.44 1.86 Long Term Care 1.0 18.3 18.3 117.74 0.18 0.6 21.7 13.0 106.06 0.11 Other Inpatient - - - - - 0.1 16.0 1.6 3,502.37 0.47
Subtotal 76.9 3.7 283.9 $ 1,864.41 $ 44.11 80.5 3.9 311.0 $ 1,939.37 $ 50.26
Outpatient HospitalGeneral Outpatient 410.1 408.58 13.96 434.8 408.99 14.82 Emergency Room 945.6 126.59 9.98 965.6 137.44 11.06 End-Stage Renal Disease 8.8 829.10 0.61 5.4 699.21 0.31
Subtotal 1,364.4 $ 215.89 $ 24.55 1,405.8 $ 223.58 $ 26.19
AncillariesPrescription Drugs 10,100.8 49.69 41.82 10,759.3 50.29 45.09 Transportation 257.3 50.44 1.08 331.8 47.16 1.30 DME/Prosthetics/Orthotics 384.3 80.99 2.59 453.5 82.57 3.12 Home Health/Hospice 53.2 68.51 0.30 73.4 62.70 0.38 Other Ancillary 13.4 24.96 0.03 12.7 27.18 0.03
Subtotal 10,809.0 $ 50.88 $ 45.83 11,630.7 $ 51.51 $ 49.92
PhysicianSurgery 351.3 198.21 5.80 374.4 190.98 5.96 Anesthesia 84.4 178.05 1.25 86.9 186.42 1.35 Hospital Inpatient Visits 323.3 39.94 1.08 387.9 38.30 1.24 Office Visits/Consults 1,914.3 48.31 7.71 1,907.8 46.89 7.45 Well Baby Exams/Physical Exams 27.4 85.92 0.20 22.0 85.37 0.16 Emergency Room Visits 824.7 39.93 2.74 814.6 41.07 2.79 Clinic Visit/Services 2,945.0 21.55 5.29 3,025.0 22.38 5.64 Radiology and Pathology 5,700.2 12.81 6.09 6,188.2 12.59 6.49 Outpatient Behavioral Health 89.7 45.41 0.34 101.8 44.24 0.38 Maternity 1.4 80.04 0.01 0.8 52.83 0.00 Chiropractor 341.1 8.67 0.25 327.5 8.67 0.24 Podiatrist 44.2 43.49 0.16 50.2 46.12 0.19 Vision - EyeCare & Eyewear - - - - - - Other Professional 7,868.4 5.70 3.74 8,400.8 5.74 4.02 DMHDD / DASA 702.5 69.66 4.08 787.5 67.06 4.40 PCCM Fee - - - - - -
Subtotal 21,217.7 $ 21.90 $ 38.72 22,475.4 $ 21.52 $ 40.30
Total Claims/Benefit Cost 33,675.0 $ 54.60 $ 153.21 35,822.9 $ 55.84 $ 166.68
ATTACHMENT 3 Milliman, Inc.Page 7 of 50

3/26/20132:36 PM
State of IllinoisDepartment of Healthcare and Family Services
VMC Base Data
Region: 1 Member Months: 443,265 Member Months: 460,736 Ratecell: 21 thru 44 Female
Fiscal Year 2010 Fiscal Year 2011Average Average
Admits Length Utilization Cost per Admits Length Utilization Cost perType of Service Per 1,000 of Stay Per 1,000 Service PMPM Per 1,000 of Stay Per 1,000 Service PMPM
Inpatient HospitalMedical/Surgical 56.3 2.9 164.4 $ 1,810.47 $ 24.80 57.9 3.1 178.6 $ 1,732.91 $ 25.79Well Newborn - - - - - - - - - - Other Newborn - - 0.1 210.38 0.00 - - - - - Maternity Non-Delivery 22.9 2.9 67.5 618.80 3.48 21.4 3.2 68.4 688.61 3.93 Psychiatric/Substance Abuse 16.0 4.2 67.9 388.66 2.20 14.6 4.2 61.0 456.48 2.32 Long Term Care 0.5 15.4 7.7 106.74 0.07 0.4 16.8 6.7 117.41 0.07 Other Inpatient - - - - - - - 0.4 4,848.99 0.16
Subtotal 95.7 3.2 307.6 $ 1,191.95 $ 30.55 94.4 3.3 315.2 $ 1,228.33 $ 32.26
Outpatient HospitalGeneral Outpatient 788.7 322.64 21.21 760.5 338.07 21.43 Emergency Room 1,337.9 130.96 14.60 1,338.9 138.75 15.48 End-Stage Renal Disease 2.7 543.23 0.12 1.7 621.28 0.09
Subtotal 2,129.4 $ 202.47 $ 35.93 2,101.1 $ 211.28 $ 36.99
AncillariesPrescription Drugs 15,131.7 44.72 56.40 15,344.2 44.56 56.98 Transportation 335.7 49.67 1.39 375.7 47.61 1.49 DME/Prosthetics/Orthotics 297.4 90.54 2.24 330.9 88.89 2.45 Home Health/Hospice 34.0 65.60 0.19 45.3 65.26 0.25 Other Ancillary 8.5 25.33 0.02 10.6 26.42 0.02
Subtotal 15,807.2 $ 45.73 $ 60.23 16,106.7 $ 45.59 $ 61.19
PhysicianSurgery 512.2 168.23 7.18 514.8 170.78 7.33 Anesthesia 226.9 205.13 3.88 223.3 215.00 4.00 Hospital Inpatient Visits 368.3 37.51 1.15 391.4 36.57 1.19 Office Visits/Consults 3,286.9 45.42 12.44 3,142.7 44.85 11.75 Well Baby Exams/Physical Exams 415.2 51.65 1.79 435.0 49.70 1.80 Emergency Room Visits 1,188.3 41.19 4.08 1,168.0 41.84 4.07 Clinic Visit/Services 4,363.0 34.72 12.62 4,361.8 34.24 12.45 Radiology and Pathology 16,224.7 14.02 18.95 16,460.3 13.60 18.66 Outpatient Behavioral Health 137.9 43.12 0.50 151.0 42.55 0.54 Maternity 79.1 46.81 0.31 157.9 45.75 0.60 Chiropractor 484.3 8.79 0.35 510.7 8.80 0.37 Podiatrist 66.1 44.08 0.24 69.4 44.33 0.26 Vision - EyeCare & Eyewear - - - - - - Other Professional 10,322.4 15.53 13.36 10,367.1 13.48 11.65 DMHDD / DASA 945.7 67.99 5.36 971.7 68.93 5.58 PCCM Fee - - - - - -
Subtotal 38,621.0 $ 25.55 $ 82.22 38,925.1 $ 24.74 $ 80.24
Total Claims/Benefit Cost 56,865.2 $ 44.09 $ 208.93 57,448.1 $ 44.01 $ 210.69
ATTACHMENT 3 Milliman, Inc.Page 8 of 50

3/26/20132:36 PM
State of IllinoisDepartment of Healthcare and Family Services
VMC Base Data
Region: 1 Member Months: 95,470 Member Months: 104,896 Ratecell: 45+ Years
Fiscal Year 2010 Fiscal Year 2011Average Average
Admits Length Utilization Cost per Admits Length Utilization Cost perType of Service Per 1,000 of Stay Per 1,000 Service PMPM Per 1,000 of Stay Per 1,000 Service PMPM
Inpatient HospitalMedical/Surgical 122.7 4.3 531.2 $ 1,933.76 $ 85.60 117.4 4.2 490.8 $ 2,144.25 $ 87.70Well Newborn - - - - - - - - - - Other Newborn - - - - - - - - - - Maternity Non-Delivery - - - - - 0.5 3.4 1.7 406.68 0.06 Psychiatric/Substance Abuse 12.8 4.5 58.2 392.11 1.90 12.8 4.8 61.2 472.34 2.41 Long Term Care 3.0 15.0 45.1 111.30 0.42 2.7 18.3 49.4 113.25 0.47 Other Inpatient - - - - - - - - - -
Subtotal 138.5 4.6 634.5 $ 1,662.81 $ 87.92 133.4 4.5 603.1 $ 1,803.34 $ 90.63
Outpatient HospitalGeneral Outpatient 966.6 387.13 31.18 910.0 385.88 29.26 Emergency Room 788.5 149.57 9.83 766.5 159.43 10.18 End-Stage Renal Disease 35.3 573.80 1.69 30.8 718.39 1.84
Subtotal 1,790.4 $ 286.19 $ 42.70 1,707.3 $ 290.21 $ 41.29
AncillariesPrescription Drugs 24,718.2 51.74 106.57 25,595.5 50.88 108.52 Transportation 863.8 24.75 1.78 956.5 25.59 2.04 DME/Prosthetics/Orthotics 1,078.6 68.55 6.16 1,169.2 67.76 6.60 Home Health/Hospice 200.9 77.34 1.29 199.5 73.51 1.22 Other Ancillary 18.1 26.23 0.04 22.8 27.28 0.05
Subtotal 26,879.5 $ 51.72 $ 115.85 27,943.4 $ 50.86 $ 118.43
PhysicianSurgery 761.7 209.15 13.28 760.8 195.74 12.41 Anesthesia 183.5 166.95 2.55 177.1 175.41 2.59 Hospital Inpatient Visits 761.1 37.18 2.36 729.0 37.75 2.29 Office Visits/Consults 3,406.3 48.17 13.67 3,298.0 47.03 12.93 Well Baby Exams/Physical Exams 111.9 81.65 0.76 119.8 80.08 0.80 Emergency Room Visits 706.0 44.81 2.64 677.5 45.76 2.58 Clinic Visit/Services 3,591.6 35.15 10.52 3,425.4 35.18 10.04 Radiology and Pathology 13,072.9 12.42 13.53 13,221.9 12.35 13.61 Outpatient Behavioral Health 154.2 38.27 0.49 143.2 37.46 0.45 Maternity 0.4 32.94 0.00 1.4 37.75 0.00 Chiropractor 498.5 8.68 0.36 466.7 8.68 0.34 Podiatrist 148.3 40.17 0.50 165.4 45.35 0.63 Vision - EyeCare & Eyewear - - - - - - Other Professional 9,264.8 13.84 10.68 9,525.2 16.16 12.83 DMHDD / DASA 819.4 56.35 3.85 894.3 64.14 4.78 PCCM Fee - - - - - -
Subtotal 33,480.6 $ 26.95 $ 75.19 33,605.6 $ 27.24 $ 76.28
Total Claims/Benefit Cost 62,785.0 $ 61.48 $ 321.66 63,859.4 $ 61.38 $ 326.63
ATTACHMENT 3 Milliman, Inc.Page 9 of 50

3/26/20132:36 PM
State of IllinoisDepartment of Healthcare and Family Services
VMC Base Data
Region: 1 Member Months: 2,175,114 Member Months: 2,247,062 Composite
Fiscal Year 2010 Fiscal Year 2011Average Average
Admits Length Utilization Cost per Admits Length Utilization Cost perType of Service Per 1,000 of Stay Per 1,000 Service PMPM Per 1,000 of Stay Per 1,000 Service PMPM
Inpatient HospitalMed/Surg 48.1 3.6 172.0 $ 1,847.39 $ 26.48 46.7 3.5 164.4 $ 1,900.23 $ 26.04Well Newborn 0.6 2.2 1.4 837.79 0.10 0.1 2.1 0.2 2,101.46 0.04 Other Newborn 36.6 6.9 254.1 1,797.21 38.05 36.9 7.0 256.2 1,767.29 37.74 Maternity Non-Delivery 6.0 2.9 17.6 605.84 0.89 5.6 3.1 17.6 695.95 1.02 Psychiatric/Substance Abuse 11.4 6.9 78.7 579.82 3.80 9.9 7.3 72.5 609.05 3.68 Long Term Care 0.3 15.8 5.1 111.59 0.05 0.3 18.9 5.0 115.12 0.05 Other Inpatient 0.0 59.2 0.6 6,997.35 0.35 0.0 27.4 0.2 4,061.86 0.07
Subtotal 103.1 5.1 529.5 $ 1,579.95 $ 69.72 99.5 5.2 516.2 $ 1,595.40 $ 68.64
Outpatient HospitalGeneral Outpatient 351.7 340.68 9.98 343.2 359.17 10.27 Emergency Room 927.6 111.61 8.63 909.3 120.14 9.10 End-Stage Renal Disease 2.9 671.92 0.16 2.2 757.37 0.14
Subtotal 1,282.1 $ 175.70 $ 18.77 1,254.7 $ 186.65 $ 19.52
AncillariesPrescription Drugs 8,361.3 50.60 35.25 8,540.9 52.12 37.10 Transportation 246.1 44.43 0.91 288.1 40.83 0.98 DME/Prosthetics/Orthotics 282.9 93.37 2.20 306.9 93.85 2.40 Home Health/Hospice 46.7 101.51 0.39 48.9 104.24 0.43 Other Ancillary 28.6 27.42 0.07 34.1 28.28 0.08
Subtotal 8,965.5 $ 51.97 $ 38.83 9,218.9 $ 53.35 $ 40.99
PhysicianSurgery 327.0 157.42 4.29 329.1 153.34 4.21 Anesthesia 107.1 190.41 1.70 105.1 195.68 1.71 Hospital Inpatient Visits 607.2 74.03 3.75 620.9 74.81 3.87 Office Visits/Consults 2,502.7 46.02 9.60 2,457.8 45.34 9.29 Well Baby Exams/Physical Exams 2,367.2 28.94 5.71 2,420.5 28.72 5.79 Emergency Room Visits 815.2 38.28 2.60 780.2 38.97 2.53 Clinic Visit/Services 3,584.1 29.78 8.90 3,439.3 31.41 9.00 Radiology and Pathology 8,158.4 11.69 7.95 8,245.4 11.39 7.82 Outpatient Behavioral Health 79.5 42.95 0.28 87.1 42.71 0.31 Maternity 24.0 47.00 0.09 44.7 45.85 0.17 Chiropractor 218.8 9.27 0.17 228.4 9.29 0.18 Podiatrist 35.7 43.61 0.13 38.2 44.69 0.14 Vision - EyeCare & Eyewear - - - - - - Other Professional 9,087.4 9.13 6.92 9,467.7 8.43 6.65 DMHDD / DASA 702.4 80.94 4.74 698.3 82.42 4.80 PCCM Fee - - - - - -
Subtotal 28,616.7 $ 23.83 $ 56.82 28,962.7 $ 23.40 $ 56.47
Total Claims/Benefit Cost 37,263.3 $ 49.97 $ 155.17 37,749.8 $ 49.55 $ 155.87
ATTACHMENT 3 Milliman, Inc.Page 10 of 50

3/26/20132:36 PM
State of IllinoisDepartment of Healthcare and Family Services
VMC Base Data
Region: 2 Member Months: 32,477 Member Months: 32,232 Ratecell: 0 thru 90 days
Fiscal Year 2010 Fiscal Year 2011Average Average
Admits Length Utilization Cost per Admits Length Utilization Cost perType of Service Per 1,000 of Stay Per 1,000 Service PMPM Per 1,000 of Stay Per 1,000 Service PMPM
Inpatient HospitalMedical/Surgical 159.6 4.7 748.6 $ 1,817.73 $ 113.40 150.4 6.6 990.3 $ 1,928.14 $ 159.12Well Newborn 19.2 2.1 41.0 881.13 3.01 3.0 2.4 7.1 863.11 0.51 Other Newborn 1,055.6 6.4 6,717.4 1,553.43 869.59 1,088.2 6.7 7,240.1 1,571.93 948.41 Maternity Non-Delivery - - - - - - - - - - Psychiatric/Substance Abuse - - - - - 0.4 1.8 0.7 740.91 0.04 Long Term Care - - - - - - - - - - Other Inpatient - - - - - - - - - -
Subtotal 1,234.5 6.1 7,507.0 $ 1,576.12 $ 985.99 1,242.0 6.6 8,238.3 $ 1,614.05 $ 1,108.08
Outpatient HospitalGeneral Outpatient 393.1 261.56 8.57 354.4 273.43 8.08 Emergency Room 1,219.7 100.63 10.23 1,254.7 114.25 11.95 End-Stage Renal Disease - - - - - -
Subtotal 1,612.8 $ 139.86 $ 18.80 1,609.1 $ 149.31 $ 20.02
AncillariesPrescription Drugs 3,281.5 45.20 12.36 3,141.8 47.12 12.34 Transportation 516.9 105.71 4.55 497.4 140.00 5.80 DME/Prosthetics/Orthotics 381.3 94.17 2.99 407.3 82.80 2.81 Home Health/Hospice 208.0 61.46 1.07 208.5 61.55 1.07 Other Ancillary 116.0 43.79 0.42 104.6 41.93 0.37
Subtotal 4,503.7 $ 57.01 $ 21.39 4,359.6 $ 61.62 $ 22.39
PhysicianSurgery 1,423.7 111.76 13.26 1,443.8 113.87 13.70 Anesthesia 90.9 259.25 1.96 89.4 272.70 2.03 Hospital Inpatient Visits 8,416.7 93.20 65.37 9,301.2 101.09 78.35 Office Visits/Consults 3,782.5 45.25 14.26 3,774.0 45.85 14.42 Well Baby Exams/Physical Exams 17,060.6 30.40 43.23 17,038.3 29.67 42.13 Emergency Room Visits 1,183.5 38.92 3.84 1,201.0 38.77 3.88 Clinic Visit/Services 4,373.3 84.40 30.76 4,766.2 83.27 33.07 Radiology and Pathology 18,819.3 6.16 9.66 18,945.6 5.97 9.42 Outpatient Behavioral Health 2.2 54.92 0.01 1.9 55.03 0.01 Maternity 4.1 49.57 0.02 3.4 49.28 0.01 Chiropractor 24.0 10.57 0.02 11.9 10.68 0.01 Podiatrist 5.5 48.48 0.02 10.4 74.02 0.06 Vision - EyeCare & Eyewear - - - - - - Other Professional 3,612.9 23.72 7.14 4,957.6 16.97 7.01 DMHDD / DASA - - - 0.4 67.09 0.00 PCCM Fee - - - - - -
Subtotal 58,799.2 $ 38.68 $ 189.55 61,545.0 $ 39.80 $ 204.12
Total Claims/Benefit Cost 72,422.7 $ 201.44 $ 1,215.74 75,752.0 $ 214.59 $ 1,354.61
ATTACHMENT 3 Milliman, Inc.Page 11 of 50

3/26/20132:36 PM
State of IllinoisDepartment of Healthcare and Family Services
VMC Base Data
Region: 2 Member Months: 141,881 Member Months: 141,434 Ratecell: 91 days thru 1 Year
Fiscal Year 2010 Fiscal Year 2011Average Average
Admits Length Utilization Cost per Admits Length Utilization Cost perType of Service Per 1,000 of Stay Per 1,000 Service PMPM Per 1,000 of Stay Per 1,000 Service PMPM
Inpatient HospitalMedical/Surgical 62.7 3.8 239.9 $ 1,923.10 $ 38.45 58.2 3.9 226.0 $ 1,754.20 $ 33.04Well Newborn - - - - - - - - - - Other Newborn 0.9 14.1 12.7 1,742.09 1.84 1.7 21.4 36.4 2,132.66 6.47 Maternity Non-Delivery - - - - - - - - - - Psychiatric/Substance Abuse - - - - - 0.1 4.0 0.4 234.68 0.01 Long Term Care - - - - - - - - - - Other Inpatient - - - - - - - - - -
Subtotal 63.6 4.0 252.5 $ 1,914.76 $ 40.29 60.0 4.4 262.9 $ 1,803.62 $ 39.51
Outpatient HospitalGeneral Outpatient 198.0 376.33 6.21 209.1 313.68 5.47 Emergency Room 1,453.5 87.93 10.65 1,387.9 102.33 11.84 End-Stage Renal Disease - - - - - -
Subtotal 1,651.5 $ 122.51 $ 16.86 1,597.0 $ 130.00 $ 17.30
AncillariesPrescription Drugs 6,024.8 42.36 21.27 6,036.0 39.04 19.64 Transportation 257.8 49.07 1.05 267.4 47.40 1.06 DME/Prosthetics/Orthotics 373.2 99.12 3.08 420.1 93.48 3.27 Home Health/Hospice 77.7 72.87 0.47 74.9 184.48 1.15 Other Ancillary 85.6 24.53 0.18 90.4 23.05 0.17
Subtotal 6,819.1 $ 45.84 $ 26.05 6,888.8 $ 44.06 $ 25.29
PhysicianSurgery 193.2 173.99 2.80 198.1 151.34 2.50 Anesthesia 104.6 149.71 1.30 97.1 143.06 1.16 Hospital Inpatient Visits 360.1 74.98 2.25 429.8 86.07 3.08 Office Visits/Consults 3,386.8 43.08 12.16 3,327.0 43.92 12.18 Well Baby Exams/Physical Exams 8,195.1 22.50 15.36 8,202.1 21.56 14.74 Emergency Room Visits 1,377.8 34.61 3.97 1,314.2 35.04 3.84 Clinic Visit/Services 4,425.5 48.62 17.93 4,084.3 54.00 18.38 Radiology and Pathology 4,544.2 10.00 3.79 4,655.8 9.58 3.72 Outpatient Behavioral Health 0.6 67.15 0.00 1.0 57.76 0.00 Maternity 5.2 50.42 0.02 4.6 49.80 0.02 Chiropractor 21.1 10.53 0.02 19.8 10.65 0.02 Podiatrist 2.1 59.24 0.01 3.5 83.49 0.02 Vision - EyeCare & Eyewear - - - - - - Other Professional 10,739.1 11.07 9.91 11,149.6 9.81 9.11 DMHDD / DASA - - - - - - PCCM Fee - - - - - -
Subtotal 33,355.4 $ 25.01 $ 69.53 33,486.8 $ 24.64 $ 68.76
Total Claims/Benefit Cost 42,078.5 $ 43.56 $ 152.73 42,235.5 $ 42.87 $ 150.87
ATTACHMENT 3 Milliman, Inc.Page 12 of 50

3/26/20132:36 PM
State of IllinoisDepartment of Healthcare and Family Services
VMC Base Data
Region: 2 Member Months: 281,074 Member Months: 284,773 Ratecell: 2 thru 5 Years
Fiscal Year 2010 Fiscal Year 2011Average Average
Admits Length Utilization Cost per Admits Length Utilization Cost perType of Service Per 1,000 of Stay Per 1,000 Service PMPM Per 1,000 of Stay Per 1,000 Service PMPM
Inpatient HospitalMedical/Surgical 26.0 3.0 78.9 $ 1,743.96 $ 11.47 22.4 3.0 67.5 $ 2,041.19 $ 11.48Well Newborn - - - - - - - - - - Other Newborn - - 0.2 1,816.82 0.03 0.1 3.0 0.3 3,126.96 0.08 Maternity Non-Delivery - - - - - - - - - - Psychiatric/Substance Abuse 0.7 9.7 6.8 792.90 0.45 0.8 11.6 9.3 777.99 0.60 Long Term Care - - - - - - - - - - Other Inpatient - - 1.4 5,904.59 0.69 - - 1.1 5,916.18 0.54
Subtotal 26.9 3.2 87.4 $ 1,734.78 $ 12.63 23.4 3.3 78.3 $ 1,947.14 $ 12.71
Outpatient HospitalGeneral Outpatient 151.8 366.08 4.63 149.6 348.64 4.35 Emergency Room 843.9 91.68 6.45 773.1 111.80 7.20 End-Stage Renal Disease - - - - - -
Subtotal 995.7 $ 133.51 $ 11.08 922.7 $ 150.20 $ 11.55
AncillariesPrescription Drugs 4,310.3 40.39 14.51 4,241.7 39.98 14.13 Transportation 145.5 45.03 0.55 150.3 44.75 0.56 DME/Prosthetics/Orthotics 327.4 119.40 3.26 315.0 133.73 3.51 Home Health/Hospice 12.6 177.31 0.19 10.8 270.07 0.24 Other Ancillary 83.6 22.78 0.16 84.5 21.27 0.15
Subtotal 4,879.5 $ 45.88 $ 18.66 4,802.4 $ 46.46 $ 18.59
PhysicianSurgery 187.4 130.31 2.04 187.4 123.70 1.93 Anesthesia 83.8 156.45 1.09 84.7 154.83 1.09 Hospital Inpatient Visits 116.3 39.91 0.39 104.9 39.46 0.34 Office Visits/Consults 2,088.7 43.22 7.52 2,003.4 43.22 7.22 Well Baby Exams/Physical Exams 1,859.4 28.75 4.45 1,815.3 27.22 4.12 Emergency Room Visits 786.3 33.74 2.21 705.1 34.16 2.01 Clinic Visit/Services 3,201.0 36.82 9.82 3,048.0 39.53 10.04 Radiology and Pathology 3,033.5 9.52 2.41 2,995.9 9.44 2.36 Outpatient Behavioral Health 11.5 55.46 0.05 13.9 57.16 0.07 Maternity 3.0 50.52 0.01 2.7 49.94 0.01 Chiropractor 17.3 10.19 0.01 18.5 10.51 0.02 Podiatrist 6.4 36.77 0.02 5.5 38.67 0.02 Vision - EyeCare & Eyewear - - - - - - Other Professional 10,659.3 9.58 8.51 11,064.2 9.28 8.56 DMHDD / DASA 94.3 71.58 0.56 83.2 72.97 0.51 PCCM Fee - - - - - -
Subtotal 22,148.2 $ 21.19 $ 39.10 22,132.7 $ 20.75 $ 38.28
Total Claims/Benefit Cost 28,110.8 $ 34.78 $ 81.47 27,936.1 $ 34.85 $ 81.13
ATTACHMENT 3 Milliman, Inc.Page 13 of 50

3/26/20132:36 PM
State of IllinoisDepartment of Healthcare and Family Services
VMC Base Data
Region: 2 Member Months: 511,016 Member Months: 531,315 Ratecell: 6 thru 13 Years
Fiscal Year 2010 Fiscal Year 2011Average Average
Admits Length Utilization Cost per Admits Length Utilization Cost perType of Service Per 1,000 of Stay Per 1,000 Service PMPM Per 1,000 of Stay Per 1,000 Service PMPM
Inpatient HospitalMedical/Surgical 15.1 3.0 45.9 $ 1,758.37 $ 6.73 12.6 3.1 39.6 $ 1,706.13 $ 5.63Well Newborn - - - - - - - - - - Other Newborn - - - - - - - - - - Maternity Non-Delivery - - - - - - - - - - Psychiatric/Substance Abuse 12.6 11.9 149.7 710.24 8.86 11.4 11.6 132.2 732.71 8.07 Long Term Care - - - - - - - - - - Other Inpatient - - - - - - - 0.6 7,599.23 0.38
Subtotal 27.6 7.1 195.6 $ 956.19 $ 15.59 24.0 7.2 172.4 $ 980.20 $ 14.08
Outpatient HospitalGeneral Outpatient 120.6 362.22 3.64 112.7 376.17 3.53 Emergency Room 553.6 97.39 4.49 504.9 122.18 5.14 End-Stage Renal Disease 0.1 61.03 0.00 0.2 2,419.80 0.04
Subtotal 674.3 $ 144.75 $ 8.13 617.8 $ 169.25 $ 8.71
AncillariesPrescription Drugs 5,950.2 72.34 35.87 5,943.7 77.26 38.27 Transportation 109.6 48.62 0.44 111.5 49.55 0.46 DME/Prosthetics/Orthotics 176.7 111.44 1.64 186.3 106.54 1.65 Home Health/Hospice 13.5 218.73 0.25 5.4 80.06 0.04 Other Ancillary 37.3 21.57 0.07 32.3 22.44 0.06
Subtotal 6,287.3 $ 73.04 $ 38.27 6,279.2 $ 77.36 $ 40.48
PhysicianSurgery 159.0 126.31 1.67 157.1 122.28 1.60 Anesthesia 46.9 165.56 0.65 43.9 163.81 0.60 Hospital Inpatient Visits 192.6 30.54 0.49 170.3 30.92 0.44 Office Visits/Consults 1,483.5 47.05 5.82 1,424.6 46.34 5.50 Well Baby Exams/Physical Exams 720.0 32.63 1.96 659.0 31.63 1.74 Emergency Room Visits 514.3 34.37 1.47 461.2 34.78 1.34 Clinic Visit/Services 2,985.2 35.32 8.79 2,814.1 37.76 8.86 Radiology and Pathology 2,227.2 10.68 1.98 2,258.2 10.67 2.01 Outpatient Behavioral Health 156.3 39.75 0.52 160.7 36.91 0.49 Maternity 1.1 48.03 0.00 0.9 51.44 0.00 Chiropractor 38.5 10.51 0.03 34.0 10.49 0.03 Podiatrist 19.3 44.93 0.07 19.9 41.37 0.07 Vision - EyeCare & Eyewear - - - - - - Other Professional 9,478.5 3.27 2.58 9,885.3 3.12 2.57 DMHDD / DASA 904.9 71.71 5.41 815.6 73.12 4.97 PCCM Fee - - - - - -
Subtotal 18,927.4 $ 19.94 $ 31.45 18,904.7 $ 19.18 $ 30.21
Total Claims/Benefit Cost 26,084.6 $ 42.98 $ 93.43 25,974.1 $ 43.19 $ 93.48
ATTACHMENT 3 Milliman, Inc.Page 14 of 50

3/26/20132:36 PM
State of IllinoisDepartment of Healthcare and Family Services
VMC Base Data
Region: 2 Member Months: 147,029 Member Months: 151,363 Ratecell: 14 thru 20 Male
Fiscal Year 2010 Fiscal Year 2011Average Average
Admits Length Utilization Cost per Admits Length Utilization Cost perType of Service Per 1,000 of Stay Per 1,000 Service PMPM Per 1,000 of Stay Per 1,000 Service PMPM
Inpatient HospitalMedical/Surgical 22.4 3.6 80.3 $ 1,790.78 $ 11.98 19.9 4.2 82.9 $ 1,862.54 $ 12.87Well Newborn - - - - - - - - - - Other Newborn - - - - - - - - - - Maternity Non-Delivery - - - - - - - - - - Psychiatric/Substance Abuse 27.6 10.1 278.5 687.82 15.96 27.1 10.3 278.2 709.26 16.44 Long Term Care - - - - - 0.4 17.8 7.1 104.25 0.06 Other Inpatient - - - - - - - - - -
Subtotal 50.0 7.2 358.8 $ 934.66 $ 27.95 47.4 7.8 368.2 $ 957.26 $ 29.37
Outpatient HospitalGeneral Outpatient 194.5 377.74 6.12 192.5 399.56 6.41 Emergency Room 692.3 118.12 6.81 621.9 138.06 7.15 End-Stage Renal Disease - - - 0.1 166.69 0.00
Subtotal 886.8 $ 175.06 $ 12.94 814.5 $ 199.86 $ 13.57
AncillariesPrescription Drugs 6,375.3 84.25 44.76 6,384.3 92.18 49.04 Transportation 196.3 65.00 1.06 190.1 59.26 0.94 DME/Prosthetics/Orthotics 145.1 111.04 1.34 151.0 106.88 1.34 Home Health/Hospice 47.2 54.58 0.21 48.4 50.54 0.20 Other Ancillary 11.4 31.16 0.03 11.0 23.41 0.02
Subtotal 6,775.3 $ 83.97 $ 47.41 6,784.9 $ 91.18 $ 51.55
PhysicianSurgery 212.4 148.90 2.64 204.5 147.19 2.51 Anesthesia 50.4 187.33 0.79 47.8 183.37 0.73 Hospital Inpatient Visits 322.5 29.89 0.80 359.9 28.91 0.87 Office Visits/Consults 1,339.2 45.21 5.05 1,347.6 43.86 4.93 Well Baby Exams/Physical Exams 582.8 36.78 1.79 570.6 33.31 1.58 Emergency Room Visits 637.1 36.45 1.94 567.2 36.98 1.75 Clinic Visit/Services 2,874.0 33.19 7.95 2,809.5 34.81 8.15 Radiology and Pathology 3,007.6 13.24 3.32 3,044.7 13.52 3.43 Outpatient Behavioral Health 198.4 40.66 0.67 219.7 37.65 0.69 Maternity 2.1 42.95 0.01 1.3 45.54 0.00 Chiropractor 77.6 10.08 0.07 60.6 10.36 0.05 Podiatrist 39.6 50.31 0.17 45.9 47.64 0.18 Vision - EyeCare & Eyewear - - - - - - Other Professional 9,159.8 3.58 2.73 9,552.1 3.62 2.88 DMHDD / DASA 3,034.5 120.22 30.40 2,474.9 120.76 24.91 PCCM Fee - - - - - -
Subtotal 21,538.0 $ 32.48 $ 58.30 21,306.2 $ 29.66 $ 52.66
Total Claims/Benefit Cost 29,558.9 $ 59.51 $ 146.60 29,273.8 $ 60.32 $ 147.15
ATTACHMENT 3 Milliman, Inc.Page 15 of 50

3/26/20132:36 PM
State of IllinoisDepartment of Healthcare and Family Services
VMC Base Data
Region: 2 Member Months: 168,553 Member Months: 170,430 Ratecell: 14 thru 20 Female
Fiscal Year 2010 Fiscal Year 2011Average Average
Admits Length Utilization Cost per Admits Length Utilization Cost perType of Service Per 1,000 of Stay Per 1,000 Service PMPM Per 1,000 of Stay Per 1,000 Service PMPM
Inpatient HospitalMedical/Surgical 20.3 3.4 70.0 $ 1,848.70 $ 10.78 19.6 3.3 65.0 $ 1,828.11 $ 9.90Well Newborn - - - - - - - - - - Other Newborn - - - - - - - - - - Maternity Non-Delivery 12.5 2.6 32.3 629.17 1.69 12.0 2.8 33.4 616.32 1.72 Psychiatric/Substance Abuse 34.5 9.7 336.0 671.73 18.81 28.7 10.0 286.1 709.51 16.92 Long Term Care 0.2 26.0 5.2 93.95 0.04 - - - - - Other Inpatient - - - - - - - - - -
Subtotal 67.5 6.6 443.5 $ 847.63 $ 31.33 60.3 6.4 384.5 $ 890.51 $ 28.53
Outpatient HospitalGeneral Outpatient 513.5 259.83 11.12 445.3 305.64 11.34 Emergency Room 1,152.4 116.09 11.15 1,046.6 136.76 11.93 End-Stage Renal Disease - - - - - -
Subtotal 1,665.9 $ 160.39 $ 22.27 1,492.0 $ 187.16 $ 23.27
AncillariesPrescription Drugs 8,895.7 49.19 36.47 8,900.6 53.09 39.38 Transportation 289.5 60.36 1.46 350.1 51.71 1.51 DME/Prosthetics/Orthotics 126.5 96.32 1.02 157.2 91.39 1.20 Home Health/Hospice 42.9 40.67 0.15 48.1 42.34 0.17 Other Ancillary 12.1 23.31 0.02 14.0 23.02 0.03
Subtotal 9,366.8 $ 50.10 $ 39.11 9,470.1 $ 53.58 $ 42.28
PhysicianSurgery 214.9 147.44 2.64 202.6 145.03 2.45 Anesthesia 127.4 238.24 2.53 126.2 217.87 2.29 Hospital Inpatient Visits 450.5 31.01 1.16 403.3 30.43 1.02 Office Visits/Consults 2,119.5 43.55 7.69 2,113.7 42.70 7.52 Well Baby Exams/Physical Exams 680.3 36.37 2.06 622.7 35.41 1.84 Emergency Room Visits 1,094.3 38.25 3.49 994.9 38.66 3.21 Clinic Visit/Services 3,703.9 42.75 13.19 3,598.0 44.97 13.48 Radiology and Pathology 10,334.1 12.74 10.97 9,955.0 12.83 10.64 Outpatient Behavioral Health 188.8 46.53 0.73 198.2 43.20 0.71 Maternity 57.0 48.13 0.23 46.6 59.57 0.23 Chiropractor 114.0 10.32 0.10 98.4 10.45 0.09 Podiatrist 35.7 44.71 0.13 42.5 53.28 0.19 Vision - EyeCare & Eyewear - - - - - - Other Professional 10,587.7 10.67 9.42 10,902.0 9.68 8.79 DMHDD / DASA 1,786.8 97.45 14.51 1,612.7 96.72 13.00 PCCM Fee - - - - - -
Subtotal 31,494.8 $ 26.24 $ 68.86 30,917.0 $ 25.41 $ 65.47
Total Claims/Benefit Cost 42,971.0 $ 45.12 $ 161.56 42,263.6 $ 45.30 $ 159.55
ATTACHMENT 3 Milliman, Inc.Page 16 of 50

3/26/20132:36 PM
State of IllinoisDepartment of Healthcare and Family Services
VMC Base Data
Region: 2 Member Months: 121,205 Member Months: 125,887 Ratecell: 21 thru 44 Male
Fiscal Year 2010 Fiscal Year 2011Average Average
Admits Length Utilization Cost per Admits Length Utilization Cost perType of Service Per 1,000 of Stay Per 1,000 Service PMPM Per 1,000 of Stay Per 1,000 Service PMPM
Inpatient HospitalMedical/Surgical 60.7 3.8 231.3 $ 2,694.04 $ 51.93 57.9 3.5 202.7 $ 2,353.06 $ 39.75Well Newborn - - - - - - - - - - Other Newborn - - - - - - - - - - Maternity Non-Delivery 0.2 4.0 0.8 410.00 0.03 - - - - - Psychiatric/Substance Abuse 16.6 3.8 63.1 397.16 2.09 15.6 4.2 64.8 362.06 1.96 Long Term Care - - - - - 1.1 15.2 16.7 104.62 0.15 Other Inpatient - - - - - 0.1 17.0 1.7 3,834.55 0.54
Subtotal 77.5 3.8 295.1 $ 2,197.63 $ 54.04 74.7 3.8 285.9 $ 1,779.27 $ 42.39
Outpatient HospitalGeneral Outpatient 512.9 406.57 17.38 488.2 409.22 16.65 Emergency Room 1,109.8 126.38 11.69 1,083.8 149.75 13.52 End-Stage Renal Disease 8.5 771.74 0.55 4.5 986.79 0.37
Subtotal 1,631.1 $ 217.86 $ 29.61 1,576.5 $ 232.49 $ 30.54
AncillariesPrescription Drugs 11,636.5 47.99 46.54 11,578.1 47.93 46.25 Transportation 206.1 71.00 1.22 212.4 76.16 1.35 DME/Prosthetics/Orthotics 524.9 78.81 3.45 543.5 77.33 3.50 Home Health/Hospice 55.7 67.10 0.31 48.7 62.83 0.26 Other Ancillary 11.0 25.29 0.02 13.1 25.77 0.03
Subtotal 12,434.3 $ 49.74 $ 51.54 12,395.8 $ 49.74 $ 51.38
PhysicianSurgery 405.6 206.44 6.98 396.3 197.63 6.53 Anesthesia 99.0 187.13 1.54 97.9 192.61 1.57 Hospital Inpatient Visits 359.9 41.14 1.23 384.5 39.97 1.28 Office Visits/Consults 1,732.6 46.74 6.75 1,677.2 46.03 6.43 Well Baby Exams/Physical Exams 22.7 87.52 0.17 22.4 84.61 0.16 Emergency Room Visits 1,037.7 38.93 3.37 1,005.4 40.08 3.36 Clinic Visit/Services 2,618.5 37.60 8.20 2,537.1 37.55 7.94 Radiology and Pathology 5,804.1 13.59 6.57 5,967.9 13.66 6.79 Outpatient Behavioral Health 111.5 40.35 0.37 101.2 36.66 0.31 Maternity 0.6 49.53 0.00 0.5 47.66 0.00 Chiropractor 205.1 8.64 0.15 149.4 8.67 0.11 Podiatrist 41.6 42.08 0.15 45.9 47.05 0.18 Vision - EyeCare & Eyewear - - - - - - Other Professional 9,067.4 8.51 6.43 9,574.4 8.63 6.89 DMHDD / DASA 1,032.7 61.90 5.33 838.1 65.80 4.60 PCCM Fee - - - - - -
Subtotal 22,539.1 $ 25.15 $ 47.24 22,798.3 $ 24.29 $ 46.14
Total Claims/Benefit Cost 36,899.6 $ 59.33 $ 182.44 37,056.5 $ 55.20 $ 170.46
ATTACHMENT 3 Milliman, Inc.Page 17 of 50

3/26/20132:36 PM
State of IllinoisDepartment of Healthcare and Family Services
VMC Base Data
Region: 2 Member Months: 394,191 Member Months: 406,718 Ratecell: 21 thru 44 Female
Fiscal Year 2010 Fiscal Year 2011Average Average
Admits Length Utilization Cost per Admits Length Utilization Cost perType of Service Per 1,000 of Stay Per 1,000 Service PMPM Per 1,000 of Stay Per 1,000 Service PMPM
Inpatient HospitalMedical/Surgical 58.8 3.1 184.7 $ 1,679.89 $ 25.86 56.3 3.1 173.0 $ 1,688.21 $ 24.34Well Newborn - - - - - - - - - - Other Newborn - - 0.1 8,743.38 0.07 - - - - 0.01 Maternity Non-Delivery 19.2 2.7 52.6 647.65 2.84 18.6 2.6 49.1 724.10 2.96 Psychiatric/Substance Abuse 14.0 4.2 59.0 356.53 1.75 12.5 4.3 54.0 362.97 1.63 Long Term Care 0.2 12.0 2.4 101.37 0.02 0.5 18.4 9.2 113.66 0.09 Other Inpatient - - - - - - - - - -
Subtotal 92.2 3.2 298.9 $ 1,226.14 $ 30.54 87.9 3.2 285.3 $ 1,221.13 $ 29.03
Outpatient HospitalGeneral Outpatient 881.5 321.91 23.65 862.2 355.77 25.56 Emergency Room 1,570.8 125.49 16.43 1,506.3 149.27 18.74 End-Stage Renal Disease 3.5 667.66 0.19 4.7 728.82 0.29
Subtotal 2,455.7 $ 196.77 $ 40.27 2,373.1 $ 225.45 $ 44.58
AncillariesPrescription Drugs 17,092.5 44.37 63.21 17,529.6 44.30 64.71 Transportation 365.1 53.45 1.63 359.3 53.06 1.59 DME/Prosthetics/Orthotics 393.1 80.35 2.63 424.0 79.32 2.80 Home Health/Hospice 61.2 70.96 0.36 47.6 70.15 0.28 Other Ancillary 11.6 24.25 0.02 13.7 25.50 0.03
Subtotal 17,923.4 $ 45.43 $ 67.85 18,374.2 $ 45.33 $ 69.41
PhysicianSurgery 529.7 178.49 7.88 568.2 176.09 8.34 Anesthesia 252.4 201.44 4.24 260.6 190.27 4.13 Hospital Inpatient Visits 402.1 36.99 1.24 375.5 38.68 1.21 Office Visits/Consults 2,912.5 45.51 11.05 2,931.9 44.33 10.83 Well Baby Exams/Physical Exams 229.8 63.01 1.21 272.0 60.69 1.38 Emergency Room Visits 1,506.8 40.09 5.03 1,443.7 40.65 4.89 Clinic Visit/Services 4,032.5 43.66 14.67 3,934.8 45.11 14.79 Radiology and Pathology 15,401.9 13.84 17.76 15,740.6 13.94 18.28 Outpatient Behavioral Health 181.3 37.21 0.56 182.9 35.57 0.54 Maternity 55.3 53.07 0.24 68.5 55.06 0.31 Chiropractor 231.7 8.80 0.17 204.4 8.78 0.15 Podiatrist 67.7 45.71 0.26 68.2 45.69 0.26 Vision - EyeCare & Eyewear - - - - - - Other Professional 11,197.2 15.25 14.23 11,526.3 13.92 13.37 DMHDD / DASA 1,118.4 64.56 6.02 1,099.1 63.15 5.78 PCCM Fee - - - - - -
Subtotal 38,119.5 $ 26.62 $ 84.56 38,676.6 $ 26.15 $ 84.27
Total Claims/Benefit Cost 58,797.5 $ 45.56 $ 223.21 59,709.2 $ 45.68 $ 227.30
ATTACHMENT 3 Milliman, Inc.Page 18 of 50

3/26/20132:36 PM
State of IllinoisDepartment of Healthcare and Family Services
VMC Base Data
Region: 2 Member Months: 84,945 Member Months: 90,673 Ratecell: 45+ Years
Fiscal Year 2010 Fiscal Year 2011Average Average
Admits Length Utilization Cost per Admits Length Utilization Cost perType of Service Per 1,000 of Stay Per 1,000 Service PMPM Per 1,000 of Stay Per 1,000 Service PMPM
Inpatient HospitalMedical/Surgical 142.3 4.3 616.8 $ 2,323.26 $ 119.42 130.8 4.1 538.8 $ 1,924.21 $ 86.40Well Newborn - - - - - - - - - - Other Newborn - - - - - - - - - - Maternity Non-Delivery 0.1 1.0 0.1 1,965.04 0.02 0.1 1.0 0.1 885.70 0.01 Psychiatric/Substance Abuse 10.6 4.7 49.4 341.98 1.41 7.9 4.8 37.7 440.70 1.38 Long Term Care 2.8 18.4 51.6 103.58 0.45 7.7 16.9 129.8 114.92 1.24 Other Inpatient - - - - - 0.1 24.0 2.4 3,808.90 0.76
Subtotal 155.8 4.6 717.9 $ 2,027.33 $ 121.29 146.6 4.8 708.8 $ 1,520.21 $ 89.79
Outpatient HospitalGeneral Outpatient 1,076.3 384.02 34.44 1,069.7 442.08 39.41 Emergency Room 941.1 149.51 11.73 899.3 173.08 12.97 End-Stage Renal Disease 25.6 419.38 0.89 18.4 600.36 0.92
Subtotal 2,043.0 $ 276.44 $ 47.06 1,987.4 $ 321.83 $ 53.30
AncillariesPrescription Drugs 28,206.5 48.97 115.11 29,140.8 49.07 119.16 Transportation 766.1 34.22 2.18 806.8 31.85 2.14 DME/Prosthetics/Orthotics 1,694.4 67.93 9.59 1,741.6 70.85 10.28 Home Health/Hospice 189.0 77.84 1.23 171.9 77.35 1.11 Other Ancillary 21.3 26.34 0.05 25.7 24.58 0.05
Subtotal 30,877.3 $ 49.81 $ 128.16 31,886.8 $ 49.96 $ 132.75
PhysicianSurgery 857.4 219.21 15.66 849.0 206.44 14.61 Anesthesia 230.5 161.58 3.10 232.9 155.96 3.03 Hospital Inpatient Visits 888.9 39.42 2.92 829.8 38.20 2.64 Office Visits/Consults 3,095.9 48.38 12.48 3,064.4 47.37 12.10 Well Baby Exams/Physical Exams 88.7 82.35 0.61 88.0 81.40 0.60 Emergency Room Visits 898.7 43.36 3.25 863.8 44.08 3.17 Clinic Visit/Services 3,342.1 48.68 13.56 3,217.7 50.72 13.60 Radiology and Pathology 13,276.1 13.11 14.51 13,454.7 13.11 14.70 Outpatient Behavioral Health 195.1 34.29 0.56 180.9 31.52 0.48 Maternity 0.3 41.53 0.00 0.5 49.81 0.00 Chiropractor 298.1 8.65 0.21 204.5 8.67 0.15 Podiatrist 137.3 37.46 0.43 153.3 39.45 0.50 Vision - EyeCare & Eyewear - - - - - - Other Professional 10,722.1 20.56 18.37 10,955.3 20.27 18.51 DMHDD / DASA 1,181.7 57.10 5.62 1,034.0 57.93 4.99 PCCM Fee - - - - - -
Subtotal 35,212.9 $ 31.11 $ 91.28 35,128.8 $ 30.43 $ 89.07
Total Claims/Benefit Cost 68,851.1 $ 67.59 $ 387.79 69,711.8 $ 62.81 $ 364.91
ATTACHMENT 3 Milliman, Inc.Page 19 of 50

3/26/20132:36 PM
State of IllinoisDepartment of Healthcare and Family Services
VMC Base Data
Region: 2 Member Months: 34,527 Member Months: 34,225 Composite
Fiscal Year 2010 Fiscal Year 2011Average Average
Admits Length Utilization Cost per Admits Length Utilization Cost perType of Service Per 1,000 of Stay Per 1,000 Service PMPM Per 1,000 of Stay Per 1,000 Service PMPM
Inpatient HospitalMed/Surg 52.1 3.7 192.9 $ 1,969.62 $ 31.66 48.4 3.9 188.3 $ 1,877.11 $ 29.45Well Newborn 0.8 2.1 1.7 881.13 0.13 0.1 2.4 0.3 863.11 0.02 Other Newborn 45.1 6.4 288.3 1,555.30 37.36 46.7 6.7 314.0 1,581.91 41.40 Maternity Non-Delivery 5.2 2.7 14.1 645.44 0.76 5.0 2.7 13.2 713.46 0.79 Psychiatric/Substance Abuse 9.7 7.2 69.4 592.20 3.43 8.7 7.3 63.3 610.68 3.22 Long Term Care 0.2 17.2 3.7 102.69 0.03 0.6 16.9 11.0 113.25 0.10 Other Inpatient - - 0.3 5,904.59 0.14 0.0 43.6 0.6 5,254.01 0.26
Subtotal 113.1 5.0 570.4 $ 1,546.36 $ 73.50 109.5 5.4 590.7 $ 1,528.35 $ 75.24
Outpatient HospitalGeneral Outpatient 435.9 342.32 12.44 424.4 365.63 12.93 Emergency Room 1,111.2 110.34 10.22 1,054.8 131.27 11.54 End-Stage Renal Disease 3.0 568.06 0.14 2.6 735.00 0.16
Subtotal 1,550.1 $ 176.46 $ 22.79 1,481.7 $ 199.44 $ 24.63
AncillariesPrescription Drugs 10,043.2 48.58 40.66 10,178.3 48.98 41.55 Transportation 271.4 54.39 1.23 276.8 55.78 1.29 DME/Prosthetics/Orthotics 405.8 89.39 3.02 425.9 89.77 3.19 Home Health/Hospice 57.8 80.05 0.39 51.1 101.15 0.43 Other Ancillary 46.0 25.64 0.10 46.6 24.43 0.09
Subtotal 10,824.2 $ 50.32 $ 45.39 10,978.8 $ 50.87 $ 46.54
PhysicianSurgery 375.4 165.28 5.17 384.1 159.90 5.12 Anesthesia 132.0 185.83 2.04 132.4 179.32 1.98 Hospital Inpatient Visits 669.2 70.03 3.91 702.4 77.59 4.54 Office Visits/Consults 2,458.8 44.97 9.22 2,421.4 44.61 9.00 Well Baby Exams/Physical Exams 2,529.4 27.45 5.79 2,518.0 26.54 5.57 Emergency Room Visits 1,053.2 37.50 3.29 994.0 38.08 3.15 Clinic Visit/Services 3,569.8 43.95 13.07 3,434.1 46.55 13.32 Radiology and Pathology 7,868.1 12.10 7.94 7,978.9 12.11 8.05 Outpatient Behavioral Health 105.4 39.07 0.34 106.3 36.89 0.33 Maternity 17.5 52.10 0.08 20.1 55.05 0.09 Chiropractor 109.6 9.05 0.08 91.1 9.10 0.07 Podiatrist 34.9 43.40 0.13 37.0 45.06 0.14 Vision - EyeCare & Eyewear - - - - - - Other Professional 10,136.0 11.02 9.30 10,558.3 10.23 9.00 DMHDD / DASA 741.2 74.37 4.59 674.1 73.97 4.15 PCCM Fee - - - - - -
Subtotal 29,800.5 $ 26.15 $ 64.95 30,052.0 $ 25.77 $ 64.53
Total Claims/Benefit Cost ######### $ 52.03 $ 9,373.15 ######### $ 52.04 $ 9,765.73
ATTACHMENT 3 Milliman, Inc.Page 20 of 50

3/26/20132:36 PM
State of IllinoisDepartment of Healthcare and Family Services
VMC Base Data
Region: 3 Member Months: 29,453 Member Months: 28,932 Ratecell: 0 thru 90 days
Fiscal Year 2010 Fiscal Year 2011Average Average
Admits Length Utilization Cost per Admits Length Utilization Cost perType of Service Per 1,000 of Stay Per 1,000 Service PMPM Per 1,000 of Stay Per 1,000 Service PMPM
Inpatient HospitalMedical/Surgical 168.3 5.5 924.9 $ 1,796.82 $ 138.49 142.7 4.8 689.8 $ 1,874.27 $ 107.74Well Newborn 26.9 2.1 57.0 735.36 3.49 2.5 2.2 5.4 1,272.88 0.57 Other Newborn 963.2 7.1 6,820.8 1,457.94 828.69 1,035.3 7.0 7,296.1 1,532.55 931.81 Maternity Non-Delivery - - - - - - - - - - Psychiatric/Substance Abuse 0.8 12.3 9.8 1,948.26 1.59 0.4 6.3 2.5 340.54 0.07 Long Term Care - - - - - - - - - - Other Inpatient - - - - - - - - - -
Subtotal 1,159.1 6.7 7,812.4 $ 1,493.42 $ 972.27 1,180.8 6.8 7,993.8 $ 1,561.49 $ 1,040.19
Outpatient HospitalGeneral Outpatient 336.9 249.10 6.99 395.3 238.55 7.86 Emergency Room 1,210.1 94.69 9.55 1,290.3 107.73 11.58 End-Stage Renal Disease - - - - - -
Subtotal 1,547.0 $ 128.32 $ 16.54 1,685.6 $ 138.41 $ 19.44
AncillariesPrescription Drugs 3,859.2 31.95 10.27 3,965.2 30.98 10.24 Transportation 682.4 133.29 7.58 754.5 99.77 6.27 DME/Prosthetics/Orthotics 440.0 82.86 3.04 437.6 78.11 2.85 Home Health/Hospice 898.4 63.74 4.77 637.9 67.79 3.60 Other Ancillary 87.2 41.46 0.30 111.6 41.68 0.39
Subtotal 5,967.2 $ 52.22 $ 25.97 5,906.7 $ 47.44 $ 23.35
PhysicianSurgery 1,314.4 113.05 12.38 1,308.6 107.02 11.67 Anesthesia 78.6 288.23 1.89 69.7 248.41 1.44 Hospital Inpatient Visits 8,086.6 111.20 74.93 8,047.3 113.73 76.27 Office Visits/Consults 2,810.0 41.43 9.70 2,842.4 38.82 9.20 Well Baby Exams/Physical Exams 15,427.3 29.44 37.85 14,927.8 28.61 35.59 Emergency Room Visits 1,063.4 38.99 3.46 1,139.8 38.70 3.68 Clinic Visit/Services 5,802.6 90.90 43.96 6,362.1 90.48 47.97 Radiology and Pathology 6,728.7 10.15 5.69 7,109.9 9.93 5.88 Outpatient Behavioral Health - - - - - - Maternity 4.9 49.89 0.02 2.9 50.06 0.01 Chiropractor 23.2 10.68 0.02 33.2 10.66 0.03 Podiatrist 0.8 42.42 0.00 - - - Vision - EyeCare & Eyewear - - - - - - Other Professional 3,180.0 21.66 5.74 3,913.7 19.70 6.43 DMHDD / DASA - - - - - - PCCM Fee - - - - - -
Subtotal 44,520.6 $ 52.73 $ 195.65 45,757.4 $ 51.97 $ 198.16
Total Claims/Benefit Cost 59,847.2 $ 242.70 $ 1,210.43 61,343.5 $ 250.62 $ 1,281.14
ATTACHMENT 3 Milliman, Inc.Page 21 of 50

3/26/20132:36 PM
State of IllinoisDepartment of Healthcare and Family Services
VMC Base Data
Region: 3 Member Months: 126,568 Member Months: 128,003 Ratecell: 91 days thru 1 Year
Fiscal Year 2010 Fiscal Year 2011Average Average
Admits Length Utilization Cost per Admits Length Utilization Cost perType of Service Per 1,000 of Stay Per 1,000 Service PMPM Per 1,000 of Stay Per 1,000 Service PMPM
Inpatient HospitalMedical/Surgical 72.4 3.8 278.7 $ 1,912.17 $ 44.41 60.7 3.0 183.4 $ 1,678.07 $ 25.65Well Newborn - - - - - - - - - - Other Newborn 2.5 28.2 70.4 2,021.89 11.86 1.5 18.6 27.9 1,933.04 4.49 Maternity Non-Delivery - - - - - - - - - - Psychiatric/Substance Abuse - - - - - - - - - - Long Term Care - - - - - - - - - - Other Inpatient 0.1 66.0 6.6 16,262.27 8.94 - - - - -
Subtotal 75.0 4.7 355.8 $ 2,199.54 $ 65.22 62.2 3.4 211.3 $ 1,711.74 $ 30.14
Outpatient HospitalGeneral Outpatient 157.9 306.67 4.04 182.9 315.50 4.81 Emergency Room 1,377.3 86.70 9.95 1,351.5 101.90 11.48 End-Stage Renal Disease - - - - - -
Subtotal 1,535.2 $ 109.32 $ 13.99 1,534.4 $ 127.36 $ 16.29
AncillariesPrescription Drugs 6,767.3 33.76 19.04 6,766.9 31.17 17.57 Transportation 324.9 54.68 1.48 410.2 48.36 1.65 DME/Prosthetics/Orthotics 323.7 104.95 2.83 356.1 96.56 2.87 Home Health/Hospice 98.5 183.44 1.51 75.5 146.79 0.92 Other Ancillary 60.3 21.37 0.11 86.0 20.92 0.15
Subtotal 7,574.7 $ 39.54 $ 24.96 7,694.7 $ 36.13 $ 23.17
PhysicianSurgery 167.4 188.74 2.63 168.9 176.84 2.49 Anesthesia 84.3 149.51 1.05 90.3 149.72 1.13 Hospital Inpatient Visits 400.7 82.94 2.77 299.9 73.69 1.84 Office Visits/Consults 2,837.5 39.40 9.32 2,764.3 36.94 8.51 Well Baby Exams/Physical Exams 7,987.2 22.16 14.75 7,816.5 21.37 13.92 Emergency Room Visits 1,214.1 34.98 3.54 1,205.5 35.40 3.56 Clinic Visit/Services 7,579.8 44.09 27.85 7,087.7 50.67 29.93 Radiology and Pathology 3,012.0 11.78 2.96 2,996.5 11.98 2.99 Outpatient Behavioral Health - - - - - - Maternity 3.9 49.84 0.02 3.6 49.48 0.01 Chiropractor 21.1 10.60 0.02 21.7 10.56 0.02 Podiatrist 1.1 30.83 0.00 1.4 40.34 0.00 Vision - EyeCare & Eyewear - - - - - - Other Professional 8,795.5 16.03 11.75 9,567.8 14.78 11.78 DMHDD / DASA - - - - - - PCCM Fee - - - - - -
Subtotal 32,104.7 $ 28.65 $ 76.65 32,024.1 $ 28.55 $ 76.18
Total Claims/Benefit Cost 41,570.4 $ 52.19 $ 180.81 41,464.5 $ 42.19 $ 145.77
ATTACHMENT 3 Milliman, Inc.Page 22 of 50

3/26/20132:36 PM
State of IllinoisDepartment of Healthcare and Family Services
VMC Base Data
Region: 3 Member Months: 246,174 Member Months: 252,413 Ratecell: 2 thru 5 Years
Fiscal Year 2010 Fiscal Year 2011Average Average
Admits Length Utilization Cost per Admits Length Utilization Cost perType of Service Per 1,000 of Stay Per 1,000 Service PMPM Per 1,000 of Stay Per 1,000 Service PMPM
Inpatient HospitalMedical/Surgical 26.0 2.6 68.3 $ 1,537.54 $ 8.75 25.6 3.0 77.3 $ 1,690.42 $ 10.89Well Newborn - - - - - - - - - - Other Newborn - - - - - - - - - - Maternity Non-Delivery - - - - - - - - - - Psychiatric/Substance Abuse 0.2 7.0 1.4 664.65 0.08 0.7 8.0 5.6 864.65 0.40 Long Term Care - - - - - - - - - - Other Inpatient - - - - - - - - - -
Subtotal 26.3 2.7 69.7 $ 1,520.01 $ 8.83 26.3 3.2 82.9 $ 1,634.64 $ 11.29
Outpatient HospitalGeneral Outpatient 118.6 375.65 3.71 118.5 372.79 3.68 Emergency Room 815.4 91.14 6.19 784.7 113.20 7.40 End-Stage Renal Disease - - - - - -
Subtotal 934.0 $ 127.26 $ 9.91 903.2 $ 147.25 $ 11.08
AncillariesPrescription Drugs 4,892.8 37.85 15.43 4,701.5 39.62 15.52 Transportation 163.3 54.32 0.74 197.9 47.92 0.79 DME/Prosthetics/Orthotics 308.6 115.62 2.97 276.9 115.75 2.67 Home Health/Hospice 18.2 615.08 0.93 19.6 655.82 1.07 Other Ancillary 64.3 21.25 0.11 69.9 19.86 0.12
Subtotal 5,447.2 $ 44.49 $ 20.19 5,265.8 $ 45.97 $ 20.17
PhysicianSurgery 133.5 127.86 1.42 141.7 133.67 1.58 Anesthesia 66.6 146.97 0.82 67.6 149.63 0.84 Hospital Inpatient Visits 84.6 40.02 0.28 95.1 41.01 0.33 Office Visits/Consults 1,877.8 39.84 6.23 1,637.8 39.93 5.45 Well Baby Exams/Physical Exams 1,807.6 26.25 3.95 1,867.1 24.94 3.88 Emergency Room Visits 718.0 34.28 2.05 680.2 34.69 1.97 Clinic Visit/Services 6,022.3 31.43 15.77 5,472.3 34.69 15.82 Radiology and Pathology 2,338.3 11.10 2.16 2,275.3 11.27 2.14 Outpatient Behavioral Health 9.8 54.87 0.04 9.0 45.14 0.03 Maternity 2.1 51.07 0.01 2.1 50.94 0.01 Chiropractor 33.4 10.38 0.03 34.5 10.65 0.03 Podiatrist 2.0 37.82 0.01 1.7 35.68 0.01 Vision - EyeCare & Eyewear - - - - - - Other Professional 8,895.6 15.30 11.34 9,546.8 13.68 10.88 DMHDD / DASA 71.0 82.44 0.49 65.8 72.39 0.40 PCCM Fee - - - - - -
Subtotal 22,062.9 $ 24.27 $ 44.61 21,897.0 $ 23.76 $ 43.35
Total Claims/Benefit Cost 28,513.8 $ 35.16 $ 83.54 28,148.9 $ 36.62 $ 85.90
ATTACHMENT 3 Milliman, Inc.Page 23 of 50

3/26/20132:36 PM
State of IllinoisDepartment of Healthcare and Family Services
VMC Base Data
Region: 3 Member Months: 458,457 Member Months: 475,100 Ratecell: 6 thru 13 Years
Fiscal Year 2010 Fiscal Year 2011Average Average
Admits Length Utilization Cost per Admits Length Utilization Cost perType of Service Per 1,000 of Stay Per 1,000 Service PMPM Per 1,000 of Stay Per 1,000 Service PMPM
Inpatient HospitalMedical/Surgical 15.6 2.9 45.4 $ 1,760.59 $ 6.66 14.8 3.6 53.1 $ 1,775.73 $ 7.86Well Newborn - - - - - - - - - - Other Newborn - - - - - - - 0.6 808.32 0.04 Maternity Non-Delivery - - - - - - - 0.1 700.96 0.01 Psychiatric/Substance Abuse 9.9 9.5 93.6 678.98 5.30 8.3 9.6 79.9 682.01 4.54 Long Term Care - - - - - - - - - - Other Inpatient - - - - - - - - - -
Subtotal 25.5 5.5 139.0 $ 1,032.25 $ 11.96 23.2 5.8 133.7 $ 1,116.97 $ 12.44
Outpatient HospitalGeneral Outpatient 103.6 354.41 3.06 107.1 372.57 3.33 Emergency Room 571.2 99.51 4.74 522.3 122.53 5.33 End-Stage Renal Disease 1.4 819.39 0.10 - - -
Subtotal 676.2 $ 140.06 $ 7.89 629.4 $ 165.08 $ 8.66
AncillariesPrescription Drugs 5,830.8 66.89 32.50 5,735.6 71.86 34.35 Transportation 199.6 37.79 0.63 201.8 37.03 0.62 DME/Prosthetics/Orthotics 140.3 111.51 1.30 164.9 111.55 1.53 Home Health/Hospice 4.2 269.90 0.09 9.5 217.34 0.17 Other Ancillary 26.1 21.87 0.05 31.9 20.47 0.05
Subtotal 6,201.0 $ 66.91 $ 34.57 6,143.7 $ 71.74 $ 36.73
PhysicianSurgery 119.1 134.37 1.33 121.1 128.59 1.30 Anesthesia 39.4 149.03 0.49 38.8 152.33 0.49 Hospital Inpatient Visits 116.9 34.50 0.34 119.6 33.03 0.33 Office Visits/Consults 1,172.5 45.03 4.40 1,036.3 44.64 3.85 Well Baby Exams/Physical Exams 526.0 31.54 1.38 544.6 30.19 1.37 Emergency Room Visits 504.8 34.63 1.46 460.9 35.04 1.35 Clinic Visit/Services 5,622.6 28.75 13.47 5,096.6 31.40 13.33 Radiology and Pathology 1,647.9 12.83 1.76 1,616.4 13.05 1.76 Outpatient Behavioral Health 98.5 41.43 0.34 101.3 41.97 0.35 Maternity 0.9 50.90 0.00 1.1 49.37 0.00 Chiropractor 61.6 10.55 0.05 52.1 10.61 0.05 Podiatrist 10.9 52.84 0.05 9.4 50.13 0.04 Vision - EyeCare & Eyewear - - - - - - Other Professional 7,256.1 3.46 2.09 7,987.6 3.63 2.42 DMHDD / DASA 486.2 75.25 3.05 455.0 75.42 2.86 PCCM Fee - - - - - -
Subtotal 17,663.5 $ 20.53 $ 30.21 17,640.8 $ 20.07 $ 29.50
Total Claims/Benefit Cost 24,679.7 $ 41.15 $ 84.64 24,547.6 $ 42.69 $ 87.34
ATTACHMENT 3 Milliman, Inc.Page 24 of 50

3/26/20132:36 PM
State of IllinoisDepartment of Healthcare and Family Services
VMC Base Data
Region: 3 Member Months: 141,399 Member Months: 143,105 Ratecell: 14 thru 20 Male
Fiscal Year 2010 Fiscal Year 2011Average Average
Admits Length Utilization Cost per Admits Length Utilization Cost perType of Service Per 1,000 of Stay Per 1,000 Service PMPM Per 1,000 of Stay Per 1,000 Service PMPM
Inpatient HospitalMedical/Surgical 21.2 2.7 56.2 $ 1,860.02 $ 8.71 23.7 3.9 93.1 $ 2,305.26 $ 17.88Well Newborn - - - - - - - - - - Other Newborn - - - - - - - - - - Maternity Non-Delivery - - - - - - - - - - Psychiatric/Substance Abuse 26.1 7.1 185.7 649.94 10.06 26.0 8.8 228.4 702.99 13.38 Long Term Care - - - - - - - - - - Other Inpatient - - - - - 0.1 18.0 1.8 6,546.33 0.98
Subtotal 47.3 5.1 241.9 $ 931.08 $ 18.77 49.8 6.5 323.3 $ 1,196.93 $ 32.25
Outpatient HospitalGeneral Outpatient 182.0 359.04 5.45 201.0 488.18 8.18 Emergency Room 659.0 115.07 6.32 624.4 140.06 7.29 End-Stage Renal Disease 0.2 384.73 0.01 - - -
Subtotal 841.1 $ 167.94 $ 11.77 825.4 $ 224.83 $ 15.46
AncillariesPrescription Drugs 5,813.4 71.86 34.81 5,805.0 78.05 37.76 Transportation 399.2 44.29 1.47 399.7 46.22 1.54 DME/Prosthetics/Orthotics 134.4 120.89 1.35 146.2 88.91 1.08 Home Health/Hospice 25.1 274.38 0.57 59.5 234.36 1.16 Other Ancillary 7.9 26.39 0.02 10.7 22.91 0.02
Subtotal 6,380.1 $ 71.90 $ 38.23 6,421.2 $ 77.67 $ 41.56
PhysicianSurgery 166.8 163.72 2.28 179.8 161.41 2.42 Anesthesia 42.7 178.77 0.64 43.2 188.86 0.68 Hospital Inpatient Visits 207.7 33.41 0.58 274.7 32.29 0.74 Office Visits/Consults 939.4 44.01 3.45 895.7 42.74 3.19 Well Baby Exams/Physical Exams 376.5 34.22 1.07 380.2 33.81 1.07 Emergency Room Visits 594.4 36.92 1.83 552.3 37.70 1.74 Clinic Visit/Services 5,631.8 26.45 12.41 5,238.2 28.76 12.55 Radiology and Pathology 2,217.6 17.59 3.25 2,304.1 17.77 3.41 Outpatient Behavioral Health 122.5 43.58 0.44 135.8 42.42 0.48 Maternity 0.9 51.86 0.00 0.4 52.41 0.00 Chiropractor 140.2 10.35 0.12 124.0 10.17 0.11 Podiatrist 27.6 47.92 0.11 25.4 45.89 0.10 Vision - EyeCare & Eyewear - - - - - - Other Professional 6,793.4 3.54 2.01 7,423.8 3.45 2.14 DMHDD / DASA 2,017.1 133.55 22.45 1,903.7 129.94 20.61 PCCM Fee - - - - - -
Subtotal 19,278.6 $ 31.52 $ 50.63 19,481.3 $ 30.33 $ 49.23
Total Claims/Benefit Cost 26,741.7 $ 53.58 $ 119.40 27,051.2 $ 61.44 $ 138.51
ATTACHMENT 3 Milliman, Inc.Page 25 of 50

3/26/20132:36 PM
State of IllinoisDepartment of Healthcare and Family Services
VMC Base Data
Region: 3 Member Months: 163,954 Member Months: 163,863 Ratecell: 14 thru 20 Female
Fiscal Year 2010 Fiscal Year 2011Average Average
Admits Length Utilization Cost per Admits Length Utilization Cost perType of Service Per 1,000 of Stay Per 1,000 Service PMPM Per 1,000 of Stay Per 1,000 Service PMPM
Inpatient HospitalMedical/Surgical 28.5 3.9 111.7 $ 1,696.83 $ 15.79 24.7 3.9 97.0 $ 1,701.31 $ 13.75Well Newborn - - - - - - - - - - Other Newborn - - - - - 0.1 1.0 0.1 1,337.79 0.01 Maternity Non-Delivery 15.3 2.4 36.1 668.60 2.01 15.2 2.4 36.1 669.14 2.01 Psychiatric/Substance Abuse 24.5 6.8 166.1 619.74 8.58 29.5 7.1 208.3 664.65 11.54 Long Term Care - - - - - - - - - - Other Inpatient - - - - - - - - - -
Subtotal 68.4 4.6 313.9 $ 1,008.64 $ 26.38 69.5 4.9 341.6 $ 959.50 $ 27.31
Outpatient HospitalGeneral Outpatient 569.4 253.21 12.02 530.3 278.87 12.32 Emergency Room 1,018.5 117.75 9.99 974.1 137.83 11.19 End-Stage Renal Disease - - - 0.8 295.80 0.02
Subtotal 1,587.9 $ 166.33 $ 22.01 1,505.1 $ 187.62 $ 23.53
AncillariesPrescription Drugs 8,838.6 48.27 35.55 8,762.3 50.21 36.66 Transportation 437.4 50.77 1.85 537.9 44.41 1.99 DME/Prosthetics/Orthotics 123.2 103.20 1.06 128.2 99.84 1.07 Home Health/Hospice 15.2 61.14 0.08 19.0 69.10 0.11 Other Ancillary 8.6 24.01 0.02 10.1 23.39 0.02
Subtotal 9,423.0 $ 49.10 $ 38.56 9,457.5 $ 50.56 $ 39.85
PhysicianSurgery 176.5 154.82 2.28 172.5 163.58 2.35 Anesthesia 134.9 261.91 2.94 130.3 263.80 2.86 Hospital Inpatient Visits 308.5 36.51 0.94 330.7 34.56 0.95 Office Visits/Consults 1,497.4 40.75 5.09 1,433.0 39.75 4.75 Well Baby Exams/Physical Exams 493.9 34.89 1.44 490.5 33.51 1.37 Emergency Room Visits 949.9 38.94 3.08 908.1 39.51 2.99 Clinic Visit/Services 7,421.4 40.87 25.27 6,990.1 42.89 24.98 Radiology and Pathology 7,645.3 17.10 10.90 7,068.1 17.02 10.02 Outpatient Behavioral Health 131.1 49.86 0.54 140.5 49.72 0.58 Maternity 16.3 50.07 0.07 14.0 48.99 0.06 Chiropractor 184.4 10.49 0.16 176.4 10.31 0.15 Podiatrist 25.7 46.26 0.10 22.5 56.08 0.11 Vision - EyeCare & Eyewear - - - - - - Other Professional 7,433.8 9.19 5.69 7,939.9 7.59 5.02 DMHDD / DASA 1,239.5 118.47 12.24 1,113.9 113.27 10.51 PCCM Fee - - - - - -
Subtotal 27,658.5 $ 30.69 $ 70.73 26,930.6 $ 29.73 $ 66.72
Total Claims/Benefit Cost 38,983.3 $ 48.54 $ 157.69 38,234.8 $ 49.40 $ 157.41
ATTACHMENT 3 Milliman, Inc.Page 26 of 50

3/26/20132:36 PM
State of IllinoisDepartment of Healthcare and Family Services
VMC Base Data
Region: 3 Member Months: 114,524 Member Months: 118,337 Ratecell: 21 thru 44 Male
Fiscal Year 2010 Fiscal Year 2011Average Average
Admits Length Utilization Cost per Admits Length Utilization Cost perType of Service Per 1,000 of Stay Per 1,000 Service PMPM Per 1,000 of Stay Per 1,000 Service PMPM
Inpatient HospitalMedical/Surgical 72.4 3.7 269.4 $ 1,875.90 $ 42.11 69.6 3.4 239.1 $ 1,745.78 $ 34.78Well Newborn - - - - - - - - - - Other Newborn 0.1 1.0 0.1 1,894.31 0.02 - - - - - Maternity Non-Delivery 0.1 1.0 0.1 1,427.05 0.01 0.5 5.0 2.5 430.42 0.09 Psychiatric/Substance Abuse 28.9 3.4 97.7 483.45 3.94 27.5 3.4 93.1 515.01 4.00 Long Term Care 0.8 17.5 14.0 121.08 0.14 0.6 15.0 9.0 120.91 0.09 Other Inpatient 0.1 13.0 1.3 88.66 0.01 - - - - -
Subtotal 102.5 3.7 382.6 $ 1,449.93 $ 46.23 98.2 3.5 343.8 $ 1,359.88 $ 38.96
Outpatient HospitalGeneral Outpatient 526.0 380.18 16.66 533.4 417.24 18.55 Emergency Room 1,073.6 125.60 11.24 1,014.4 151.77 12.83 End-Stage Renal Disease 8.1 894.76 0.60 4.5 1,144.67 0.43
Subtotal 1,607.7 $ 212.77 $ 28.51 1,552.2 $ 245.89 $ 31.81
AncillariesPrescription Drugs 13,168.3 47.39 52.00 13,185.7 47.45 52.14 Transportation 361.1 60.47 1.82 487.8 48.26 1.96 DME/Prosthetics/Orthotics 549.8 90.04 4.13 616.2 81.45 4.18 Home Health/Hospice 49.8 69.61 0.29 36.5 61.35 0.19 Other Ancillary 5.6 25.84 0.01 8.2 26.27 0.02
Subtotal 14,134.5 $ 49.45 $ 58.25 14,334.5 $ 48.96 $ 58.49
PhysicianSurgery 396.1 200.84 6.63 410.2 194.39 6.64 Anesthesia 105.0 177.34 1.55 93.7 188.18 1.47 Hospital Inpatient Visits 387.9 39.78 1.29 344.4 41.37 1.19 Office Visits/Consults 1,234.9 45.16 4.65 1,184.9 44.69 4.41 Well Baby Exams/Physical Exams 12.2 65.44 0.07 12.5 77.92 0.08 Emergency Room Visits 971.6 40.30 3.26 916.2 41.33 3.16 Clinic Visit/Services 5,556.8 32.83 15.20 5,417.4 33.42 15.09 Radiology and Pathology 4,588.0 18.95 7.24 4,605.9 19.19 7.37 Outpatient Behavioral Health 94.0 50.63 0.40 94.5 51.93 0.41 Maternity 0.2 52.39 0.00 0.4 50.70 0.00 Chiropractor 328.7 8.66 0.24 342.9 8.67 0.25 Podiatrist 24.8 50.08 0.10 38.0 49.27 0.16 Vision - EyeCare & Eyewear - - - - - - Other Professional 6,754.5 8.35 4.70 7,237.8 7.38 4.45 DMHDD / DASA 699.1 70.78 4.12 695.9 70.81 4.11 PCCM Fee - - - - - -
Subtotal 21,153.7 $ 28.05 $ 49.45 21,394.7 $ 27.36 $ 48.78
Total Claims/Benefit Cost 37,278.5 $ 58.73 $ 182.43 37,625.2 $ 56.78 $ 178.03
ATTACHMENT 3 Milliman, Inc.Page 27 of 50

3/26/20132:36 PM
State of IllinoisDepartment of Healthcare and Family Services
VMC Base Data
Region: 3 Member Months: 376,598 Member Months: 386,410 Ratecell: 21 thru 44 Female
Fiscal Year 2010 Fiscal Year 2011Average Average
Admits Length Utilization Cost per Admits Length Utilization Cost perType of Service Per 1,000 of Stay Per 1,000 Service PMPM Per 1,000 of Stay Per 1,000 Service PMPM
Inpatient HospitalMedical/Surgical 69.7 3.2 220.2 $ 1,444.21 $ 26.50 67.5 3.2 216.3 $ 1,615.95 $ 29.13Well Newborn - - - - - - - - - - Other Newborn - - - - - - - - - - Maternity Non-Delivery 20.0 2.5 49.5 697.37 2.88 20.8 2.5 52.2 814.71 3.54 Psychiatric/Substance Abuse 20.6 3.8 77.3 469.80 3.03 20.1 3.7 74.2 492.01 3.04 Long Term Care 0.5 18.8 9.4 208.57 0.16 0.2 20.0 4.0 99.78 0.03 Other Inpatient - - - - - - - 0.6 3,803.85 0.19
Subtotal 110.9 3.2 356.4 $ 1,096.55 $ 32.57 108.6 3.2 347.3 $ 1,241.71 $ 35.94
Outpatient HospitalGeneral Outpatient 994.0 296.14 24.53 986.5 327.50 26.92 Emergency Room 1,356.1 125.78 14.21 1,354.7 146.83 16.58 End-Stage Renal Disease 8.3 766.54 0.53 3.7 707.05 0.22
Subtotal 2,358.5 $ 199.83 $ 39.27 2,344.8 $ 223.73 $ 43.72
AncillariesPrescription Drugs 18,295.4 45.97 70.09 18,287.1 45.67 69.59 Transportation 708.5 40.89 2.41 733.5 39.60 2.42 DME/Prosthetics/Orthotics 373.6 84.05 2.62 373.4 83.35 2.59 Home Health/Hospice 62.8 64.21 0.34 51.4 65.53 0.28 Other Ancillary 4.7 27.61 0.01 4.9 26.64 0.01
Subtotal 19,445.0 $ 46.57 $ 75.47 19,450.3 $ 46.21 $ 74.90
PhysicianSurgery 488.3 186.18 7.58 506.0 185.48 7.82 Anesthesia 253.8 214.04 4.53 250.9 222.02 4.64 Hospital Inpatient Visits 400.4 38.17 1.27 414.6 38.64 1.33 Office Visits/Consults 1,924.9 42.27 6.78 1,852.7 41.68 6.43 Well Baby Exams/Physical Exams 313.3 50.02 1.31 298.4 48.03 1.19 Emergency Room Visits 1,273.6 41.06 4.36 1,269.8 41.54 4.40 Clinic Visit/Services 8,533.4 42.47 30.20 8,488.4 44.42 31.42 Radiology and Pathology 11,412.5 17.93 17.05 11,488.5 17.89 17.13 Outpatient Behavioral Health 117.1 47.69 0.47 101.7 50.64 0.43 Maternity 13.6 49.97 0.06 13.4 46.26 0.05 Chiropractor 384.7 8.79 0.28 359.5 8.77 0.26 Podiatrist 39.6 41.79 0.14 48.9 41.06 0.17 Vision - EyeCare & Eyewear - - - - - - Other Professional 7,375.7 15.79 9.70 7,628.3 14.97 9.52 DMHDD / DASA 779.3 71.15 4.62 755.2 72.41 4.56 PCCM Fee - - - - - -
Subtotal 33,310.3 $ 31.82 $ 88.34 33,476.3 $ 32.03 $ 89.36
Total Claims/Benefit Cost 55,470.2 $ 50.98 $ 235.65 55,618.7 $ 52.63 $ 243.92
ATTACHMENT 3 Milliman, Inc.Page 28 of 50
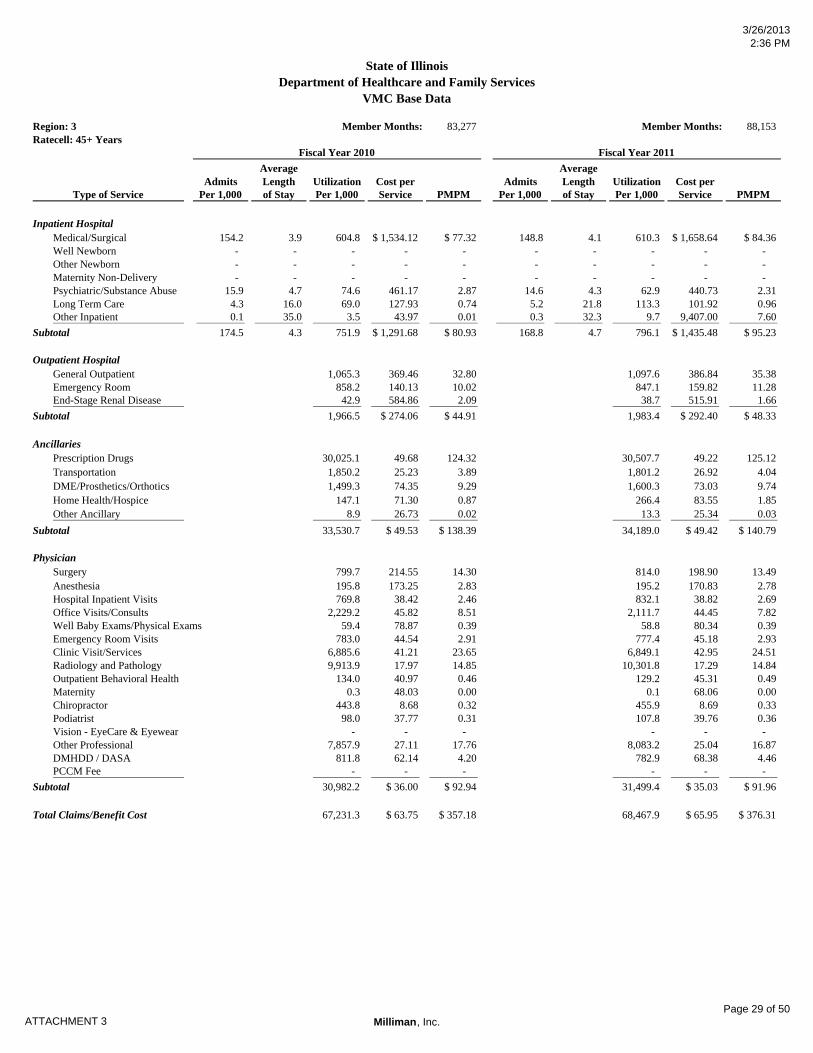
3/26/20132:36 PM
State of IllinoisDepartment of Healthcare and Family Services
VMC Base Data
Region: 3 Member Months: 83,277 Member Months: 88,153 Ratecell: 45+ Years
Fiscal Year 2010 Fiscal Year 2011Average Average
Admits Length Utilization Cost per Admits Length Utilization Cost perType of Service Per 1,000 of Stay Per 1,000 Service PMPM Per 1,000 of Stay Per 1,000 Service PMPM
Inpatient HospitalMedical/Surgical 154.2 3.9 604.8 $ 1,534.12 $ 77.32 148.8 4.1 610.3 $ 1,658.64 $ 84.36Well Newborn - - - - - - - - - - Other Newborn - - - - - - - - - - Maternity Non-Delivery - - - - - - - - - - Psychiatric/Substance Abuse 15.9 4.7 74.6 461.17 2.87 14.6 4.3 62.9 440.73 2.31 Long Term Care 4.3 16.0 69.0 127.93 0.74 5.2 21.8 113.3 101.92 0.96 Other Inpatient 0.1 35.0 3.5 43.97 0.01 0.3 32.3 9.7 9,407.00 7.60
Subtotal 174.5 4.3 751.9 $ 1,291.68 $ 80.93 168.8 4.7 796.1 $ 1,435.48 $ 95.23
Outpatient HospitalGeneral Outpatient 1,065.3 369.46 32.80 1,097.6 386.84 35.38 Emergency Room 858.2 140.13 10.02 847.1 159.82 11.28 End-Stage Renal Disease 42.9 584.86 2.09 38.7 515.91 1.66
Subtotal 1,966.5 $ 274.06 $ 44.91 1,983.4 $ 292.40 $ 48.33
AncillariesPrescription Drugs 30,025.1 49.68 124.32 30,507.7 49.22 125.12 Transportation 1,850.2 25.23 3.89 1,801.2 26.92 4.04 DME/Prosthetics/Orthotics 1,499.3 74.35 9.29 1,600.3 73.03 9.74 Home Health/Hospice 147.1 71.30 0.87 266.4 83.55 1.85 Other Ancillary 8.9 26.73 0.02 13.3 25.34 0.03
Subtotal 33,530.7 $ 49.53 $ 138.39 34,189.0 $ 49.42 $ 140.79
PhysicianSurgery 799.7 214.55 14.30 814.0 198.90 13.49 Anesthesia 195.8 173.25 2.83 195.2 170.83 2.78 Hospital Inpatient Visits 769.8 38.42 2.46 832.1 38.82 2.69 Office Visits/Consults 2,229.2 45.82 8.51 2,111.7 44.45 7.82 Well Baby Exams/Physical Exams 59.4 78.87 0.39 58.8 80.34 0.39 Emergency Room Visits 783.0 44.54 2.91 777.4 45.18 2.93 Clinic Visit/Services 6,885.6 41.21 23.65 6,849.1 42.95 24.51 Radiology and Pathology 9,913.9 17.97 14.85 10,301.8 17.29 14.84 Outpatient Behavioral Health 134.0 40.97 0.46 129.2 45.31 0.49 Maternity 0.3 48.03 0.00 0.1 68.06 0.00 Chiropractor 443.8 8.68 0.32 455.9 8.69 0.33 Podiatrist 98.0 37.77 0.31 107.8 39.76 0.36 Vision - EyeCare & Eyewear - - - - - - Other Professional 7,857.9 27.11 17.76 8,083.2 25.04 16.87 DMHDD / DASA 811.8 62.14 4.20 782.9 68.38 4.46 PCCM Fee - - - - - -
Subtotal 30,982.2 $ 36.00 $ 92.94 31,499.4 $ 35.03 $ 91.96
Total Claims/Benefit Cost 67,231.3 $ 63.75 $ 357.18 68,467.9 $ 65.95 $ 376.31
ATTACHMENT 3 Milliman, Inc.Page 29 of 50

3/26/20132:36 PM
State of IllinoisDepartment of Healthcare and Family Services
VMC Base Data
Region: 3 Member Months: 1,740,404 Member Months: 1,784,316 Composite
Fiscal Year 2010 Fiscal Year 2011Average Average
Admits Length Utilization Cost per Admits Length Utilization Cost perType of Service Per 1,000 of Stay Per 1,000 Service PMPM Per 1,000 of Stay Per 1,000 Service PMPM
Inpatient HospitalMedical/Surgical 42.4 3.4 144.5 $ 1,631.95 $ 19.64 40.3 3.5 140.8 $ 1,719.63 $ 20.17Well Newborn 0.3 2.1 0.7 735.36 0.04 0.0 2.2 0.1 1,272.88 0.01 Other Newborn 12.1 7.3 87.7 1,478.22 10.81 12.9 7.1 91.9 1,536.46 11.77 Maternity Non-Delivery 5.7 2.4 14.0 691.04 0.80 5.9 2.5 14.7 779.83 0.96 Psychiatric/Substance Abuse 13.9 6.1 84.0 606.18 4.24 13.6 6.3 86.1 634.48 4.55 Long Term Care 0.3 17.3 5.0 159.83 0.07 0.2 20.7 5.1 103.11 0.04 Other Inpatient 0.0 37.9 0.5 10,146.48 0.40 0.0 33.1 0.6 7,506.73 0.38
Subtotal 74.7 4.5 336.4 $ 1,284.61 $ 36.01 73.0 4.6 339.3 $ 1,339.64 $ 37.88
Outpatient HospitalGeneral Outpatient 404.9 312.78 10.55 405.8 343.80 11.63 Emergency Room 903.6 111.47 8.39 872.8 133.08 9.68 End-Stage Renal Disease 4.1 718.30 0.25 2.4 628.69 0.13
Subtotal 1,312.6 $ 175.47 $ 19.19 1,280.9 $ 200.77 $ 21.43
AncillariesPrescription Drugs 9,843.7 50.78 41.65 9,792.8 52.02 42.45 Transportation 417.0 43.20 1.50 446.4 41.12 1.53 DME/Prosthetics/Orthotics 292.1 95.37 2.32 304.4 92.21 2.34 Home Health/Hospice 44.1 128.10 0.47 45.8 142.32 0.54 Other Ancillary 25.1 22.93 0.05 29.9 21.82 0.05
Subtotal 10,621.9 $ 51.96 $ 45.99 10,619.3 $ 53.02 $ 46.92
PhysicianSurgery 263.6 170.60 3.75 271.2 167.68 3.79 Anesthesia 109.8 198.72 1.82 108.4 203.46 1.84 Hospital Inpatient Visits 344.2 61.18 1.75 352.3 60.13 1.77 Office Visits/Consults 1,588.4 42.46 5.62 1,473.6 41.71 5.12 Well Baby Exams/Physical Exams 1,141.2 28.36 2.70 1,139.2 27.25 2.59 Emergency Room Visits 821.5 38.05 2.61 791.5 38.63 2.55 Clinic Visit/Services 6,607.4 36.09 19.87 6,251.2 38.88 20.26 Radiology and Pathology 4,998.2 16.52 6.88 4,968.9 16.52 6.84 Outpatient Behavioral Health 89.1 45.22 0.34 88.3 46.00 0.34 Maternity 5.3 50.14 0.02 5.1 47.64 0.02 Chiropractor 167.9 9.31 0.13 158.8 9.27 0.12 Podiatrist 21.5 44.45 0.08 23.5 44.28 0.09 Vision - EyeCare & Eyewear - - - - - - Other Professional 7,528.5 10.55 6.62 8,088.3 9.69 6.53 DMHDD / DASA 669.9 94.88 5.30 632.4 93.26 4.91 PCCM Fee - - - - - -
Subtotal 24,356.7 $ 28.32 $ 57.48 24,352.6 $ 27.97 $ 56.76
Total Claims/Benefit Cost 38,088.2 $ 54.31 $ 172.39 38,090.9 $ 55.26 $ 175.42
ATTACHMENT 3 Milliman, Inc.Page 30 of 50

3/26/20132:36 PM
State of IllinoisDepartment of Healthcare and Family Services
VMC Base Data
Region: 4 Member Months: 152,039 Member Months: 145,938 Ratecell: 0 thru 90 days
Fiscal Year 2010 Fiscal Year 2011Average Average
Admits Length Utilization Cost per Admits Length Utilization Cost perType of Service Per 1,000 of Stay Per 1,000 Service PMPM Per 1,000 of Stay Per 1,000 Service PMPM
Inpatient HospitalMedical/Surgical 160.6 6.3 1,010.0 $ 2,139.20 $ 180.05 157.5 6.0 938.9 $ 2,177.02 $ 170.33Well Newborn 90.4 2.3 212.3 2,627.18 46.48 75.8 2.5 188.5 2,815.87 44.23 Other Newborn 1,087.7 7.8 8,432.7 1,763.34 1,239.15 1,118.0 7.4 8,298.6 1,716.97 1,187.37 Maternity Non-Delivery - - - - - - - - - - Psychiatric/Substance Abuse 0.2 20.5 4.1 2,004.57 0.68 0.4 6.8 2.7 1,757.61 0.40 Long Term Care - - - - - - - - - - Other Inpatient 0.1 27.0 2.7 7,482.15 1.68 - - - - -
Subtotal 1,339.0 7.2 9,661.8 $ 1,823.32 $ 1,468.04 1,351.7 7.0 9,428.8 $ 1,784.74 $ 1,402.33
Outpatient HospitalGeneral Outpatient 309.2 387.69 9.99 317.4 360.34 9.53 Emergency Room 951.2 124.53 9.87 937.1 123.41 9.64 End-Stage Renal Disease - - - - - -
Subtotal 1,260.4 $ 189.09 $ 19.86 1,254.5 $ 183.35 $ 19.17
AncillariesPrescription Drugs 4,293.3 22.32 7.98 4,401.8 27.69 10.16 Transportation 307.0 65.27 1.67 360.1 56.91 1.71 DME/Prosthetics/Orthotics 251.7 82.50 1.73 266.7 77.99 1.73 Home Health/Hospice 85.2 90.04 0.64 98.3 115.89 0.95 Other Ancillary 21.2 50.44 0.09 42.7 46.78 0.17
Subtotal 4,958.4 $ 29.32 $ 12.11 5,169.5 $ 34.15 $ 14.71
PhysicianSurgery 651.1 155.93 8.46 629.2 147.02 7.71 Anesthesia 73.9 302.09 1.86 68.0 280.62 1.59 Hospital Inpatient Visits 10,528.6 106.54 93.47 10,017.0 108.00 90.15 Office Visits/Consults 2,355.1 50.42 9.90 2,269.9 50.57 9.57 Well Baby Exams/Physical Exams 13,026.0 35.90 38.97 13,286.8 35.62 39.44 Emergency Room Visits 873.8 40.58 2.96 863.0 40.49 2.91 Clinic Visit/Services 3,930.2 108.97 35.69 4,138.6 109.97 37.93 Radiology and Pathology 24,464.2 5.46 11.12 24,487.4 5.27 10.76 Outpatient Behavioral Health 2.8 52.01 0.01 3.5 51.71 0.02 Maternity 7.3 49.73 0.03 6.3 50.25 0.03 Chiropractor - - - - - - Podiatrist 2.4 49.46 0.01 4.1 50.45 0.02 Vision - EyeCare & Eyewear - - - - - - Other Professional 3,182.2 26.76 7.10 3,199.5 27.98 7.46 DMHDD / DASA - - - - - - PCCM Fee - - - - - -
Subtotal 59,097.5 $ 42.56 $ 209.58 58,973.3 $ 42.24 $ 207.57
Total Claims/Benefit Cost 74,978.1 $ 273.61 $ 1,709.59 74,826.1 $ 263.62 $ 1,643.79
ATTACHMENT 3 Milliman, Inc.Page 31 of 50

3/26/20132:36 PM
State of IllinoisDepartment of Healthcare and Family Services
VMC Base Data
Region: 4 Member Months: 681,490 Member Months: 659,727 Ratecell: 91 days thru 1 Year
Fiscal Year 2010 Fiscal Year 2011Average Average
Admits Length Utilization Cost per Admits Length Utilization Cost perType of Service Per 1,000 of Stay Per 1,000 Service PMPM Per 1,000 of Stay Per 1,000 Service PMPM
Inpatient HospitalMedical/Surgical 71.5 4.4 315.0 $ 2,130.83 $ 55.93 65.7 4.2 274.1 $ 2,038.78 $ 46.57Well Newborn - - - - - - - - - - Other Newborn 2.1 26.4 55.5 2,286.49 10.58 2.4 29.1 69.8 2,320.89 13.50 Maternity Non-Delivery - - - - - - - - - - Psychiatric/Substance Abuse - - 0.1 428.74 0.00 - - 0.1 778.53 0.01 Long Term Care - - - - - - - - - - Other Inpatient 0.1 14.0 1.4 10,438.96 1.22 - - - - -
Subtotal 73.7 5.0 372.0 $ 2,184.86 $ 67.73 68.1 5.1 344.0 $ 2,095.66 $ 60.08
Outpatient HospitalGeneral Outpatient 146.5 382.38 4.67 151.8 375.03 4.74 Emergency Room 1,082.7 107.70 9.72 1,066.6 105.67 9.39 End-Stage Renal Disease 0.4 957.41 0.03 0.4 501.08 0.02
Subtotal 1,229.6 $ 140.70 $ 14.42 1,218.8 $ 139.35 $ 14.15
AncillariesPrescription Drugs 6,990.5 30.72 17.90 6,873.1 30.72 17.59 Transportation 205.3 43.67 0.75 219.1 41.60 0.76 DME/Prosthetics/Orthotics 320.0 86.53 2.31 342.2 89.42 2.55 Home Health/Hospice 62.2 243.29 1.26 68.9 358.51 2.06 Other Ancillary 35.0 28.75 0.08 37.7 27.52 0.09
Subtotal 7,613.0 $ 35.14 $ 22.30 7,541.0 $ 36.68 $ 23.05
PhysicianSurgery 158.3 152.76 2.02 215.6 121.13 2.18 Anesthesia 46.6 202.32 0.79 48.1 196.05 0.79 Hospital Inpatient Visits 530.5 84.80 3.75 465.3 86.34 3.35 Office Visits/Consults 2,815.7 46.64 10.94 2,663.7 47.51 10.54 Well Baby Exams/Physical Exams 6,882.7 27.33 15.67 7,034.6 26.94 15.79 Emergency Room Visits 1,018.1 36.48 3.10 1,007.2 36.28 3.05 Clinic Visit/Services 5,657.3 43.70 20.60 5,654.1 43.04 20.28 Radiology and Pathology 5,211.4 8.07 3.50 5,220.5 7.91 3.44 Outpatient Behavioral Health 1.7 51.74 0.01 1.8 52.68 0.01 Maternity 9.1 50.12 0.04 7.4 50.14 0.03 Chiropractor 5.1 10.58 0.00 3.1 10.71 0.00 Podiatrist 6.7 36.29 0.02 8.2 38.22 0.03 Vision - EyeCare & Eyewear - - - - - - Other Professional 9,240.3 14.45 11.13 9,141.5 15.43 11.76 DMHDD / DASA 0.1 90.15 0.00 - - - PCCM Fee - - - - - -
Subtotal 31,583.5 $ 27.19 $ 71.56 31,471.0 $ 27.16 $ 71.24
Total Claims/Benefit Cost 40,798.1 $ 51.77 $ 176.01 40,574.8 $ 49.84 $ 168.52
ATTACHMENT 3 Milliman, Inc.Page 32 of 50

3/26/20132:36 PM
State of IllinoisDepartment of Healthcare and Family Services
VMC Base Data
Region: 4 Member Months: 1,324,676 Member Months: 1,353,811 Ratecell: 2 thru 5 Years
Fiscal Year 2010 Fiscal Year 2011Average Average
Admits Length Utilization Cost per Admits Length Utilization Cost perType of Service Per 1,000 of Stay Per 1,000 Service PMPM Per 1,000 of Stay Per 1,000 Service PMPM
Inpatient HospitalMedical/Surgical 24.9 3.5 86.3 $ 1,892.48 $ 13.61 23.5 3.2 75.9 $ 1,954.83 $ 12.36Well Newborn - - - - - - - - - - Other Newborn - - - - 0.00 - - 0.1 4,651.66 0.04 Maternity Non-Delivery - - - - 0.00 - - - - - Psychiatric/Substance Abuse 0.3 8.7 2.6 792.72 0.17 0.3 11.3 3.4 858.24 0.24 Long Term Care - - - - - - - - - - Other Inpatient 0.1 25.0 2.5 9,163.45 1.91 - - 0.9 10,857.68 0.81
Subtotal 25.3 3.6 91.4 $ 2,060.81 $ 15.70 23.9 3.4 80.4 $ 2,009.04 $ 13.46
Outpatient HospitalGeneral Outpatient 85.5 453.68 3.23 89.1 500.02 3.71 Emergency Room 574.6 107.62 5.15 559.4 109.52 5.11 End-Stage Renal Disease - - - - - -
Subtotal 660.1 $ 152.44 $ 8.39 648.5 $ 163.18 $ 8.82
AncillariesPrescription Drugs 4,750.3 32.07 12.70 4,728.4 34.49 13.59 Transportation 117.5 35.78 0.35 141.9 33.08 0.39 DME/Prosthetics/Orthotics 225.5 123.10 2.31 249.6 125.29 2.61 Home Health/Hospice 13.1 529.44 0.58 10.3 929.76 0.80 Other Ancillary 48.5 27.35 0.11 48.4 27.45 0.11
Subtotal 5,155.0 $ 37.36 $ 16.05 5,178.7 $ 40.55 $ 17.50
PhysicianSurgery 111.2 116.05 1.08 123.6 108.40 1.12 Anesthesia 31.2 173.69 0.45 33.5 171.65 0.48 Hospital Inpatient Visits 109.0 39.90 0.36 103.5 40.42 0.35 Office Visits/Consults 2,212.9 45.65 8.42 2,070.6 47.32 8.16 Well Baby Exams/Physical Exams 2,150.8 35.38 6.34 2,176.8 33.98 6.16 Emergency Room Visits 529.8 35.56 1.57 517.3 35.61 1.53 Clinic Visit/Services 4,478.5 30.67 11.45 4,503.9 29.12 10.93 Radiology and Pathology 3,928.0 7.42 2.43 3,927.9 7.35 2.41 Outpatient Behavioral Health 10.1 51.46 0.04 9.1 52.46 0.04 Maternity 6.8 50.22 0.03 5.2 50.29 0.02 Chiropractor 3.6 10.51 0.00 4.0 10.42 0.00 Podiatrist 14.8 31.69 0.04 15.0 34.03 0.04 Vision - EyeCare & Eyewear - - - - - - Other Professional 9,815.4 13.18 10.78 9,729.4 13.88 11.26 DMHDD / DASA 27.6 107.52 0.25 28.8 111.65 0.27 PCCM Fee - - - - - -
Subtotal 23,429.7 $ 22.15 $ 43.24 23,248.7 $ 22.08 $ 42.77
Total Claims/Benefit Cost 29,336.2 $ 34.10 $ 83.37 29,156.3 $ 33.98 $ 82.55
ATTACHMENT 3 Milliman, Inc.Page 33 of 50

3/26/20132:36 PM
State of IllinoisDepartment of Healthcare and Family Services
VMC Base Data
Region: 4 Member Months: 2,379,962 Member Months: 2,507,789 Ratecell: 6 thru 13 Years
Fiscal Year 2010 Fiscal Year 2011Average Average
Admits Length Utilization Cost per Admits Length Utilization Cost perType of Service Per 1,000 of Stay Per 1,000 Service PMPM Per 1,000 of Stay Per 1,000 Service PMPM
Inpatient HospitalMedical/Surgical 15.6 3.3 50.9 $ 2,010.22 $ 8.53 14.8 3.4 50.3 $ 1,953.82 $ 8.19Well Newborn - - - - - - - - - - Other Newborn - - - - - - - - - 0.00 Maternity Non-Delivery - - - - 0.00 - - - - - Psychiatric/Substance Abuse 5.0 11.4 56.9 772.10 3.66 4.7 12.0 56.6 770.89 3.64 Long Term Care - - - - - - - - - - Other Inpatient - - 0.8 10,560.45 0.70 - - 0.9 12,442.30 0.93
Subtotal 20.7 5.2 108.5 $ 1,425.90 $ 12.89 19.6 5.5 107.9 $ 1,419.22 $ 12.76
Outpatient HospitalGeneral Outpatient 75.8 408.92 2.58 76.0 418.55 2.65 Emergency Room 333.5 117.23 3.26 326.5 118.44 3.22 End-Stage Renal Disease 0.4 1,174.39 0.04 0.1 1,306.75 0.01
Subtotal 409.8 $ 172.19 $ 5.88 402.6 $ 175.39 $ 5.88
AncillariesPrescription Drugs 3,773.5 51.59 16.22 3,800.6 52.08 16.49 Transportation 625.7 11.72 0.61 413.8 13.78 0.48 DME/Prosthetics/Orthotics 128.3 124.71 1.33 145.7 126.95 1.54 Home Health/Hospice 6.8 232.88 0.13 6.1 351.39 0.18 Other Ancillary 19.0 26.66 0.04 19.1 26.02 0.04
Subtotal 4,553.4 $ 48.34 $ 18.34 4,385.4 $ 51.25 $ 18.73
PhysicianSurgery 80.8 129.58 0.87 85.4 127.25 0.91 Anesthesia 21.4 177.81 0.32 22.5 175.80 0.33 Hospital Inpatient Visits 116.5 37.77 0.37 119.0 37.47 0.37 Office Visits/Consults 1,502.0 46.16 5.78 1,430.2 47.80 5.70 Well Baby Exams/Physical Exams 999.2 39.17 3.26 1,032.5 38.31 3.30 Emergency Room Visits 309.6 36.64 0.95 304.9 36.56 0.93 Clinic Visit/Services 3,736.8 23.61 7.35 3,825.5 23.14 7.38 Radiology and Pathology 2,755.2 8.09 1.86 2,834.5 8.14 1.92 Outpatient Behavioral Health 83.6 50.11 0.35 77.2 49.85 0.32 Maternity 5.2 50.47 0.02 3.7 50.18 0.02 Chiropractor 6.1 10.54 0.01 6.9 10.36 0.01 Podiatrist 30.3 38.18 0.10 35.5 39.00 0.12 Vision - EyeCare & Eyewear - - - - - - Other Professional 8,653.8 3.82 2.76 8,593.0 4.02 2.88 DMHDD / DASA 261.0 83.80 1.82 270.7 82.68 1.87 PCCM Fee - - - - - -
Subtotal 18,561.5 $ 16.68 $ 25.80 18,641.4 $ 16.76 $ 26.03
Total Claims/Benefit Cost 23,633.2 $ 31.95 $ 62.92 23,537.3 $ 32.33 $ 63.41
ATTACHMENT 3 Milliman, Inc.Page 34 of 50

3/26/20132:36 PM
State of IllinoisDepartment of Healthcare and Family Services
VMC Base Data
Region: 4 Member Months: 661,570 Member Months: 696,687 Ratecell: 14 thru 20 Male
Fiscal Year 2010 Fiscal Year 2011Average Average
Admits Length Utilization Cost per Admits Length Utilization Cost perType of Service Per 1,000 of Stay Per 1,000 Service PMPM Per 1,000 of Stay Per 1,000 Service PMPM
Inpatient HospitalMedical/Surgical 22.6 4.2 95.5 $ 1,986.25 $ 15.81 22.0 4.5 98.3 $ 2,072.60 $ 16.98Well Newborn - - - - - - - - - - Other Newborn - - 0.1 810.07 0.01 - - - - - Maternity Non-Delivery - - - - - - - - - 0.00 Psychiatric/Substance Abuse 18.8 11.0 207.2 747.06 12.90 20.7 10.7 221.5 727.30 13.42 Long Term Care 0.1 14.0 1.4 129.48 0.02 0.3 13.0 3.9 186.65 0.06 Other Inpatient - - 0.5 10,690.31 0.45 0.1 29.0 2.9 11,946.71 2.89
Subtotal 41.5 7.3 304.7 $ 1,148.95 $ 29.17 43.0 7.6 326.6 $ 1,225.45 $ 33.35
Outpatient HospitalGeneral Outpatient 114.8 464.55 4.44 119.3 455.97 4.53 Emergency Room 361.3 143.89 4.33 353.3 146.31 4.31 End-Stage Renal Disease 2.4 509.72 0.10 0.8 995.68 0.07
Subtotal 478.6 $ 222.61 $ 8.88 473.5 $ 225.73 $ 8.91
AncillariesPrescription Drugs 3,324.2 83.29 23.07 3,376.2 85.61 24.09 Transportation 1,451.3 11.91 1.44 799.5 17.41 1.16 DME/Prosthetics/Orthotics 102.3 116.69 0.99 124.1 130.72 1.35 Home Health/Hospice 12.1 186.00 0.19 14.0 385.67 0.45 Other Ancillary 6.5 26.39 0.01 5.8 27.15 0.01
Subtotal 4,896.5 $ 63.01 $ 25.71 4,319.7 $ 75.18 $ 27.06
PhysicianSurgery 113.8 158.79 1.51 124.6 154.42 1.60 Anesthesia 27.5 202.59 0.46 29.6 196.62 0.49 Hospital Inpatient Visits 245.5 35.65 0.73 287.9 36.32 0.87 Office Visits/Consults 1,087.7 47.17 4.28 1,062.1 47.67 4.22 Well Baby Exams/Physical Exams 734.1 43.48 2.66 789.5 43.26 2.85 Emergency Room Visits 321.7 39.04 1.05 315.3 39.30 1.03 Clinic Visit/Services 3,594.1 21.39 6.41 3,615.6 21.18 6.38 Radiology and Pathology 3,345.6 10.43 2.91 3,511.0 10.47 3.06 Outpatient Behavioral Health 135.4 48.75 0.55 129.7 49.84 0.54 Maternity 5.5 49.63 0.02 3.9 50.13 0.02 Chiropractor 9.7 10.24 0.01 11.4 10.37 0.01 Podiatrist 52.6 43.29 0.19 62.2 45.28 0.23 Vision - EyeCare & Eyewear - - - - - - Other Professional 8,239.8 3.40 2.33 8,351.8 3.62 2.52 DMHDD / DASA 826.4 121.03 8.33 805.7 118.71 7.97 PCCM Fee - - - - - -
Subtotal 18,739.3 $ 20.13 $ 31.43 19,100.5 $ 19.97 $ 31.79
Total Claims/Benefit Cost 24,419.1 $ 46.78 $ 95.19 24,220.3 $ 50.10 $ 101.11
ATTACHMENT 3 Milliman, Inc.Page 35 of 50

3/26/20132:36 PM
State of IllinoisDepartment of Healthcare and Family Services
VMC Base Data
Region: 4 Member Months: 738,429 Member Months: 762,981 Ratecell: 14 thru 20 Female
Fiscal Year 2010 Fiscal Year 2011Average Average
Admits Length Utilization Cost per Admits Length Utilization Cost perType of Service Per 1,000 of Stay Per 1,000 Service PMPM Per 1,000 of Stay Per 1,000 Service PMPM
Inpatient HospitalMedical/Surgical 23.2 3.2 74.9 $ 1,908.47 $ 11.91 21.9 3.5 77.2 $ 2,030.15 $ 13.06Well Newborn - - - - 0.01 - - - - - Other Newborn - - 0.1 388.69 0.00 - - - - - Maternity Non-Delivery 11.7 2.6 30.5 1,042.07 2.65 9.8 2.5 24.9 1,193.57 2.48 Psychiatric/Substance Abuse 21.1 10.0 210.9 729.19 12.82 22.9 10.2 234.4 730.76 14.27 Long Term Care 0.1 30.0 3.0 122.96 0.03 - - - - - Other Inpatient - - 1.6 6,797.83 0.91 - - 1.2 11,937.17 1.19
Subtotal 56.2 5.7 320.9 $ 1,059.14 $ 28.32 54.7 6.2 337.7 $ 1,101.75 $ 31.01
Outpatient HospitalGeneral Outpatient 330.0 280.32 7.71 318.7 275.87 7.33 Emergency Room 526.9 149.00 6.54 517.5 149.33 6.44 End-Stage Renal Disease 0.5 848.00 0.04 1.9 803.19 0.13
Subtotal 857.4 $ 199.95 $ 14.29 838.2 $ 198.90 $ 13.89
AncillariesPrescription Drugs 5,067.2 45.70 19.30 4,936.9 51.24 21.08 Transportation 1,294.9 15.56 1.68 968.6 18.68 1.51 DME/Prosthetics/Orthotics 122.6 114.62 1.17 137.8 110.57 1.27 Home Health/Hospice 15.6 66.60 0.09 10.3 63.41 0.05 Other Ancillary 5.5 27.15 0.01 5.1 27.41 0.01
Subtotal 6,505.7 $ 41.03 $ 22.24 6,058.6 $ 47.38 $ 23.92
PhysicianSurgery 91.3 150.44 1.14 94.9 156.65 1.24 Anesthesia 77.8 292.35 1.90 72.6 304.55 1.84 Hospital Inpatient Visits 315.3 36.72 0.96 340.7 36.85 1.05 Office Visits/Consults 1,496.4 46.45 5.79 1,432.1 47.39 5.66 Well Baby Exams/Physical Exams 733.2 45.12 2.76 774.4 43.31 2.79 Emergency Room Visits 499.7 42.49 1.77 484.5 42.68 1.72 Clinic Visit/Services 4,575.7 37.06 14.13 4,554.7 34.98 13.28 Radiology and Pathology 8,438.9 11.58 8.14 8,127.9 11.61 7.86 Outpatient Behavioral Health 148.0 50.38 0.62 126.5 52.12 0.55 Maternity 24.4 48.30 0.10 22.0 47.59 0.09 Chiropractor 15.2 10.61 0.01 12.9 10.59 0.01 Podiatrist 44.2 44.89 0.17 53.1 46.26 0.20 Vision - EyeCare & Eyewear - - - - - - Other Professional 8,351.1 5.48 3.82 8,335.2 5.45 3.78 DMHDD / DASA 609.7 100.58 5.11 604.3 99.69 5.02 PCCM Fee - - - - - -
Subtotal 25,421.0 $ 21.91 $ 46.42 25,035.9 $ 21.61 $ 45.10
Total Claims/Benefit Cost 33,105.0 $ 40.34 $ 111.28 32,270.4 $ 42.36 $ 113.92
ATTACHMENT 3 Milliman, Inc.Page 36 of 50

3/26/20132:36 PM
State of IllinoisDepartment of Healthcare and Family Services
VMC Base Data
Region: 4 Member Months: 214,913 Member Months: 236,843 Ratecell: 21 thru 44 Male
Fiscal Year 2010 Fiscal Year 2011Average Average
Admits Length Utilization Cost per Admits Length Utilization Cost perType of Service Per 1,000 of Stay Per 1,000 Service PMPM Per 1,000 of Stay Per 1,000 Service PMPM
Inpatient HospitalMedical/Surgical 65.4 4.3 280.4 $ 2,010.31 $ 46.97 59.0 4.5 264.9 $ 1,856.15 $ 40.97Well Newborn - - - - - - - - - - Other Newborn - - - - - - - - - - Maternity Non-Delivery 0.1 1.0 0.1 1,787.37 0.01 0.1 1.0 0.1 1,770.79 0.01 Psychiatric/Substance Abuse 28.5 3.4 98.3 705.84 5.78 23.4 3.7 86.5 648.09 4.67 Long Term Care 0.8 17.3 13.8 112.98 0.13 1.2 19.4 23.3 118.81 0.23 Other Inpatient 0.2 26.0 5.2 4,319.16 1.87 0.3 21.3 6.4 6,433.62 3.43
Subtotal 95.0 4.2 397.8 $ 1,652.27 $ 54.77 83.9 4.5 381.2 $ 1,552.66 $ 49.32
Outpatient HospitalGeneral Outpatient 305.5 398.54 10.15 310.3 450.26 11.64 Emergency Room 502.7 176.27 7.38 496.1 179.90 7.44 End-Stage Renal Disease 11.5 1,850.74 1.77 8.4 1,437.94 1.01
Subtotal 819.7 $ 282.60 $ 19.30 814.8 $ 295.83 $ 20.09
AncillariesPrescription Drugs 8,036.6 54.82 36.71 8,075.5 54.99 37.00 Transportation 377.5 30.59 0.96 362.7 33.22 1.00 DME/Prosthetics/Orthotics 298.3 84.98 2.11 295.5 82.45 2.03 Home Health/Hospice 38.7 104.06 0.34 40.8 83.92 0.29 Other Ancillary 10.3 27.69 0.02 7.2 29.14 0.02
Subtotal 8,761.3 $ 54.99 $ 40.15 8,781.7 $ 55.13 $ 40.34
PhysicianSurgery 235.2 198.92 3.90 239.2 203.01 4.05 Anesthesia 58.8 200.02 0.98 60.9 193.83 0.98 Hospital Inpatient Visits 504.7 41.83 1.76 477.3 41.60 1.65 Office Visits/Consults 1,745.8 49.39 7.19 1,694.2 49.13 6.94 Well Baby Exams/Physical Exams 61.5 92.38 0.47 75.7 92.59 0.58 Emergency Room Visits 463.6 44.71 1.73 450.7 45.15 1.70 Clinic Visit/Services 2,742.1 28.72 6.56 2,796.0 26.27 6.12 Radiology and Pathology 7,458.1 10.52 6.54 7,235.8 10.80 6.51 Outpatient Behavioral Health 78.3 46.90 0.31 85.6 46.56 0.33 Maternity 1.2 48.86 0.00 1.0 48.13 0.00 Chiropractor 35.5 8.67 0.03 38.5 8.66 0.03 Podiatrist 85.8 39.37 0.28 109.7 43.40 0.40 Vision - EyeCare & Eyewear - - - - - - Other Professional 7,989.1 6.20 4.13 8,177.0 7.48 5.09 DMHDD / DASA 273.1 70.39 1.60 256.8 72.28 1.55 PCCM Fee - - - - - -
Subtotal 21,732.8 $ 19.59 $ 35.47 21,698.2 $ 19.87 $ 35.94
Total Claims/Benefit Cost 31,711.6 $ 56.65 $ 149.70 31,675.9 $ 55.19 $ 145.69
ATTACHMENT 3 Milliman, Inc.Page 37 of 50

3/26/20132:36 PM
State of IllinoisDepartment of Healthcare and Family Services
VMC Base Data
Region: 4 Member Months: 1,204,724 Member Months: 1,263,084 Ratecell: 21 thru 44 Female
Fiscal Year 2010 Fiscal Year 2011Average Average
Admits Length Utilization Cost per Admits Length Utilization Cost perType of Service Per 1,000 of Stay Per 1,000 Service PMPM Per 1,000 of Stay Per 1,000 Service PMPM
Inpatient HospitalMedical/Surgical 60.6 3.6 216.5 $ 1,600.06 $ 28.87 56.9 3.6 202.2 $ 1,664.67 $ 28.05Well Newborn - - - - - - - - - - Other Newborn - - 0.1 587.35 0.00 - - 0.7 1,812.52 0.11 Maternity Non-Delivery 27.3 2.6 70.2 1,242.30 7.27 25.5 2.4 62.1 1,150.54 5.95 Psychiatric/Substance Abuse 20.2 4.0 80.4 644.78 4.32 18.6 4.0 75.2 632.29 3.96 Long Term Care 1.2 19.9 23.9 118.16 0.24 1.1 21.3 23.4 122.92 0.24 Other Inpatient - - 0.5 8,648.26 0.36 - - 0.8 6,740.18 0.45
Subtotal 109.4 3.6 391.7 $ 1,257.78 $ 41.06 102.1 3.6 364.3 $ 1,276.78 $ 38.76
Outpatient HospitalGeneral Outpatient 861.0 297.62 21.35 856.9 286.51 20.46 Emergency Room 857.4 172.02 12.29 876.3 172.34 12.58 End-Stage Renal Disease 10.9 1,106.09 1.00 9.1 1,260.82 0.96
Subtotal 1,729.3 $ 240.44 $ 34.65 1,742.3 $ 234.18 $ 34.00
AncillariesPrescription Drugs 11,103.1 47.36 43.82 11,075.9 49.14 45.36 Transportation 684.3 28.43 1.62 663.9 29.44 1.63 DME/Prosthetics/Orthotics 290.5 82.14 1.99 292.2 82.29 2.00 Home Health/Hospice 36.0 75.46 0.23 32.7 94.45 0.26 Other Ancillary 7.4 27.97 0.02 6.8 28.13 0.02
Subtotal 12,121.3 $ 47.19 $ 47.67 12,071.5 $ 48.97 $ 49.26
PhysicianSurgery 292.2 167.32 4.07 300.7 169.47 4.25 Anesthesia 198.8 249.23 4.13 191.9 264.30 4.23 Hospital Inpatient Visits 512.4 40.43 1.73 503.7 41.36 1.74 Office Visits/Consults 2,459.7 47.27 9.69 2,376.3 47.62 9.43 Well Baby Exams/Physical Exams 161.5 80.75 1.09 185.8 79.49 1.23 Emergency Room Visits 834.1 45.41 3.16 837.7 45.68 3.19 Clinic Visit/Services 5,595.5 43.47 20.27 5,591.6 42.18 19.65 Radiology and Pathology 17,299.4 13.04 18.79 17,267.1 13.21 19.01 Outpatient Behavioral Health 125.4 45.15 0.47 120.1 45.77 0.46 Maternity 25.6 49.38 0.11 30.0 49.27 0.12 Chiropractor 25.6 8.76 0.02 29.0 8.69 0.02 Podiatrist 103.6 39.77 0.34 101.9 39.32 0.33 Vision - EyeCare & Eyewear - - - - - - Other Professional 8,347.6 12.83 8.92 8,311.6 12.38 8.57 DMHDD / DASA 544.1 85.12 3.86 539.0 80.70 3.62 PCCM Fee - - - - - -
Subtotal 36,525.5 $ 25.18 $ 76.65 36,386.3 $ 25.02 $ 75.85
Total Claims/Benefit Cost 50,767.8 $ 47.28 $ 200.02 50,564.4 $ 46.96 $ 197.87
ATTACHMENT 3 Milliman, Inc.Page 38 of 50

3/26/20132:36 PM
State of IllinoisDepartment of Healthcare and Family Services
VMC Base Data
Region: 4 Member Months: 360,124 Member Months: 397,831 Ratecell: 45+ Years
Fiscal Year 2010 Fiscal Year 2011Average Average
Admits Length Utilization Cost per Admits Length Utilization Cost perType of Service Per 1,000 of Stay Per 1,000 Service PMPM Per 1,000 of Stay Per 1,000 Service PMPM
Inpatient HospitalMedical/Surgical 129.9 4.5 589.8 $ 1,641.46 $ 80.68 111.5 4.5 503.5 $ 1,722.03 $ 72.25Well Newborn - - - - - - - - - - Other Newborn - - - - - - - - - - Maternity Non-Delivery 0.1 2.0 0.2 1,949.42 0.03 0.2 2.5 0.5 2,625.32 0.11 Psychiatric/Substance Abuse 26.1 4.1 106.4 635.55 5.64 26.0 4.4 113.2 681.54 6.43 Long Term Care 5.4 19.4 104.6 131.14 1.14 5.3 19.2 101.7 133.56 1.13 Other Inpatient 0.1 23.0 2.3 4,244.23 0.81 0.1 27.0 2.7 7,681.34 1.73
Subtotal 161.6 5.0 803.2 $ 1,319.26 $ 88.30 143.2 5.0 721.7 $ 1,357.66 $ 81.65
Outpatient HospitalGeneral Outpatient 828.3 404.30 27.91 849.9 394.20 27.92 Emergency Room 518.3 203.10 8.77 512.9 207.04 8.85 End-Stage Renal Disease 47.4 1,133.19 4.48 34.0 1,129.29 3.20
Subtotal 1,394.1 $ 354.25 $ 41.15 1,396.8 $ 343.37 $ 39.97
AncillariesPrescription Drugs 22,829.0 50.06 95.23 22,819.2 49.10 93.36 Transportation 1,872.6 14.94 2.33 1,897.3 14.53 2.30 DME/Prosthetics/Orthotics 822.0 69.62 4.77 808.5 67.25 4.53 Home Health/Hospice 154.5 93.69 1.21 129.9 86.89 0.94 Other Ancillary 19.7 28.03 0.05 14.4 27.60 0.03
Subtotal 25,697.8 $ 48.37 $ 103.58 25,669.3 $ 47.29 $ 101.16
PhysicianSurgery 518.1 213.95 9.24 516.9 207.16 8.92 Anesthesia 128.6 182.64 1.96 128.3 182.95 1.96 Hospital Inpatient Visits 1,007.4 40.70 3.42 925.7 41.07 3.17 Office Visits/Consults 3,496.9 48.89 14.25 3,357.2 48.87 13.67 Well Baby Exams/Physical Exams 99.4 86.52 0.72 127.6 86.94 0.92 Emergency Room Visits 497.4 49.19 2.04 475.5 49.51 1.96 Clinic Visit/Services 3,703.0 49.77 15.36 3,580.2 47.17 14.07 Radiology and Pathology 15,447.2 11.56 14.89 15,256.5 11.83 15.05 Outpatient Behavioral Health 148.3 40.61 0.50 149.5 40.16 0.50 Maternity 0.8 47.65 0.00 0.4 45.25 0.00 Chiropractor 50.5 8.68 0.04 53.8 8.68 0.04 Podiatrist 223.1 35.42 0.66 246.9 37.06 0.76 Vision - EyeCare & Eyewear - - - - - - Other Professional 9,253.4 16.17 12.47 9,318.6 16.92 13.14 DMHDD / DASA 638.6 67.79 3.61 650.7 67.34 3.65 PCCM Fee - - - - - -
Subtotal 35,212.5 $ 26.97 $ 79.14 34,787.8 $ 26.84 $ 77.82
Total Claims/Benefit Cost 63,107.6 $ 59.36 $ 312.18 62,575.6 $ 57.65 $ 300.60
ATTACHMENT 3 Milliman, Inc.Page 39 of 50

3/26/20132:36 PM
State of IllinoisDepartment of Healthcare and Family Services
VMC Base Data
Region: 4 Member Months: 7,717,927 Member Months: 8,024,691 Composite
Fiscal Year 2010 Fiscal Year 2011Average Average
Admits Length Utilization Cost per Admits Length Utilization Cost perType of Service Per 1,000 of Stay Per 1,000 Service PMPM Per 1,000 of Stay Per 1,000 Service PMPM
Inpatient HospitalMedical/Surgical 37.9 4.0 150.5 $ 1,876.14 $ 23.53 35.4 3.9 139.3 $ 1,901.24 $ 22.06Well Newborn 1.8 2.3 4.2 2,629.02 0.92 1.5 2.5 3.7 2,815.87 0.88 Other Newborn 21.7 7.9 171.2 1,775.24 25.32 22.3 7.6 169.6 1,735.15 24.53 Maternity Non-Delivery 6.4 2.6 16.4 1,207.72 1.65 5.8 2.5 14.3 1,159.16 1.38 Psychiatric/Substance Abuse 10.1 7.4 74.3 723.62 4.48 9.9 7.7 76.6 719.08 4.59 Long Term Care 0.4 19.8 7.9 122.76 0.08 0.4 20.0 7.8 128.80 0.08 Other Inpatient 0.0 38.5 1.3 8,666.89 0.94 0.0 73.8 1.1 10,424.22 0.97
Subtotal 78.3 5.4 425.7 $ 1,604.77 $ 56.93 75.5 5.5 412.5 $ 1,585.40 $ 54.50
Outpatient HospitalGeneral Outpatient 288.3 333.41 8.01 288.7 330.10 7.94 Emergency Room 574.0 136.96 6.55 569.3 138.07 6.55 End-Stage Renal Disease 3.9 1,118.25 0.36 3.1 1,191.94 0.30
Subtotal 866.2 $ 206.73 $ 14.92 861.1 $ 206.19 $ 14.80
AncillariesPrescription Drugs 6,250.9 46.03 23.98 6,235.7 47.64 24.76 Transportation 659.7 18.23 1.00 514.9 21.73 0.93 DME/Prosthetics/Orthotics 212.0 100.87 1.78 227.0 103.25 1.95 Home Health/Hospice 24.7 173.67 0.36 23.1 256.29 0.49 Other Ancillary 21.2 27.81 0.05 21.5 27.87 0.05
Subtotal 7,168.5 $ 45.48 $ 27.17 7,022.2 $ 48.17 $ 28.19
PhysicianSurgery 161.3 155.93 2.10 171.6 150.67 2.15 Anesthesia 69.4 234.08 1.35 68.5 240.38 1.37 Hospital Inpatient Visits 485.0 71.74 2.90 471.5 71.69 2.82 Office Visits/Consults 1,954.6 46.70 7.61 1,864.0 47.72 7.41 Well Baby Exams/Physical Exams 1,633.0 35.44 4.82 1,678.2 34.82 4.87 Emergency Room Visits 540.5 40.17 1.81 533.7 40.29 1.79 Clinic Visit/Services 4,428.8 34.92 12.89 4,461.8 33.82 12.58 Radiology and Pathology 7,365.1 10.77 6.61 7,359.7 10.83 6.64 Outpatient Behavioral Health 81.9 48.07 0.33 76.4 48.49 0.31 Maternity 11.4 49.46 0.05 11.0 49.21 0.05 Chiropractor 11.9 9.51 0.01 12.8 9.41 0.01 Podiatrist 48.1 39.18 0.16 52.1 40.06 0.17 Vision - EyeCare & Eyewear - - - - - - Other Professional 8,694.3 8.97 6.50 8,657.2 9.23 6.66 DMHDD / DASA 334.3 93.76 2.61 334.4 91.39 2.55 PCCM Fee - - - - - -
Subtotal 25,819.4 $ 23.12 $ 49.74 25,752.8 $ 23.01 $ 49.38
Total Claims/Benefit Cost 34,415.2 $ 52.89 $ 151.69 34,137.9 $ 51.83 $ 147.45
ATTACHMENT 3 Milliman, Inc.Page 40 of 50

3/26/20132:36 PM
State of IllinoisDepartment of Healthcare and Family Services
VMC Base Data
Region: 5 Member Months: 70,894 Member Months: 67,479 Ratecell: 0 thru 90 days
Fiscal Year 2010 Fiscal Year 2011Average Average
Admits Length Utilization Cost per Admits Length Utilization Cost perType of Service Per 1,000 of Stay Per 1,000 Service PMPM Per 1,000 of Stay Per 1,000 Service PMPM
Inpatient HospitalMedical/Surgical 161.8 6.5 1,058.3 $ 1,820.50 $ 160.55 144.9 5.9 860.5 $ 1,910.31 $ 136.99Well Newborn 4.4 2.4 10.5 2,260.28 1.98 3.7 2.2 8.2 2,891.44 1.98 Other Newborn 1,091.1 5.9 6,455.8 1,394.87 750.42 1,158.2 6.1 7,078.3 1,482.03 874.19 Maternity Non-Delivery - - - - - - - - - - Psychiatric/Substance Abuse 0.5 8.4 4.2 1,053.88 0.37 0.2 14.0 2.8 1,593.18 0.37 Long Term Care - - - - - - - - - - Other Inpatient - - - - - - - - - -
Subtotal 1,257.8 6.0 7,528.8 $ 1,455.72 $ 913.32 1,307.1 6.1 7,949.9 $ 1,529.86 $ 1,013.52
Outpatient HospitalGeneral Outpatient 326.0 272.35 7.40 326.0 263.55 7.16 Emergency Room 992.6 108.17 8.95 938.6 108.58 8.49 End-Stage Renal Disease 0.8 351.81 0.02 - - -
Subtotal 1,319.4 $ 148.88 $ 16.37 1,264.6 $ 148.53 $ 15.65
AncillariesPrescription Drugs 3,189.8 35.58 9.46 3,375.3 33.25 9.35 Transportation 356.1 79.02 2.34 353.4 72.60 2.14 DME/Prosthetics/Orthotics 404.4 82.74 2.79 426.3 82.95 2.95 Home Health/Hospice 99.5 91.44 0.76 113.1 81.28 0.77 Other Ancillary 94.3 49.11 0.39 99.2 49.18 0.41
Subtotal 4,144.2 $ 45.57 $ 15.74 4,367.2 $ 42.89 $ 15.61
PhysicianSurgery 808.4 127.02 8.56 850.9 137.01 9.72 Anesthesia 73.5 259.15 1.59 81.3 275.10 1.86 Hospital Inpatient Visits 9,651.4 99.89 80.34 9,696.7 104.69 84.60 Office Visits/Consults 3,885.2 50.73 16.43 3,911.1 50.03 16.31 Well Baby Exams/Physical Exams 19,102.3 32.82 52.24 20,201.3 32.38 54.51 Emergency Room Visits 970.1 40.24 3.25 935.0 39.98 3.11 Clinic Visit/Services 2,743.5 104.66 23.93 2,998.6 100.39 25.08 Radiology and Pathology 20,287.1 5.58 9.44 24,350.2 5.38 10.91 Outpatient Behavioral Health 0.2 41.48 0.00 1.1 53.14 0.00 Maternity 12.0 50.07 0.05 11.0 49.31 0.05 Chiropractor 12.9 10.64 0.01 29.3 10.69 0.03 Podiatrist 7.3 38.21 0.02 7.3 47.29 0.03 Vision - EyeCare & Eyewear - - - - - - Other Professional 3,988.4 18.88 6.27 5,136.7 15.94 6.82 DMHDD / DASA - - - 0.2 84.51 0.00 PCCM Fee - - - - - -
Subtotal 61,542.2 $ 39.41 $ 202.13 68,210.7 $ 37.48 $ 213.03
Total Claims/Benefit Cost 74,534.6 $ 184.76 $ 1,147.55 81,792.4 $ 184.54 $ 1,257.82
ATTACHMENT 3 Milliman, Inc.Page 41 of 50

3/26/20132:36 PM
State of IllinoisDepartment of Healthcare and Family Services
VMC Base Data
Region: 5 Member Months: 348,933 Member Months: 340,180 Ratecell: 91 days thru 1 Year
Fiscal Year 2010 Fiscal Year 2011Average Average
Admits Length Utilization Cost per Admits Length Utilization Cost perType of Service Per 1,000 of Stay Per 1,000 Service PMPM Per 1,000 of Stay Per 1,000 Service PMPM
Inpatient HospitalMedical/Surgical 57.9 3.8 220.8 $ 1,674.88 $ 30.82 57.4 3.6 206.8 $ 1,699.51 $ 29.29Well Newborn - - - - - - - - - - Other Newborn 0.4 17.0 6.8 1,591.93 0.90 1.3 28.6 37.2 2,224.00 6.89 Maternity Non-Delivery - - - - - - - - - - Psychiatric/Substance Abuse - - - - - - - - - - Long Term Care - - - - - - - - - - Other Inpatient - - - - 0.26 - - - - -
Subtotal 58.4 3.9 227.6 $ 1,686.37 $ 31.98 58.7 4.2 244.0 $ 1,779.47 $ 36.18
Outpatient HospitalGeneral Outpatient 142.0 319.07 3.78 148.4 345.20 4.27 Emergency Room 1,172.2 89.84 8.78 1,098.4 93.23 8.53 End-Stage Renal Disease 0.2 402.18 0.01 0.5 1,544.20 0.06
Subtotal 1,314.4 $ 114.65 $ 12.56 1,247.3 $ 123.79 $ 12.87
AncillariesPrescription Drugs 5,866.1 35.57 17.39 5,871.4 33.33 16.31 Transportation 191.7 48.46 0.77 180.5 48.61 0.73 DME/Prosthetics/Orthotics 389.3 85.75 2.78 422.4 87.07 3.06 Home Health/Hospice 57.7 191.71 0.92 55.0 305.15 1.40 Other Ancillary 47.2 32.64 0.13 41.3 29.80 0.10
Subtotal 6,552.0 $ 40.28 $ 21.99 6,570.6 $ 39.46 $ 21.60
PhysicianSurgery 150.1 142.58 1.78 207.6 117.62 2.03 Anesthesia 48.7 177.29 0.72 49.2 170.80 0.70 Hospital Inpatient Visits 393.6 76.63 2.51 477.8 84.91 3.38 Office Visits/Consults 4,092.4 46.76 15.95 4,010.3 47.60 15.91 Well Baby Exams/Physical Exams 9,485.8 24.36 19.26 9,734.2 24.47 19.85 Emergency Room Visits 1,164.3 36.46 3.54 1,092.4 36.52 3.32 Clinic Visit/Services 3,484.4 42.27 12.27 3,379.8 45.43 12.80 Radiology and Pathology 4,395.6 9.12 3.34 4,706.0 8.57 3.36 Outpatient Behavioral Health 0.1 35.26 0.00 0.2 55.86 0.00 Maternity 12.3 49.91 0.05 10.8 49.97 0.04 Chiropractor 24.5 10.68 0.02 26.5 10.67 0.02 Podiatrist 5.6 33.37 0.02 6.2 40.61 0.02 Vision - EyeCare & Eyewear - - - - - - Other Professional 10,810.5 11.09 9.99 10,939.7 10.91 9.95 DMHDD / DASA - - - - - - PCCM Fee - - - - - -
Subtotal 34,067.8 $ 24.46 $ 69.45 34,640.5 $ 24.73 $ 71.40
Total Claims/Benefit Cost 42,161.8 $ 38.70 $ 135.99 42,702.4 $ 39.92 $ 142.05
ATTACHMENT 3 Milliman, Inc.Page 42 of 50

3/26/20132:36 PM
State of IllinoisDepartment of Healthcare and Family Services
VMC Base Data
Region: 5 Member Months: 712,321 Member Months: 741,065 Ratecell: 2 thru 5 Years
Fiscal Year 2010 Fiscal Year 2011Average Average
Admits Length Utilization Cost per Admits Length Utilization Cost perType of Service Per 1,000 of Stay Per 1,000 Service PMPM Per 1,000 of Stay Per 1,000 Service PMPM
Inpatient HospitalMedical/Surgical 21.1 3.5 74.0 $ 1,810.68 $ 11.17 19.3 3.2 62.6 $ 1,572.26 $ 8.20Well Newborn - - - - - - - - - - Other Newborn - - - - - - - - - 0.00 Maternity Non-Delivery - - - - - - - - - - Psychiatric/Substance Abuse 0.4 8.5 3.4 821.90 0.23 0.2 13.0 2.6 791.84 0.17 Long Term Care - - - - - - - - - - Other Inpatient 0.1 20.0 2.0 7,507.07 1.25 - - 0.6 7,847.70 0.39
Subtotal 21.6 3.7 79.3 $ 1,914.23 $ 12.65 19.5 3.4 65.9 $ 1,596.51 $ 8.77
Outpatient HospitalGeneral Outpatient 80.3 393.26 2.63 81.4 412.39 2.80 Emergency Room 615.0 93.95 4.82 583.1 96.57 4.69 End-Stage Renal Disease 0.2 2,033.62 0.03 0.2 1,404.15 0.02
Subtotal 695.6 $ 129.05 $ 7.48 664.6 $ 135.66 $ 7.51
AncillariesPrescription Drugs 3,804.3 39.67 12.58 3,815.0 37.91 12.05 Transportation 144.0 33.03 0.40 165.4 31.12 0.43 DME/Prosthetics/Orthotics 178.0 108.68 1.61 194.3 115.13 1.86 Home Health/Hospice 11.7 765.47 0.75 13.7 868.25 0.99 Other Ancillary 47.9 29.04 0.12 42.7 27.67 0.10
Subtotal 4,185.9 $ 44.29 $ 15.45 4,231.1 $ 43.77 $ 15.43
PhysicianSurgery 127.3 119.72 1.27 133.5 108.91 1.21 Anesthesia 38.7 159.46 0.51 36.6 156.21 0.48 Hospital Inpatient Visits 116.7 41.60 0.40 90.3 43.00 0.32 Office Visits/Consults 2,649.5 46.14 10.19 2,560.8 47.00 10.03 Well Baby Exams/Physical Exams 2,478.3 31.40 6.49 2,603.3 30.69 6.66 Emergency Room Visits 598.9 35.66 1.78 567.8 35.49 1.68 Clinic Visit/Services 2,735.4 26.98 6.15 2,797.5 27.48 6.41 Radiology and Pathology 3,266.5 8.21 2.23 3,287.9 8.06 2.21 Outpatient Behavioral Health 5.3 56.01 0.02 5.3 51.96 0.02 Maternity 9.2 50.08 0.04 7.5 49.87 0.03 Chiropractor 31.7 10.63 0.03 27.2 10.58 0.02 Podiatrist 9.5 33.88 0.03 10.2 33.36 0.03 Vision - EyeCare & Eyewear - - - - - - Other Professional 10,845.0 10.00 9.04 10,917.3 10.30 9.37 DMHDD / DASA 16.9 77.29 0.11 12.5 82.74 0.09 PCCM Fee - - - - - -
Subtotal 22,928.9 $ 20.04 $ 38.29 23,057.6 $ 20.07 $ 38.56
Total Claims/Benefit Cost 27,889.7 $ 31.78 $ 73.87 28,019.2 $ 30.10 $ 70.27
ATTACHMENT 3 Milliman, Inc.Page 43 of 50

3/26/20132:36 PM
State of IllinoisDepartment of Healthcare and Family Services
VMC Base Data
Region: 5 Member Months: 1,220,102 Member Months: 1,340,125 Ratecell: 6 thru 13 Years
Fiscal Year 2010 Fiscal Year 2011Average Average
Admits Length Utilization Cost per Admits Length Utilization Cost perType of Service Per 1,000 of Stay Per 1,000 Service PMPM Per 1,000 of Stay Per 1,000 Service PMPM
Inpatient HospitalMedical/Surgical 13.4 3.2 43.0 $ 1,875.76 $ 6.72 12.2 3.5 42.5 $ 1,627.93 $ 5.77Well Newborn - - - - - - - - - - Other Newborn - - - - - - - - - - Maternity Non-Delivery - - - - - - - - - - Psychiatric/Substance Abuse 5.2 11.0 57.1 707.53 3.37 5.0 11.2 56.1 717.60 3.35 Long Term Care - - - - - - - - - - Other Inpatient - - - - - - - - - -
Subtotal 18.6 5.4 100.1 $ 1,209.37 $ 10.09 17.2 5.7 98.6 $ 1,109.98 $ 9.12
Outpatient HospitalGeneral Outpatient 76.7 396.58 2.53 77.2 436.72 2.81 Emergency Room 392.8 102.09 3.34 362.7 105.55 3.19 End-Stage Renal Disease 0.3 2,161.19 0.05 0.4 1,227.33 0.04
Subtotal 469.8 $ 151.48 $ 5.93 440.2 $ 164.67 $ 6.04
AncillariesPrescription Drugs 3,539.7 62.99 18.58 3,533.0 66.17 19.48 Transportation 139.9 29.68 0.35 158.4 25.35 0.33 DME/Prosthetics/Orthotics 140.5 120.19 1.41 159.0 117.70 1.56 Home Health/Hospice 7.8 485.75 0.32 8.5 619.01 0.44 Other Ancillary 17.3 25.77 0.04 14.5 26.31 0.03
Subtotal 3,845.1 $ 64.56 $ 20.69 3,873.4 $ 67.68 $ 21.85
PhysicianSurgery 105.7 125.31 1.10 107.8 122.96 1.10 Anesthesia 25.9 163.87 0.35 27.0 165.38 0.37 Hospital Inpatient Visits 105.9 38.91 0.34 106.4 38.66 0.34 Office Visits/Consults 1,899.8 46.84 7.42 1,821.6 47.87 7.27 Well Baby Exams/Physical Exams 1,160.2 36.82 3.56 1,158.8 37.65 3.64 Emergency Room Visits 385.1 36.44 1.17 358.9 36.56 1.09 Clinic Visit/Services 2,573.5 22.16 4.75 2,601.4 22.45 4.87 Radiology and Pathology 2,571.9 8.80 1.89 2,685.2 8.75 1.96 Outpatient Behavioral Health 67.3 45.35 0.25 61.4 46.97 0.24 Maternity 7.3 49.98 0.03 4.8 49.62 0.02 Chiropractor 41.2 10.11 0.03 40.9 10.41 0.04 Podiatrist 25.0 39.34 0.08 30.6 40.06 0.10 Vision - EyeCare & Eyewear - - - - - - Other Professional 9,598.2 3.50 2.80 9,746.8 3.48 2.83 DMHDD / DASA 261.6 83.98 1.83 229.6 84.11 1.61 PCCM Fee - - - - - -
Subtotal 18,828.7 $ 16.33 $ 25.62 18,981.3 $ 16.11 $ 25.47
Total Claims/Benefit Cost 23,243.7 $ 32.17 $ 62.32 23,393.5 $ 32.05 $ 62.48
ATTACHMENT 3 Milliman, Inc.Page 44 of 50

3/26/20132:36 PM
State of IllinoisDepartment of Healthcare and Family Services
VMC Base Data
Region: 5 Member Months: 299,748 Member Months: 335,354 Ratecell: 14 thru 20 Male
Fiscal Year 2010 Fiscal Year 2011Average Average
Admits Length Utilization Cost per Admits Length Utilization Cost perType of Service Per 1,000 of Stay Per 1,000 Service PMPM Per 1,000 of Stay Per 1,000 Service PMPM
Inpatient HospitalMedical/Surgical 18.7 3.8 70.3 $ 1,952.90 $ 11.44 21.0 3.8 80.2 $ 1,832.16 $ 12.24Well Newborn - - - - - - - - - - Other Newborn - - - - - - - - - - Maternity Non-Delivery - - - - - - - - - - Psychiatric/Substance Abuse 23.1 9.2 211.5 635.05 11.19 19.7 9.2 181.2 646.47 9.76 Long Term Care 0.4 23.5 9.4 125.81 0.10 0.5 18.4 9.2 108.57 0.08 Other Inpatient - - - - - - - - - -
Subtotal 42.1 6.9 291.2 $ 936.76 $ 22.73 41.2 6.6 270.6 $ 979.59 $ 22.09
Outpatient HospitalGeneral Outpatient 125.9 402.43 4.22 143.9 430.34 5.16 Emergency Room 437.8 124.52 4.54 408.8 129.40 4.41 End-Stage Renal Disease 0.5 3,185.66 0.13 2.5 774.00 0.16
Subtotal 564.2 $ 189.25 $ 8.90 555.2 $ 210.30 $ 9.73
AncillariesPrescription Drugs 3,691.5 79.62 24.49 3,780.4 90.51 28.51 Transportation 262.7 43.43 0.95 281.4 40.72 0.95 DME/Prosthetics/Orthotics 113.8 137.39 1.30 149.9 104.62 1.31 Home Health/Hospice 18.8 117.52 0.18 14.2 224.35 0.27 Other Ancillary 7.4 27.06 0.02 5.7 25.80 0.01
Subtotal 4,094.1 $ 78.98 $ 26.95 4,231.6 $ 88.06 $ 31.05
PhysicianSurgery 148.1 144.46 1.78 155.6 151.22 1.96 Anesthesia 30.9 191.37 0.49 35.4 195.08 0.58 Hospital Inpatient Visits 271.6 37.14 0.84 276.0 38.58 0.89 Office Visits/Consults 1,397.1 47.38 5.52 1,420.9 47.71 5.65 Well Baby Exams/Physical Exams 857.9 42.79 3.06 876.8 43.54 3.18 Emergency Room Visits 422.7 38.91 1.37 396.9 39.40 1.30 Clinic Visit/Services 2,645.2 19.94 4.40 2,666.4 20.00 4.44 Radiology and Pathology 3,156.8 10.98 2.89 3,310.0 11.04 3.05 Outpatient Behavioral Health 157.4 46.29 0.61 132.6 49.60 0.55 Maternity 6.5 50.20 0.03 4.8 50.32 0.02 Chiropractor 52.2 10.39 0.05 42.9 10.15 0.04 Podiatrist 52.8 42.43 0.19 54.9 47.89 0.22 Vision - EyeCare & Eyewear - - - - - - Other Professional 8,975.1 3.09 2.31 9,296.9 3.24 2.51 DMHDD / DASA 1,690.0 135.81 19.13 1,431.9 129.61 15.47 PCCM Fee - - - - - -
Subtotal 19,864.4 $ 25.76 $ 42.65 20,102.0 $ 23.79 $ 39.85
Total Claims/Benefit Cost 24,813.9 $ 48.95 $ 101.22 25,159.4 $ 48.99 $ 102.72
ATTACHMENT 3 Milliman, Inc.Page 45 of 50
3/26/20132:36 PM
State of IllinoisDepartment of Healthcare and Family Services
VMC Base Data
Region: 5 Member Months: 324,836 Member Months: 357,579 Ratecell: 14 thru 20 Female
Fiscal Year 2010 Fiscal Year 2011Average Average
Admits Length Utilization Cost per Admits Length Utilization Cost perType of Service Per 1,000 of Stay Per 1,000 Service PMPM Per 1,000 of Stay Per 1,000 Service PMPM
Inpatient HospitalMedical/Surgical 20.5 3.2 66.3 $ 1,747.90 $ 9.66 18.4 3.2 58.9 $ 1,791.28 $ 8.79Well Newborn - - - - - - - - - - Other Newborn - - - - - - - 0.1 1,059.67 0.01 Maternity Non-Delivery 9.5 2.5 23.6 805.37 1.58 7.4 3.0 22.4 905.52 1.69 Psychiatric/Substance Abuse 25.5 8.0 203.5 594.40 10.08 25.1 8.2 206.9 604.43 10.42 Long Term Care 0.2 22.5 4.5 103.18 0.04 - - 0.4 169.20 0.01 Other Inpatient - - 1.1 8,097.18 0.74 - - 0.8 10,599.67 0.71
Subtotal 55.8 5.4 299.0 $ 887.04 $ 22.10 51.1 5.7 289.4 $ 896.68 $ 21.62
Outpatient HospitalGeneral Outpatient 382.2 254.01 8.09 345.2 256.92 7.39 Emergency Room 654.8 126.73 6.92 603.6 131.75 6.63 End-Stage Renal Disease 1.2 601.66 0.06 0.9 344.85 0.03
Subtotal 1,038.2 $ 174.13 $ 15.07 949.7 $ 177.45 $ 14.04
AncillariesPrescription Drugs 5,136.1 51.36 21.98 5,082.8 56.15 23.78 Transportation 356.3 38.57 1.15 304.9 43.67 1.11 DME/Prosthetics/Orthotics 95.4 108.30 0.86 132.0 96.89 1.07 Home Health/Hospice 10.0 71.35 0.06 14.7 94.57 0.12 Other Ancillary 5.2 25.21 0.01 4.4 26.85 0.01
Subtotal 5,603.1 $ 51.53 $ 24.06 5,538.8 $ 56.51 $ 26.08
PhysicianSurgery 138.9 141.84 1.64 131.3 132.86 1.45 Anesthesia 94.2 270.32 2.12 81.0 282.35 1.91 Hospital Inpatient Visits 343.3 36.83 1.05 326.4 36.78 1.00 Office Visits/Consults 1,945.2 47.70 7.73 1,942.5 48.23 7.81 Well Baby Exams/Physical Exams 891.8 43.06 3.20 911.4 43.37 3.29 Emergency Room Visits 659.8 42.21 2.32 611.7 42.29 2.16 Clinic Visit/Services 3,278.0 32.56 8.89 3,247.1 31.18 8.44 Radiology and Pathology 7,926.4 11.81 7.80 7,711.0 11.56 7.43 Outpatient Behavioral Health 125.8 53.64 0.56 129.2 58.79 0.63 Maternity 41.0 47.90 0.16 34.7 47.93 0.14 Chiropractor 55.9 10.39 0.05 54.2 10.39 0.05 Podiatrist 41.8 45.28 0.16 53.7 47.00 0.21 Vision - EyeCare & Eyewear - - - - - - Other Professional 9,643.6 6.64 5.34 9,745.2 5.89 4.78 DMHDD / DASA 910.0 108.40 8.22 800.8 111.38 7.43 PCCM Fee - - - - - -
Subtotal 26,095.6 $ 22.65 $ 49.26 25,780.3 $ 21.75 $ 46.73
Total Claims/Benefit Cost 33,035.9 $ 40.13 $ 110.49 32,558.2 $ 39.98 $ 108.48
ATTACHMENT 3 Milliman, Inc.Page 46 of 50

3/26/20132:36 PM
State of IllinoisDepartment of Healthcare and Family Services
VMC Base Data
Region: 5 Member Months: 147,585 Member Months: 164,128 Ratecell: 21 thru 44 Male
Fiscal Year 2010 Fiscal Year 2011Average Average
Admits Length Utilization Cost per Admits Length Utilization Cost perType of Service Per 1,000 of Stay Per 1,000 Service PMPM Per 1,000 of Stay Per 1,000 Service PMPM
Inpatient HospitalMedical/Surgical 64.9 3.7 237.3 $ 2,205.71 $ 43.62 64.8 4.0 259.3 $ 1,993.24 $ 43.07Well Newborn - - - - - - - - - - Other Newborn - - - - - - - - - - Maternity Non-Delivery 0.1 1.0 0.1 702.42 0.01 - - - - - Psychiatric/Substance Abuse 23.0 3.5 80.6 815.11 5.47 20.1 3.6 71.9 524.30 3.14 Long Term Care 1.5 19.4 29.1 97.73 0.24 1.1 19.5 21.5 103.13 0.18 Other Inpatient 0.1 12.0 1.2 7,264.82 0.73 0.2 15.0 3.0 4,523.80 1.13
Subtotal 89.5 3.9 348.2 $ 1,725.29 $ 50.06 86.2 4.1 355.7 $ 1,603.41 $ 47.53
Outpatient HospitalGeneral Outpatient 333.9 417.66 11.62 338.1 431.92 12.17 Emergency Room 681.3 148.15 8.41 699.8 152.66 8.90 End-Stage Renal Disease 10.7 879.29 0.78 9.8 1,414.44 1.16
Subtotal 1,025.9 $ 243.49 $ 20.82 1,047.7 $ 254.58 $ 22.23
AncillariesPrescription Drugs 8,315.3 53.08 36.78 8,682.5 50.52 36.55 Transportation 363.9 35.06 1.06 296.7 48.36 1.20 DME/Prosthetics/Orthotics 289.8 82.79 2.00 311.3 80.65 2.09 Home Health/Hospice 47.8 146.18 0.58 45.2 98.17 0.37 Other Ancillary 6.2 25.79 0.01 4.8 28.97 0.01
Subtotal 9,022.9 $ 53.78 $ 40.44 9,340.4 $ 51.67 $ 40.22
PhysicianSurgery 294.7 181.28 4.45 308.3 186.67 4.80 Anesthesia 68.2 184.06 1.05 79.2 181.61 1.20 Hospital Inpatient Visits 539.7 43.33 1.95 580.2 42.32 2.05 Office Visits/Consults 1,931.2 50.41 8.11 1,944.2 50.57 8.19 Well Baby Exams/Physical Exams 81.6 92.06 0.63 91.8 91.40 0.70 Emergency Room Visits 657.8 44.10 2.42 678.9 44.45 2.51 Clinic Visit/Services 2,432.0 19.12 3.87 2,258.1 17.78 3.35 Radiology and Pathology 6,626.1 11.65 6.43 6,910.6 11.66 6.72 Outpatient Behavioral Health 82.6 45.90 0.32 78.0 48.72 0.32 Maternity 1.5 51.50 0.01 1.7 49.46 0.01 Chiropractor 111.9 8.67 0.08 131.5 8.68 0.10 Podiatrist 73.5 42.34 0.26 90.9 44.65 0.34 Vision - EyeCare & Eyewear - - - - - - Other Professional 8,089.9 6.92 4.67 8,759.1 6.70 4.89 DMHDD / DASA 394.8 72.41 2.38 504.7 68.51 2.88 PCCM Fee - - - - - -
Subtotal 21,385.6 $ 20.55 $ 36.62 22,417.2 $ 20.36 $ 38.04
Total Claims/Benefit Cost 31,782.6 $ 55.86 $ 147.94 33,161.0 $ 53.56 $ 148.02
ATTACHMENT 3 Milliman, Inc.Page 47 of 50

3/26/20132:36 PM
State of IllinoisDepartment of Healthcare and Family Services
VMC Base Data
Region: 5 Member Months: 556,531 Member Months: 601,222 Ratecell: 21 thru 44 Female
Fiscal Year 2010 Fiscal Year 2011Average Average
Admits Length Utilization Cost per Admits Length Utilization Cost perType of Service Per 1,000 of Stay Per 1,000 Service PMPM Per 1,000 of Stay Per 1,000 Service PMPM
Inpatient HospitalMedical/Surgical 67.6 3.4 231.4 $ 1,758.70 $ 33.91 62.1 3.3 207.1 $ 1,922.96 $ 33.19Well Newborn - - - - - - - - - - Other Newborn - - - - 0.00 - - - - - Maternity Non-Delivery 20.8 2.5 52.4 855.18 3.73 18.6 2.5 46.0 924.67 3.54 Psychiatric/Substance Abuse 18.5 4.3 78.9 537.88 3.54 17.1 4.6 78.9 522.25 3.43 Long Term Care 0.9 21.1 19.0 111.54 0.18 1.0 18.2 18.2 119.43 0.18 Other Inpatient 0.1 22.0 2.2 5,596.76 1.03 0.1 11.0 1.1 6,163.22 0.56
Subtotal 107.9 3.6 383.9 $ 1,325.00 $ 42.39 98.9 3.6 351.3 $ 1,397.49 $ 40.91
Outpatient HospitalGeneral Outpatient 921.8 276.08 21.21 915.3 276.99 21.13 Emergency Room 1,119.3 148.97 13.89 1,074.9 156.15 13.99 End-Stage Renal Disease 6.3 1,490.84 0.78 4.9 1,861.96 0.76
Subtotal 2,047.4 $ 210.32 $ 35.88 1,995.2 $ 215.77 $ 35.88
AncillariesPrescription Drugs 12,147.2 47.69 48.28 12,506.6 49.21 51.29 Transportation 425.1 44.30 1.57 518.7 38.96 1.68 DME/Prosthetics/Orthotics 240.1 88.95 1.78 254.8 88.34 1.88 Home Health/Hospice 32.5 72.33 0.20 35.7 76.55 0.23 Other Ancillary 6.0 27.33 0.01 5.9 28.24 0.01
Subtotal 12,850.9 $ 48.40 $ 51.84 13,321.7 $ 49.63 $ 55.09
PhysicianSurgery 398.1 172.49 5.72 406.7 162.58 5.51 Anesthesia 230.7 227.87 4.38 226.7 236.06 4.46 Hospital Inpatient Visits 600.4 41.15 2.06 584.9 41.45 2.02 Office Visits/Consults 3,049.0 49.45 12.56 3,123.5 49.40 12.86 Well Baby Exams/Physical Exams 312.9 63.55 1.66 361.1 62.78 1.89 Emergency Room Visits 1,139.3 45.31 4.30 1,103.5 45.97 4.23 Clinic Visit/Services 3,844.9 33.36 10.69 3,663.5 34.11 10.41 Radiology and Pathology 16,113.9 13.52 18.16 16,814.9 13.42 18.80 Outpatient Behavioral Health 157.7 43.06 0.57 144.2 43.40 0.52 Maternity 56.2 45.92 0.22 55.3 46.09 0.21 Chiropractor 150.8 8.80 0.11 151.0 8.79 0.11 Podiatrist 94.1 41.10 0.32 102.0 42.91 0.36 Vision - EyeCare & Eyewear - - - - - - Other Professional 9,743.1 13.58 11.03 10,114.7 12.82 10.80 DMHDD / DASA 609.3 76.46 3.88 665.1 76.37 4.23 PCCM Fee - - - - - -
Subtotal 36,500.3 $ 24.87 $ 75.66 37,517.1 $ 24.44 $ 76.42
Total Claims/Benefit Cost 51,782.5 $ 47.68 $ 205.77 53,185.3 $ 47.00 $ 208.30
ATTACHMENT 3 Milliman, Inc.Page 48 of 50

3/26/20132:36 PM
State of IllinoisDepartment of Healthcare and Family Services
VMC Base Data
Region: 5 Member Months: 178,398 Member Months: 213,484 Ratecell: 45+ Years
Fiscal Year 2010 Fiscal Year 2011Average Average
Admits Length Utilization Cost per Admits Length Utilization Cost perType of Service Per 1,000 of Stay Per 1,000 Service PMPM Per 1,000 of Stay Per 1,000 Service PMPM
Inpatient HospitalMedical/Surgical 119.4 4.2 504.7 $ 1,967.91 $ 82.77 109.9 4.3 468.2 $ 2,100.23 $ 81.94Well Newborn - - - - - - - - - - Other Newborn - - - - - - - - - - Maternity Non-Delivery 0.4 2.0 0.8 803.75 0.05 0.1 1.0 0.1 793.00 0.01 Psychiatric/Substance Abuse 16.2 4.8 77.8 519.15 3.37 15.2 4.5 68.4 582.41 3.32 Long Term Care 4.6 16.8 77.5 118.95 0.77 7.3 18.5 135.1 128.58 1.45 Other Inpatient 0.2 26.0 5.2 1,537.13 0.67 0.1 3.0 0.3 206.10 0.01
Subtotal 140.8 4.7 665.9 $ 1,578.99 $ 87.62 132.5 5.1 672.1 $ 1,548.40 $ 86.72
Outpatient HospitalGeneral Outpatient 839.4 389.07 27.22 819.9 355.21 24.27 Emergency Room 599.5 178.93 8.94 580.1 182.91 8.84 End-Stage Renal Disease 38.3 930.78 2.97 20.6 1,109.98 1.91
Subtotal 1,477.1 $ 317.85 $ 39.13 1,420.7 $ 295.78 $ 35.02
AncillariesPrescription Drugs 20,488.1 50.90 86.91 20,958.1 51.54 90.02 Transportation 922.3 22.88 1.76 953.8 23.95 1.90 DME/Prosthetics/Orthotics 730.3 70.16 4.27 803.0 67.48 4.52 Home Health/Hospice 127.2 94.32 1.00 144.6 85.65 1.03 Other Ancillary 15.1 25.78 0.03 16.4 27.69 0.04
Subtotal 22,283.1 $ 50.60 $ 93.97 22,875.8 $ 51.15 $ 97.51
PhysicianSurgery 589.9 204.65 10.06 608.8 196.46 9.97 Anesthesia 143.4 176.22 2.11 152.7 171.51 2.18 Hospital Inpatient Visits 945.6 43.07 3.39 936.0 42.16 3.29 Office Visits/Consults 3,490.1 51.49 14.97 3,567.4 50.76 15.09 Well Baby Exams/Physical Exams 159.9 85.80 1.14 184.3 86.26 1.32 Emergency Room Visits 590.6 49.31 2.43 586.6 49.36 2.41 Clinic Visit/Services 2,862.8 31.02 7.40 2,708.3 30.24 6.82 Radiology and Pathology 13,570.2 12.58 14.23 13,953.8 12.45 14.48 Outpatient Behavioral Health 137.9 40.07 0.46 133.6 41.14 0.46 Maternity 1.3 51.74 0.01 0.9 48.12 0.00 Chiropractor 155.3 8.70 0.11 164.0 8.68 0.12 Podiatrist 196.8 40.03 0.66 192.8 37.28 0.60 Vision - EyeCare & Eyewear - - - - - - Other Professional 9,291.2 14.51 11.24 9,651.6 14.85 11.94 DMHDD / DASA 443.1 69.23 2.56 447.7 67.86 2.53 PCCM Fee - - - - - -
Subtotal 32,578.1 $ 26.07 $ 70.76 33,288.5 $ 25.67 $ 71.22
Total Claims/Benefit Cost 57,004.2 $ 61.36 $ 291.48 58,257.1 $ 59.83 $ 290.47
ATTACHMENT 3 Milliman, Inc.Page 49 of 50

3/26/20132:36 PM
State of IllinoisDepartment of Healthcare and Family Services
VMC Base Data
Region: 5 Member Months: 3,859,348 Member Months: 4,160,616 Composite
Fiscal Year 2010 Fiscal Year 2011Average Average
Admits Length Utilization Cost per Admits Length Utilization Cost perType of Service Per 1,000 of Stay Per 1,000 Service PMPM Per 1,000 of Stay Per 1,000 Service PMPM
Inpatient HospitalMedical/Surgical 40.2 3.9 156.8 $ 1,840.98 $ 24.05 37.7 3.8 143.8 $ 1,863.12 $ 22.33Well Newborn 0.1 2.4 0.3 2,260.28 0.05 0.1 2.2 0.2 2,891.44 0.05 Other Newborn 27.4 5.9 162.7 1,395.64 18.93 29.2 6.2 181.1 1,495.78 22.57 Maternity Non-Delivery 4.5 2.5 11.4 847.12 0.80 4.0 2.6 10.1 921.39 0.77 Psychiatric/Substance Abuse 10.3 6.7 68.8 631.67 3.62 9.5 6.9 65.8 619.63 3.40 Long Term Care 0.5 19.3 9.1 112.42 0.09 0.6 18.6 10.6 121.96 0.11 Other Inpatient 0.0 22.6 1.1 5,947.16 0.54 0.0 16.2 0.5 6,361.66 0.28
Subtotal 83.2 4.9 410.1 $ 1,406.78 $ 48.08 81.1 5.1 412.1 $ 1,441.71 $ 49.51
Outpatient HospitalGeneral Outpatient 314.5 313.12 8.21 312.0 317.57 8.26 Emergency Room 694.5 120.77 6.99 658.4 125.73 6.90 End-Stage Renal Disease 3.6 1,150.62 0.34 2.7 1,395.40 0.31
Subtotal 1,012.5 $ 184.13 $ 15.54 973.0 $ 190.74 $ 15.47
AncillariesPrescription Drugs 6,428.3 50.47 27.03 6,539.1 51.71 28.18 Transportation 270.8 38.18 0.86 291.0 36.55 0.89 DME/Prosthetics/Orthotics 220.9 96.08 1.77 244.6 94.89 1.93 Home Health/Hospice 27.6 193.81 0.45 29.5 233.15 0.57 Other Ancillary 22.8 30.73 0.06 20.5 30.39 0.05
Subtotal 6,970.4 $ 51.94 $ 30.17 7,124.6 $ 53.26 $ 31.62
PhysicianSurgery 219.3 155.92 2.85 230.2 149.33 2.86 Anesthesia 81.1 211.38 1.43 80.9 214.86 1.45 Hospital Inpatient Visits 549.5 69.15 3.17 551.9 72.42 3.33 Office Visits/Consults 2,520.3 47.91 10.06 2,494.0 48.41 10.06 Well Baby Exams/Physical Exams 2,291.7 31.58 6.03 2,375.4 31.63 6.26 Emergency Room Visits 689.6 40.49 2.33 658.2 40.81 2.24 Clinic Visit/Services 2,981.1 30.52 7.58 2,947.4 30.95 7.60 Radiology and Pathology 6,871.9 11.33 6.49 7,191.4 11.12 6.67 Outpatient Behavioral Health 79.6 45.42 0.30 73.6 47.31 0.29 Maternity 19.0 47.48 0.08 17.1 47.33 0.07 Chiropractor 67.6 9.42 0.05 68.0 9.42 0.05 Podiatrist 45.4 40.77 0.15 50.5 42.03 0.18 Vision - EyeCare & Eyewear - - - - - - Other Professional 9,673.6 8.30 6.69 9,917.3 8.15 6.74 DMHDD / DASA 410.3 98.70 3.37 391.1 94.99 3.10 PCCM Fee - - - - - -
Subtotal 26,500.1 $ 22.90 $ 50.58 27,046.9 $ 22.58 $ 50.89
Total Claims/Benefit Cost 33,702.5 $ 47.24 $ 132.68 34,152.5 $ 46.77 $ 133.10
ATTACHMENT 3 Milliman, Inc.Page 50 of 50

T:\2013\ILM\3.038-ILM39\12-VMC Apr-Dec 2013 Capitation Rate Documentation-FINAL - Enc 3.doc
Milliman makes no representations or warranties regarding the contents of this letter to third parties. Likewise, third parties are instructed that they are to place no reliance upon this letter prepared for HFS by Milliman that would result in the creation of any duty or liability under any theory of law by Milliman or its employees to third parties. Other parties receiving this letter must rely upon their own experts in drawing conclusions about the capitation rates, assumptions, and trends.
ATTACHMENT 4

3/26/20132:40 PM
State of IllinoisDepartment of Healthcare and Family Services
VMC Rate Development: Apr to Dec 2013Region: 1
Population: 0 thru 90 DaysSFY11 Member Months: 36,226 June 2012 HMO Member Months: 24
Annual Cost Managed Care Annual Managed CostUtilization Per Utilization Utilization Care Cost Per Selection Proposed
Type of Service Per 1,000 Service PMPM Adjustment Per 1,000 Adjustment Service PMPM Trend Adjustment Cap Rate
Inpatient HospitalMedical/Surgical 801.9 $ 1,779.93 $ 118.94 (20.0%) 641.5 6.3% $ 1,891.23 $ 101.10 108.1% 0.9000 $ 98.34Well Newborn 23.0 956.98 1.84 (10.0%) 20.7 0.6% 963.03 1.66 108.1% 0.9000 1.62 Other Newborn 7,106.9 1,719.93 1,018.62 (10.0%) 6,396.2 1.6% 1,747.69 931.55 108.1% 0.9000 906.04 Maternity Non-Delivery - - - (10.0%) 0.0 1.8% 0.00 0.00 108.1% 0.9000 - Psychiatric/Substance Abuse - - - (30.0%) 0.0 23.7% 0.00 0.00 108.1% 0.9000 - Long Term Care - - - (20.0%) 0.0 6.7% 0.00 0.00 100.0% 0.9000 - Other Inpatient - - - (20.0%) 0.0 6.7% 0.00 0.00 108.1% 0.9000 -
Subtotal 7,931.9 $ 1,723.78 $ 1,139.40 (11.0%) 7,058.5 2.0% $ 1,758.43 $ 1,034.32 108.1% 0.9000 $ 1,006.00
Outpatient HospitalGeneral Outpatient 318.0 $ 249.29 $ 6.61 (10.0%) 286.2 (12.9%) $ 217.13 $ 5.18 101.3% 0.9000 $ 4.72Emergency Room 1,140.9 97.00 9.22 (20.0%) 912.7 9.7% 106.41 8.09 101.3% 0.9000 7.38 End-Stage Renal Disease 0.5 1,530.74 0.06 0.0% 0.5 0.0% 1,530.74 0.06 101.3% 0.9000 0.06
Subtotal 1,459.4 $ 130.68 $ 15.89 (17.8%) 1,199.4 2.1% $ 133.43 $ 13.34 101.3% 0.9000 $ 12.16
AncillariesPrescription Drugs 3,330.9 $ 39.94 $ 11.09 0.0% 3,330.9 (5.0%) $ 37.94 $ 10.53 116.5% 0.9000 $ 11.05Transportation 355.2 62.52 1.85 (20.0%) 284.1 0.0% 62.53 1.48 102.6% 0.9000 1.37 DME/Prosthetics/Orthotics 455.2 98.88 3.75 (30.0%) 318.7 2.5% 101.38 2.69 102.6% 0.9000 2.49 Home Health/Hospice 301.5 61.08 1.53 0.0% 301.5 0.0% 61.08 1.53 102.6% 0.9000 1.42 Other Ancillary 90.0 46.03 0.35 (10.0%) 81.0 0.1% 46.06 0.31 102.6% 0.9000 0.29
Subtotal 4,532.8 $ 49.16 $ 18.57 (4.8%) 4,316.2 (6.4%) $ 46.01 $ 16.55 111.5% 0.9000 $ 16.61
PhysicianSurgery 1,337.3 114.60 $ 12.77 (20.0%) 1,069.9 (3.1%) $ 111.08 $ 9.90 102.6% 0.9000 $ 9.15Anesthesia 93.6 244.71 1.91 (20.0%) 74.9 (0.1%) 244.55 1.53 102.6% 0.9000 1.41 Hospital Inpatient Visits 9,138.9 101.05 76.96 (20.0%) 7,311.1 6.9% 108.05 65.83 102.6% 0.9000 60.82 Office Visits/Consults 3,518.8 46.10 13.52 (10.0%) 3,166.9 (12.7%) 40.23 10.62 102.6% 0.9000 9.81 Well Baby Exams/Physical Exams 17,309.5 31.61 45.60 40.0% 24,233.3 0.4% 31.74 64.10 102.6% 0.9000 59.22 Emergency Room Visits 1,028.7 40.12 3.44 (20.0%) 823.0 1.4% 40.69 2.79 102.6% 0.9000 2.58 Clinic Visit/Services 2,989.9 93.88 23.39 (10.0%) 2,690.9 2.1% 95.87 21.50 102.6% 0.9000 19.86 Radiology and Pathology 26,501.9 5.42 11.98 (20.0%) 21,201.5 (7.1%) 5.03 8.89 102.6% 0.9000 8.21 Outpatient Behavioral Health 0.2 56.08 0.00 (30.0%) 0.1 (3.0%) 54.40 0.00 102.6% 0.9000 0.00 Maternity 2.8 50.29 0.01 0.0% 2.8 0.0% 50.29 0.01 102.6% 0.9000 0.01 Chiropractor 57.2 10.21 0.05 (40.0%) 34.3 (0.0%) 10.21 0.03 102.6% 0.9000 0.03 Podiatrist 10.7 57.03 0.05 0.0% 10.7 0.0% 57.03 0.05 102.6% 0.9000 0.05 Vision - EyeCare & Eyewear - - - (10.0%) 0.0 0.0% 0.00 0.00 102.6% 0.9000 - Other Professional 4,107.1 17.91 6.13 10.0% 4,517.9 6.1% 18.99 7.15 102.6% 0.9000 6.61 DMHDD / DASA - - - (30.0%) 0.0 (14.5%) 0.00 0.00 102.6% 0.9000 - PCCM Fee 2.00
Subtotal 66,096.6 $ 35.55 $ 195.80 (1.5%) 65,137.2 (0.3%) $ 35.45 $ 192.41 102.6% 0.9000 $ 179.75
Total Claims/Benefit Cost 80,020.6 $ 205.40 $ 1,369.66 (2.9%) 77,711.3 (5.5%) $ 194.04 $ 1,256.62 107.2% 0.9000 $ 1,214.51Copay Adjustment - Administration 185.50
Capitation Rate $ 1,400.01
ATTACHMENT 4 Milliman, Inc.Page 1 of 66

3/26/20132:40 PM
State of IllinoisDepartment of Healthcare and Family Services
VMC Rate Development: Apr to Dec 2013Region: 1
Population: 91 Days thru 1 yearSFY11 Member Months: 168,239 June 2012 HMO Member Months: 87
Annual Cost Managed Care Annual Managed CostUtilization Per Utilization Utilization Care Cost Per Selection Proposed
Type of Service Per 1,000 Service PMPM Adjustment Per 1,000 Adjustment Service PMPM Trend Adjustment Cap Rate
Inpatient HospitalMedical/Surgical 239.2 $ 1,721.65 $ 34.31 (20.0%) 191.3 6.3% $ 1,829.30 $ 29.17 102.6% 1.0000 $ 29.94Well Newborn - - - (10.0%) 0.0 0.6% 0.00 0.00 102.6% 1.0000 - Other Newborn 3.3 1,951.13 0.53 (10.0%) 2.9 1.6% 1,982.62 0.49 102.6% 1.0000 0.50 Maternity Non-Delivery - - - (10.0%) 0.0 1.8% 0.00 0.00 102.6% 1.0000 - Psychiatric/Substance Abuse 0.1 1,643.89 0.01 (30.0%) 0.1 23.7% 2,034.10 0.01 102.6% 1.0000 0.01 Long Term Care - - - (20.0%) 0.0 6.7% 0.00 0.00 100.0% 1.0000 - Other Inpatient - - - (20.0%) 0.0 6.7% 0.00 0.00 102.6% 1.0000 -
Subtotal 242.5 $ 1,724.71 $ 34.86 (19.9%) 194.3 6.2% $ 1,831.70 $ 29.67 102.6% 1.0000 $ 30.45
Outpatient HospitalGeneral Outpatient 161.3 $ 339.31 $ 4.56 (10.0%) 145.2 (12.9%) $ 295.54 $ 3.57 101.3% 1.0000 $ 3.62Emergency Room 1,282.6 86.69 9.27 (20.0%) 1,026.1 9.7% 95.10 8.13 101.3% 1.0000 8.24 End-Stage Renal Disease 0.2 189.66 0.00 0.0% 0.2 0.0% 189.66 0.00 101.3% 1.0000 0.00
Subtotal 1,444.1 $ 114.92 $ 13.83 (18.9%) 1,171.5 4.4% $ 119.95 $ 11.71 101.3% 1.0000 $ 11.86
AncillariesPrescription Drugs 5,537.6 $ 36.61 $ 16.89 0.0% 5,537.6 (5.0%) $ 34.78 $ 16.05 116.5% 1.0000 $ 18.70Transportation 190.8 45.26 0.72 (20.0%) 152.6 0.0% 45.27 0.58 102.6% 1.0000 0.59 DME/Prosthetics/Orthotics 415.3 86.97 3.01 (30.0%) 290.7 2.5% 89.17 2.16 102.6% 1.0000 2.22 Home Health/Hospice 63.1 76.50 0.40 0.0% 63.1 0.0% 76.50 0.40 102.6% 1.0000 0.41 Other Ancillary 60.8 26.36 0.13 (10.0%) 54.7 0.1% 26.38 0.12 102.6% 1.0000 0.12
Subtotal 6,267.5 $ 40.51 $ 21.16 (2.7%) 6,098.7 (6.2%) $ 37.99 $ 19.31 114.2% 1.0000 $ 22.05
PhysicianSurgery 179.5 157.96 $ 2.36 (20.0%) 143.6 (3.1%) $ 153.11 $ 1.83 105.3% 1.0000 $ 1.93Anesthesia 80.4 154.87 1.04 (20.0%) 64.3 (0.1%) 154.77 0.83 105.3% 1.0000 0.87 Hospital Inpatient Visits 410.7 75.48 2.58 (20.0%) 328.6 6.9% 80.71 2.21 105.3% 1.0000 2.33 Office Visits/Consults 3,391.9 45.35 12.82 (10.0%) 3,052.7 (12.7%) 39.57 10.07 105.3% 1.0000 10.60 Well Baby Exams/Physical Exams 8,587.7 23.61 16.90 40.0% 12,022.7 0.4% 23.71 23.75 105.3% 1.0000 25.02 Emergency Room Visits 1,119.7 35.28 3.29 (20.0%) 895.8 1.4% 35.78 2.67 105.3% 1.0000 2.81 Clinic Visit/Services 3,964.2 37.44 12.37 (10.0%) 3,567.8 2.1% 38.24 11.37 105.3% 1.0000 11.97 Radiology and Pathology 5,182.6 9.09 3.93 (20.0%) 4,146.1 (7.1%) 8.44 2.92 105.3% 1.0000 3.07 Outpatient Behavioral Health 0.1 80.00 0.00 (30.0%) 0.0 (3.0%) 77.60 0.00 105.3% 1.0000 0.00 Maternity 4.1 49.67 0.02 0.0% 4.1 0.0% 49.67 0.02 105.3% 1.0000 0.02 Chiropractor 63.4 10.28 0.05 (40.0%) 38.1 (0.0%) 10.28 0.03 105.3% 1.0000 0.03 Podiatrist 4.7 33.12 0.01 0.0% 4.7 0.0% 33.12 0.01 105.3% 1.0000 0.01 Vision - EyeCare & Eyewear - - - (10.0%) 0.0 0.0% 0.00 0.00 105.3% 1.0000 - Other Professional 9,761.9 8.04 6.54 10.0% 10,738.1 6.1% 8.53 7.63 105.3% 1.0000 8.04 DMHDD / DASA 0.0 59.63 0.00 (30.0%) 0.0 (14.5%) 50.97 0.00 105.3% 1.0000 0.00 PCCM Fee 2.00
Subtotal 32,751.1 $ 22.69 $ 61.92 6.9% 35,006.7 (4.3%) $ 21.71 $ 63.34 105.3% 1.0000 $ 68.72
Total Claims/Benefit Cost 40,705.3 $ 38.84 $ 131.76 4.3% 42,471.2 (9.8%) $ 35.04 $ 124.03 105.7% 1.0000 $ 133.08Copay Adjustment - Administration 20.33
Capitation Rate $ 153.41
ATTACHMENT 4 Milliman, Inc.Page 2 of 66

3/26/20132:40 PM
State of IllinoisDepartment of Healthcare and Family Services
VMC Rate Development: Apr to Dec 2013Region: 1
Population: 2 yrs thru 5 yrsSFY11 Member Months: 339,271 June 2012 HMO Member Months: 89
Annual Cost Managed Care Annual Managed CostUtilization Per Utilization Utilization Care Cost Per Selection Proposed
Type of Service Per 1,000 Service PMPM Adjustment Per 1,000 Adjustment Service PMPM Trend Adjustment Cap Rate
Inpatient HospitalMedical/Surgical 76.0 $ 1,530.98 $ 9.70 (20.0%) 60.8 6.3% $ 1,626.71 $ 8.24 102.6% 0.8873 $ 7.51Well Newborn - - - (10.0%) 0.0 0.6% 0.00 0.00 102.6% 0.8873 - Other Newborn 0.2 2,254.93 0.03 (10.0%) 0.1 1.6% 2,291.33 0.03 102.6% 0.8873 0.02 Maternity Non-Delivery - - - (10.0%) 0.0 1.8% 0.00 0.00 102.6% 0.8873 - Psychiatric/Substance Abuse 5.3 698.78 0.31 (30.0%) 3.7 23.7% 864.65 0.27 102.6% 0.8873 0.24 Long Term Care - - - (20.0%) 0.0 6.7% 0.00 0.00 100.0% 0.8873 - Other Inpatient 1.3 8,309.83 0.87 (20.0%) 1.0 6.7% 8,868.15 0.75 102.6% 0.8873 0.68
Subtotal 82.7 $ 1,582.67 $ 10.91 (20.6%) 65.6 7.2% $ 1,696.61 $ 9.28 102.6% 0.8873 $ 8.45
Outpatient HospitalGeneral Outpatient 110.0 $ 398.43 $ 3.65 (10.0%) 99.0 (12.9%) $ 347.03 $ 2.86 101.3% 0.8873 $ 2.57Emergency Room 740.7 92.12 5.69 (20.0%) 592.6 9.7% 101.06 4.99 101.3% 0.8873 4.49 End-Stage Renal Disease 0.2 1,431.95 0.02 0.0% 0.2 0.0% 1,431.95 0.02 101.3% 0.8873 0.02
Subtotal 850.8 $ 131.96 $ 9.36 (18.7%) 691.7 3.5% $ 136.55 $ 7.87 101.3% 0.8873 $ 7.08
AncillariesPrescription Drugs 3,733.9 $ 41.27 $ 12.84 0.0% 3,733.9 (5.0%) $ 39.21 $ 12.20 116.5% 0.8873 $ 12.61Transportation 112.5 39.93 0.37 (20.0%) 90.0 0.0% 39.94 0.30 102.6% 0.8873 0.27 DME/Prosthetics/Orthotics 160.6 115.06 1.54 (30.0%) 112.4 2.5% 117.97 1.11 102.6% 0.8873 1.01 Home Health/Hospice 13.5 487.18 0.55 0.0% 13.5 0.0% 487.18 0.55 102.6% 0.8873 0.50 Other Ancillary 65.3 25.31 0.14 (10.0%) 58.8 0.1% 25.32 0.12 102.6% 0.8873 0.11
Subtotal 4,085.9 $ 45.35 $ 15.44 (1.9%) 4,008.7 (5.8%) $ 42.74 $ 14.28 114.5% 0.8873 $ 14.51
PhysicianSurgery 166.9 118.40 $ 1.65 (20.0%) 133.5 (3.1%) $ 114.76 $ 1.28 105.3% 0.8873 $ 1.19Anesthesia 63.2 148.76 0.78 (20.0%) 50.6 (0.1%) 148.66 0.63 105.3% 0.8873 0.59 Hospital Inpatient Visits 107.4 38.30 0.34 (20.0%) 85.9 6.9% 40.95 0.29 105.3% 0.8873 0.27 Office Visits/Consults 2,147.0 45.56 8.15 (10.0%) 1,932.3 (12.7%) 39.76 6.40 105.3% 0.8873 5.98 Well Baby Exams/Physical Exams 2,060.0 29.68 5.09 40.0% 2,884.0 0.4% 29.80 7.16 105.3% 0.8873 6.69 Emergency Room Visits 627.8 34.25 1.79 (20.0%) 502.2 1.4% 34.73 1.45 105.3% 0.8873 1.36 Clinic Visit/Services 3,158.6 23.35 6.15 (10.0%) 2,842.8 2.1% 23.85 5.65 105.3% 0.8873 5.28 Radiology and Pathology 3,494.6 8.45 2.46 (20.0%) 2,795.7 (7.1%) 7.85 1.83 105.3% 0.8873 1.71 Outpatient Behavioral Health 7.9 54.14 0.04 (30.0%) 5.5 (3.0%) 52.52 0.02 105.3% 0.8873 0.02 Maternity 2.9 50.08 0.01 0.0% 2.9 0.0% 50.08 0.01 105.3% 0.8873 0.01 Chiropractor 77.6 10.31 0.07 (40.0%) 46.6 (0.0%) 10.31 0.04 105.3% 0.8873 0.04 Podiatrist 5.8 39.57 0.02 0.0% 5.8 0.0% 39.57 0.02 105.3% 0.8873 0.02 Vision - EyeCare & Eyewear - - - (10.0%) 0.0 0.0% 0.00 0.00 105.3% 0.8873 - Other Professional 9,840.3 7.56 6.20 10.0% 10,824.4 6.1% 8.02 7.23 105.3% 0.8873 6.76 DMHDD / DASA 46.4 74.07 0.29 (30.0%) 32.5 (14.5%) 63.32 0.17 105.3% 0.8873 0.16 PCCM Fee 2.00
Subtotal 21,806.5 $ 18.18 $ 33.04 1.6% 22,144.7 (4.0%) $ 17.44 $ 32.19 105.3% 0.8873 $ 32.09
Total Claims/Benefit Cost 26,826.0 $ 30.75 $ 68.74 0.3% 26,910.7 (7.7%) $ 28.37 $ 63.62 106.5% 0.8873 $ 62.12Copay Adjustment - Administration 9.49
Capitation Rate $ 71.61
ATTACHMENT 4 Milliman, Inc.Page 3 of 66

3/26/20132:40 PM
State of IllinoisDepartment of Healthcare and Family Services
VMC Rate Development: Apr to Dec 2013Region: 1
Population: 6 yrs thru 13 yrsSFY11 Member Months: 638,243 June 2012 HMO Member Months: 156
Annual Cost Managed Care Annual Managed CostUtilization Per Utilization Utilization Care Cost Per Selection Proposed
Type of Service Per 1,000 Service PMPM Adjustment Per 1,000 Adjustment Service PMPM Trend Adjustment Cap Rate
Inpatient HospitalMedical/Surgical 50.0 $ 1,599.53 $ 6.66 (20.0%) 40.0 6.3% $ 1,699.55 $ 5.66 102.6% 0.7595 $ 4.42Well Newborn - - - (10.0%) 0.0 0.6% 0.00 0.00 102.6% 0.7595 - Other Newborn - - 0.00 (10.0%) 0.0 1.6% 0.00 0.00 102.6% 0.7595 - Maternity Non-Delivery - - - (10.0%) 0.0 1.8% 0.00 0.00 102.6% 0.7595 - Psychiatric/Substance Abuse 107.9 671.46 6.04 (30.0%) 75.5 23.7% 830.85 5.23 102.6% 0.7595 4.08 Long Term Care - - - (20.0%) 0.0 6.7% 0.00 0.00 100.0% 0.7595 - Other Inpatient - - - (20.0%) 0.0 6.7% 0.00 0.00 102.6% 0.7595 -
Subtotal 157.9 $ 965.45 $ 12.70 (26.8%) 115.5 17.2% $ 1,131.67 $ 10.89 102.6% 0.7595 $ 8.49
Outpatient HospitalGeneral Outpatient 96.6 $ 385.24 $ 3.10 (10.0%) 87.0 (12.9%) $ 335.54 $ 2.43 101.3% 0.7595 $ 1.87Emergency Room 477.9 99.70 3.97 (20.0%) 382.3 9.7% 109.37 3.48 101.3% 0.7595 2.68 End-Stage Renal Disease - - 0.00 0.0% 0.0 0.0% 0.00 0.00 101.3% 0.7595 -
Subtotal 574.6 $ 147.73 $ 7.07 (18.3%) 469.3 2.4% $ 151.28 $ 5.92 101.3% 0.7595 $ 4.55
AncillariesPrescription Drugs 4,928.3 $ 79.27 $ 32.55 0.0% 4,928.3 (5.0%) $ 75.31 $ 30.93 116.5% 0.7595 $ 27.37Transportation 128.1 36.08 0.39 (20.0%) 102.5 0.0% 36.09 0.31 102.6% 0.7595 0.24 DME/Prosthetics/Orthotics 139.3 125.55 1.46 (30.0%) 97.5 2.5% 128.73 1.05 102.6% 0.7595 0.82 Home Health/Hospice 11.8 354.87 0.35 0.0% 11.8 0.0% 354.87 0.35 102.6% 0.7595 0.27 Other Ancillary 27.4 22.19 0.05 (10.0%) 24.7 0.1% 22.20 0.05 102.6% 0.7595 0.04
Subtotal 5,234.9 $ 79.76 $ 34.80 (1.3%) 5,164.7 (4.8%) $ 75.92 $ 32.68 115.8% 0.7595 $ 28.74
PhysicianSurgery 149.3 124.41 $ 1.55 (20.0%) 119.4 (3.1%) $ 120.59 $ 1.20 105.3% 0.7595 $ 0.96Anesthesia 40.8 156.29 0.53 (20.0%) 32.6 (0.1%) 156.19 0.42 105.3% 0.7595 0.34 Hospital Inpatient Visits 145.1 31.86 0.39 (20.0%) 116.1 6.9% 34.07 0.33 105.3% 0.7595 0.26 Office Visits/Consults 1,678.5 46.24 6.47 (10.0%) 1,510.7 (12.7%) 40.35 5.08 105.3% 0.7595 4.06 Well Baby Exams/Physical Exams 785.8 32.93 2.16 40.0% 1,100.1 0.4% 33.07 3.03 105.3% 0.7595 2.43 Emergency Room Visits 411.2 34.97 1.20 (20.0%) 328.9 1.4% 35.46 0.97 105.3% 0.7595 0.78 Clinic Visit/Services 2,998.7 19.21 4.80 (10.0%) 2,698.8 2.1% 19.62 4.41 105.3% 0.7595 3.53 Radiology and Pathology 2,587.8 9.69 2.09 (20.0%) 2,070.3 (7.1%) 9.00 1.55 105.3% 0.7595 1.24 Outpatient Behavioral Health 87.3 41.13 0.30 (30.0%) 61.1 (3.0%) 39.90 0.20 105.3% 0.7595 0.16 Maternity 1.5 51.07 0.01 0.0% 1.5 0.0% 51.07 0.01 105.3% 0.7595 0.01 Chiropractor 105.1 10.33 0.09 (40.0%) 63.0 (0.0%) 10.33 0.05 105.3% 0.7595 0.04 Podiatrist 22.2 41.59 0.08 0.0% 22.2 0.0% 41.59 0.08 105.3% 0.7595 0.06 Vision - EyeCare & Eyewear - - - (10.0%) 0.0 0.0% 0.00 0.00 105.3% 0.7595 - Other Professional 9,006.9 3.23 2.43 10.0% 9,907.5 6.1% 3.43 2.83 105.3% 0.7595 2.26 DMHDD / DASA 335.1 72.18 2.02 (30.0%) 234.5 (14.5%) 61.70 1.21 105.3% 0.7595 0.96 PCCM Fee 2.00
Subtotal 18,355.2 $ 15.75 $ 24.09 (0.5%) 18,266.9 (10.8%) $ 14.04 $ 21.38 105.3% 0.7595 $ 19.10
Total Claims/Benefit Cost 24,322.5 $ 38.81 $ 78.66 (1.3%) 24,016.5 (8.8%) $ 35.41 $ 70.86 109.4% 0.7595 $ 60.89Copay Adjustment - Administration 9.30
Capitation Rate $ 70.18
ATTACHMENT 4 Milliman, Inc.Page 4 of 66

3/26/20132:40 PM
State of IllinoisDepartment of Healthcare and Family Services
VMC Rate Development: Apr to Dec 2013Region: 1
Population: 14 yrs thru 20 yrs - MaleSFY11 Member Months: 173,662 June 2012 HMO Member Months: 33
Annual Cost Managed Care Annual Managed CostUtilization Per Utilization Utilization Care Cost Per Selection Proposed
Type of Service Per 1,000 Service PMPM Adjustment Per 1,000 Adjustment Service PMPM Trend Adjustment Cap Rate
Inpatient HospitalMedical/Surgical 81.1 $ 1,922.51 $ 13.00 (20.0%) 64.9 6.3% $ 2,042.72 $ 11.05 104.0% 0.7423 $ 8.53Well Newborn - - - (10.0%) 0.0 0.6% 0.00 0.00 104.0% 0.7423 - Other Newborn - - - (10.0%) 0.0 1.6% 0.00 0.00 104.0% 0.7423 - Maternity Non-Delivery - - - (10.0%) 0.0 1.8% 0.00 0.00 104.0% 0.7423 - Psychiatric/Substance Abuse 225.5 624.53 11.74 (30.0%) 157.9 23.7% 772.78 10.17 104.0% 0.7423 7.85 Long Term Care 4.6 144.93 0.06 (20.0%) 3.6 6.7% 154.67 0.05 100.0% 0.7423 0.03 Other Inpatient 2.6 5,193.21 1.12 (20.0%) 2.1 6.7% 5,542.13 0.96 104.0% 0.7423 0.74
Subtotal 313.8 $ 990.90 $ 25.91 (27.2%) 228.5 17.8% $ 1,166.95 $ 22.22 104.0% 0.7423 $ 17.15
Outpatient HospitalGeneral Outpatient 150.2 $ 400.05 $ 5.01 (10.0%) 135.2 (12.9%) $ 348.44 $ 3.93 102.6% 0.7423 $ 2.99Emergency Room 571.3 117.59 5.60 (20.0%) 457.0 9.7% 129.00 4.91 102.6% 0.7423 3.74 End-Stage Renal Disease 1.1 2,574.49 0.23 0.0% 1.1 0.0% 2,574.49 0.23 102.6% 0.7423 0.17
Subtotal 722.6 $ 179.90 $ 10.83 (17.9%) 593.3 1.9% $ 183.35 $ 9.07 102.6% 0.7423 $ 6.91
AncillariesPrescription Drugs 5,333.1 $ 85.80 $ 38.13 0.0% 5,333.1 (5.0%) $ 81.51 $ 36.23 116.5% 0.7423 $ 31.33Transportation 362.5 33.91 1.02 (20.0%) 290.0 0.0% 33.92 0.82 101.3% 0.7423 0.62 DME/Prosthetics/Orthotics 138.0 109.37 1.26 (30.0%) 96.6 2.5% 112.14 0.90 101.3% 0.7423 0.68 Home Health/Hospice 10.5 67.92 0.06 0.0% 10.5 0.0% 67.92 0.06 101.3% 0.7423 0.04 Other Ancillary 7.6 25.86 0.02 (10.0%) 6.9 0.1% 25.88 0.01 101.3% 0.7423 0.01
Subtotal 5,851.8 $ 83.03 $ 40.49 (2.0%) 5,737.1 (4.2%) $ 79.53 $ 38.02 115.8% 0.7423 $ 32.69
PhysicianSurgery 204.8 143.31 $ 2.45 (20.0%) 163.8 (3.1%) $ 138.91 $ 1.90 104.0% 0.7423 $ 1.46Anesthesia 43.6 173.50 0.63 (20.0%) 34.9 (0.1%) 173.39 0.50 104.0% 0.7423 0.39 Hospital Inpatient Visits 273.2 30.38 0.69 (20.0%) 218.5 6.9% 32.49 0.59 104.0% 0.7423 0.46 Office Visits/Consults 1,392.1 45.97 5.33 (10.0%) 1,252.9 (12.7%) 40.12 4.19 104.0% 0.7423 3.23 Well Baby Exams/Physical Exams 623.7 38.13 1.98 40.0% 873.1 0.4% 38.29 2.79 104.0% 0.7423 2.15 Emergency Room Visits 488.6 37.25 1.52 (20.0%) 390.9 1.4% 37.78 1.23 104.0% 0.7423 0.95 Clinic Visit/Services 3,104.9 18.43 4.77 (10.0%) 2,794.4 2.1% 18.82 4.38 104.0% 0.7423 3.38 Radiology and Pathology 3,160.0 12.29 3.24 (20.0%) 2,528.0 (7.1%) 11.41 2.40 104.0% 0.7423 1.86 Outpatient Behavioral Health 140.8 43.70 0.51 (30.0%) 98.5 (3.0%) 42.39 0.35 104.0% 0.7423 0.27 Maternity 1.4 49.47 0.01 0.0% 1.4 0.0% 49.47 0.01 104.0% 0.7423 0.00 Chiropractor 142.3 10.05 0.12 (40.0%) 85.4 (0.0%) 10.05 0.07 104.0% 0.7423 0.06 Podiatrist 43.0 48.30 0.17 0.0% 43.0 0.0% 48.30 0.17 104.0% 0.7423 0.13 Vision - EyeCare & Eyewear - - - (10.0%) 0.0 0.0% 0.00 0.00 104.0% 0.7423 - Other Professional 8,574.3 3.37 2.41 10.0% 9,431.7 6.1% 3.57 2.81 104.0% 0.7423 2.17 DMHDD / DASA 1,268.1 116.09 12.27 (30.0%) 887.7 (14.5%) 99.24 7.34 104.0% 0.7423 5.67 PCCM Fee 2.00
Subtotal 19,460.7 $ 22.26 $ 36.09 (3.4%) 18,804.3 (17.6%) $ 18.34 $ 28.73 104.0% 0.7423 $ 24.18
Total Claims/Benefit Cost 26,348.8 $ 51.61 $ 113.33 (3.7%) 25,363.1 (10.1%) $ 46.38 $ 98.04 108.4% 0.7423 $ 80.92Copay Adjustment - Administration 12.36
Capitation Rate $ 93.28
ATTACHMENT 4 Milliman, Inc.Page 5 of 66

3/26/20132:40 PM
State of IllinoisDepartment of Healthcare and Family Services
VMC Rate Development: Apr to Dec 2013Region: 1
Population: 14 yrs thru 20 yrs - FemaleSFY11 Member Months: 196,405 June 2012 HMO Member Months: 46
Annual Cost Managed Care Annual Managed CostUtilization Per Utilization Utilization Care Cost Per Selection Proposed
Type of Service Per 1,000 Service PMPM Adjustment Per 1,000 Adjustment Service PMPM Trend Adjustment Cap Rate
Inpatient HospitalMedical/Surgical 83.3 $ 1,799.25 $ 12.48 (20.0%) 66.6 6.3% $ 1,911.75 $ 10.61 104.0% 0.8353 $ 9.22Well Newborn - - - (10.0%) 0.0 0.6% 0.00 0.00 104.0% 0.8353 - Other Newborn - - - (10.0%) 0.0 1.6% 0.00 0.00 104.0% 0.8353 - Maternity Non-Delivery 38.0 614.04 1.95 (10.0%) 34.2 1.8% 624.97 1.78 104.0% 0.8353 1.55 Psychiatric/Substance Abuse 243.5 600.93 12.19 (30.0%) 170.5 23.7% 743.57 10.56 104.0% 0.8353 9.17 Long Term Care - - - (20.0%) 0.0 6.7% 0.00 0.00 100.0% 0.8353 - Other Inpatient - - - (20.0%) 0.0 6.7% 0.00 0.00 104.0% 0.8353 -
Subtotal 364.8 $ 875.79 $ 26.62 (25.6%) 271.3 15.9% $ 1,015.42 $ 22.96 104.0% 0.8353 $ 19.94
Outpatient HospitalGeneral Outpatient 382.4 $ 284.81 $ 9.08 (10.0%) 344.1 (12.9%) $ 248.07 $ 7.11 102.6% 0.8353 $ 6.10Emergency Room 945.7 118.29 9.32 (20.0%) 756.6 9.7% 129.76 8.18 102.6% 0.8353 7.02 End-Stage Renal Disease - - - 0.0% 0.0 0.0% 0.00 0.00 102.6% 0.8353 -
Subtotal 1,328.1 $ 166.23 $ 18.40 (17.1%) 1,100.7 0.3% $ 166.75 $ 15.30 102.6% 0.8353 $ 13.12
AncillariesPrescription Drugs 7,599.7 $ 50.98 $ 32.28 0.0% 7,599.7 (5.0%) $ 48.43 $ 30.67 116.5% 0.8353 $ 29.86Transportation 374.1 41.27 1.29 (20.0%) 299.3 0.0% 41.28 1.03 101.3% 0.8353 0.87 DME/Prosthetics/Orthotics 172.1 105.36 1.51 (30.0%) 120.5 2.5% 108.02 1.08 101.3% 0.8353 0.92 Home Health/Hospice 19.3 66.38 0.11 0.0% 19.3 0.0% 66.38 0.11 101.3% 0.8353 0.09 Other Ancillary 7.4 26.27 0.02 (10.0%) 6.6 0.1% 26.29 0.01 101.3% 0.8353 0.01
Subtotal 8,172.6 $ 51.69 $ 35.20 (1.6%) 8,045.4 (5.0%) $ 49.08 $ 32.91 115.5% 0.8353 $ 31.75
PhysicianSurgery 219.4 137.45 $ 2.51 (20.0%) 175.5 (3.1%) $ 133.23 $ 1.95 104.0% 0.8353 $ 1.69Anesthesia 118.2 240.60 2.37 (20.0%) 94.6 (0.1%) 240.45 1.89 104.0% 0.8353 1.65 Hospital Inpatient Visits 353.6 31.80 0.94 (20.0%) 282.9 6.9% 34.00 0.80 104.0% 0.8353 0.70 Office Visits/Consults 2,339.0 43.92 8.56 (10.0%) 2,105.1 (12.7%) 38.33 6.72 104.0% 0.8353 5.84 Well Baby Exams/Physical Exams 763.2 36.83 2.34 40.0% 1,068.5 0.4% 36.98 3.29 104.0% 0.8353 2.86 Emergency Room Visits 830.6 39.70 2.75 (20.0%) 664.5 1.4% 40.26 2.23 104.0% 0.8353 1.94 Clinic Visit/Services 3,846.2 30.71 9.84 (10.0%) 3,461.6 2.1% 31.36 9.05 104.0% 0.8353 7.86 Radiology and Pathology 10,374.1 12.36 10.68 (20.0%) 8,299.3 (7.1%) 11.48 7.94 104.0% 0.8353 6.89 Outpatient Behavioral Health 133.5 46.38 0.52 (30.0%) 93.5 (3.0%) 44.99 0.35 104.0% 0.8353 0.30 Maternity 97.0 45.75 0.37 0.0% 97.0 0.0% 45.75 0.37 104.0% 0.8353 0.32 Chiropractor 221.2 9.95 0.18 (40.0%) 132.7 (0.0%) 9.95 0.11 104.0% 0.8353 0.10 Podiatrist 37.1 44.65 0.14 0.0% 37.1 0.0% 44.65 0.14 104.0% 0.8353 0.12 Vision - EyeCare & Eyewear - - - (10.0%) 0.0 0.0% 0.00 0.00 104.0% 0.8353 - Other Professional 10,009.2 10.62 8.86 10.0% 11,010.2 6.1% 11.26 10.33 104.0% 0.8353 8.98 DMHDD / DASA 720.4 97.50 5.85 (30.0%) 504.3 (14.5%) 83.35 3.50 104.0% 0.8353 3.04 PCCM Fee 2.00
Subtotal 30,062.8 $ 22.32 $ 55.92 (6.8%) 28,026.6 (6.6%) $ 20.84 $ 48.68 104.0% 0.8353 $ 44.29
Total Claims/Benefit Cost 39,928.3 $ 40.92 $ 136.14 (6.2%) 37,444.1 (6.1%) $ 38.41 $ 119.84 107.0% 0.8353 $ 109.09Copay Adjustment - Administration 16.66
Capitation Rate $ 125.75
ATTACHMENT 4 Milliman, Inc.Page 6 of 66

3/26/20132:40 PM
State of IllinoisDepartment of Healthcare and Family Services
VMC Rate Development: Apr to Dec 2013Region: 1
Population: 21 yrs thru 44 yrs - MaleSFY11 Member Months: 129,384 June 2012 HMO Member Months: 51
Annual Cost Managed Care Annual Managed CostUtilization Per Utilization Utilization Care Cost Per Selection Proposed
Type of Service Per 1,000 Service PMPM Adjustment Per 1,000 Adjustment Service PMPM Trend Adjustment Cap Rate
Inpatient HospitalMedical/Surgical 220.8 $ 2,363.47 $ 43.49 (20.0%) 176.7 6.3% $ 2,511.25 $ 36.97 101.3% 0.8624 $ 32.30Well Newborn - - - (10.0%) 0.0 0.6% 0.00 0.00 101.3% 0.8624 - Other Newborn - - - (10.0%) 0.0 1.6% 0.00 0.00 101.3% 0.8624 - Maternity Non-Delivery 0.2 761.43 0.01 (10.0%) 0.2 1.8% 774.98 0.01 101.3% 0.8624 0.01 Psychiatric/Substance Abuse 62.0 394.23 2.04 (30.0%) 43.4 23.7% 487.81 1.77 101.3% 0.8624 1.54 Long Term Care 15.7 122.44 0.16 (20.0%) 12.6 6.7% 130.67 0.14 100.0% 0.8624 0.12 Other Inpatient 0.8 3,379.79 0.23 (20.0%) 0.6 6.7% 3,606.87 0.19 101.3% 0.8624 0.17
Subtotal 299.6 $ 1,839.84 $ 45.93 (22.1%) 233.5 9.2% $ 2,008.46 $ 39.08 101.3% 0.8624 $ 34.14
Outpatient HospitalGeneral Outpatient 424.9 $ 396.09 $ 14.03 (10.0%) 382.4 (12.9%) $ 344.99 $ 10.99 102.6% 0.8624 $ 9.73Emergency Room 961.3 128.02 10.26 (20.0%) 769.0 9.7% 140.44 9.00 102.6% 0.8624 7.97 End-Stage Renal Disease 7.1 752.67 0.45 0.0% 7.1 0.0% 752.67 0.45 102.6% 0.8624 0.40
Subtotal 1,393.3 $ 212.98 $ 24.73 (16.8%) 1,158.6 (0.6%) $ 211.74 $ 20.44 102.6% 0.8624 $ 18.10
AncillariesPrescription Drugs 10,327.4 $ 49.99 $ 43.02 0.0% 10,327.4 (5.0%) $ 47.49 $ 40.87 116.5% 0.8624 $ 41.07Transportation 295.3 47.28 1.16 (20.0%) 236.3 0.0% 47.29 0.93 101.3% 0.8624 0.81 DME/Prosthetics/Orthotics 419.6 79.86 2.79 (30.0%) 293.7 2.5% 81.88 2.00 101.3% 0.8624 1.75 Home Health/Hospice 63.5 63.62 0.34 0.0% 63.5 0.0% 63.62 0.34 101.3% 0.8624 0.29 Other Ancillary 13.1 25.33 0.03 (10.0%) 11.8 0.1% 25.34 0.02 101.3% 0.8624 0.02
Subtotal 11,118.9 $ 51.09 $ 47.34 (1.7%) 10,932.7 (5.1%) $ 48.48 $ 44.17 115.4% 0.8624 $ 43.95
PhysicianSurgery 364.6 194.46 $ 5.91 (20.0%) 291.7 (3.1%) $ 188.49 $ 4.58 102.6% 0.8624 $ 4.06Anesthesia 86.1 182.27 1.31 (20.0%) 68.9 (0.1%) 182.15 1.05 102.6% 0.8624 0.93 Hospital Inpatient Visits 357.2 39.05 1.16 (20.0%) 285.8 6.9% 41.76 0.99 102.6% 0.8624 0.88 Office Visits/Consults 1,920.6 47.59 7.62 (10.0%) 1,728.6 (12.7%) 41.53 5.98 102.6% 0.8624 5.30 Well Baby Exams/Physical Exams 24.8 85.67 0.18 40.0% 34.8 0.4% 86.03 0.25 102.6% 0.8624 0.22 Emergency Room Visits 823.8 40.37 2.77 (20.0%) 659.0 1.4% 40.94 2.25 102.6% 0.8624 1.99 Clinic Visit/Services 2,999.7 21.97 5.49 (10.0%) 2,699.8 2.1% 22.44 5.05 102.6% 0.8624 4.47 Radiology and Pathology 5,972.7 12.61 6.28 (20.0%) 4,778.2 (7.1%) 11.71 4.66 102.6% 0.8624 4.13 Outpatient Behavioral Health 96.2 44.79 0.36 (30.0%) 67.3 (3.0%) 43.45 0.24 102.6% 0.8624 0.22 Maternity 1.1 70.21 0.01 0.0% 1.1 0.0% 70.21 0.01 102.6% 0.8624 0.01 Chiropractor - - - (40.0%) 0.0 (0.0%) 0.00 0.00 102.6% 0.8624 - Podiatrist 13.5 43.49 0.05 0.0% 13.5 0.0% 43.49 0.05 102.6% 0.8624 0.04 Vision - EyeCare & Eyewear - - - (10.0%) 0.0 0.0% 0.00 0.00 102.6% 0.8624 - Other Professional 8,164.3 5.68 3.86 10.0% 8,980.8 6.1% 6.02 4.51 102.6% 0.8624 3.99 DMHDD / DASA 374.3 68.29 2.13 (30.0%) 262.0 (14.5%) 58.38 1.27 102.6% 0.8624 1.13 PCCM Fee 2.00
Subtotal 21,199.0 $ 21.01 $ 37.12 (6.3%) 19,871.3 (11.2%) $ 18.66 $ 30.89 102.6% 0.8624 $ 29.35
Total Claims/Benefit Cost 34,010.8 $ 54.73 $ 155.12 (5.3%) 32,196.0 (8.3%) $ 50.16 $ 134.58 106.4% 0.8624 $ 125.54Copay Adjustment (0.83) Administration 19.05
Capitation Rate $ 143.76
ATTACHMENT 4 Milliman, Inc.Page 7 of 66

3/26/20132:40 PM
State of IllinoisDepartment of Healthcare and Family Services
VMC Rate Development: Apr to Dec 2013Region: 1
Population: 21 yrs thru 44 yrs - FemaleSFY11 Member Months: 460,736 June 2012 HMO Member Months: 145
Annual Cost Managed Care Annual Managed CostUtilization Per Utilization Utilization Care Cost Per Selection Proposed
Type of Service Per 1,000 Service PMPM Adjustment Per 1,000 Adjustment Service PMPM Trend Adjustment Cap Rate
Inpatient HospitalMedical/Surgical 172.3 $ 1,709.80 $ 24.56 (20.0%) 137.9 6.3% $ 1,816.71 $ 20.87 101.3% 0.8624 $ 18.24Well Newborn - - - (10.0%) 0.0 0.6% 0.00 0.00 101.3% 0.8624 - Other Newborn 0.1 203.02 0.00 (10.0%) 0.0 1.6% 206.30 0.00 101.3% 0.8624 0.00 Maternity Non-Delivery 68.3 631.69 3.59 (10.0%) 61.5 1.8% 642.93 3.29 101.3% 0.8624 2.88 Psychiatric/Substance Abuse 64.8 409.50 2.21 (30.0%) 45.3 23.7% 506.70 1.91 101.3% 0.8624 1.67 Long Term Care 7.2 120.79 0.07 (20.0%) 5.8 6.7% 128.91 0.06 100.0% 0.8624 0.05 Other Inpatient 0.2 4,679.28 0.08 (20.0%) 0.2 6.7% 4,993.67 0.07 101.3% 0.8624 0.06
Subtotal 312.9 $ 1,170.32 $ 30.51 (19.9%) 250.7 7.2% $ 1,254.83 $ 26.21 101.3% 0.8624 $ 22.90
Outpatient HospitalGeneral Outpatient 779.0 $ 319.79 $ 20.76 (10.0%) 701.1 (12.9%) $ 278.54 $ 16.27 102.6% 0.8624 $ 14.41Emergency Room 1,345.9 130.58 14.65 (20.0%) 1,076.7 9.7% 143.25 12.85 102.6% 0.8624 11.38 End-Stage Renal Disease 2.2 553.16 0.10 0.0% 2.2 0.0% 553.16 0.10 102.6% 0.8624 0.09
Subtotal 2,127.1 $ 200.32 $ 35.51 (16.3%) 1,780.0 (1.6%) $ 197.04 $ 29.23 102.6% 0.8624 $ 25.87
AncillariesPrescription Drugs 15,096.0 $ 44.64 $ 56.16 0.0% 15,096.0 (5.0%) $ 42.41 $ 53.35 116.5% 0.8624 $ 53.61Transportation 356.7 47.29 1.41 (20.0%) 285.4 0.0% 47.30 1.12 101.3% 0.8624 0.98 DME/Prosthetics/Orthotics 314.5 87.70 2.30 (30.0%) 220.1 2.5% 89.92 1.65 101.3% 0.8624 1.44 Home Health/Hospice 39.8 63.79 0.21 0.0% 39.8 0.0% 63.79 0.21 101.3% 0.8624 0.18 Other Ancillary 9.6 25.24 0.02 (10.0%) 8.6 0.1% 25.25 0.02 101.3% 0.8624 0.02
Subtotal 15,816.6 $ 45.60 $ 60.10 (1.1%) 15,649.9 (5.2%) $ 43.21 $ 56.35 115.7% 0.8624 $ 56.24
PhysicianSurgery 516.1 169.49 $ 7.29 (20.0%) 412.9 (3.1%) $ 164.29 $ 5.65 102.6% 0.8624 $ 5.00Anesthesia 226.2 209.99 3.96 (20.0%) 181.0 (0.1%) 209.86 3.17 102.6% 0.8624 2.80 Hospital Inpatient Visits 381.7 37.02 1.18 (20.0%) 305.4 6.9% 39.59 1.01 102.6% 0.8624 0.89 Office Visits/Consults 3,231.2 45.13 12.15 (10.0%) 2,908.1 (12.7%) 39.38 9.54 102.6% 0.8624 8.45 Well Baby Exams/Physical Exams 427.2 50.66 1.80 40.0% 598.0 0.4% 50.87 2.54 102.6% 0.8624 2.24 Emergency Room Visits 1,184.1 41.39 4.08 (20.0%) 947.3 1.4% 41.97 3.31 102.6% 0.8624 2.93 Clinic Visit/Services 4,384.2 34.48 12.60 (10.0%) 3,945.8 2.1% 35.21 11.58 102.6% 0.8624 10.25 Radiology and Pathology 16,423.7 13.67 18.71 (20.0%) 13,138.9 (7.1%) 12.69 13.90 102.6% 0.8624 12.30 Outpatient Behavioral Health 145.1 42.82 0.52 (30.0%) 101.6 (3.0%) 41.54 0.35 102.6% 0.8624 0.31 Maternity 118.9 46.10 0.46 0.0% 118.9 0.0% 46.10 0.46 102.6% 0.8624 0.40 Chiropractor - - - (40.0%) 0.0 (0.0%) 0.00 0.00 102.6% 0.8624 - Podiatrist 11.1 43.02 0.04 0.0% 11.1 0.0% 43.02 0.04 102.6% 0.8624 0.04 Vision - EyeCare & Eyewear - - - (10.0%) 0.0 0.0% 0.00 0.00 102.6% 0.8624 - Other Professional 10,389.3 14.47 12.53 10.0% 11,428.3 6.1% 15.35 14.61 102.6% 0.8624 12.94 DMHDD / DASA 481.7 68.46 2.75 (30.0%) 337.2 (14.5%) 58.52 1.64 102.6% 0.8624 1.46 PCCM Fee 2.00
Subtotal 37,920.6 $ 24.70 $ 78.06 (9.2%) 34,434.5 (4.3%) $ 23.63 $ 67.80 102.6% 0.8624 $ 62.02
Total Claims/Benefit Cost 56,177.1 $ 43.61 $ 204.18 (7.2%) 52,115.0 (5.2%) $ 41.35 $ 179.59 106.6% 0.8624 $ 167.03Copay Adjustment (1.61) Administration 25.27
Capitation Rate $ 190.69
ATTACHMENT 4 Milliman, Inc.Page 8 of 66

3/26/20132:40 PM
State of IllinoisDepartment of Healthcare and Family Services
VMC Rate Development: Apr to Dec 2013Region: 1
Population: 45 + YearsSFY11 Member Months: 104,896 June 2012 HMO Member Months: 28
Annual Cost Managed Care Annual Managed CostUtilization Per Utilization Utilization Care Cost Per Selection Proposed
Type of Service Per 1,000 Service PMPM Adjustment Per 1,000 Adjustment Service PMPM Trend Adjustment Cap Rate
Inpatient HospitalMedical/Surgical 514.5 $ 1,964.90 $ 84.24 (20.0%) 411.6 0.0% $ 1,964.90 $ 67.39 101.3% 0.8624 $ 58.89Well Newborn - - - (10.0%) 0.0 0.0% 0.00 0.00 101.3% 0.8624 - Other Newborn - - - (10.0%) 0.0 0.0% 0.00 0.00 101.3% 0.8624 - Maternity Non-Delivery 0.9 392.45 0.03 (10.0%) 0.8 0.0% 392.45 0.03 101.3% 0.8624 0.02 Psychiatric/Substance Abuse 60.1 422.03 2.11 (30.0%) 42.1 0.0% 422.03 1.48 101.3% 0.8624 1.29 Long Term Care 47.5 121.28 0.48 (20.0%) 38.0 0.0% 121.28 0.38 100.0% 0.8624 0.33 Other Inpatient - - - (20.0%) 0.0 0.0% 0.00 0.00 101.3% 0.8624 -
Subtotal 622.9 $ 1,673.36 $ 86.86 (21.0%) 492.4 0.9% $ 1,688.42 $ 69.28 101.3% 0.8624 $ 60.53
Outpatient HospitalGeneral Outpatient 944.2 $ 374.23 $ 29.45 (10.0%) 849.8 0.0% $ 374.23 $ 26.50 102.6% 0.8624 $ 23.46Emergency Room 782.3 149.60 9.75 (20.0%) 625.9 0.0% 149.60 7.80 102.6% 0.8624 6.91 End-Stage Renal Disease 33.3 618.46 1.71 0.0% 33.3 0.0% 618.46 1.71 102.6% 0.8624 1.52
Subtotal 1,759.8 $ 278.98 $ 40.91 (14.3%) 1,508.9 2.7% $ 286.44 $ 36.02 102.6% 0.8624 $ 31.88
AncillariesPrescription Drugs 24,924.4 $ 51.31 $ 106.57 0.0% 24,924.4 (5.0%) $ 48.74 $ 101.24 116.5% 0.8624 $ 101.75Transportation 912.8 24.51 1.86 (20.0%) 730.3 0.0% 24.51 1.49 101.3% 0.8624 1.30 DME/Prosthetics/Orthotics 1,118.6 66.46 6.20 (30.0%) 783.1 0.0% 66.46 4.34 101.3% 0.8624 3.79 Home Health/Hospice 200.8 73.96 1.24 0.0% 200.8 0.0% 73.96 1.24 101.3% 0.8624 1.08 Other Ancillary 20.5 26.09 0.04 (10.0%) 18.5 0.0% 26.09 0.04 101.3% 0.8624 0.04
Subtotal 27,177.2 $ 51.18 $ 115.92 (1.9%) 26,657.0 (4.7%) $ 48.78 $ 108.35 115.5% 0.8624 $ 107.95
PhysicianSurgery 765.1 202.47 $ 12.91 (20.0%) 612.1 0.0% $ 202.47 $ 10.33 102.6% 0.8624 $ 9.14Anesthesia 181.2 171.07 2.58 (20.0%) 145.0 0.0% 171.07 2.07 102.6% 0.8624 1.83 Hospital Inpatient Visits 748.9 37.45 2.34 (20.0%) 599.1 0.0% 37.45 1.87 102.6% 0.8624 1.66 Office Visits/Consults 3,369.2 47.60 13.36 (10.0%) 3,032.3 0.0% 47.60 12.03 102.6% 0.8624 10.65 Well Baby Exams/Physical Exams 116.4 80.83 0.78 40.0% 163.0 0.0% 80.83 1.10 102.6% 0.8624 0.97 Emergency Room Visits 695.3 45.14 2.62 (20.0%) 556.2 0.0% 45.14 2.09 102.6% 0.8624 1.85 Clinic Visit/Services 3,526.5 35.16 10.33 (10.0%) 3,173.8 0.0% 35.16 9.30 102.6% 0.8624 8.23 Radiology and Pathology 13,212.8 12.28 13.52 (20.0%) 10,570.3 0.0% 12.28 10.82 102.6% 0.8624 9.58 Outpatient Behavioral Health 149.5 37.88 0.47 (30.0%) 104.6 0.0% 37.88 0.33 102.6% 0.8624 0.29 Maternity 0.9 36.67 0.00 0.0% 0.9 0.0% 36.67 0.00 102.6% 0.8624 0.00 Chiropractor - - - (40.0%) 0.0 0.0% 0.00 0.00 102.6% 0.8624 - Podiatrist 74.0 41.62 0.26 0.0% 74.0 0.0% 41.62 0.26 102.6% 0.8624 0.23 Vision - EyeCare & Eyewear - - - (10.0%) 0.0 0.0% 0.00 0.00 102.6% 0.8624 - Other Professional 9,400.7 14.84 11.63 10.0% 10,340.8 0.0% 14.84 12.79 102.6% 0.8624 11.32 DMHDD / DASA 430.5 60.40 2.17 (30.0%) 301.3 0.0% 60.40 1.52 102.6% 0.8624 1.34 PCCM Fee 2.00
Subtotal 32,670.9 $ 26.80 $ 72.97 (9.2%) 29,673.3 (2.7%) $ 26.08 $ 64.49 0.8624 $ 59.09
Total Claims/Benefit Cost 62,230.8 $ 61.06 $ 316.67 (6.3%) 58,331.6 (6.3%) $ 57.22 $ 278.14 0.8624 $ 259.46Copay Adjustment (1.46) Administration 39.41
Capitation Rate $ 297.40
ATTACHMENT 4 Milliman, Inc.Page 9 of 66

3/26/20132:40 PM
State of IllinoisDepartment of Healthcare and Family Services
VMC Rate Development: Apr to Dec 2013Region: 1
Population: CompositeSFY11 Member Months: 2,247,062 June 2012 HMO Member Months: 659
Annual Cost Managed Care Annual Managed CostUtilization Per Utilization Utilization Care Cost Per Selection Proposed
Type of Service Per 1,000 Service PMPM Adjustment Per 1,000 Adjustment Service PMPM Trend Adjustment Cap Rate
Inpatient HospitalMedical/Surgical 169.6 $ 1,812.46 $ 25.62 (20.0%) 135.7 5.4% $ 1,909.96 $ 21.60 103.0% 0.8845 $ 19.68Well Newborn 0.8 956.98 0.07 (10.0%) 0.8 0.6% 963.03 0.06 108.1% 0.9000 0.06 Other Newborn 259.3 1,720.30 37.17 (10.0%) 233.4 1.6% 1,748.06 33.99 108.1% 0.9002 33.07 Maternity Non-Delivery 17.7 628.67 0.93 (10.0%) 16.0 1.8% 639.84 0.85 101.7% 0.8584 0.74 Psychiatric/Substance Abuse 76.2 574.32 3.64 (30.0%) 53.3 23.2% 707.29 3.14 102.9% 0.7963 2.57 Long Term Care 5.0 122.47 0.05 (20.0%) 4.0 4.1% 127.45 0.04 100.0% 0.8558 0.04 Other Inpatient 0.4 6,165.05 0.21 (20.0%) 0.3 6.7% 6,579.27 0.18 102.8% 0.8438 0.15
Subtotal 529.1 $ 1,535.27 $ 67.69 (16.2%) 443.4 5.5% $ 1,620.05 $ 59.87 105.9% 0.8886 $ 56.31
Outpatient HospitalGeneral Outpatient 349.2 $ 338.77 $ 9.86 (10.0%) 314.3 (11.3%) $ 300.61 $ 7.87 102.4% 0.8605 $ 6.94Emergency Room 922.4 112.25 8.63 (20.0%) 737.9 9.2% 122.61 7.54 102.1% 0.8683 6.69 End-Stage Renal Disease 2.6 684.18 0.15 0.0% 2.6 (0.1%) 683.63 0.15 102.6% 0.8545 0.13
Subtotal 1,274.2 $ 175.49 $ 18.63 (17.2%) 1,054.8 0.9% $ 177.02 $ 15.56 102.3% 0.8643 $ 13.75
AncillariesPrescription Drugs 8,500.7 $ 51.46 $ 36.45 0.0% 8,500.7 (5.0%) $ 48.88 $ 34.63 116.5% 0.8427 $ 34.01Transportation 268.0 41.36 0.92 (20.0%) 214.4 0.0% 41.37 0.74 101.8% 0.8613 0.65 DME/Prosthetics/Orthotics 294.2 91.39 2.24 (30.0%) 205.9 2.2% 93.43 1.60 102.0% 0.8711 1.42 Home Health/Hospice 48.0 100.36 0.40 0.0% 48.0 (0.0%) 100.36 0.40 102.2% 0.8679 0.36 Other Ancillary 31.5 27.13 0.07 (10.0%) 28.3 0.1% 27.15 0.06 102.5% 0.8906 0.06
Subtotal 9,142.4 $ 52.62 $ 40.09 (1.6%) 8,997.4 (5.1%) $ 49.93 $ 37.44 115.4% 0.8444 $ 36.49
PhysicianSurgery 330.1 155.33 $ 4.27 (20.0%) 264.1 (2.7%) $ 151.17 $ 3.33 103.3% 0.8645 $ 2.97Anesthesia 106.8 192.95 1.72 (20.0%) 85.4 (0.1%) 192.84 1.37 103.4% 0.8642 1.23 Hospital Inpatient Visits 617.7 74.40 3.83 (20.0%) 494.2 6.8% 79.42 3.27 103.0% 0.8987 3.03 Office Visits/Consults 2,499.0 45.68 9.51 (10.0%) 2,249.1 (12.0%) 40.21 7.54 104.0% 0.8701 6.82 Well Baby Exams/Physical Exams 2,413.7 28.82 5.80 40.0% 3,379.2 0.4% 28.94 8.15 104.3% 0.9175 7.80 Emergency Room Visits 803.7 38.49 2.58 (20.0%) 643.0 1.3% 39.00 2.09 103.8% 0.8731 1.89 Clinic Visit/Services 3,539.3 30.56 9.01 (10.0%) 3,185.4 2.0% 31.18 8.28 103.9% 0.8751 7.52 Radiology and Pathology 8,253.6 11.44 7.87 (20.0%) 6,602.9 (6.6%) 10.68 5.88 103.3% 0.8631 5.24 Outpatient Behavioral Health 83.8 42.82 0.30 (30.0%) 58.7 (2.8%) 41.62 0.20 103.6% 0.8246 0.17 Maternity 34.5 46.26 0.13 0.0% 34.5 (0.0%) 46.25 0.13 103.0% 0.8585 0.12 Chiropractor 68.4 10.20 0.06 (40.0%) 41.0 (0.0%) 10.20 0.03 104.8% 0.8283 0.03 Podiatrist 18.4 43.06 0.07 0.0% 18.4 0.0% 43.06 0.07 103.9% 0.8196 0.06 Vision - EyeCare & Eyewear - - - 0.0% 0.0 0.0% 0.00 0.00 103.9% - Other Professional 9,344.7 8.72 6.79 10.0% 10,279.2 5.6% 9.20 7.88 103.7% 0.8711 7.12 DMHDD / DASA 352.6 81.68 2.40 (30.0%) 246.8 (14.0%) 70.28 1.45 103.8% 0.8070 1.21 PCCM Fee 2.00
Subtotal 28,466.4 $ 22.90 $ 54.33 (3.1%) 27,581.9 (5.7%) $ 21.61 $ 49.66 103.7% 0.9162 $ 47.20
Total Claims/Benefit Cost 39,412.1 $ 55.03 $ 180.74 (3.4%) 38,077.5 (6.9%) $ 51.22 $ 162.53 107.1% 0.8836 $ 153.76Copay Adjustment (0.48) Administration 23.41
Capitation Rate $ 176.69
ATTACHMENT 4 Milliman, Inc.Page 10 of 66

3/26/20132:40 PM
State of IllinoisDepartment of Healthcare and Family Services
VMC Rate Development: Apr to Dec 2013Region: 2
Population: 0 thru 90 DaysSFY11 Member Months: 32,232 June 2012 HMO Member Months: 13
Annual Cost Managed Care Annual Managed CostUtilization Per Utilization Utilization Care Cost Per Selection Proposed
Type of Service Per 1,000 Service PMPM Adjustment Per 1,000 Adjustment Service PMPM Trend Adjustment Cap Rate
Inpatient HospitalMedical/Surgical 881.9 $ 1,814.70 $ 133.37 (20.0%) 705.5 6.3% $ 1,928.17 $ 113.37 108.1% 0.9000 $ 110.26Well Newborn 24.7 849.12 1.75 (10.0%) 22.2 0.6% 854.49 1.58 108.1% 0.9000 1.54 Other Newborn 7,088.8 1,508.76 891.27 (10.0%) 6,379.9 1.6% 1,533.11 815.09 108.1% 0.9000 792.77 Maternity Non-Delivery - - - (10.0%) 0.0 1.8% 0.00 0.00 108.1% 0.9000 - Psychiatric/Substance Abuse 0.4 714.97 0.02 (30.0%) 0.2 23.7% 884.68 0.02 108.1% 0.9000 0.02 Long Term Care - - - (20.0%) 0.0 6.7% 0.00 0.00 100.0% 0.9000 - Other Inpatient - - - (20.0%) 0.0 6.7% 0.00 0.00 108.1% 0.9000 -
Subtotal 7,995.7 $ 1,540.43 $ 1,026.41 (11.1%) 7,107.9 1.9% $ 1,570.19 $ 930.06 108.1% 0.9000 $ 904.59
Outpatient HospitalGeneral Outpatient 374.9 $ 258.35 $ 8.07 (10.0%) 337.4 (12.9%) $ 225.02 $ 6.33 101.3% 0.9000 $ 5.77Emergency Room 1,240.8 104.32 10.79 (20.0%) 992.7 9.7% 114.44 9.47 101.3% 0.9000 8.63 End-Stage Renal Disease - - - 0.0% 0.0 0.0% 0.00 0.00 101.3% 0.9000 -
Subtotal 1,615.7 $ 140.06 $ 18.86 (17.7%) 1,330.1 1.7% $ 142.49 $ 15.79 101.3% 0.9000 $ 14.40
AncillariesPrescription Drugs 3,313.3 $ 46.11 $ 12.73 0.0% 3,313.3 (5.0%) $ 43.80 $ 12.09 116.5% 0.9000 $ 12.68Transportation 509.8 119.13 5.06 (20.0%) 407.9 0.0% 119.15 4.05 102.6% 0.9000 3.74 DME/Prosthetics/Orthotics 396.3 86.18 2.85 (30.0%) 277.4 2.5% 88.36 2.04 102.6% 0.9000 1.89 Home Health/Hospice 209.3 59.92 1.05 0.0% 209.3 0.0% 59.92 1.05 102.6% 0.9000 0.97 Other Ancillary 110.9 41.76 0.39 (10.0%) 99.8 0.1% 41.78 0.35 102.6% 0.9000 0.32
Subtotal 4,539.7 $ 58.34 $ 22.07 (5.1%) 4,307.7 (6.5%) $ 54.54 $ 19.58 111.2% 0.9000 $ 19.60
PhysicianSurgery 1,440.9 112.81 $ 13.55 (20.0%) 1,152.7 (3.1%) $ 109.35 $ 10.50 102.6% 0.9000 $ 9.70Anesthesia 90.6 265.89 2.01 (20.0%) 72.5 (0.1%) 265.72 1.61 102.6% 0.9000 1.48 Hospital Inpatient Visits 8,901.0 97.32 72.19 (20.0%) 7,120.8 6.9% 104.07 61.75 102.6% 0.9000 57.05 Office Visits/Consults 3,797.2 45.55 14.41 (10.0%) 3,417.4 (12.7%) 39.75 11.32 102.6% 0.9000 10.46 Well Baby Exams/Physical Exams 17,134.8 30.04 42.89 40.0% 23,988.7 0.4% 30.17 60.30 102.6% 0.9000 55.71 Emergency Room Visits 1,198.2 38.80 3.87 (20.0%) 958.5 1.4% 39.35 3.14 102.6% 0.9000 2.90 Clinic Visit/Services 4,591.6 83.81 32.07 (10.0%) 4,132.5 2.1% 85.59 29.47 102.6% 0.9000 27.23 Radiology and Pathology 18,976.5 6.05 9.57 (20.0%) 15,181.2 (7.1%) 5.62 7.11 102.6% 0.9000 6.57 Outpatient Behavioral Health 2.1 54.97 0.01 (30.0%) 1.4 (3.0%) 53.32 0.01 102.6% 0.9000 0.01 Maternity 3.8 49.43 0.02 0.0% 3.8 0.0% 49.43 0.02 102.6% 0.9000 0.01 Chiropractor 18.1 10.32 0.02 (40.0%) 10.8 (0.0%) 10.32 0.01 102.6% 0.9000 0.01 Podiatrist 8.0 63.37 0.04 0.0% 8.0 0.0% 63.37 0.04 102.6% 0.9000 0.04 Vision - EyeCare & Eyewear - - - (10.0%) 0.0 0.0% 0.00 0.00 102.6% 0.9000 - Other Professional 4,303.3 19.78 7.09 10.0% 4,733.6 6.1% 20.98 8.28 102.6% 0.9000 7.64 DMHDD / DASA 0.1 67.09 0.00 (30.0%) 0.1 (14.5%) 57.35 0.00 102.6% 0.9000 0.00 PCCM Fee 2.00
Subtotal 60,466.0 $ 39.24 $ 197.73 0.5% 60,782.1 (2.6%) $ 38.21 $ 193.56 102.6% 0.9000 $ 180.81
Total Claims/Benefit Cost 74,617.1 $ 203.45 $ 1,265.07 (1.5%) 73,527.7 (7.0%) $ 189.15 $ 1,158.99 107.1% 0.9000 $ 1,119.40Copay Adjustment - Administration 170.97
Capitation Rate $ 1,290.37
ATTACHMENT 4 Milliman, Inc.Page 11 of 66

3/26/20132:40 PM
State of IllinoisDepartment of Healthcare and Family Services
VMC Rate Development: Apr to Dec 2013Region: 2
Population: 91 Days thru 1 yearSFY11 Member Months: 141,434 June 2012 HMO Member Months: 45
Annual Cost Managed Care Annual Managed CostUtilization Per Utilization Utilization Care Cost Per Selection Proposed
Type of Service Per 1,000 Service PMPM Adjustment Per 1,000 Adjustment Service PMPM Trend Adjustment Cap Rate
Inpatient HospitalMedical/Surgical 234.3 $ 1,782.81 $ 34.80 (20.0%) 187.4 6.3% $ 1,894.29 $ 29.58 102.6% 1.0000 $ 30.37Well Newborn - - - (10.0%) 0.0 0.6% 0.00 0.00 102.6% 1.0000 - Other Newborn 24.6 1,959.88 4.02 (10.0%) 22.2 1.6% 1,991.51 3.68 102.6% 1.0000 3.78 Maternity Non-Delivery - - - (10.0%) 0.0 1.8% 0.00 0.00 102.6% 1.0000 - Psychiatric/Substance Abuse 0.2 226.46 0.00 (30.0%) 0.1 23.7% 280.22 0.00 102.6% 1.0000 0.00 Long Term Care - - - (20.0%) 0.0 6.7% 0.00 0.00 100.0% 1.0000 - Other Inpatient - - - (20.0%) 0.0 6.7% 0.00 0.00 102.6% 1.0000 -
Subtotal 259.1 $ 1,798.44 $ 38.83 (19.1%) 209.7 5.8% $ 1,903.49 $ 33.27 102.6% 1.0000 $ 34.15
Outpatient HospitalGeneral Outpatient 204.1 $ 332.72 $ 5.66 (10.0%) 183.7 (12.9%) $ 289.80 $ 4.44 101.3% 1.0000 $ 4.49Emergency Room 1,424.7 92.30 10.96 (20.0%) 1,139.7 9.7% 101.25 9.62 101.3% 1.0000 9.74 End-Stage Renal Disease - - - 0.0% 0.0 0.0% 0.00 0.00 101.3% 1.0000 -
Subtotal 1,628.8 $ 122.42 $ 16.62 (18.7%) 1,323.4 4.1% $ 127.42 $ 14.05 101.3% 1.0000 $ 14.24
AncillariesPrescription Drugs 6,217.0 $ 40.74 $ 21.11 0.0% 6,217.0 (5.0%) $ 38.70 $ 20.05 116.5% 1.0000 $ 23.37Transportation 264.0 46.92 1.03 (20.0%) 211.2 0.0% 46.93 0.83 102.6% 1.0000 0.85 DME/Prosthetics/Orthotics 398.7 93.97 3.12 (30.0%) 279.1 2.5% 96.35 2.24 102.6% 1.0000 2.30 Home Health/Hospice 76.7 124.11 0.79 0.0% 76.7 0.0% 124.11 0.79 102.6% 1.0000 0.81 Other Ancillary 88.5 23.13 0.17 (10.0%) 79.6 0.1% 23.14 0.15 102.6% 1.0000 0.16
Subtotal 7,044.9 $ 44.67 $ 26.23 (2.6%) 6,863.7 (5.8%) $ 42.07 $ 24.07 114.2% 1.0000 $ 27.49
PhysicianSurgery 197.6 162.61 $ 2.68 (20.0%) 158.1 (3.1%) $ 157.62 $ 2.08 105.3% 1.0000 $ 2.19Anesthesia 101.9 146.53 1.24 (20.0%) 81.5 (0.1%) 146.44 0.99 105.3% 1.0000 1.05 Hospital Inpatient Visits 398.6 80.96 2.69 (20.0%) 318.8 6.9% 86.57 2.30 105.3% 1.0000 2.42 Office Visits/Consults 3,390.8 43.49 12.29 (10.0%) 3,051.7 (12.7%) 37.95 9.65 105.3% 1.0000 10.17 Well Baby Exams/Physical Exams 8,280.6 22.03 15.20 40.0% 11,592.8 0.4% 22.12 21.37 105.3% 1.0000 22.51 Emergency Room Visits 1,359.8 34.76 3.94 (20.0%) 1,087.8 1.4% 35.25 3.20 105.3% 1.0000 3.37 Clinic Visit/Services 4,299.2 51.17 18.33 (10.0%) 3,869.3 2.1% 52.26 16.85 105.3% 1.0000 17.75 Radiology and Pathology 4,645.5 9.74 3.77 (20.0%) 3,716.4 (7.1%) 9.04 2.80 105.3% 1.0000 2.95 Outpatient Behavioral Health 0.8 61.23 0.00 (30.0%) 0.6 (3.0%) 59.39 0.00 105.3% 1.0000 0.00 Maternity 5.0 50.13 0.02 0.0% 5.0 0.0% 50.13 0.02 105.3% 1.0000 0.02 Chiropractor 20.7 10.30 0.02 (40.0%) 12.4 (0.0%) 10.30 0.01 105.3% 1.0000 0.01 Podiatrist 2.8 72.28 0.02 0.0% 2.8 0.0% 72.28 0.02 105.3% 1.0000 0.02 Vision - EyeCare & Eyewear - - - (10.0%) 0.0 0.0% 0.00 0.00 105.3% 1.0000 - Other Professional 11,051.8 10.29 9.48 10.0% 12,157.0 6.1% 10.91 11.06 105.3% 1.0000 11.65 DMHDD / DASA - - - (30.0%) 0.0 (14.5%) 0.00 0.00 105.3% 1.0000 - PCCM Fee 2.00
Subtotal 33,754.8 $ 24.77 $ 69.68 6.8% 36,054.1 (5.5%) $ 23.41 $ 70.35 105.3% 1.0000 $ 76.10
Total Claims/Benefit Cost 42,687.6 $ 42.55 $ 151.36 4.1% 44,450.9 (10.1%) $ 38.26 $ 141.73 105.8% 1.0000 $ 151.97Copay Adjustment - Administration 23.21
Capitation Rate $ 175.18
ATTACHMENT 4 Milliman, Inc.Page 12 of 66

3/26/20132:40 PM
State of IllinoisDepartment of Healthcare and Family Services
VMC Rate Development: Apr to Dec 2013Region: 2
Population: 2 yrs thru 5 yrsSFY11 Member Months: 284,773 June 2012 HMO Member Months: 60
Annual Cost Managed Care Annual Managed CostUtilization Per Utilization Utilization Care Cost Per Selection Proposed
Type of Service Per 1,000 Service PMPM Adjustment Per 1,000 Adjustment Service PMPM Trend Adjustment Cap Rate
Inpatient HospitalMedical/Surgical 73.6 $ 1,817.33 $ 11.15 (20.0%) 58.9 6.3% $ 1,930.97 $ 9.48 102.6% 0.8873 $ 8.63Well Newborn - - - (10.0%) 0.0 0.6% 0.00 0.00 102.6% 0.8873 - Other Newborn 0.3 2,508.86 0.05 (10.0%) 0.2 1.6% 2,549.36 0.05 102.6% 0.8873 0.04 Maternity Non-Delivery - - - (10.0%) 0.0 1.8% 0.00 0.00 102.6% 0.8873 - Psychiatric/Substance Abuse 8.1 756.87 0.51 (30.0%) 5.7 23.7% 936.53 0.44 102.6% 0.8873 0.40 Long Term Care - - - (20.0%) 0.0 6.7% 0.00 0.00 100.0% 0.8873 - Other Inpatient 1.3 5,702.83 0.60 (20.0%) 1.0 6.7% 6,085.99 0.51 102.6% 0.8873 0.46
Subtotal 83.2 $ 1,775.07 $ 12.31 (20.9%) 65.8 7.7% $ 1,911.05 $ 10.47 102.6% 0.8873 $ 9.54
Outpatient HospitalGeneral Outpatient 151.1 $ 345.60 $ 4.35 (10.0%) 136.0 (12.9%) $ 301.02 $ 3.41 101.3% 0.8873 $ 3.07Emergency Room 810.8 98.59 6.66 (20.0%) 648.6 9.7% 108.15 5.85 101.3% 0.8873 5.26 End-Stage Renal Disease - - - 0.0% 0.0 0.0% 0.00 0.00 101.3% 0.8873 -
Subtotal 961.9 $ 137.39 $ 11.01 (18.4%) 784.6 3.1% $ 141.58 $ 9.26 101.3% 0.8873 $ 8.32
AncillariesPrescription Drugs 4,408.7 $ 40.19 $ 14.77 0.0% 4,408.7 (5.0%) $ 38.18 $ 14.03 116.5% 0.8873 $ 14.50Transportation 148.7 43.68 0.54 (20.0%) 119.0 0.0% 43.69 0.43 102.6% 0.8873 0.39 DME/Prosthetics/Orthotics 297.5 123.26 3.06 (30.0%) 208.2 2.5% 126.38 2.19 102.6% 0.8873 2.00 Home Health/Hospice 11.8 214.12 0.21 0.0% 11.8 0.0% 214.12 0.21 102.6% 0.8873 0.19 Other Ancillary 84.5 21.43 0.15 (10.0%) 76.1 0.1% 21.44 0.14 102.6% 0.8873 0.12
Subtotal 4,951.1 $ 45.38 $ 18.72 (2.6%) 4,823.7 (6.8%) $ 42.29 $ 17.00 114.1% 0.8873 $ 17.21
PhysicianSurgery 189.3 127.00 $ 2.00 (20.0%) 151.4 (3.1%) $ 123.10 $ 1.55 105.3% 0.8873 $ 1.45Anesthesia 85.1 155.63 1.10 (20.0%) 68.1 (0.1%) 155.53 0.88 105.3% 0.8873 0.82 Hospital Inpatient Visits 111.8 39.70 0.37 (20.0%) 89.4 6.9% 42.45 0.32 105.3% 0.8873 0.30 Office Visits/Consults 2,066.9 43.22 7.44 (10.0%) 1,860.2 (12.7%) 37.72 5.85 105.3% 0.8873 5.46 Well Baby Exams/Physical Exams 1,855.9 28.00 4.33 40.0% 2,598.3 0.4% 28.12 6.09 105.3% 0.8873 5.69 Emergency Room Visits 753.6 33.86 2.13 (20.0%) 602.9 1.4% 34.34 1.73 105.3% 0.8873 1.61 Clinic Visit/Services 3,156.5 38.13 10.03 (10.0%) 2,840.9 2.1% 38.94 9.22 105.3% 0.8873 8.62 Radiology and Pathology 3,045.0 9.42 2.39 (20.0%) 2,436.0 (7.1%) 8.75 1.78 105.3% 0.8873 1.66 Outpatient Behavioral Health 12.8 56.32 0.06 (30.0%) 9.0 (3.0%) 54.63 0.04 105.3% 0.8873 0.04 Maternity 2.9 50.25 0.01 0.0% 2.9 0.0% 50.25 0.01 105.3% 0.8873 0.01 Chiropractor 18.1 10.07 0.02 (40.0%) 10.8 (0.0%) 10.07 0.01 105.3% 0.8873 0.01 Podiatrist 6.0 36.63 0.02 0.0% 6.0 0.0% 36.63 0.02 105.3% 0.8873 0.02 Vision - EyeCare & Eyewear - - - (10.0%) 0.0 0.0% 0.00 0.00 105.3% 0.8873 - Other Professional 10,968.4 9.30 8.50 10.0% 12,065.2 6.1% 9.86 9.92 105.3% 0.8873 9.27 DMHDD / DASA 44.8 72.23 0.27 (30.0%) 31.4 (14.5%) 61.75 0.16 105.3% 0.8873 0.15 PCCM Fee 2.00
Subtotal 22,317.1 $ 20.80 $ 38.67 2.0% 22,772.5 (4.8%) $ 19.79 $ 37.56 105.3% 0.8873 $ 37.11
Total Claims/Benefit Cost 28,313.3 $ 34.21 $ 80.72 0.5% 28,446.6 (8.4%) $ 31.34 $ 74.30 106.5% 0.8873 $ 72.18Copay Adjustment - Administration 11.03
Capitation Rate $ 83.21
ATTACHMENT 4 Milliman, Inc.Page 13 of 66

3/26/20132:40 PM
State of IllinoisDepartment of Healthcare and Family Services
VMC Rate Development: Apr to Dec 2013Region: 2
Population: 6 yrs thru 13 yrsSFY11 Member Months: 531,315 June 2012 HMO Member Months: 52
Annual Cost Managed Care Annual Managed CostUtilization Per Utilization Utilization Care Cost Per Selection Proposed
Type of Service Per 1,000 Service PMPM Adjustment Per 1,000 Adjustment Service PMPM Trend Adjustment Cap Rate
Inpatient HospitalMedical/Surgical 43.1 $ 1,675.87 $ 6.02 (20.0%) 34.5 6.3% $ 1,780.66 $ 5.12 102.6% 0.7595 $ 3.99Well Newborn - - - (10.0%) 0.0 0.6% 0.00 0.00 102.6% 0.7595 - Other Newborn - - - (10.0%) 0.0 1.6% 0.00 0.00 102.6% 0.7595 - Maternity Non-Delivery - - - (10.0%) 0.0 1.8% 0.00 0.00 102.6% 0.7595 - Psychiatric/Substance Abuse 142.1 695.53 8.24 (30.0%) 99.5 23.7% 860.63 7.13 102.6% 0.7595 5.56 Long Term Care - - - (20.0%) 0.0 6.7% 0.00 0.00 100.0% 0.7595 - Other Inpatient 0.3 7,333.26 0.18 (20.0%) 0.2 6.7% 7,825.97 0.16 102.6% 0.7595 0.12
Subtotal 185.5 $ 934.10 $ 14.44 (27.7%) 134.2 18.8% $ 1,109.56 $ 12.41 102.6% 0.7595 $ 9.67
Outpatient HospitalGeneral Outpatient 117.0 $ 357.70 $ 3.49 (10.0%) 105.3 (12.9%) $ 311.56 $ 2.73 101.3% 0.7595 $ 2.10Emergency Room 530.8 106.36 4.70 (20.0%) 424.6 9.7% 116.68 4.13 101.3% 0.7595 3.18 End-Stage Renal Disease 0.2 1,574.18 0.02 0.0% 0.2 0.0% 1,574.18 0.02 101.3% 0.7595 0.02
Subtotal 647.9 $ 152.08 $ 8.21 (18.2%) 530.1 2.4% $ 155.80 $ 6.88 101.3% 0.7595 $ 5.30
AncillariesPrescription Drugs 6,130.2 $ 74.73 $ 38.18 0.0% 6,130.2 (5.0%) $ 70.99 $ 36.27 116.5% 0.7595 $ 32.10Transportation 111.1 47.76 0.44 (20.0%) 88.9 0.0% 47.77 0.35 102.6% 0.7595 0.28 DME/Prosthetics/Orthotics 174.5 106.22 1.54 (30.0%) 122.1 2.5% 108.91 1.11 102.6% 0.7595 0.86 Home Health/Hospice 9.5 174.96 0.14 0.0% 9.5 0.0% 174.96 0.14 102.6% 0.7595 0.11 Other Ancillary 35.0 21.38 0.06 (10.0%) 31.5 0.1% 21.39 0.06 102.6% 0.7595 0.04
Subtotal 6,460.4 $ 74.97 $ 40.36 (1.2%) 6,382.3 (4.9%) $ 71.31 $ 37.92 115.9% 0.7595 $ 33.39
PhysicianSurgery 159.6 124.29 $ 1.65 (20.0%) 127.7 (3.1%) $ 120.47 $ 1.28 105.3% 0.7595 $ 1.03Anesthesia 45.9 164.71 0.63 (20.0%) 36.7 (0.1%) 164.60 0.50 105.3% 0.7595 0.40 Hospital Inpatient Visits 183.4 30.72 0.47 (20.0%) 146.7 6.9% 32.85 0.40 105.3% 0.7595 0.32 Office Visits/Consults 1,468.9 46.70 5.72 (10.0%) 1,322.0 (12.7%) 40.75 4.49 105.3% 0.7595 3.59 Well Baby Exams/Physical Exams 696.7 32.16 1.87 40.0% 975.4 0.4% 32.29 2.62 105.3% 0.7595 2.10 Emergency Room Visits 492.9 34.49 1.42 (20.0%) 394.3 1.4% 34.98 1.15 105.3% 0.7595 0.92 Clinic Visit/Services 2,929.5 36.49 8.91 (10.0%) 2,636.6 2.1% 37.27 8.19 105.3% 0.7595 6.55 Radiology and Pathology 2,265.0 10.59 2.00 (20.0%) 1,812.0 (7.1%) 9.83 1.48 105.3% 0.7595 1.19 Outpatient Behavioral Health 160.1 38.31 0.51 (30.0%) 112.0 (3.0%) 37.16 0.35 105.3% 0.7595 0.28 Maternity 1.0 49.49 0.00 0.0% 1.0 0.0% 49.49 0.00 105.3% 0.7595 0.00 Chiropractor 36.6 10.22 0.03 (40.0%) 22.0 (0.0%) 10.22 0.02 105.3% 0.7595 0.01 Podiatrist 19.8 41.97 0.07 0.0% 19.8 0.0% 41.97 0.07 105.3% 0.7595 0.06 Vision - EyeCare & Eyewear - - - (10.0%) 0.0 0.0% 0.00 0.00 105.3% 0.7595 - Other Professional 9,776.7 3.18 2.59 10.0% 10,754.4 6.1% 3.37 3.02 105.3% 0.7595 2.42 DMHDD / DASA 434.7 72.37 2.62 (30.0%) 304.3 (14.5%) 61.87 1.57 105.3% 0.7595 1.25 PCCM Fee 2.00
Subtotal 18,670.7 $ 18.31 $ 28.49 (0.0%) 18,664.8 (11.7%) $ 16.17 $ 25.15 105.3% 0.7595 $ 22.12
Total Claims/Benefit Cost 25,964.5 $ 42.29 $ 91.50 (1.0%) 25,711.4 (9.1%) $ 38.44 $ 82.37 109.5% 0.7595 $ 70.48Copay Adjustment - Administration 10.77
Capitation Rate $ 81.25
ATTACHMENT 4 Milliman, Inc.Page 14 of 66

3/26/20132:40 PM
State of IllinoisDepartment of Healthcare and Family Services
VMC Rate Development: Apr to Dec 2013Region: 2
Population: 14 yrs thru 20 yrs - MaleSFY11 Member Months: 151,363 June 2012 HMO Member Months: 8
Annual Cost Managed Care Annual Managed CostUtilization Per Utilization Utilization Care Cost Per Selection Proposed
Type of Service Per 1,000 Service PMPM Adjustment Per 1,000 Adjustment Service PMPM Trend Adjustment Cap Rate
Inpatient HospitalMedical/Surgical 82.3 $ 1,765.36 $ 12.10 (20.0%) 65.8 6.3% $ 1,875.75 $ 10.29 104.0% 0.7423 $ 7.94Well Newborn - - - (10.0%) 0.0 0.6% 0.00 0.00 104.0% 0.7423 - Other Newborn - - - (10.0%) 0.0 1.6% 0.00 0.00 104.0% 0.7423 - Maternity Non-Delivery - - - (10.0%) 0.0 1.8% 0.00 0.00 104.0% 0.7423 - Psychiatric/Substance Abuse 280.6 674.10 15.76 (30.0%) 196.4 23.7% 834.11 13.65 104.0% 0.7423 10.54 Long Term Care 3.6 110.73 0.03 (20.0%) 2.8 6.7% 118.17 0.03 100.0% 0.7423 0.02 Other Inpatient - - - (20.0%) 0.0 6.7% 0.00 0.00 104.0% 0.7423 -
Subtotal 366.5 $ 913.60 $ 27.90 (27.7%) 265.1 18.8% $ 1,085.01 $ 23.97 104.0% 0.7423 $ 18.50
Outpatient HospitalGeneral Outpatient 194.5 $ 377.93 $ 6.13 (10.0%) 175.1 (12.9%) $ 329.18 $ 4.80 102.6% 0.7423 $ 3.66Emergency Room 660.8 124.13 6.84 (20.0%) 528.6 9.7% 136.17 6.00 102.6% 0.7423 4.57 End-Stage Renal Disease 0.1 160.85 0.00 0.0% 0.1 0.0% 160.85 0.00 102.6% 0.7423 0.00
Subtotal 855.4 $ 181.86 $ 12.96 (17.7%) 703.8 1.3% $ 184.19 $ 10.80 102.6% 0.7423 $ 8.23
AncillariesPrescription Drugs 6,574.6 $ 88.10 $ 48.27 0.0% 6,574.6 (5.0%) $ 83.70 $ 45.85 116.5% 0.7423 $ 39.66Transportation 193.9 60.50 0.98 (20.0%) 155.1 0.0% 60.51 0.78 101.3% 0.7423 0.59 DME/Prosthetics/Orthotics 145.6 106.25 1.29 (30.0%) 101.9 2.5% 108.94 0.93 101.3% 0.7423 0.70 Home Health/Hospice 48.0 52.20 0.21 0.0% 48.0 0.0% 52.20 0.21 101.3% 0.7423 0.16 Other Ancillary 11.2 26.77 0.03 (10.0%) 10.1 0.1% 26.79 0.02 101.3% 0.7423 0.02
Subtotal 6,973.3 $ 87.37 $ 50.77 (1.2%) 6,889.7 (4.7%) $ 83.24 $ 47.79 115.9% 0.7423 $ 41.12
PhysicianSurgery 210.0 148.03 $ 2.59 (20.0%) 168.0 (3.1%) $ 143.48 $ 2.01 104.0% 0.7423 $ 1.55Anesthesia 49.5 185.38 0.76 (20.0%) 39.6 (0.1%) 185.26 0.61 104.0% 0.7423 0.47 Hospital Inpatient Visits 343.6 29.37 0.84 (20.0%) 274.9 6.9% 31.41 0.72 104.0% 0.7423 0.56 Office Visits/Consults 1,353.4 44.54 5.02 (10.0%) 1,218.1 (12.7%) 38.87 3.95 104.0% 0.7423 3.05 Well Baby Exams/Physical Exams 581.1 35.08 1.70 40.0% 813.5 0.4% 35.23 2.39 104.0% 0.7423 1.84 Emergency Room Visits 606.9 36.60 1.85 (20.0%) 485.5 1.4% 37.12 1.50 104.0% 0.7423 1.16 Clinic Visit/Services 2,863.3 33.99 8.11 (10.0%) 2,577.0 2.1% 34.71 7.45 104.0% 0.7423 5.75 Radiology and Pathology 3,048.7 13.30 3.38 (20.0%) 2,439.0 (7.1%) 12.35 2.51 104.0% 0.7423 1.94 Outpatient Behavioral Health 210.5 39.08 0.69 (30.0%) 147.4 (3.0%) 37.91 0.47 104.0% 0.7423 0.36 Maternity 1.7 43.81 0.01 0.0% 1.7 0.0% 43.81 0.01 104.0% 0.7423 0.00 Chiropractor 69.7 9.93 0.06 (40.0%) 41.8 (0.0%) 9.93 0.03 104.0% 0.7423 0.03 Podiatrist 43.0 47.56 0.17 0.0% 43.0 0.0% 47.56 0.17 104.0% 0.7423 0.13 Vision - EyeCare & Eyewear - - - (10.0%) 0.0 0.0% 0.00 0.00 104.0% 0.7423 - Other Professional 9,424.7 3.58 2.81 10.0% 10,367.1 6.1% 3.80 3.28 104.0% 0.7423 2.53 DMHDD / DASA 1,388.7 120.46 13.94 (30.0%) 972.1 (14.5%) 102.98 8.34 104.0% 0.7423 6.44 PCCM Fee 2.00
Subtotal 20,195.0 $ 24.91 $ 41.93 (3.0%) 19,588.8 (17.8%) $ 20.48 $ 33.44 104.0% 0.7423 $ 27.81
Total Claims/Benefit Cost 28,390.1 $ 56.45 $ 133.56 (3.3%) 27,447.3 (10.2%) $ 50.72 $ 116.00 108.8% 0.7423 $ 95.66Copay Adjustment - Administration 14.61
Capitation Rate $ 110.27
ATTACHMENT 4 Milliman, Inc.Page 15 of 66

3/26/20132:40 PM
State of IllinoisDepartment of Healthcare and Family Services
VMC Rate Development: Apr to Dec 2013Region: 2
Population: 14 yrs thru 20 yrs - FemaleSFY11 Member Months: 170,430 June 2012 HMO Member Months: 12
Annual Cost Managed Care Annual Managed CostUtilization Per Utilization Utilization Care Cost Per Selection Proposed
Type of Service Per 1,000 Service PMPM Adjustment Per 1,000 Adjustment Service PMPM Trend Adjustment Cap Rate
Inpatient HospitalMedical/Surgical 68.1 $ 1,782.76 $ 10.12 (20.0%) 54.5 6.3% $ 1,894.23 $ 8.60 104.0% 0.8353 $ 7.47Well Newborn - - - (10.0%) 0.0 0.6% 0.00 0.00 104.0% 0.8353 - Other Newborn - - - (10.0%) 0.0 1.6% 0.00 0.00 104.0% 0.8353 - Maternity Non-Delivery 33.1 601.32 1.66 (10.0%) 29.8 1.8% 612.02 1.52 104.0% 0.8353 1.32 Psychiatric/Substance Abuse 313.9 664.95 17.39 (30.0%) 219.7 23.7% 822.79 15.06 104.0% 0.8353 13.09 Long Term Care 2.6 103.30 0.02 (20.0%) 2.1 6.7% 110.24 0.02 100.0% 0.8353 0.02 Other Inpatient - - - (20.0%) 0.0 6.7% 0.00 0.00 104.0% 0.8353 -
Subtotal 417.7 $ 838.63 $ 29.19 (26.7%) 306.1 17.8% $ 988.11 $ 25.20 104.0% 0.8353 $ 21.89
Outpatient HospitalGeneral Outpatient 482.1 $ 273.66 $ 10.99 (10.0%) 433.9 (12.9%) $ 238.36 $ 8.62 102.6% 0.8353 $ 7.39Emergency Room 1,105.6 122.38 11.28 (20.0%) 884.5 9.7% 134.25 9.90 102.6% 0.8353 8.49 End-Stage Renal Disease - - - 0.0% 0.0 0.0% 0.00 0.00 102.6% 0.8353 -
Subtotal 1,587.8 $ 168.32 $ 22.27 (17.0%) 1,318.4 0.1% $ 168.51 $ 18.51 102.6% 0.8353 $ 15.88
AncillariesPrescription Drugs 9,170.7 $ 51.09 $ 39.04 0.0% 9,170.7 (5.0%) $ 48.54 $ 37.09 116.5% 0.8353 $ 36.11Transportation 320.8 54.13 1.45 (20.0%) 256.6 0.0% 54.14 1.16 101.3% 0.8353 0.98 DME/Prosthetics/Orthotics 141.2 91.49 1.08 (30.0%) 98.9 2.5% 93.80 0.77 101.3% 0.8353 0.65 Home Health/Hospice 45.6 41.12 0.16 0.0% 45.6 0.0% 41.12 0.16 101.3% 0.8353 0.13 Other Ancillary 13.1 22.55 0.02 (10.0%) 11.8 0.1% 22.56 0.02 101.3% 0.8353 0.02
Subtotal 9,691.5 $ 51.69 $ 41.75 (1.1%) 9,583.6 (5.0%) $ 49.09 $ 39.20 115.7% 0.8353 $ 37.89
PhysicianSurgery 210.4 146.26 $ 2.56 (20.0%) 168.3 (3.1%) $ 141.77 $ 1.99 104.0% 0.8353 $ 1.73Anesthesia 127.8 228.18 2.43 (20.0%) 102.2 (0.1%) 228.03 1.94 104.0% 0.8353 1.69 Hospital Inpatient Visits 430.3 30.74 1.10 (20.0%) 344.2 6.9% 32.87 0.94 104.0% 0.8353 0.82 Office Visits/Consults 2,132.5 43.12 7.66 (10.0%) 1,919.3 (12.7%) 37.63 6.02 104.0% 0.8353 5.23 Well Baby Exams/Physical Exams 656.6 35.91 1.97 40.0% 919.2 0.4% 36.06 2.76 104.0% 0.8353 2.40 Emergency Room Visits 1,052.8 38.37 3.37 (20.0%) 842.2 1.4% 38.91 2.73 104.0% 0.8353 2.37 Clinic Visit/Services 3,678.7 43.84 13.44 (10.0%) 3,310.9 2.1% 44.77 12.35 104.0% 0.8353 10.73 Radiology and Pathology 10,222.1 12.65 10.78 (20.0%) 8,177.7 (7.1%) 11.75 8.00 104.0% 0.8353 6.95 Outpatient Behavioral Health 194.9 44.82 0.73 (30.0%) 136.4 (3.0%) 43.48 0.49 104.0% 0.8353 0.43 Maternity 52.2 53.23 0.23 0.0% 52.2 0.0% 53.23 0.23 104.0% 0.8353 0.20 Chiropractor 107.1 10.10 0.09 (40.0%) 64.2 (0.0%) 10.10 0.05 104.0% 0.8353 0.05 Podiatrist 39.4 48.00 0.16 0.0% 39.4 0.0% 48.00 0.16 104.0% 0.8353 0.14 Vision - EyeCare & Eyewear - - - (10.0%) 0.0 0.0% 0.00 0.00 104.0% 0.8353 - Other Professional 10,824.3 10.15 9.16 10.0% 11,906.7 6.1% 10.76 10.68 104.0% 0.8353 9.28 DMHDD / DASA 856.6 97.11 6.93 (30.0%) 599.6 (14.5%) 83.01 4.15 104.0% 0.8353 3.60 PCCM Fee 2.00
Subtotal 30,585.5 $ 23.78 $ 60.60 (6.5%) 28,582.6 (7.3%) $ 22.05 $ 52.51 104.0% 0.8353 $ 47.61
Total Claims/Benefit Cost 42,282.5 $ 43.65 $ 153.81 (5.9%) 39,790.7 (6.4%) $ 40.84 $ 135.43 107.2% 0.8353 $ 123.27Copay Adjustment - Administration 18.83
Capitation Rate $ 142.10
ATTACHMENT 4 Milliman, Inc.Page 16 of 66

3/26/20132:40 PM
State of IllinoisDepartment of Healthcare and Family Services
VMC Rate Development: Apr to Dec 2013Region: 2
Population: 21 yrs thru 44 yrs - MaleSFY11 Member Months: 125,887 June 2012 HMO Member Months: 24
Annual Cost Managed Care Annual Managed CostUtilization Per Utilization Utilization Care Cost Per Selection Proposed
Type of Service Per 1,000 Service PMPM Adjustment Per 1,000 Adjustment Service PMPM Trend Adjustment Cap Rate
Inpatient HospitalMedical/Surgical 218.5 $ 2,446.72 $ 44.56 (20.0%) 174.8 6.3% $ 2,599.71 $ 37.87 101.3% 0.8624 $ 33.09Well Newborn - - - (10.0%) 0.0 0.6% 0.00 0.00 101.3% 0.8624 - Other Newborn - - - (10.0%) 0.0 1.6% 0.00 0.00 101.3% 0.8624 - Maternity Non-Delivery 0.4 395.65 0.01 (10.0%) 0.4 1.8% 402.69 0.01 101.3% 0.8624 0.01 Psychiatric/Substance Abuse 64.4 366.77 1.97 (30.0%) 45.1 23.7% 453.83 1.71 101.3% 0.8624 1.49 Long Term Care 8.4 111.11 0.08 (20.0%) 6.7 6.7% 118.58 0.07 100.0% 0.8624 0.06 Other Inpatient 0.9 3,700.34 0.26 (20.0%) 0.7 6.7% 3,948.96 0.23 101.3% 0.8624 0.20
Subtotal 292.6 $ 1,922.49 $ 46.88 (22.2%) 227.7 9.3% $ 2,101.91 $ 39.88 101.3% 0.8624 $ 34.85
Outpatient HospitalGeneral Outpatient 503.6 $ 396.60 $ 16.64 (10.0%) 453.2 (12.9%) $ 345.44 $ 13.05 102.6% 0.8624 $ 11.55Emergency Room 1,103.4 134.25 12.34 (20.0%) 882.7 9.7% 147.27 10.83 102.6% 0.8624 9.59 End-Stage Renal Disease 6.5 816.16 0.45 0.0% 6.5 0.0% 816.16 0.45 102.6% 0.8624 0.39
Subtotal 1,613.5 $ 218.90 $ 29.43 (16.8%) 1,342.5 (0.7%) $ 217.44 $ 24.33 102.6% 0.8624 $ 21.53
AncillariesPrescription Drugs 11,504.2 $ 47.96 $ 45.98 0.0% 11,504.2 (5.0%) $ 45.56 $ 43.68 116.5% 0.8624 $ 43.90Transportation 209.9 71.63 1.25 (20.0%) 167.9 0.0% 71.64 1.00 101.3% 0.8624 0.88 DME/Prosthetics/Orthotics 534.7 76.15 3.39 (30.0%) 374.3 2.5% 78.08 2.44 101.3% 0.8624 2.13 Home Health/Hospice 52.4 63.51 0.28 0.0% 52.4 0.0% 63.51 0.28 101.3% 0.8624 0.24 Other Ancillary 12.1 24.86 0.03 (10.0%) 10.9 0.1% 24.87 0.02 101.3% 0.8624 0.02
Subtotal 12,313.2 $ 49.64 $ 50.93 (1.7%) 12,109.6 (5.3%) $ 46.99 $ 47.42 115.3% 0.8624 $ 47.16
PhysicianSurgery 403.0 202.08 $ 6.79 (20.0%) 322.4 (3.1%) $ 195.87 $ 5.26 102.6% 0.8624 $ 4.66Anesthesia 98.9 189.81 1.57 (20.0%) 79.2 (0.1%) 189.69 1.25 102.6% 0.8624 1.11 Hospital Inpatient Visits 374.0 40.54 1.26 (20.0%) 299.2 6.9% 43.35 1.08 102.6% 0.8624 0.96 Office Visits/Consults 1,713.6 46.38 6.62 (10.0%) 1,542.2 (12.7%) 40.47 5.20 102.6% 0.8624 4.60 Well Baby Exams/Physical Exams 22.7 86.08 0.16 40.0% 31.7 0.4% 86.44 0.23 102.6% 0.8624 0.20 Emergency Room Visits 1,026.7 39.39 3.37 (20.0%) 821.4 1.4% 39.95 2.73 102.6% 0.8624 2.42 Clinic Visit/Services 2,590.9 37.57 8.11 (10.0%) 2,331.8 2.1% 38.37 7.46 102.6% 0.8624 6.60 Radiology and Pathology 5,915.0 13.54 6.67 (20.0%) 4,732.0 (7.1%) 12.57 4.96 102.6% 0.8624 4.39 Outpatient Behavioral Health 106.9 38.59 0.34 (30.0%) 74.8 (3.0%) 37.43 0.23 102.6% 0.8624 0.21 Maternity 0.6 48.68 0.00 0.0% 0.6 0.0% 48.68 0.00 102.6% 0.8624 0.00 Chiropractor - - - (40.0%) 0.0 (0.0%) 0.00 0.00 102.6% 0.8624 - Podiatrist 9.6 43.00 0.03 0.0% 9.6 0.0% 43.00 0.03 102.6% 0.8624 0.03 Vision - EyeCare & Eyewear - - - (10.0%) 0.0 0.0% 0.00 0.00 102.6% 0.8624 - Other Professional 9,355.8 8.52 6.64 10.0% 10,291.4 6.1% 9.04 7.75 102.6% 0.8624 6.86 DMHDD / DASA 470.3 63.64 2.49 (30.0%) 329.2 (14.5%) 54.40 1.49 102.6% 0.8624 1.32 PCCM Fee 2.00
Subtotal 22,088.1 $ 23.94 $ 44.07 (5.5%) 20,865.6 (9.5%) $ 21.67 $ 37.68 102.6% 0.8624 $ 35.36
Total Claims/Benefit Cost 36,307.5 $ 56.62 $ 171.32 (4.9%) 34,545.4 (8.4%) $ 51.87 $ 149.31 106.3% 0.8624 $ 138.90Copay Adjustment (1.01) Administration 21.06
Capitation Rate $ 158.96
ATTACHMENT 4 Milliman, Inc.Page 17 of 66

3/26/20132:40 PM
State of IllinoisDepartment of Healthcare and Family Services
VMC Rate Development: Apr to Dec 2013Region: 2
Population: 21 yrs thru 44 yrs - FemaleSFY11 Member Months: 406,718 June 2012 HMO Member Months: 74
Annual Cost Managed Care Annual Managed CostUtilization Per Utilization Utilization Care Cost Per Selection Proposed
Type of Service Per 1,000 Service PMPM Adjustment Per 1,000 Adjustment Service PMPM Trend Adjustment Cap Rate
Inpatient HospitalMedical/Surgical 179.7 $ 1,626.93 $ 24.37 (20.0%) 143.8 6.3% $ 1,728.66 $ 20.71 101.3% 0.8624 $ 18.10Well Newborn - - - (10.0%) 0.0 0.6% 0.00 0.00 101.3% 0.8624 - Other Newborn 0.1 9,686.90 0.04 (10.0%) 0.0 1.6% 9,843.26 0.04 101.3% 0.8624 0.03 Maternity Non-Delivery 51.1 661.07 2.82 (10.0%) 46.0 1.8% 672.83 2.58 101.3% 0.8624 2.25 Psychiatric/Substance Abuse 56.8 347.46 1.64 (30.0%) 39.7 23.7% 429.94 1.42 101.3% 0.8624 1.24 Long Term Care 5.8 118.81 0.06 (20.0%) 4.7 6.7% 126.79 0.05 100.0% 0.8624 0.04 Other Inpatient - - - (20.0%) 0.0 6.7% 0.00 0.00 101.3% 0.8624 -
Subtotal 293.5 $ 1,182.68 $ 28.93 (20.2%) 234.2 7.4% $ 1,270.68 $ 24.80 101.3% 0.8624 $ 21.67
Outpatient HospitalGeneral Outpatient 876.8 $ 329.09 $ 24.04 (10.0%) 789.1 (12.9%) $ 286.64 $ 18.85 102.6% 0.8624 $ 16.69Emergency Room 1,547.3 133.18 17.17 (20.0%) 1,237.8 9.7% 146.10 15.07 102.6% 0.8624 13.34 End-Stage Renal Disease 4.1 678.00 0.23 0.0% 4.1 0.0% 678.00 0.23 102.6% 0.8624 0.21
Subtotal 2,428.1 $ 204.85 $ 41.45 (16.4%) 2,031.0 (1.5%) $ 201.78 $ 34.15 102.6% 0.8624 $ 30.23
AncillariesPrescription Drugs 17,147.1 $ 44.34 $ 63.36 0.0% 17,147.1 (5.0%) $ 42.12 $ 60.19 116.5% 0.8624 $ 60.49Transportation 363.3 51.82 1.57 (20.0%) 290.6 0.0% 51.83 1.26 101.3% 0.8624 1.10 DME/Prosthetics/Orthotics 407.8 77.89 2.65 (30.0%) 285.5 2.5% 79.86 1.90 101.3% 0.8624 1.66 Home Health/Hospice 54.6 69.13 0.31 0.0% 54.6 0.0% 69.13 0.31 101.3% 0.8624 0.27 Other Ancillary 12.7 24.25 0.03 (10.0%) 11.4 0.1% 24.26 0.02 101.3% 0.8624 0.02
Subtotal 17,985.4 $ 45.31 $ 67.91 (1.1%) 17,789.2 (5.2%) $ 42.96 $ 63.68 115.7% 0.8624 $ 63.54
PhysicianSurgery 551.6 177.24 $ 8.15 (20.0%) 441.3 (3.1%) $ 171.80 $ 6.32 102.6% 0.8624 $ 5.59Anesthesia 257.8 195.78 4.21 (20.0%) 206.2 (0.1%) 195.65 3.36 102.6% 0.8624 2.98 Hospital Inpatient Visits 390.8 37.80 1.23 (20.0%) 312.6 6.9% 40.42 1.05 102.6% 0.8624 0.93 Office Visits/Consults 2,936.8 44.91 10.99 (10.0%) 2,643.1 (12.7%) 39.19 8.63 102.6% 0.8624 7.64 Well Baby Exams/Physical Exams 252.1 61.76 1.30 40.0% 352.9 0.4% 62.02 1.82 102.6% 0.8624 1.61 Emergency Room Visits 1,482.8 40.29 4.98 (20.0%) 1,186.2 1.4% 40.86 4.04 102.6% 0.8624 3.58 Clinic Visit/Services 4,003.8 44.37 14.80 (10.0%) 3,603.4 2.1% 45.31 13.61 102.6% 0.8624 12.05 Radiology and Pathology 15,648.3 13.75 17.94 (20.0%) 12,518.7 (7.1%) 12.77 13.32 102.6% 0.8624 11.79 Outpatient Behavioral Health 183.0 36.39 0.55 (30.0%) 128.1 (3.0%) 35.30 0.38 102.6% 0.8624 0.33 Maternity 62.2 54.17 0.28 0.0% 62.2 0.0% 54.17 0.28 102.6% 0.8624 0.25 Chiropractor - - - (40.0%) 0.0 (0.0%) 0.00 0.00 102.6% 0.8624 - Podiatrist 11.0 44.47 0.04 0.0% 11.0 0.0% 44.47 0.04 102.6% 0.8624 0.04 Vision - EyeCare & Eyewear - - - (10.0%) 0.0 0.0% 0.00 0.00 102.6% 0.8624 - Other Professional 11,399.7 14.53 13.81 10.0% 12,539.7 6.1% 15.41 16.10 102.6% 0.8624 14.25 DMHDD / DASA 557.2 63.87 2.97 (30.0%) 390.0 (14.5%) 54.60 1.77 102.6% 0.8624 1.57 PCCM Fee 2.00
Subtotal 37,737.1 $ 25.83 $ 81.24 (8.9%) 34,395.5 (4.5%) $ 24.68 $ 70.73 102.6% 0.8624 $ 64.61
Total Claims/Benefit Cost 58,444.1 $ 45.07 $ 219.53 (6.8%) 54,449.9 (5.4%) $ 42.62 $ 193.37 106.8% 0.8624 $ 180.06Copay Adjustment (1.80) Administration 27.23
Capitation Rate $ 205.48
ATTACHMENT 4 Milliman, Inc.Page 18 of 66

3/26/20132:40 PM
State of IllinoisDepartment of Healthcare and Family Services
VMC Rate Development: Apr to Dec 2013Region: 2
Population: 45 + YearsSFY11 Member Months: 90,673 June 2012 HMO Member Months: 17
Annual Cost Managed Care Annual Managed CostUtilization Per Utilization Utilization Care Cost Per Selection Proposed
Type of Service Per 1,000 Service PMPM Adjustment Per 1,000 Adjustment Service PMPM Trend Adjustment Cap Rate
Inpatient HospitalMedical/Surgical 581.7 $ 2,063.52 $ 100.03 (20.0%) 465.4 0.0% $ 2,063.52 $ 80.02 101.3% 0.8624 $ 69.92Well Newborn - - - (10.0%) 0.0 0.0% 0.00 0.00 101.3% 0.8624 - Other Newborn - - - (10.0%) 0.0 0.0% 0.00 0.00 101.3% 0.8624 - Maternity Non-Delivery 0.1 1,374.59 0.01 (10.0%) 0.1 0.0% 1,374.59 0.01 101.3% 0.8624 0.01 Psychiatric/Substance Abuse 43.8 371.67 1.36 (30.0%) 30.7 0.0% 371.67 0.95 101.3% 0.8624 0.83 Long Term Care 91.3 119.75 0.91 (20.0%) 73.0 0.0% 119.75 0.73 100.0% 0.8624 0.63 Other Inpatient 1.2 3,675.59 0.37 (20.0%) 1.0 0.0% 3,675.59 0.30 101.3% 0.8624 0.26
Subtotal 718.1 $ 1,715.84 $ 102.68 (20.6%) 570.1 0.6% $ 1,726.16 $ 82.01 101.3% 0.8624 $ 71.65
Outpatient HospitalGeneral Outpatient 1,079.6 $ 400.82 $ 36.06 (10.0%) 971.7 0.0% $ 400.82 $ 32.46 102.6% 0.8624 $ 28.73Emergency Room 926.0 156.45 12.07 (20.0%) 740.8 0.0% 156.45 9.66 102.6% 0.8624 8.55 End-Stage Renal Disease 22.1 477.41 0.88 0.0% 22.1 0.0% 477.41 0.88 102.6% 0.8624 0.78
Subtotal 2,027.8 $ 290.06 $ 49.01 (14.5%) 1,734.6 2.5% $ 297.44 $ 42.99 102.6% 0.8624 $ 38.06
AncillariesPrescription Drugs 28,409.6 $ 49.02 $ 116.06 0.0% 28,409.6 (5.0%) $ 46.57 $ 110.25 116.5% 0.8624 $ 110.80Transportation 788.8 32.12 2.11 (20.0%) 631.1 0.0% 32.12 1.69 101.3% 0.8624 1.48 DME/Prosthetics/Orthotics 1,710.3 67.66 9.64 (30.0%) 1,197.2 0.0% 67.66 6.75 101.3% 0.8624 5.90 Home Health/Hospice 181.0 76.27 1.15 0.0% 181.0 0.0% 76.27 1.15 101.3% 0.8624 1.01 Other Ancillary 23.6 24.70 0.05 (10.0%) 21.2 0.0% 24.70 0.04 101.3% 0.8624 0.04
Subtotal 31,113.3 $ 49.76 $ 129.01 (2.2%) 30,440.1 (5.0%) $ 47.26 $ 119.88 115.3% 0.8624 $ 119.21
PhysicianSurgery 857.5 212.87 $ 15.21 (20.0%) 686.0 0.0% $ 212.87 $ 12.17 102.6% 0.8624 $ 10.77Anesthesia 232.9 158.75 3.08 (20.0%) 186.3 0.0% 158.75 2.46 102.6% 0.8624 2.18 Hospital Inpatient Visits 863.8 38.83 2.80 (20.0%) 691.0 0.0% 38.83 2.24 102.6% 0.8624 1.98 Office Visits/Consults 3,095.6 47.88 12.35 (10.0%) 2,786.1 0.0% 47.88 11.12 102.6% 0.8624 9.84 Well Baby Exams/Physical Exams 88.8 81.87 0.61 40.0% 124.3 0.0% 81.87 0.85 102.6% 0.8624 0.75 Emergency Room Visits 885.7 43.62 3.22 (20.0%) 708.6 0.0% 43.62 2.58 102.6% 0.8624 2.28 Clinic Visit/Services 3,296.6 49.68 13.65 (10.0%) 2,967.0 0.0% 49.68 12.28 102.6% 0.8624 10.87 Radiology and Pathology 13,431.9 13.01 14.56 (20.0%) 10,745.5 0.0% 13.01 11.65 102.6% 0.8624 10.31 Outpatient Behavioral Health 189.0 32.95 0.52 (30.0%) 132.3 0.0% 32.95 0.36 102.6% 0.8624 0.32 Maternity 0.4 46.69 0.00 0.0% 0.4 0.0% 46.69 0.00 102.6% 0.8624 0.00 Chiropractor - - - (40.0%) 0.0 0.0% 0.00 0.00 102.6% 0.8624 - Podiatrist 66.1 37.45 0.21 0.0% 66.1 0.0% 37.45 0.21 102.6% 0.8624 0.18 Vision - EyeCare & Eyewear - - - (10.0%) 0.0 0.0% 0.00 0.00 102.6% 0.8624 - Other Professional 10,840.8 20.27 18.31 10.0% 11,924.9 0.0% 20.27 20.14 102.6% 0.8624 17.83 DMHDD / DASA 556.9 57.48 2.67 (30.0%) 389.8 0.0% 57.48 1.87 102.6% 0.8624 1.65 PCCM Fee 2.00
Subtotal 34,406.0 $ 30.41 $ 87.18 (8.7%) 31,408.3 (2.1%) $ 29.77 $ 77.92 0.8624 $ 70.98
Total Claims/Benefit Cost 68,265.1 $ 64.67 $ 367.88 (6.0%) 64,153.0 (6.6%) $ 60.38 $ 322.81 0.8624 $ 299.91Copay Adjustment (1.78) Administration 45.54
Capitation Rate $ 343.67
ATTACHMENT 4 Milliman, Inc.Page 19 of 66

3/26/20132:40 PM
State of IllinoisDepartment of Healthcare and Family Services
VMC Rate Development: Apr to Dec 2013Region: 2
Population: CompositeSFY11 Member Months: 1,934,825 June 2012 HMO Member Months: 305
Annual Cost Managed Care Annual Managed CostUtilization Per Utilization Utilization Care Cost Per Selection Proposed
Type of Service Per 1,000 Service PMPM Adjustment Per 1,000 Adjustment Service PMPM Trend Adjustment Cap Rate
Inpatient HospitalMedical/Surgical 192.0 $ 1,858.81 $ 29.75 (20.0%) 153.6 5.1% $ 1,953.25 $ 25.01 103.1% 0.8905 $ 22.95Well Newborn 1.1 849.12 0.07 (10.0%) 0.9 0.6% 854.49 0.07 108.1% 0.9000 0.07 Other Newborn 305.8 1,514.61 38.60 (10.0%) 275.3 1.6% 1,539.06 35.30 108.0% 0.9014 34.36 Maternity Non-Delivery 13.7 655.08 0.75 (10.0%) 12.4 1.8% 666.73 0.69 101.6% 0.8600 0.60 Psychiatric/Substance Abuse 66.9 580.30 3.23 (30.0%) 46.8 23.2% 714.82 2.79 102.9% 0.7970 2.29 Long Term Care 7.4 118.45 0.07 (20.0%) 5.9 2.0% 120.84 0.06 100.0% 0.8606 0.05 Other Inpatient 0.4 5,269.24 0.19 (20.0%) 0.3 6.0% 5,584.86 0.16 102.4% 0.8608 0.14
Subtotal 587.3 $ 1,484.78 $ 72.67 (15.7%) 495.2 4.6% $ 1,552.55 $ 64.07 105.7% 0.8923 $ 60.46
Outpatient HospitalGeneral Outpatient 432.4 $ 343.50 $ 12.38 (10.0%) 389.1 (10.8%) $ 306.38 $ 9.94 102.4% 0.8668 $ 8.82Emergency Room 1,087.7 117.19 10.62 (20.0%) 870.2 9.1% 127.84 9.27 102.1% 0.8771 8.30 End-Stage Renal Disease 2.8 622.47 0.14 0.0% 2.8 0.0% 622.47 0.14 102.6% 0.8600 0.13
Subtotal 1,522.9 $ 182.36 $ 23.14 (17.1%) 1,262.1 0.9% $ 183.97 $ 19.35 102.3% 0.8717 $ 17.25
AncillariesPrescription Drugs 10,153.2 $ 48.85 $ 41.33 0.0% 10,153.2 (5.0%) $ 46.41 $ 39.26 116.5% 0.8541 $ 39.08Transportation 275.2 53.60 1.23 (20.0%) 220.2 0.0% 53.61 0.98 101.9% 0.8783 0.88 DME/Prosthetics/Orthotics 409.7 86.97 2.97 (30.0%) 286.8 2.1% 88.77 2.12 102.0% 0.8797 1.90 Home Health/Hospice 54.7 87.87 0.40 0.0% 54.7 0.0% 87.87 0.40 102.1% 0.9015 0.37 Other Ancillary 46.5 24.36 0.09 (10.0%) 41.9 0.1% 24.38 0.09 102.5% 0.9008 0.08
Subtotal 10,939.3 $ 50.49 $ 46.02 (1.7%) 10,756.7 (5.3%) $ 47.81 $ 42.86 115.3% 0.8562 $ 42.31
PhysicianSurgery 382.1 162.53 $ 5.18 (20.0%) 305.7 (2.6%) $ 158.36 $ 4.03 103.2% 0.8713 $ 3.63Anesthesia 133.1 182.54 2.02 (20.0%) 106.5 (0.1%) 182.43 1.62 103.4% 0.8714 1.46 Hospital Inpatient Visits 689.8 73.86 4.25 (20.0%) 551.8 6.7% 78.79 3.62 103.0% 0.9003 3.36 Office Visits/Consults 2,458.5 44.79 9.18 (10.0%) 2,212.6 (11.8%) 39.51 7.29 103.9% 0.8826 6.68 Well Baby Exams/Physical Exams 2,544.9 26.99 5.72 40.0% 3,562.9 0.4% 27.11 8.05 104.3% 0.9254 7.77 Emergency Room Visits 1,031.2 37.70 3.24 (20.0%) 825.0 1.3% 38.20 2.63 103.8% 0.8819 2.40 Clinic Visit/Services 3,529.3 45.21 13.30 (10.0%) 3,176.4 2.0% 46.11 12.21 104.0% 0.8834 11.21 Radiology and Pathology 7,972.3 12.01 7.98 (20.0%) 6,377.8 (6.4%) 11.23 5.97 103.2% 0.8683 5.35 Outpatient Behavioral Health 106.6 37.97 0.34 (30.0%) 74.6 (2.7%) 36.94 0.23 103.6% 0.8279 0.20 Maternity 18.9 53.66 0.08 0.0% 18.9 0.0% 53.66 0.08 103.0% 0.8644 0.08 Chiropractor 19.7 10.16 0.02 (40.0%) 11.8 (0.0%) 10.15 0.01 104.8% 0.8405 0.01 Podiatrist 15.1 43.30 0.05 0.0% 15.1 (0.0%) 43.30 0.05 103.8% 0.8362 0.05 Vision - EyeCare & Eyewear - - - 0.0% 0.0 0.0% 0.00 0.00 103.8% - Other Professional 10,417.9 10.53 9.14 10.0% 11,459.7 5.4% 11.10 10.60 103.8% 0.8827 9.70 DMHDD / DASA 356.3 74.19 2.20 (30.0%) 249.4 (13.5%) 64.15 1.33 103.6% 0.8189 1.13 PCCM Fee 2.00
Subtotal 29,675.6 $ 25.35 $ 62.70 (2.5%) 28,948.2 (5.6%) $ 23.93 $ 57.72 103.7% 0.9189 $ 55.03
Total Claims/Benefit Cost 42,725.2 $ 57.45 $ 204.53 (3.0%) 41,462.3 (7.3%) $ 53.25 $ 184.00 107.0% 0.8893 $ 175.04Copay Adjustment (0.62) Administration 26.64
Capitation Rate $ 201.07
ATTACHMENT 4 Milliman, Inc.Page 20 of 66

3/26/20132:40 PM
State of IllinoisDepartment of Healthcare and Family Services
VMC Rate Development: Apr to Dec 2013Region: 3
Population: 0 thru 90 DaysSFY11 Member Months: 28,932 June 2012 HMO Member Months: 115
Annual Cost Managed Care Annual Managed CostUtilization Per Utilization Utilization Care Cost Per Selection Proposed
Type of Service Per 1,000 Service PMPM Adjustment Per 1,000 Adjustment Service PMPM Trend Adjustment Cap Rate
Inpatient HospitalMedical/Surgical 822.1 $ 1,766.43 $ 121.02 (20.0%) 657.7 6.3% $ 1,876.88 $ 102.87 108.1% 0.9000 $ 100.05Well Newborn 32.1 753.41 2.01 (10.0%) 28.9 0.6% 758.18 1.82 108.1% 0.9000 1.77 Other Newborn 7,170.1 1,444.29 862.97 (10.0%) 6,453.1 1.6% 1,467.60 789.21 108.1% 0.9000 767.60 Maternity Non-Delivery - - - (10.0%) 0.0 1.8% 0.00 0.00 108.1% 0.9000 - Psychiatric/Substance Abuse 6.3 1,571.50 0.83 (30.0%) 4.4 23.7% 1,944.53 0.71 108.1% 0.9000 0.70 Long Term Care - - - (20.0%) 0.0 6.7% 0.00 0.00 100.0% 0.9000 - Other Inpatient - - - (20.0%) 0.0 6.7% 0.00 0.00 108.1% 0.9000 -
Subtotal 8,030.6 $ 1,474.61 $ 986.83 (11.0%) 7,144.0 1.9% $ 1,502.71 $ 894.62 108.1% 0.9000 $ 870.12
Outpatient HospitalGeneral Outpatient 367.1 $ 235.53 $ 7.21 (10.0%) 330.4 (12.9%) $ 205.15 $ 5.65 101.3% 0.9000 $ 5.15Emergency Room 1,253.8 98.71 10.31 (20.0%) 1,003.0 9.7% 108.29 9.05 101.3% 0.9000 8.25 End-Stage Renal Disease - - - 0.0% 0.0 0.0% 0.00 0.00 101.3% 0.9000 -
Subtotal 1,620.9 $ 129.70 $ 17.52 (17.7%) 1,333.5 2.0% $ 132.29 $ 14.70 101.3% 0.9000 $ 13.40
AncillariesPrescription Drugs 4,032.0 $ 31.47 $ 10.57 0.0% 4,032.0 (5.0%) $ 29.90 $ 10.05 116.5% 0.9000 $ 10.53Transportation 722.0 112.64 6.78 (20.0%) 577.6 0.0% 112.66 5.42 102.6% 0.9000 5.01 DME/Prosthetics/Orthotics 441.1 78.66 2.89 (30.0%) 308.8 2.5% 80.65 2.08 102.6% 0.9000 1.92 Home Health/Hospice 772.8 63.80 4.11 0.0% 772.8 0.0% 63.80 4.11 102.6% 0.9000 3.80 Other Ancillary 99.9 40.46 0.34 (10.0%) 89.9 0.1% 40.48 0.30 102.6% 0.9000 0.28
Subtotal 6,067.8 $ 48.82 $ 24.69 (4.7%) 5,781.0 (6.6%) $ 45.57 $ 21.96 109.0% 0.9000 $ 21.54
PhysicianSurgery 1,318.1 110.06 $ 12.09 (20.0%) 1,054.5 (3.1%) $ 106.68 $ 9.37 102.6% 0.9000 $ 8.66Anesthesia 74.5 269.61 1.67 (20.0%) 59.6 (0.1%) 269.44 1.34 102.6% 0.9000 1.24 Hospital Inpatient Visits 8,107.4 112.45 75.97 (20.0%) 6,485.9 6.9% 120.24 64.99 102.6% 0.9000 60.04 Office Visits/Consults 2,840.3 40.13 9.50 (10.0%) 2,556.2 (12.7%) 35.02 7.46 102.6% 0.9000 6.89 Well Baby Exams/Physical Exams 15,254.7 29.04 36.91 40.0% 21,356.6 0.4% 29.16 51.90 102.6% 0.9000 47.95 Emergency Room Visits 1,106.9 38.77 3.58 (20.0%) 885.5 1.4% 39.32 2.90 102.6% 0.9000 2.68 Clinic Visit/Services 6,111.4 90.68 46.18 (10.0%) 5,500.2 2.1% 92.61 42.45 102.6% 0.9000 39.21 Radiology and Pathology 6,952.9 9.98 5.79 (20.0%) 5,562.4 (7.1%) 9.27 4.30 102.6% 0.9000 3.97 Outpatient Behavioral Health - - - (30.0%) 0.0 (3.0%) 0.00 0.00 102.6% 0.9000 - Maternity 3.9 49.95 0.02 0.0% 3.9 0.0% 49.95 0.02 102.6% 0.9000 0.02 Chiropractor 28.3 10.38 0.02 (40.0%) 17.0 (0.0%) 10.38 0.01 102.6% 0.9000 0.01 Podiatrist 0.4 41.28 0.00 0.0% 0.4 0.0% 41.28 0.00 102.6% 0.9000 0.00 Vision - EyeCare & Eyewear - - - (10.0%) 0.0 0.0% 0.00 0.00 102.6% 0.9000 - Other Professional 3,562.8 20.50 6.09 10.0% 3,919.0 6.1% 21.74 7.10 102.6% 0.9000 6.56 DMHDD / DASA - - - (30.0%) 0.0 (14.5%) 0.00 0.00 102.6% 0.9000 - PCCM Fee 2.00
Subtotal 45,361.6 $ 52.33 $ 197.82 4.5% 47,401.2 (7.2%) $ 48.57 $ 191.84 102.6% 0.9000 $ 179.22
Total Claims/Benefit Cost 61,080.8 $ 241.03 $ 1,226.86 0.9% 61,659.8 (9.3%) $ 218.58 $ 1,123.11 107.1% 0.9000 $ 1,084.28Copay Adjustment - Administration 165.61
Capitation Rate $ 1,249.89
ATTACHMENT 4 Milliman, Inc.Page 21 of 66

3/26/20132:40 PM
State of IllinoisDepartment of Healthcare and Family Services
VMC Rate Development: Apr to Dec 2013Region: 3
Population: 91 Days thru 1 yearSFY11 Member Months: 128,003 June 2012 HMO Member Months: 415
Annual Cost Managed Care Annual Managed CostUtilization Per Utilization Utilization Care Cost Per Selection Proposed
Type of Service Per 1,000 Service PMPM Adjustment Per 1,000 Adjustment Service PMPM Trend Adjustment Cap Rate
Inpatient HospitalMedical/Surgical 232.5 $ 1,759.23 $ 34.09 (20.0%) 186.0 6.3% $ 1,869.23 $ 28.98 102.6% 1.0000 $ 29.74Well Newborn - - - (10.0%) 0.0 0.6% 0.00 0.00 102.6% 1.0000 - Other Newborn 49.5 1,926.94 7.95 (10.0%) 44.6 1.6% 1,958.04 7.27 102.6% 1.0000 7.46 Maternity Non-Delivery - - - (10.0%) 0.0 1.8% 0.00 0.00 102.6% 1.0000 - Psychiatric/Substance Abuse - - - (30.0%) 0.0 23.7% 0.00 0.00 102.6% 1.0000 - Long Term Care - - - (20.0%) 0.0 6.7% 0.00 0.00 100.0% 1.0000 - Other Inpatient 3.3 15,693.09 4.36 (20.0%) 2.7 6.7% 16,747.48 3.72 102.6% 1.0000 3.82
Subtotal 285.4 $ 1,951.06 $ 46.40 (18.3%) 233.3 5.4% $ 2,056.28 $ 39.97 102.6% 1.0000 $ 41.03
Outpatient HospitalGeneral Outpatient 170.8 $ 301.80 $ 4.30 (10.0%) 153.8 (12.9%) $ 262.87 $ 3.37 101.3% 1.0000 $ 3.41Emergency Room 1,368.2 91.97 10.49 (20.0%) 1,094.5 9.7% 100.89 9.20 101.3% 1.0000 9.32 End-Stage Renal Disease - - - 0.0% 0.0 0.0% 0.00 0.00 101.3% 1.0000 -
Subtotal 1,539.0 $ 115.26 $ 14.78 (18.9%) 1,248.3 4.8% $ 120.84 $ 12.57 101.3% 1.0000 $ 12.74
AncillariesPrescription Drugs 6,976.7 $ 32.50 $ 18.89 0.0% 6,976.7 (5.0%) $ 30.88 $ 17.95 116.5% 1.0000 $ 20.92Transportation 369.4 49.79 1.53 (20.0%) 295.5 0.0% 49.80 1.23 102.6% 1.0000 1.26 DME/Prosthetics/Orthotics 341.7 98.20 2.80 (30.0%) 239.2 2.5% 100.68 2.01 102.6% 1.0000 2.06 Home Health/Hospice 87.5 163.20 1.19 0.0% 87.5 0.0% 163.20 1.19 102.6% 1.0000 1.22 Other Ancillary 73.5 20.54 0.13 (10.0%) 66.1 0.1% 20.55 0.11 102.6% 1.0000 0.12
Subtotal 7,848.8 $ 37.52 $ 24.54 (2.3%) 7,665.0 (6.2%) $ 35.20 $ 22.49 113.7% 1.0000 $ 25.57
PhysicianSurgery 169.8 182.79 $ 2.59 (20.0%) 135.9 (3.1%) $ 177.18 $ 2.01 105.3% 1.0000 $ 2.11Anesthesia 88.1 149.61 1.10 (20.0%) 70.5 (0.1%) 149.51 0.88 105.3% 1.0000 0.93 Hospital Inpatient Visits 354.3 79.03 2.33 (20.0%) 283.4 6.9% 84.51 2.00 105.3% 1.0000 2.10 Office Visits/Consults 2,829.3 38.20 9.01 (10.0%) 2,546.4 (12.7%) 33.33 7.07 105.3% 1.0000 7.45 Well Baby Exams/Physical Exams 7,981.7 21.77 14.48 40.0% 11,174.4 0.4% 21.86 20.36 105.3% 1.0000 21.44 Emergency Room Visits 1,221.9 35.11 3.58 (20.0%) 977.6 1.4% 35.61 2.90 105.3% 1.0000 3.06 Clinic Visit/Services 7,409.6 47.24 29.17 (10.0%) 6,668.6 2.1% 48.24 26.81 105.3% 1.0000 28.24 Radiology and Pathology 3,034.4 11.80 2.98 (20.0%) 2,427.5 (7.1%) 10.96 2.22 105.3% 1.0000 2.33 Outpatient Behavioral Health - - - (30.0%) 0.0 (3.0%) 0.00 0.00 105.3% 1.0000 - Maternity 3.8 49.67 0.02 0.0% 3.8 0.0% 49.67 0.02 105.3% 1.0000 0.02 Chiropractor 21.6 10.30 0.02 (40.0%) 13.0 (0.0%) 10.30 0.01 105.3% 1.0000 0.01 Podiatrist 1.3 35.13 0.00 0.0% 1.3 0.0% 35.13 0.00 105.3% 1.0000 0.00 Vision - EyeCare & Eyewear - - - (10.0%) 0.0 0.0% 0.00 0.00 105.3% 1.0000 - Other Professional 9,269.6 15.15 11.70 10.0% 10,196.6 6.1% 16.07 13.65 105.3% 1.0000 14.38 DMHDD / DASA - - - (30.0%) 0.0 (14.5%) 0.00 0.00 105.3% 1.0000 - PCCM Fee 2.00
Subtotal 32,385.5 $ 28.52 $ 76.97 6.5% 34,498.9 (5.0%) $ 27.10 $ 77.92 105.3% 1.0000 $ 84.08
Total Claims/Benefit Cost 42,058.6 $ 46.42 $ 162.69 3.8% 43,645.5 (9.4%) $ 42.05 $ 152.95 105.5% 1.0000 $ 163.42Copay Adjustment - Administration 24.96
Capitation Rate $ 188.38
ATTACHMENT 4 Milliman, Inc.Page 22 of 66

3/26/20132:40 PM
State of IllinoisDepartment of Healthcare and Family Services
VMC Rate Development: Apr to Dec 2013Region: 3
Population: 2 yrs thru 5 yrsSFY11 Member Months: 252,413 June 2012 HMO Member Months: 1,430
Annual Cost Managed Care Annual Managed CostUtilization Per Utilization Utilization Care Cost Per Selection Proposed
Type of Service Per 1,000 Service PMPM Adjustment Per 1,000 Adjustment Service PMPM Trend Adjustment Cap Rate
Inpatient HospitalMedical/Surgical 73.2 $ 1,565.22 $ 9.54 (20.0%) 58.5 6.3% $ 1,663.09 $ 8.11 102.6% 0.8873 $ 7.39Well Newborn - - - (10.0%) 0.0 0.6% 0.00 0.00 102.6% 0.8873 - Other Newborn - - - (10.0%) 0.0 1.6% 0.00 0.00 102.6% 0.8873 - Maternity Non-Delivery - - - (10.0%) 0.0 1.8% 0.00 0.00 102.6% 0.8873 - Psychiatric/Substance Abuse 3.5 795.49 0.23 (30.0%) 2.5 23.7% 984.32 0.20 102.6% 0.8873 0.18 Long Term Care - - - (20.0%) 0.0 6.7% 0.00 0.00 100.0% 0.8873 - Other Inpatient - - - (20.0%) 0.0 6.7% 0.00 0.00 102.6% 0.8873 -
Subtotal 76.7 $ 1,530.00 $ 9.77 (20.5%) 61.0 6.9% $ 1,635.76 $ 8.31 102.6% 0.8873 $ 7.57
Outpatient HospitalGeneral Outpatient 118.9 $ 362.89 $ 3.59 (10.0%) 107.0 (12.9%) $ 316.08 $ 2.82 101.3% 0.8873 $ 2.53Emergency Room 802.3 99.69 6.66 (20.0%) 641.8 9.7% 109.36 5.85 101.3% 0.8873 5.26 End-Stage Renal Disease - - - 0.0% 0.0 0.0% 0.00 0.00 101.3% 0.8873 -
Subtotal 921.1 $ 133.66 $ 10.26 (18.7%) 748.8 3.9% $ 138.90 $ 8.67 101.3% 0.8873 $ 7.79
AncillariesPrescription Drugs 4,947.7 $ 38.69 $ 15.95 0.0% 4,947.7 (5.0%) $ 36.76 $ 15.15 116.5% 0.8873 $ 15.67Transportation 181.5 49.46 0.75 (20.0%) 145.2 0.0% 49.47 0.60 102.6% 0.8873 0.55 DME/Prosthetics/Orthotics 270.7 112.74 2.54 (30.0%) 189.5 2.5% 115.59 1.83 102.6% 0.8873 1.66 Home Health/Hospice 19.0 618.96 0.98 0.0% 19.0 0.0% 618.96 0.98 102.6% 0.8873 0.89 Other Ancillary 67.5 19.98 0.11 (10.0%) 60.7 0.1% 19.99 0.10 102.6% 0.8873 0.09
Subtotal 5,486.4 $ 44.48 $ 20.34 (2.3%) 5,362.1 (6.1%) $ 41.76 $ 18.66 113.9% 0.8873 $ 18.86
PhysicianSurgery 138.9 130.77 $ 1.51 (20.0%) 111.1 (3.1%) $ 126.75 $ 1.17 105.3% 0.8873 $ 1.10Anesthesia 67.8 148.29 0.84 (20.0%) 54.2 (0.1%) 148.19 0.67 105.3% 0.8873 0.63 Hospital Inpatient Visits 90.7 40.54 0.31 (20.0%) 72.6 6.9% 43.35 0.26 105.3% 0.8873 0.24 Office Visits/Consults 1,776.6 39.88 5.90 (10.0%) 1,598.9 (12.7%) 34.80 4.64 105.3% 0.8873 4.33 Well Baby Exams/Physical Exams 1,855.4 25.59 3.96 40.0% 2,597.6 0.4% 25.70 5.56 105.3% 0.8873 5.20 Emergency Room Visits 706.3 34.39 2.02 (20.0%) 565.0 1.4% 34.88 1.64 105.3% 0.8873 1.53 Clinic Visit/Services 5,807.5 32.96 15.95 (10.0%) 5,226.8 2.1% 33.66 14.66 105.3% 0.8873 13.70 Radiology and Pathology 2,330.2 11.10 2.16 (20.0%) 1,864.1 (7.1%) 10.31 1.60 105.3% 0.8873 1.50 Outpatient Behavioral Health 9.5 50.08 0.04 (30.0%) 6.6 (3.0%) 48.58 0.03 105.3% 0.8873 0.03 Maternity 2.1 51.00 0.01 0.0% 2.1 0.0% 51.00 0.01 105.3% 0.8873 0.01 Chiropractor 34.3 10.23 0.03 (40.0%) 20.6 (0.0%) 10.23 0.02 105.3% 0.8873 0.02 Podiatrist 1.9 35.86 0.01 0.0% 1.9 0.0% 35.86 0.01 105.3% 0.8873 0.01 Vision - EyeCare & Eyewear - - - (10.0%) 0.0 0.0% 0.00 0.00 105.3% 0.8873 - Other Professional 9,310.2 14.24 11.05 10.0% 10,241.2 6.1% 15.10 12.89 105.3% 0.8873 12.05 DMHDD / DASA 34.6 77.66 0.22 (30.0%) 24.2 (14.5%) 66.39 0.13 105.3% 0.8873 0.13 PCCM Fee 2.00
Subtotal 22,165.9 $ 23.82 $ 44.00 1.0% 22,387.0 (2.6%) $ 23.21 $ 43.29 105.3% 0.8873 $ 42.46
Total Claims/Benefit Cost 28,650.0 $ 35.34 $ 84.37 (0.3%) 28,558.8 (6.2%) $ 33.17 $ 78.93 106.6% 0.8873 $ 76.69Copay Adjustment - Administration 11.71
Capitation Rate $ 88.40
ATTACHMENT 4 Milliman, Inc.Page 23 of 66

3/26/20132:40 PM
State of IllinoisDepartment of Healthcare and Family Services
VMC Rate Development: Apr to Dec 2013Region: 3
Population: 6 yrs thru 13 yrsSFY11 Member Months: 475,100 June 2012 HMO Member Months: 2,977
Annual Cost Managed Care Annual Managed CostUtilization Per Utilization Utilization Care Cost Per Selection Proposed
Type of Service Per 1,000 Service PMPM Adjustment Per 1,000 Adjustment Service PMPM Trend Adjustment Cap Rate
Inpatient HospitalMedical/Surgical 49.6 $ 1,709.83 $ 7.07 (20.0%) 39.7 6.3% $ 1,816.74 $ 6.01 102.6% 0.7595 $ 4.69Well Newborn - - - (10.0%) 0.0 0.6% 0.00 0.00 102.6% 0.7595 - Other Newborn 0.3 780.03 0.02 (10.0%) 0.3 1.6% 792.62 0.02 102.6% 0.7595 0.01 Maternity Non-Delivery 0.1 676.42 0.00 (10.0%) 0.0 1.8% 688.46 0.00 102.6% 0.7595 0.00 Psychiatric/Substance Abuse 87.5 656.56 4.78 (30.0%) 61.2 23.7% 812.41 4.14 102.6% 0.7595 3.23 Long Term Care - - - (20.0%) 0.0 6.7% 0.00 0.00 100.0% 0.7595 - Other Inpatient - - - (20.0%) 0.0 6.7% 0.00 0.00 102.6% 0.7595 -
Subtotal 137.4 $ 1,037.20 $ 11.88 (26.3%) 101.2 16.3% $ 1,206.20 $ 10.18 102.6% 0.7595 $ 7.93
Outpatient HospitalGeneral Outpatient 105.6 $ 353.66 $ 3.11 (10.0%) 95.1 (12.9%) $ 308.04 $ 2.44 101.3% 0.7595 $ 1.88Emergency Room 548.4 108.14 4.94 (20.0%) 438.7 9.7% 118.63 4.34 101.3% 0.7595 3.34 End-Stage Renal Disease 0.7 790.71 0.05 0.0% 0.7 0.0% 790.71 0.05 101.3% 0.7595 0.04
Subtotal 654.7 $ 148.49 $ 8.10 (18.4%) 534.5 3.2% $ 153.21 $ 6.82 101.3% 0.7595 $ 5.25
AncillariesPrescription Drugs 5,962.7 $ 69.28 $ 34.43 0.0% 5,962.7 (5.0%) $ 65.82 $ 32.70 116.5% 0.7595 $ 28.94Transportation 201.8 36.40 0.61 (20.0%) 161.4 0.0% 36.41 0.49 102.6% 0.7595 0.38 DME/Prosthetics/Orthotics 146.3 108.75 1.33 (30.0%) 102.4 2.5% 111.50 0.95 102.6% 0.7595 0.74 Home Health/Hospice 6.9 227.28 0.13 0.0% 6.9 0.0% 227.28 0.13 102.6% 0.7595 0.10 Other Ancillary 29.1 20.54 0.05 (10.0%) 26.2 0.1% 20.55 0.04 102.6% 0.7595 0.04
Subtotal 6,346.8 $ 69.09 $ 36.54 (1.4%) 6,259.7 (4.8%) $ 65.79 $ 34.32 115.9% 0.7595 $ 30.20
PhysicianSurgery 121.3 131.43 $ 1.33 (20.0%) 97.0 (3.1%) $ 127.39 $ 1.03 105.3% 0.7595 $ 0.82Anesthesia 39.5 150.63 0.50 (20.0%) 31.6 (0.1%) 150.53 0.40 105.3% 0.7595 0.32 Hospital Inpatient Visits 119.4 33.76 0.34 (20.0%) 95.5 6.9% 36.10 0.29 105.3% 0.7595 0.23 Office Visits/Consults 1,116.1 44.84 4.17 (10.0%) 1,004.5 (12.7%) 39.13 3.28 105.3% 0.7595 2.62 Well Baby Exams/Physical Exams 540.6 30.86 1.39 40.0% 756.8 0.4% 30.99 1.95 105.3% 0.7595 1.56 Emergency Room Visits 487.9 34.72 1.41 (20.0%) 390.3 1.4% 35.21 1.15 105.3% 0.7595 0.92 Clinic Visit/Services 5,415.8 29.99 13.54 (10.0%) 4,874.3 2.1% 30.63 12.44 105.3% 0.7595 9.95 Radiology and Pathology 1,648.6 12.82 1.76 (20.0%) 1,318.9 (7.1%) 11.90 1.31 105.3% 0.7595 1.05 Outpatient Behavioral Health 100.9 41.62 0.35 (30.0%) 70.6 (3.0%) 40.37 0.24 105.3% 0.7595 0.19 Maternity 1.0 50.06 0.00 0.0% 1.0 0.0% 50.06 0.00 105.3% 0.7595 0.00 Chiropractor 57.5 10.29 0.05 (40.0%) 34.5 (0.0%) 10.29 0.03 105.3% 0.7595 0.02 Podiatrist 10.3 50.21 0.04 0.0% 10.3 0.0% 50.21 0.04 105.3% 0.7595 0.03 Vision - EyeCare & Eyewear - - - (10.0%) 0.0 0.0% 0.00 0.00 105.3% 0.7595 - Other Professional 7,694.4 3.53 2.26 10.0% 8,463.9 6.1% 3.74 2.64 105.3% 0.7595 2.11 DMHDD / DASA 237.7 75.33 1.49 (30.0%) 166.4 (14.5%) 64.40 0.89 105.3% 0.7595 0.71 PCCM Fee 2.00
Subtotal 17,591.0 $ 19.53 $ 28.63 (1.6%) 17,315.6 (8.9%) $ 17.80 $ 25.69 105.3% 0.7595 $ 22.55
Total Claims/Benefit Cost 24,730.0 $ 41.32 $ 85.16 (2.1%) 24,210.9 (7.6%) $ 38.17 $ 77.01 109.3% 0.7595 $ 65.94Copay Adjustment - Administration 10.07
Capitation Rate $ 76.01
ATTACHMENT 4 Milliman, Inc.Page 24 of 66

3/26/20132:40 PM
State of IllinoisDepartment of Healthcare and Family Services
VMC Rate Development: Apr to Dec 2013Region: 3
Population: 14 yrs thru 20 yrs - MaleSFY11 Member Months: 143,105 June 2012 HMO Member Months: 752
Annual Cost Managed Care Annual Managed CostUtilization Per Utilization Utilization Care Cost Per Selection Proposed
Type of Service Per 1,000 Service PMPM Adjustment Per 1,000 Adjustment Service PMPM Trend Adjustment Cap Rate
Inpatient HospitalMedical/Surgical 75.1 $ 2,064.64 $ 12.93 (20.0%) 60.1 6.3% $ 2,193.74 $ 10.99 104.0% 0.7423 $ 8.48Well Newborn - - - (10.0%) 0.0 0.6% 0.00 0.00 104.0% 0.7423 - Other Newborn - - - (10.0%) 0.0 1.6% 0.00 0.00 104.0% 0.7423 - Maternity Non-Delivery - - - (10.0%) 0.0 1.8% 0.00 0.00 104.0% 0.7423 - Psychiatric/Substance Abuse 208.6 655.51 11.40 (30.0%) 146.0 23.7% 811.11 9.87 104.0% 0.7423 7.62 Long Term Care - - - (20.0%) 0.0 6.7% 0.00 0.00 100.0% 0.7423 - Other Inpatient 0.9 6,317.21 0.47 (20.0%) 0.7 6.7% 6,741.65 0.41 104.0% 0.7423 0.31
Subtotal 284.6 $ 1,045.41 $ 24.80 (27.3%) 206.9 18.0% $ 1,233.56 $ 21.26 104.0% 0.7423 $ 16.41
Outpatient HospitalGeneral Outpatient 192.5 $ 415.78 $ 6.67 (10.0%) 173.2 (12.9%) $ 362.14 $ 5.23 102.6% 0.7423 $ 3.98Emergency Room 645.2 124.52 6.70 (20.0%) 516.2 9.7% 136.60 5.88 102.6% 0.7423 4.48 End-Stage Renal Disease 0.1 371.27 0.00 0.0% 0.1 0.0% 371.27 0.00 102.6% 0.7423 0.00
Subtotal 837.8 $ 191.47 $ 13.37 (17.7%) 689.5 1.0% $ 193.30 $ 11.11 102.6% 0.7423 $ 8.46
AncillariesPrescription Drugs 5,986.8 $ 74.86 $ 37.35 0.0% 5,986.8 (5.0%) $ 71.12 $ 35.48 116.5% 0.7423 $ 30.69Transportation 400.8 44.03 1.47 (20.0%) 320.7 0.0% 44.04 1.18 101.3% 0.7423 0.89 DME/Prosthetics/Orthotics 137.9 101.65 1.17 (30.0%) 96.5 2.5% 104.22 0.84 101.3% 0.7423 0.63 Home Health/Hospice 42.4 240.90 0.85 0.0% 42.4 0.0% 240.90 0.85 101.3% 0.7423 0.64 Other Ancillary 9.3 23.73 0.02 (10.0%) 8.4 0.1% 23.74 0.02 101.3% 0.7423 0.01
Subtotal 6,577.3 $ 74.54 $ 40.86 (1.9%) 6,454.8 (4.3%) $ 71.32 $ 38.36 115.4% 0.7423 $ 32.86
PhysicianSurgery 174.6 162.48 $ 2.36 (20.0%) 139.6 (3.1%) $ 157.49 $ 1.83 104.0% 0.7423 $ 1.41Anesthesia 43.3 183.79 0.66 (20.0%) 34.6 (0.1%) 183.67 0.53 104.0% 0.7423 0.41 Hospital Inpatient Visits 242.8 32.78 0.66 (20.0%) 194.2 6.9% 35.05 0.57 104.0% 0.7423 0.44 Office Visits/Consults 924.6 43.38 3.34 (10.0%) 832.1 (12.7%) 37.86 2.63 104.0% 0.7423 2.03 Well Baby Exams/Physical Exams 381.2 34.01 1.08 40.0% 533.6 0.4% 34.15 1.52 104.0% 0.7423 1.17 Emergency Room Visits 577.8 37.19 1.79 (20.0%) 462.2 1.4% 37.71 1.45 104.0% 0.7423 1.12 Clinic Visit/Services 5,477.2 27.55 12.58 (10.0%) 4,929.5 2.1% 28.14 11.56 104.0% 0.7423 8.92 Radiology and Pathology 2,277.5 17.53 3.33 (20.0%) 1,822.0 (7.1%) 16.28 2.47 104.0% 0.7423 1.91 Outpatient Behavioral Health 130.1 42.96 0.47 (30.0%) 91.0 (3.0%) 41.67 0.32 104.0% 0.7423 0.24 Maternity 0.7 52.03 0.00 0.0% 0.7 0.0% 52.03 0.00 104.0% 0.7423 0.00 Chiropractor 133.2 9.99 0.11 (40.0%) 79.9 (0.0%) 9.99 0.07 104.0% 0.7423 0.05 Podiatrist 26.7 45.68 0.10 0.0% 26.7 0.0% 45.68 0.10 104.0% 0.7423 0.08 Vision - EyeCare & Eyewear - - - (10.0%) 0.0 0.0% 0.00 0.00 104.0% 0.7423 - Other Professional 7,159.6 3.48 2.08 10.0% 7,875.5 6.1% 3.69 2.42 104.0% 0.7423 1.87 DMHDD / DASA 987.8 131.81 10.85 (30.0%) 691.4 (14.5%) 112.68 6.49 104.0% 0.7423 5.01 PCCM Fee 2.00
Subtotal 18,536.8 $ 25.51 $ 39.41 (4.4%) 17,713.2 (15.1%) $ 21.65 $ 31.96 104.0% 0.7423 $ 26.67
Total Claims/Benefit Cost 26,236.5 $ 54.17 $ 118.43 (4.5%) 25,064.4 (9.2%) $ 49.17 $ 102.69 108.1% 0.7423 $ 84.40Copay Adjustment - Administration 12.89
Capitation Rate $ 97.29
ATTACHMENT 4 Milliman, Inc.Page 25 of 66

3/26/20132:40 PM
State of IllinoisDepartment of Healthcare and Family Services
VMC Rate Development: Apr to Dec 2013Region: 3
Population: 14 yrs thru 20 yrs - FemaleSFY11 Member Months: 163,863 June 2012 HMO Member Months: 820
Annual Cost Managed Care Annual Managed CostUtilization Per Utilization Utilization Care Cost Per Selection Proposed
Type of Service Per 1,000 Service PMPM Adjustment Per 1,000 Adjustment Service PMPM Trend Adjustment Cap Rate
Inpatient HospitalMedical/Surgical 105.3 $ 1,643.08 $ 14.42 (20.0%) 84.2 6.3% $ 1,745.82 $ 12.25 104.0% 0.8353 $ 10.64Well Newborn - - - (10.0%) 0.0 0.6% 0.00 0.00 104.0% 0.8353 - Other Newborn 0.1 1,290.96 0.01 (10.0%) 0.0 1.6% 1,311.80 0.00 104.0% 0.8353 0.00 Maternity Non-Delivery 36.4 647.82 1.97 (10.0%) 32.8 1.8% 659.35 1.80 104.0% 0.8353 1.56 Psychiatric/Substance Abuse 188.7 622.41 9.79 (30.0%) 132.1 23.7% 770.15 8.48 104.0% 0.8353 7.36 Long Term Care - - - (20.0%) 0.0 6.7% 0.00 0.00 100.0% 0.8353 - Other Inpatient - - - (20.0%) 0.0 6.7% 0.00 0.00 104.0% 0.8353 -
Subtotal 330.4 $ 950.56 $ 26.17 (24.6%) 249.1 14.2% $ 1,085.58 $ 22.53 104.0% 0.8353 $ 19.57
Outpatient HospitalGeneral Outpatient 552.9 $ 258.87 $ 11.93 (10.0%) 497.6 (12.9%) $ 225.48 $ 9.35 102.6% 0.8353 $ 8.02Emergency Room 1,001.7 124.67 10.41 (20.0%) 801.4 9.7% 136.76 9.13 102.6% 0.8353 7.83 End-Stage Renal Disease 0.4 285.45 0.01 0.0% 0.4 0.0% 285.45 0.01 102.6% 0.8353 0.01
Subtotal 1,555.0 $ 172.42 $ 22.34 (16.4%) 1,299.4 (1.0%) $ 170.78 $ 18.49 102.6% 0.8353 $ 15.86
AncillariesPrescription Drugs 9,071.2 $ 49.21 $ 37.20 0.0% 9,071.2 (5.0%) $ 46.75 $ 35.34 116.5% 0.8353 $ 34.40Transportation 489.1 45.99 1.87 (20.0%) 391.3 0.0% 46.00 1.50 101.3% 0.8353 1.27 DME/Prosthetics/Orthotics 125.5 99.17 1.04 (30.0%) 87.8 2.5% 101.68 0.74 101.3% 0.8353 0.63 Home Health/Hospice 17.2 63.83 0.09 0.0% 17.2 0.0% 63.83 0.09 101.3% 0.8353 0.08 Other Ancillary 9.4 23.04 0.02 (10.0%) 8.4 0.1% 23.05 0.02 101.3% 0.8353 0.01
Subtotal 9,712.3 $ 49.69 $ 40.22 (1.4%) 9,575.9 (4.9%) $ 47.23 $ 37.69 115.6% 0.8353 $ 36.39
PhysicianSurgery 175.8 159.10 $ 2.33 (20.0%) 140.7 (3.1%) $ 154.21 $ 1.81 104.0% 0.8353 $ 1.57Anesthesia 133.6 262.82 2.93 (20.0%) 106.9 (0.1%) 262.65 2.34 104.0% 0.8353 2.03 Hospital Inpatient Visits 321.9 35.50 0.95 (20.0%) 257.5 6.9% 37.96 0.81 104.0% 0.8353 0.71 Office Visits/Consults 1,476.4 40.26 4.95 (10.0%) 1,328.8 (12.7%) 35.13 3.89 104.0% 0.8353 3.38 Well Baby Exams/Physical Exams 495.9 34.20 1.41 40.0% 694.3 0.4% 34.34 1.99 104.0% 0.8353 1.73 Emergency Room Visits 936.1 39.13 3.05 (20.0%) 748.9 1.4% 39.68 2.48 104.0% 0.8353 2.15 Clinic Visit/Services 7,261.4 41.84 25.32 (10.0%) 6,535.3 2.1% 42.73 23.27 104.0% 0.8353 20.21 Radiology and Pathology 7,414.1 16.81 10.38 (20.0%) 5,931.2 (7.1%) 15.61 7.72 104.0% 0.8353 6.70 Outpatient Behavioral Health 136.8 49.74 0.57 (30.0%) 95.7 (3.0%) 48.25 0.38 104.0% 0.8353 0.33 Maternity 15.3 49.57 0.06 0.0% 15.3 0.0% 49.57 0.06 104.0% 0.8353 0.05 Chiropractor 181.8 10.12 0.15 (40.0%) 109.1 (0.0%) 10.12 0.09 104.0% 0.8353 0.08 Podiatrist 24.3 49.44 0.10 0.0% 24.3 0.0% 49.44 0.10 104.0% 0.8353 0.09 Vision - EyeCare & Eyewear - - - (10.0%) 0.0 0.0% 0.00 0.00 104.0% 0.8353 - Other Professional 7,742.6 8.35 5.39 10.0% 8,516.9 6.1% 8.86 6.29 104.0% 0.8353 5.46 DMHDD / DASA 593.0 116.03 5.73 (30.0%) 415.1 (14.5%) 99.19 3.43 104.0% 0.8353 2.98 PCCM Fee 2.00
Subtotal 26,909.0 $ 28.24 $ 63.34 (7.4%) 24,919.9 (6.8%) $ 26.32 $ 54.66 104.0% 0.8353 $ 49.48
Total Claims/Benefit Cost 38,506.8 $ 47.39 $ 152.07 (6.4%) 36,044.3 (6.3%) $ 44.40 $ 133.38 107.1% 0.8353 $ 121.30Copay Adjustment - Administration 18.53
Capitation Rate $ 139.83
ATTACHMENT 4 Milliman, Inc.Page 26 of 66

3/26/20132:40 PM
State of IllinoisDepartment of Healthcare and Family Services
VMC Rate Development: Apr to Dec 2013Region: 3
Population: 21 yrs thru 44 yrs - MaleSFY11 Member Months: 118,337 June 2012 HMO Member Months: 432
Annual Cost Managed Care Annual Managed CostUtilization Per Utilization Utilization Care Cost Per Selection Proposed
Type of Service Per 1,000 Service PMPM Adjustment Per 1,000 Adjustment Service PMPM Trend Adjustment Cap Rate
Inpatient HospitalMedical/Surgical 256.0 $ 1,755.61 $ 37.46 (20.0%) 204.8 6.3% $ 1,865.39 $ 31.84 101.3% 0.8624 $ 27.82Well Newborn - - - (10.0%) 0.0 0.6% 0.00 0.00 101.3% 0.8624 - Other Newborn 0.1 1,828.01 0.01 (10.0%) 0.0 1.6% 1,857.52 0.01 101.3% 0.8624 0.01 Maternity Non-Delivery 1.3 454.12 0.05 (10.0%) 1.2 1.8% 462.20 0.05 101.3% 0.8624 0.04 Psychiatric/Substance Abuse 96.1 486.87 3.90 (30.0%) 67.3 23.7% 602.44 3.38 101.3% 0.8624 2.95 Long Term Care 11.5 131.27 0.13 (20.0%) 9.2 6.7% 140.09 0.11 100.0% 0.8624 0.09 Other Inpatient 0.7 85.56 0.00 (20.0%) 0.5 6.7% 91.31 0.00 101.3% 0.8624 0.00
Subtotal 365.7 $ 1,363.34 $ 41.55 (22.6%) 283.1 10.0% $ 1,499.91 $ 35.38 101.3% 0.8624 $ 30.92
Outpatient HospitalGeneral Outpatient 532.8 $ 388.93 $ 17.27 (10.0%) 479.6 (12.9%) $ 338.76 $ 13.54 102.6% 0.8624 $ 11.98Emergency Room 1,050.3 135.30 11.84 (20.0%) 840.3 9.7% 148.42 10.39 102.6% 0.8624 9.20 End-Stage Renal Disease 6.3 949.10 0.50 0.0% 6.3 0.0% 949.10 0.50 102.6% 0.8624 0.44
Subtotal 1,589.5 $ 223.57 $ 29.61 (16.6%) 1,326.2 (1.1%) $ 221.08 $ 24.43 102.6% 0.8624 $ 21.63
AncillariesPrescription Drugs 13,058.8 $ 47.42 $ 51.60 0.0% 13,058.8 (5.0%) $ 45.05 $ 49.02 116.5% 0.8624 $ 49.27Transportation 425.6 52.02 1.84 (20.0%) 340.4 0.0% 52.03 1.48 101.3% 0.8624 1.29 DME/Prosthetics/Orthotics 584.4 83.49 4.07 (30.0%) 409.0 2.5% 85.60 2.92 101.3% 0.8624 2.55 Home Health/Hospice 43.3 64.61 0.23 0.0% 43.3 0.0% 64.61 0.23 101.3% 0.8624 0.20 Other Ancillary 6.9 25.39 0.01 (10.0%) 6.2 0.1% 25.40 0.01 101.3% 0.8624 0.01
Subtotal 14,118.9 $ 49.09 $ 57.76 (1.8%) 13,857.8 (5.3%) $ 46.47 $ 53.66 115.2% 0.8624 $ 53.32
PhysicianSurgery 405.1 197.56 $ 6.67 (20.0%) 324.1 (3.1%) $ 191.49 $ 5.17 102.6% 0.8624 $ 4.58Anesthesia 99.9 182.40 1.52 (20.0%) 79.9 (0.1%) 182.28 1.21 102.6% 0.8624 1.07 Hospital Inpatient Visits 368.1 40.52 1.24 (20.0%) 294.5 6.9% 43.33 1.06 102.6% 0.8624 0.94 Office Visits/Consults 1,216.1 44.90 4.55 (10.0%) 1,094.5 (12.7%) 39.18 3.57 102.6% 0.8624 3.16 Well Baby Exams/Physical Exams 12.4 71.73 0.07 40.0% 17.4 0.4% 72.03 0.10 102.6% 0.8624 0.09 Emergency Room Visits 948.8 40.68 3.22 (20.0%) 759.0 1.4% 41.25 2.61 102.6% 0.8624 2.31 Clinic Visit/Services 5,514.9 33.12 15.22 (10.0%) 4,963.4 2.1% 33.82 13.99 102.6% 0.8624 12.38 Radiology and Pathology 4,619.9 18.92 7.28 (20.0%) 3,695.9 (7.1%) 17.57 5.41 102.6% 0.8624 4.79 Outpatient Behavioral Health 94.7 51.24 0.40 (30.0%) 66.3 (3.0%) 49.70 0.27 102.6% 0.8624 0.24 Maternity 0.3 51.27 0.00 0.0% 0.3 0.0% 51.27 0.00 102.6% 0.8624 0.00 Chiropractor - - - (40.0%) 0.0 (0.0%) 0.00 0.00 102.6% 0.8624 - Podiatrist 7.8 48.26 0.03 0.0% 7.8 0.0% 48.26 0.03 102.6% 0.8624 0.03 Vision - EyeCare & Eyewear - - - (10.0%) 0.0 0.0% 0.00 0.00 102.6% 0.8624 - Other Professional 7,006.1 7.77 4.54 10.0% 7,706.7 6.1% 8.24 5.29 102.6% 0.8624 4.68 DMHDD / DASA 350.5 70.79 2.07 (30.0%) 245.3 (14.5%) 60.51 1.24 102.6% 0.8624 1.10 PCCM Fee 2.00
Subtotal 20,644.6 $ 27.21 $ 46.82 (6.7%) 19,255.1 (8.4%) $ 24.91 $ 39.97 102.6% 0.8624 $ 37.39
Total Claims/Benefit Cost 36,718.7 $ 57.43 $ 175.74 (5.4%) 34,722.2 (7.7%) $ 53.03 $ 153.45 106.7% 0.8624 $ 143.25Copay Adjustment (1.62) Administration 21.63
Capitation Rate $ 163.26
ATTACHMENT 4 Milliman, Inc.Page 27 of 66

3/26/20132:40 PM
State of IllinoisDepartment of Healthcare and Family Services
VMC Rate Development: Apr to Dec 2013Region: 3
Population: 21 yrs thru 44 yrs - FemaleSFY11 Member Months: 386,410 June 2012 HMO Member Months: 2,020
Annual Cost Managed Care Annual Managed CostUtilization Per Utilization Utilization Care Cost Per Selection Proposed
Type of Service Per 1,000 Service PMPM Adjustment Per 1,000 Adjustment Service PMPM Trend Adjustment Cap Rate
Inpatient HospitalMedical/Surgical 219.3 $ 1,481.08 $ 27.07 (20.0%) 175.5 6.3% $ 1,573.69 $ 23.01 101.3% 0.8624 $ 20.11Well Newborn - - - (10.0%) 0.0 0.6% 0.00 0.00 101.3% 0.8624 - Other Newborn - - - (10.0%) 0.0 1.6% 0.00 0.00 101.3% 0.8624 - Maternity Non-Delivery 51.1 733.83 3.12 (10.0%) 46.0 1.8% 746.89 2.86 101.3% 0.8624 2.50 Psychiatric/Substance Abuse 76.1 468.61 2.97 (30.0%) 53.3 23.7% 579.85 2.57 101.3% 0.8624 2.25 Long Term Care 6.7 192.39 0.11 (20.0%) 5.4 6.7% 205.32 0.09 100.0% 0.8624 0.08 Other Inpatient 0.3 3,670.72 0.09 (20.0%) 0.2 6.7% 3,917.35 0.08 101.3% 0.8624 0.07
Subtotal 353.6 $ 1,132.50 $ 33.37 (20.7%) 280.4 8.2% $ 1,224.97 $ 28.62 101.3% 0.8624 $ 25.01
Outpatient HospitalGeneral Outpatient 995.8 $ 303.47 $ 25.18 (10.0%) 896.2 (12.9%) $ 264.32 $ 19.74 102.6% 0.8624 $ 17.48Emergency Room 1,363.0 133.09 15.12 (20.0%) 1,090.4 9.7% 146.00 13.27 102.6% 0.8624 11.74 End-Stage Renal Disease 6.0 722.12 0.36 0.0% 6.0 0.0% 722.12 0.36 102.6% 0.8624 0.32
Subtotal 2,364.8 $ 206.34 $ 40.66 (15.7%) 1,992.6 (2.6%) $ 200.96 $ 33.37 102.6% 0.8624 $ 29.54
AncillariesPrescription Drugs 18,124.6 $ 45.82 $ 69.21 0.0% 18,124.6 (5.0%) $ 43.53 $ 65.75 116.5% 0.8624 $ 66.07Transportation 723.1 39.15 2.36 (20.0%) 578.5 0.0% 39.16 1.89 101.3% 0.8624 1.65 DME/Prosthetics/Orthotics 373.4 81.82 2.55 (30.0%) 261.4 2.5% 83.89 1.83 101.3% 0.8624 1.60 Home Health/Hospice 57.3 63.31 0.30 0.0% 57.3 0.0% 63.31 0.30 101.3% 0.8624 0.26 Other Ancillary 4.8 26.38 0.01 (10.0%) 4.3 0.1% 26.40 0.01 101.3% 0.8624 0.01
Subtotal 19,283.2 $ 46.32 $ 74.43 (1.3%) 19,026.1 (5.0%) $ 44.01 $ 69.77 115.6% 0.8624 $ 69.59
PhysicianSurgery 499.6 185.82 $ 7.74 (20.0%) 399.7 (3.1%) $ 180.11 $ 6.00 102.6% 0.8624 $ 5.31Anesthesia 253.6 217.97 4.61 (20.0%) 202.9 (0.1%) 217.83 3.68 102.6% 0.8624 3.26 Hospital Inpatient Visits 409.5 38.40 1.31 (20.0%) 327.6 6.9% 41.06 1.12 102.6% 0.8624 0.99 Office Visits/Consults 1,898.4 41.96 6.64 (10.0%) 1,708.6 (12.7%) 36.62 5.21 102.6% 0.8624 4.62 Well Baby Exams/Physical Exams 307.4 49.05 1.26 40.0% 430.4 0.4% 49.26 1.77 102.6% 0.8624 1.56 Emergency Room Visits 1,278.1 41.21 4.39 (20.0%) 1,022.5 1.4% 41.79 3.56 102.6% 0.8624 3.15 Clinic Visit/Services 8,553.6 43.44 30.96 (10.0%) 7,698.2 2.1% 44.36 28.46 102.6% 0.8624 25.19 Radiology and Pathology 11,507.6 17.67 16.94 (20.0%) 9,206.1 (7.1%) 16.41 12.59 102.6% 0.8624 11.14 Outpatient Behavioral Health 110.0 49.00 0.45 (30.0%) 77.0 (3.0%) 47.53 0.30 102.6% 0.8624 0.27 Maternity 13.6 48.14 0.05 0.0% 13.6 0.0% 48.14 0.05 102.6% 0.8624 0.05 Chiropractor - - - (40.0%) 0.0 (0.0%) 0.00 0.00 102.6% 0.8624 - Podiatrist 8.6 40.28 0.03 0.0% 8.6 0.0% 40.28 0.03 102.6% 0.8624 0.03 Vision - EyeCare & Eyewear - - - (10.0%) 0.0 0.0% 0.00 0.00 102.6% 0.8624 - Other Professional 7,527.5 15.31 9.60 10.0% 8,280.3 6.1% 16.24 11.20 102.6% 0.8624 9.92 DMHDD / DASA 385.6 71.77 2.31 (30.0%) 269.9 (14.5%) 61.35 1.38 102.6% 0.8624 1.22 PCCM Fee 2.00
Subtotal 32,753.0 $ 31.61 $ 86.28 (9.5%) 29,645.2 (3.5%) $ 30.51 $ 75.36 102.6% 0.8624 $ 68.71
Total Claims/Benefit Cost 54,754.6 $ 51.45 $ 234.74 (7.0%) 50,944.3 (5.2%) $ 48.79 $ 207.12 106.8% 0.8624 $ 192.85Copay Adjustment (3.25) Administration 28.96
Capitation Rate $ 218.56
ATTACHMENT 4 Milliman, Inc.Page 28 of 66

3/26/20132:40 PM
State of IllinoisDepartment of Healthcare and Family Services
VMC Rate Development: Apr to Dec 2013Region: 3
Population: 45 + YearsSFY11 Member Months: 88,153 June 2012 HMO Member Months: 314
Annual Cost Managed Care Annual Managed CostUtilization Per Utilization Utilization Care Cost Per Selection Proposed
Type of Service Per 1,000 Service PMPM Adjustment Per 1,000 Adjustment Service PMPM Trend Adjustment Cap Rate
Inpatient HospitalMedical/Surgical 611.7 $ 1,545.45 $ 78.78 (20.0%) 489.4 0.0% $ 1,545.45 $ 63.03 101.3% 0.8624 $ 55.07Well Newborn - - - (10.0%) 0.0 0.0% 0.00 0.00 101.3% 0.8624 - Other Newborn - - - (10.0%) 0.0 0.0% 0.00 0.00 101.3% 0.8624 - Maternity Non-Delivery - - - (10.0%) 0.0 0.0% 0.00 0.00 101.3% 0.8624 - Psychiatric/Substance Abuse 69.2 438.23 2.53 (30.0%) 48.4 0.0% 438.23 1.77 101.3% 0.8624 1.55 Long Term Care 91.6 120.45 0.92 (20.0%) 73.3 0.0% 120.45 0.74 100.0% 0.8624 0.63 Other Inpatient 6.7 6,688.01 3.71 (20.0%) 5.3 0.0% 6,688.01 2.97 101.3% 0.8624 2.59
Subtotal 779.2 $ 1,323.41 $ 85.94 (20.9%) 616.5 0.8% $ 1,333.35 $ 68.50 101.3% 0.8624 $ 59.84
Outpatient HospitalGeneral Outpatient 1,088.1 $ 368.47 $ 33.41 (10.0%) 979.3 0.0% $ 368.47 $ 30.07 102.6% 0.8624 $ 26.62Emergency Room 857.9 146.48 10.47 (20.0%) 686.3 0.0% 146.48 8.38 102.6% 0.8624 7.42 End-Stage Renal Disease 41.1 532.97 1.82 0.0% 41.1 0.0% 532.97 1.82 102.6% 0.8624 1.61
Subtotal 1,987.1 $ 276.02 $ 45.71 (14.1%) 1,706.7 2.6% $ 283.15 $ 40.27 102.6% 0.8624 $ 35.65
AncillariesPrescription Drugs 29,994.7 $ 49.46 $ 123.62 0.0% 29,994.7 (5.0%) $ 46.99 $ 117.45 116.5% 0.8624 $ 118.03Transportation 1,831.3 25.36 3.87 (20.0%) 1,465.1 0.0% 25.36 3.10 101.3% 0.8624 2.71 DME/Prosthetics/Orthotics 1,547.6 71.93 9.28 (30.0%) 1,083.4 0.0% 71.93 6.49 101.3% 0.8624 5.67 Home Health/Hospice 207.3 77.92 1.35 0.0% 207.3 0.0% 77.92 1.35 101.3% 0.8624 1.18 Other Ancillary 11.1 25.20 0.02 (10.0%) 10.0 0.0% 25.20 0.02 101.3% 0.8624 0.02
Subtotal 33,592.0 $ 49.34 $ 138.13 (2.5%) 32,760.4 (4.7%) $ 47.03 $ 128.40 115.2% 0.8624 $ 127.60
PhysicianSurgery 810.9 206.69 $ 13.97 (20.0%) 648.7 0.0% $ 206.69 $ 11.17 102.6% 0.8624 $ 9.89Anesthesia 196.5 172.02 2.82 (20.0%) 157.2 0.0% 172.02 2.25 102.6% 0.8624 1.99 Hospital Inpatient Visits 804.8 38.63 2.59 (20.0%) 643.8 0.0% 38.63 2.07 102.6% 0.8624 1.83 Office Visits/Consults 2,181.6 45.13 8.20 (10.0%) 1,963.4 0.0% 45.13 7.38 102.6% 0.8624 6.54 Well Baby Exams/Physical Exams 59.4 79.60 0.39 40.0% 83.2 0.0% 79.60 0.55 102.6% 0.8624 0.49 Emergency Room Visits 784.1 44.76 2.92 (20.0%) 627.3 0.0% 44.76 2.34 102.6% 0.8624 2.07 Clinic Visit/Services 6,901.8 42.07 24.20 (10.0%) 6,211.6 0.0% 42.07 21.78 102.6% 0.8624 19.28 Radiology and Pathology 10,157.5 17.44 14.76 (20.0%) 8,126.0 0.0% 17.44 11.81 102.6% 0.8624 10.45 Outpatient Behavioral Health 132.3 43.03 0.47 (30.0%) 92.6 0.0% 43.03 0.33 102.6% 0.8624 0.29 Maternity 0.2 53.00 0.00 0.0% 0.2 0.0% 53.00 0.00 102.6% 0.8624 0.00 Chiropractor - - - (40.0%) 0.0 0.0% 0.00 0.00 102.6% 0.8624 - Podiatrist 47.7 37.81 0.15 0.0% 47.7 0.0% 37.81 0.15 102.6% 0.8624 0.13 Vision - EyeCare & Eyewear - - - (10.0%) 0.0 0.0% 0.00 0.00 102.6% 0.8624 - Other Professional 7,972.6 25.70 17.08 10.0% 8,769.9 0.0% 25.70 18.78 102.6% 0.8624 16.63 DMHDD / DASA 400.7 65.19 2.18 (30.0%) 280.5 0.0% 65.19 1.52 102.6% 0.8624 1.35 PCCM Fee 2.00
Subtotal 30,450.1 $ 35.36 $ 89.73 (9.2%) 27,652.1 (1.6%) $ 34.78 $ 80.15 0.8624 $ 72.95
Total Claims/Benefit Cost 66,808.4 $ 64.57 $ 359.51 (6.1%) 62,735.6 (6.0%) $ 60.70 $ 317.32 0.8624 $ 296.05Copay Adjustment (2.68) Administration 44.81
Capitation Rate $ 338.18
ATTACHMENT 4 Milliman, Inc.Page 29 of 66

3/26/20132:40 PM
State of IllinoisDepartment of Healthcare and Family Services
VMC Rate Development: Apr to Dec 2013Region: 3
Population: CompositeSFY11 Member Months: 1,784,316 June 2012 HMO Member Months: 9,275
Annual Cost Managed Care Annual Managed CostUtilization Per Utilization Utilization Care Cost Per Selection Proposed
Type of Service Per 1,000 Service PMPM Adjustment Per 1,000 Adjustment Service PMPM Trend Adjustment Cap Rate
Inpatient HospitalMedical/Surgical 143.6 $ 1,620.80 $ 19.40 (20.0%) 114.9 5.4% $ 1,708.22 $ 16.35 102.5% 0.8577 $ 14.38Well Newborn 0.4 753.41 0.02 (10.0%) 0.4 0.6% 758.18 0.02 108.1% 0.9000 0.02 Other Newborn 91.2 1,455.31 11.06 (10.0%) 82.1 1.6% 1,478.80 10.12 107.9% 0.9030 9.86 Maternity Non-Delivery 14.4 713.39 0.86 (10.0%) 13.0 1.8% 726.08 0.79 101.9% 0.8567 0.69 Psychiatric/Substance Abuse 85.7 600.21 4.29 (30.0%) 60.0 23.3% 739.84 3.70 102.9% 0.7940 3.02 Long Term Care 5.1 142.20 0.06 (20.0%) 4.1 3.3% 146.83 0.05 100.0% 0.8624 0.04 Other Inpatient 0.5 8,375.18 0.38 (20.0%) 0.4 4.5% 8,751.72 0.32 102.3% 0.9223 0.30
Subtotal 341.0 $ 1,269.33 $ 36.07 (19.4%) 274.8 7.8% $ 1,368.67 $ 31.34 104.3% 0.8661 $ 28.31
Outpatient HospitalGeneral Outpatient 407.4 $ 319.56 $ 10.85 (10.0%) 366.7 (11.6%) $ 282.64 $ 8.64 102.4% 0.8486 $ 7.51Emergency Room 892.1 119.33 8.87 (20.0%) 713.7 9.3% 130.45 7.76 102.2% 0.8445 6.69 End-Stage Renal Disease 3.3 661.38 0.18 0.0% 3.3 0.0% 661.38 0.18 102.5% 0.8537 0.16
Subtotal 1,302.9 $ 183.31 $ 19.90 (16.8%) 1,083.7 0.1% $ 183.55 $ 16.58 102.3% 0.8467 $ 14.36
AncillariesPrescription Drugs 9,897.3 $ 51.49 $ 42.47 0.0% 9,897.3 (5.0%) $ 48.91 $ 40.34 116.5% 0.8293 $ 38.98Transportation 433.3 40.99 1.48 (20.0%) 346.6 0.0% 41.00 1.18 101.7% 0.8465 1.02 DME/Prosthetics/Orthotics 292.7 91.15 2.22 (30.0%) 204.9 2.2% 93.13 1.59 101.9% 0.8492 1.38 Home Health/Hospice 45.1 132.10 0.50 0.0% 45.1 0.0% 132.10 0.50 102.1% 0.8630 0.44 Other Ancillary 27.6 21.72 0.05 (10.0%) 24.9 0.1% 21.74 0.05 102.5% 0.8523 0.04
Subtotal 10,695.9 $ 52.41 $ 46.71 (1.7%) 10,518.7 (5.0%) $ 49.80 $ 43.66 115.4% 0.8307 $ 41.85
PhysicianSurgery 269.1 169.06 $ 3.79 (20.0%) 215.3 (2.7%) $ 164.52 $ 2.95 103.3% 0.8504 $ 2.59Anesthesia 109.9 200.99 1.84 (20.0%) 87.9 (0.1%) 200.87 1.47 103.4% 0.8519 1.30 Hospital Inpatient Visits 350.4 60.63 1.77 (20.0%) 280.3 6.6% 64.62 1.51 103.1% 0.8800 1.37 Office Visits/Consults 1,543.4 42.09 5.41 (10.0%) 1,389.1 (12.1%) 37.01 4.28 104.1% 0.8440 3.76 Well Baby Exams/Physical Exams 1,150.1 27.80 2.66 40.0% 1,610.2 0.4% 27.92 3.75 104.5% 0.8857 3.47 Emergency Room Visits 812.6 38.23 2.59 (20.0%) 650.1 1.4% 38.76 2.10 103.8% 0.8469 1.85 Clinic Visit/Services 6,480.5 37.43 20.21 (10.0%) 5,832.4 2.0% 38.19 18.56 103.9% 0.8441 16.28 Radiology and Pathology 5,015.8 16.32 6.82 (20.0%) 4,012.7 (6.6%) 15.24 5.10 103.3% 0.8497 4.47 Outpatient Behavioral Health 89.3 45.54 0.34 (30.0%) 62.5 (2.9%) 44.24 0.23 103.9% 0.8110 0.19 Maternity 5.2 48.93 0.02 0.0% 5.2 (0.0%) 48.92 0.02 103.4% 0.8540 0.02 Chiropractor 51.9 10.17 0.04 (40.0%) 31.1 (0.0%) 10.17 0.03 104.6% 0.7979 0.02 Podiatrist 11.8 45.48 0.04 0.0% 11.8 0.0% 45.49 0.04 104.0% 0.8039 0.04 Vision - EyeCare & Eyewear - - - 0.0% 0.0 0.0% 0.00 0.00 104.0% - Other Professional 7,864.7 10.00 6.55 10.0% 8,651.2 5.5% 10.55 7.61 104.0% 0.8639 6.84 DMHDD / DASA 328.0 94.10 2.57 (30.0%) 229.6 (14.1%) 80.84 1.55 103.9% 0.7972 1.28 PCCM Fee 2.00
Subtotal 24,082.8 $ 27.24 $ 54.68 (4.2%) 23,069.4 (6.1%) $ 25.59 $ 49.20 103.9% 0.8902 $ 45.48
Total Claims/Benefit Cost 36,422.6 $ 51.85 $ 157.36 (4.1%) 34,946.6 (6.8%) $ 48.34 $ 140.77 107.4% 0.8603 $ 130.01Copay Adjustment (0.87) Administration 19.72
Capitation Rate $ 148.86
ATTACHMENT 4 Milliman, Inc.Page 30 of 66

3/26/20132:40 PM
State of IllinoisDepartment of Healthcare and Family Services
VMC Rate Development: Apr to Dec 2013Region: 4
Population: 0 thru 90 DaysSFY11 Member Months: 145,938 June 2012 HMO Member Months: 3,981
Annual Cost Managed Care Annual Managed CostUtilization Per Utilization Utilization Care Cost Per Selection Proposed
Type of Service Per 1,000 Service PMPM Adjustment Per 1,000 Adjustment Service PMPM Trend Adjustment Cap Rate
Inpatient HospitalMedical/Surgical 990.8 $ 2,112.15 $ 174.39 (20.0%) 792.6 6.3% $ 2,244.22 $ 148.24 108.1% 0.9000 $ 144.18Well Newborn 203.8 2,619.92 44.50 (10.0%) 183.4 0.6% 2,636.50 40.30 108.1% 0.9000 39.20 Other Newborn 8,502.8 1,689.28 1,196.96 (10.0%) 7,652.5 1.6% 1,716.55 1,094.65 108.1% 0.9000 1,064.67 Maternity Non-Delivery - - - (10.0%) 0.0 1.8% 0.00 0.00 108.1% 0.9000 - Psychiatric/Substance Abuse 3.5 1,875.75 0.54 (30.0%) 2.4 23.7% 2,321.00 0.47 108.1% 0.9000 0.46 Long Term Care - - - (20.0%) 0.0 6.7% 0.00 0.00 100.0% 0.9000 - Other Inpatient 1.4 7,482.15 0.87 (20.0%) 1.1 6.7% 7,984.86 0.74 108.1% 0.9000 0.72
Subtotal 9,702.2 $ 1,752.91 $ 1,417.26 (11.0%) 8,632.1 1.9% $ 1,785.53 $ 1,284.41 108.1% 0.9000 $ 1,249.23
Outpatient HospitalGeneral Outpatient 314.2 $ 364.18 $ 9.54 (10.0%) 282.8 (12.9%) $ 317.20 $ 7.48 101.3% 0.9000 $ 6.82Emergency Room 947.0 121.05 9.55 (20.0%) 757.6 9.7% 132.79 8.38 101.3% 0.9000 7.64 End-Stage Renal Disease - - - 0.0% 0.0 0.0% 0.00 0.00 101.3% 0.9000 -
Subtotal 1,261.2 $ 181.63 $ 19.09 (17.5%) 1,040.4 0.7% $ 182.92 $ 15.86 101.3% 0.9000 $ 14.46
AncillariesPrescription Drugs 4,480.8 $ 24.96 $ 9.32 0.0% 4,480.8 (20.0%) $ 19.97 $ 7.46 116.5% 0.9000 $ 7.82Transportation 335.2 59.14 1.65 (20.0%) 268.1 0.0% 59.15 1.32 102.6% 0.9000 1.22 DME/Prosthetics/Orthotics 260.5 78.38 1.70 (30.0%) 182.4 2.5% 80.36 1.22 102.6% 0.9000 1.13 Home Health/Hospice 92.2 102.23 0.79 0.0% 92.2 0.0% 102.23 0.79 102.6% 0.9000 0.73 Other Ancillary 32.1 46.71 0.12 (10.0%) 28.9 0.1% 46.74 0.11 102.6% 0.9000 0.10
Subtotal 5,200.7 $ 31.34 $ 13.58 (2.9%) 5,052.3 (17.4%) $ 25.88 $ 10.90 112.1% 0.9000 $ 11.00
PhysicianSurgery 643.4 151.57 $ 8.13 (20.0%) 514.7 (3.1%) $ 146.92 $ 6.30 102.6% 0.9000 $ 5.82Anesthesia 71.3 291.85 1.73 (20.0%) 57.1 (0.1%) 291.66 1.39 102.6% 0.9000 1.28 Hospital Inpatient Visits 10,325.4 107.25 92.28 (20.0%) 8,260.4 6.9% 114.68 78.94 102.6% 0.9000 72.93 Office Visits/Consults 2,324.3 50.46 9.77 (10.0%) 2,091.8 (12.7%) 44.03 7.68 102.6% 0.9000 7.09 Well Baby Exams/Physical Exams 13,221.5 35.75 39.38 40.0% 18,510.1 0.4% 35.90 55.38 102.6% 0.9000 51.16 Emergency Room Visits 872.8 40.53 2.95 (20.0%) 698.2 1.4% 41.10 2.39 102.6% 0.9000 2.21 Clinic Visit/Services 4,054.1 109.48 36.99 (10.0%) 3,648.6 2.1% 111.81 34.00 102.6% 0.9000 31.41 Radiology and Pathology 24,598.1 5.36 10.98 (20.0%) 19,678.5 (7.1%) 4.98 8.16 102.6% 0.9000 7.54 Outpatient Behavioral Health 3.2 51.84 0.01 (30.0%) 2.2 (3.0%) 50.29 0.01 102.6% 0.9000 0.01 Maternity 6.8 49.96 0.03 0.0% 6.8 0.0% 49.96 0.03 102.6% 0.9000 0.03 Chiropractor - - - (40.0%) 0.0 (0.0%) 0.00 0.00 102.6% 0.9000 - Podiatrist 3.3 48.73 0.01 0.0% 3.3 0.0% 48.73 0.01 102.6% 0.9000 0.01 Vision - EyeCare & Eyewear - - - (10.0%) 0.0 0.0% 0.00 0.00 102.6% 0.9000 - Other Professional 3,206.8 27.25 7.28 10.0% 3,527.4 6.1% 28.90 8.50 102.6% 0.9000 7.85 DMHDD / DASA - - - (30.0%) 0.0 (14.5%) 0.00 0.00 102.6% 0.9000 - PCCM Fee 2.00
Subtotal 59,330.9 $ 42.38 $ 209.55 (3.9%) 56,999.2 0.7% $ 42.69 $ 202.78 102.6% 0.9000 $ 189.33
Total Claims/Benefit Cost 75,495.1 $ 263.78 $ 1,659.49 (5.0%) 71,724.0 (4.0%) $ 253.29 $ 1,513.94 107.3% 0.9000 $ 1,464.02Copay Adjustment - Administration 223.61
Capitation Rate $ 1,687.63
ATTACHMENT 4 Milliman, Inc.Page 31 of 66

3/26/20132:40 PM
State of IllinoisDepartment of Healthcare and Family Services
VMC Rate Development: Apr to Dec 2013Region: 4
Population: 91 Days thru 1 yearSFY11 Member Months: 659,727 June 2012 HMO Member Months: 14,332
Annual Cost Managed Care Annual Managed CostUtilization Per Utilization Utilization Care Cost Per Selection Proposed
Type of Service Per 1,000 Service PMPM Adjustment Per 1,000 Adjustment Service PMPM Trend Adjustment Cap Rate
Inpatient HospitalMedical/Surgical 296.3 $ 2,045.23 $ 50.49 (20.0%) 237.0 6.3% $ 2,173.12 $ 42.92 102.6% 1.0000 $ 44.06Well Newborn - - - (10.0%) 0.0 0.6% 0.00 0.00 102.6% 1.0000 - Other Newborn 63.0 2,242.87 11.77 (10.0%) 56.7 1.6% 2,279.07 10.76 102.6% 1.0000 11.05 Maternity Non-Delivery - - - (10.0%) 0.0 1.8% 0.00 0.00 102.6% 1.0000 - Psychiatric/Substance Abuse 0.1 581.75 0.00 (30.0%) 0.1 23.7% 719.84 0.00 102.6% 1.0000 0.00 Long Term Care - - - (20.0%) 0.0 6.7% 0.00 0.00 100.0% 1.0000 - Other Inpatient 0.7 10,297.42 0.61 (20.0%) 0.6 6.7% 10,989.29 0.52 102.6% 1.0000 0.53
Subtotal 360.0 $ 2,095.59 $ 62.87 (18.3%) 294.3 5.5% $ 2,210.11 $ 54.20 102.6% 1.0000 $ 55.64
Outpatient HospitalGeneral Outpatient 149.6 $ 369.19 $ 4.60 (10.0%) 134.6 (12.9%) $ 321.56 $ 3.61 101.3% 1.0000 $ 3.65Emergency Room 1,077.6 104.10 9.35 (20.0%) 862.1 9.7% 114.20 8.20 101.3% 1.0000 8.31 End-Stage Renal Disease 0.4 704.22 0.02 0.0% 0.4 0.0% 704.22 0.02 101.3% 1.0000 0.02
Subtotal 1,227.6 $ 136.59 $ 13.97 (18.8%) 997.1 4.3% $ 142.43 $ 11.83 101.3% 1.0000 $ 11.99
AncillariesPrescription Drugs 7,148.2 $ 30.72 $ 18.30 0.0% 7,148.2 (20.0%) $ 24.58 $ 14.64 116.5% 1.0000 $ 17.06Transportation 213.3 41.45 0.74 (20.0%) 170.7 0.0% 41.46 0.59 102.6% 1.0000 0.61 DME/Prosthetics/Orthotics 332.9 86.04 2.39 (30.0%) 233.0 2.5% 88.22 1.71 102.6% 1.0000 1.76 Home Health/Hospice 65.9 296.36 1.63 0.0% 65.9 0.0% 296.36 1.63 102.6% 1.0000 1.67 Other Ancillary 36.5 27.35 0.08 (10.0%) 32.9 0.1% 27.37 0.08 102.6% 1.0000 0.08
Subtotal 7,796.8 $ 35.60 $ 23.13 (1.9%) 7,650.7 (17.9%) $ 29.24 $ 18.64 113.5% 1.0000 $ 21.17
PhysicianSurgery 188.5 134.65 $ 2.12 (20.0%) 150.8 (3.1%) $ 130.52 $ 1.64 105.3% 1.0000 $ 1.73Anesthesia 47.8 199.16 0.79 (20.0%) 38.3 (0.1%) 199.03 0.63 105.3% 1.0000 0.67 Hospital Inpatient Visits 503.2 85.51 3.59 (20.0%) 402.6 6.9% 91.44 3.07 105.3% 1.0000 3.23 Office Visits/Consults 2,767.9 47.03 10.85 (10.0%) 2,491.1 (12.7%) 41.04 8.52 105.3% 1.0000 8.97 Well Baby Exams/Physical Exams 7,027.5 27.12 15.88 40.0% 9,838.5 0.4% 27.23 22.33 105.3% 1.0000 23.52 Emergency Room Visits 1,022.8 36.38 3.10 (20.0%) 818.3 1.4% 36.89 2.52 105.3% 1.0000 2.65 Clinic Visit/Services 5,712.3 43.37 20.65 (10.0%) 5,141.1 2.1% 44.29 18.98 105.3% 1.0000 19.99 Radiology and Pathology 5,268.1 7.92 3.48 (20.0%) 4,214.5 (7.1%) 7.35 2.58 105.3% 1.0000 2.72 Outpatient Behavioral Health 1.8 52.16 0.01 (30.0%) 1.2 (3.0%) 50.60 0.01 105.3% 1.0000 0.01 Maternity 8.3 50.11 0.03 0.0% 8.3 0.0% 50.11 0.03 105.3% 1.0000 0.04 Chiropractor 4.2 10.34 0.00 (40.0%) 2.5 (0.0%) 10.34 0.00 105.3% 1.0000 0.00 Podiatrist 7.5 36.33 0.02 0.0% 7.5 0.0% 36.33 0.02 105.3% 1.0000 0.02 Vision - EyeCare & Eyewear - - - (10.0%) 0.0 0.0% 0.00 0.00 105.3% 1.0000 - Other Professional 9,283.3 14.67 11.35 10.0% 10,211.7 6.1% 15.56 13.24 105.3% 1.0000 13.95 DMHDD / DASA 0.0 90.15 0.00 (30.0%) 0.0 (14.5%) 77.06 0.00 105.3% 1.0000 0.00 PCCM Fee 2.00
Subtotal 31,843.3 $ 27.08 $ 71.87 4.7% 33,326.3 (2.2%) $ 26.49 $ 73.57 105.3% 1.0000 $ 79.49
Total Claims/Benefit Cost 41,227.7 $ 50.02 $ 171.85 2.5% 42,268.3 (10.2%) $ 44.93 $ 158.25 105.1% 1.0000 $ 168.29Copay Adjustment - Administration 25.70
Capitation Rate $ 194.00
ATTACHMENT 4 Milliman, Inc.Page 32 of 66
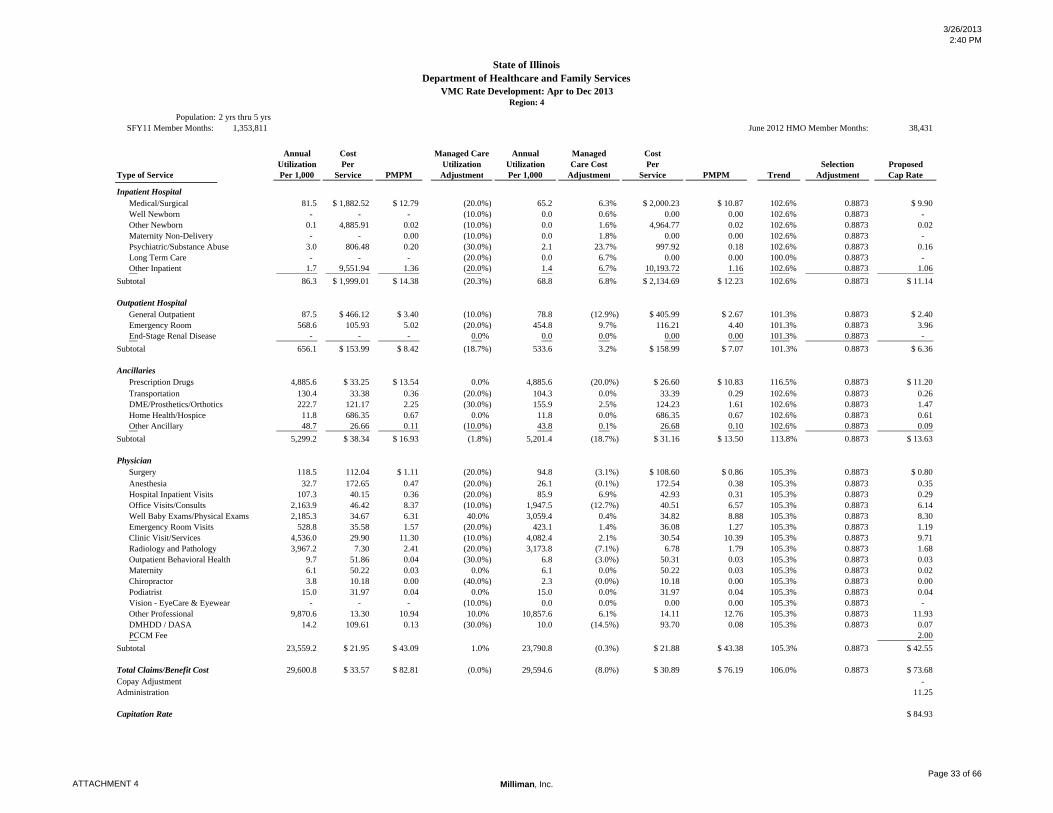
3/26/20132:40 PM
State of IllinoisDepartment of Healthcare and Family Services
VMC Rate Development: Apr to Dec 2013Region: 4
Population: 2 yrs thru 5 yrsSFY11 Member Months: 1,353,811 June 2012 HMO Member Months: 38,431
Annual Cost Managed Care Annual Managed CostUtilization Per Utilization Utilization Care Cost Per Selection Proposed
Type of Service Per 1,000 Service PMPM Adjustment Per 1,000 Adjustment Service PMPM Trend Adjustment Cap Rate
Inpatient HospitalMedical/Surgical 81.5 $ 1,882.52 $ 12.79 (20.0%) 65.2 6.3% $ 2,000.23 $ 10.87 102.6% 0.8873 $ 9.90Well Newborn - - - (10.0%) 0.0 0.6% 0.00 0.00 102.6% 0.8873 - Other Newborn 0.1 4,885.91 0.02 (10.0%) 0.0 1.6% 4,964.77 0.02 102.6% 0.8873 0.02 Maternity Non-Delivery - - 0.00 (10.0%) 0.0 1.8% 0.00 0.00 102.6% 0.8873 - Psychiatric/Substance Abuse 3.0 806.48 0.20 (30.0%) 2.1 23.7% 997.92 0.18 102.6% 0.8873 0.16 Long Term Care - - - (20.0%) 0.0 6.7% 0.00 0.00 100.0% 0.8873 - Other Inpatient 1.7 9,551.94 1.36 (20.0%) 1.4 6.7% 10,193.72 1.16 102.6% 0.8873 1.06
Subtotal 86.3 $ 1,999.01 $ 14.38 (20.3%) 68.8 6.8% $ 2,134.69 $ 12.23 102.6% 0.8873 $ 11.14
Outpatient HospitalGeneral Outpatient 87.5 $ 466.12 $ 3.40 (10.0%) 78.8 (12.9%) $ 405.99 $ 2.67 101.3% 0.8873 $ 2.40Emergency Room 568.6 105.93 5.02 (20.0%) 454.8 9.7% 116.21 4.40 101.3% 0.8873 3.96 End-Stage Renal Disease - - - 0.0% 0.0 0.0% 0.00 0.00 101.3% 0.8873 -
Subtotal 656.1 $ 153.99 $ 8.42 (18.7%) 533.6 3.2% $ 158.99 $ 7.07 101.3% 0.8873 $ 6.36
AncillariesPrescription Drugs 4,885.6 $ 33.25 $ 13.54 0.0% 4,885.6 (20.0%) $ 26.60 $ 10.83 116.5% 0.8873 $ 11.20Transportation 130.4 33.38 0.36 (20.0%) 104.3 0.0% 33.39 0.29 102.6% 0.8873 0.26 DME/Prosthetics/Orthotics 222.7 121.17 2.25 (30.0%) 155.9 2.5% 124.23 1.61 102.6% 0.8873 1.47 Home Health/Hospice 11.8 686.35 0.67 0.0% 11.8 0.0% 686.35 0.67 102.6% 0.8873 0.61 Other Ancillary 48.7 26.66 0.11 (10.0%) 43.8 0.1% 26.68 0.10 102.6% 0.8873 0.09
Subtotal 5,299.2 $ 38.34 $ 16.93 (1.8%) 5,201.4 (18.7%) $ 31.16 $ 13.50 113.8% 0.8873 $ 13.63
PhysicianSurgery 118.5 112.04 $ 1.11 (20.0%) 94.8 (3.1%) $ 108.60 $ 0.86 105.3% 0.8873 $ 0.80Anesthesia 32.7 172.65 0.47 (20.0%) 26.1 (0.1%) 172.54 0.38 105.3% 0.8873 0.35 Hospital Inpatient Visits 107.3 40.15 0.36 (20.0%) 85.9 6.9% 42.93 0.31 105.3% 0.8873 0.29 Office Visits/Consults 2,163.9 46.42 8.37 (10.0%) 1,947.5 (12.7%) 40.51 6.57 105.3% 0.8873 6.14 Well Baby Exams/Physical Exams 2,185.3 34.67 6.31 40.0% 3,059.4 0.4% 34.82 8.88 105.3% 0.8873 8.30 Emergency Room Visits 528.8 35.58 1.57 (20.0%) 423.1 1.4% 36.08 1.27 105.3% 0.8873 1.19 Clinic Visit/Services 4,536.0 29.90 11.30 (10.0%) 4,082.4 2.1% 30.54 10.39 105.3% 0.8873 9.71 Radiology and Pathology 3,967.2 7.30 2.41 (20.0%) 3,173.8 (7.1%) 6.78 1.79 105.3% 0.8873 1.68 Outpatient Behavioral Health 9.7 51.86 0.04 (30.0%) 6.8 (3.0%) 50.31 0.03 105.3% 0.8873 0.03 Maternity 6.1 50.22 0.03 0.0% 6.1 0.0% 50.22 0.03 105.3% 0.8873 0.02 Chiropractor 3.8 10.18 0.00 (40.0%) 2.3 (0.0%) 10.18 0.00 105.3% 0.8873 0.00 Podiatrist 15.0 31.97 0.04 0.0% 15.0 0.0% 31.97 0.04 105.3% 0.8873 0.04 Vision - EyeCare & Eyewear - - - (10.0%) 0.0 0.0% 0.00 0.00 105.3% 0.8873 - Other Professional 9,870.6 13.30 10.94 10.0% 10,857.6 6.1% 14.11 12.76 105.3% 0.8873 11.93 DMHDD / DASA 14.2 109.61 0.13 (30.0%) 10.0 (14.5%) 93.70 0.08 105.3% 0.8873 0.07 PCCM Fee 2.00
Subtotal 23,559.2 $ 21.95 $ 43.09 1.0% 23,790.8 (0.3%) $ 21.88 $ 43.38 105.3% 0.8873 $ 42.55
Total Claims/Benefit Cost 29,600.8 $ 33.57 $ 82.81 (0.0%) 29,594.6 (8.0%) $ 30.89 $ 76.19 106.0% 0.8873 $ 73.68Copay Adjustment - Administration 11.25
Capitation Rate $ 84.93
ATTACHMENT 4 Milliman, Inc.Page 33 of 66

3/26/20132:40 PM
State of IllinoisDepartment of Healthcare and Family Services
VMC Rate Development: Apr to Dec 2013Region: 4
Population: 6 yrs thru 13 yrsSFY11 Member Months: 2,507,789 June 2012 HMO Member Months: 62,368
Annual Cost Managed Care Annual Managed CostUtilization Per Utilization Utilization Care Cost Per Selection Proposed
Type of Service Per 1,000 Service PMPM Adjustment Per 1,000 Adjustment Service PMPM Trend Adjustment Cap Rate
Inpatient HospitalMedical/Surgical 51.0 $ 1,944.36 $ 8.26 (20.0%) 40.8 6.3% $ 2,065.94 $ 7.02 102.6% 0.7595 $ 5.48Well Newborn - - - (10.0%) 0.0 0.6% 0.00 0.00 102.6% 0.7595 - Other Newborn - - 0.00 (10.0%) 0.0 1.6% 0.00 0.00 102.6% 0.7595 - Maternity Non-Delivery - - 0.00 (10.0%) 0.0 1.8% 0.00 0.00 102.6% 0.7595 - Psychiatric/Substance Abuse 57.2 749.44 3.57 (30.0%) 40.0 23.7% 927.34 3.09 102.6% 0.7595 2.41 Long Term Care - - - (20.0%) 0.0 6.7% 0.00 0.00 100.0% 0.7595 - Other Inpatient 0.9 11,421.49 0.82 (20.0%) 0.7 6.7% 12,188.88 0.70 102.6% 0.7595 0.54
Subtotal 109.1 $ 1,392.23 $ 12.65 (25.2%) 81.5 14.3% $ 1,591.83 $ 10.81 102.6% 0.7595 $ 8.43
Outpatient HospitalGeneral Outpatient 76.1 $ 404.41 $ 2.57 (10.0%) 68.5 (12.9%) $ 352.24 $ 2.01 101.3% 0.7595 $ 1.55Emergency Room 330.9 114.94 3.17 (20.0%) 264.8 9.7% 126.09 2.78 101.3% 0.7595 2.14 End-Stage Renal Disease 0.3 1,158.74 0.02 0.0% 0.3 0.0% 1,158.74 0.02 101.3% 0.7595 0.02
Subtotal 407.3 $ 169.68 $ 5.76 (18.1%) 333.5 2.1% $ 173.32 $ 4.82 101.3% 0.7595 $ 3.71
AncillariesPrescription Drugs 3,903.3 $ 51.83 $ 16.86 0.0% 3,903.3 (20.0%) $ 41.46 $ 13.49 116.5% 0.7595 $ 11.94Transportation 523.1 12.20 0.53 (20.0%) 418.5 0.0% 12.20 0.43 102.6% 0.7595 0.33 DME/Prosthetics/Orthotics 133.8 122.98 1.37 (30.0%) 93.7 2.5% 126.09 0.98 102.6% 0.7595 0.77 Home Health/Hospice 6.5 281.94 0.15 0.0% 6.5 0.0% 281.94 0.15 102.6% 0.7595 0.12 Other Ancillary 19.2 25.63 0.04 (10.0%) 17.2 0.1% 25.65 0.04 102.6% 0.7595 0.03
Subtotal 4,585.9 $ 49.60 $ 18.95 (3.2%) 4,439.2 (17.8%) $ 40.78 $ 15.09 115.1% 0.7595 $ 13.18
PhysicianSurgery 83.9 128.36 $ 0.90 (20.0%) 67.1 (3.1%) $ 124.42 $ 0.70 105.3% 0.7595 $ 0.56Anesthesia 22.2 176.79 0.33 (20.0%) 17.7 (0.1%) 176.68 0.26 105.3% 0.7595 0.21 Hospital Inpatient Visits 118.9 37.62 0.37 (20.0%) 95.1 6.9% 40.23 0.32 105.3% 0.7595 0.26 Office Visits/Consults 1,481.1 46.93 5.79 (10.0%) 1,333.0 (12.7%) 40.95 4.55 105.3% 0.7595 3.64 Well Baby Exams/Physical Exams 1,025.8 38.72 3.31 40.0% 1,436.2 0.4% 38.88 4.65 105.3% 0.7595 3.72 Emergency Room Visits 310.3 36.60 0.95 (20.0%) 248.3 1.4% 37.12 0.77 105.3% 0.7595 0.61 Clinic Visit/Services 3,818.5 23.37 7.44 (10.0%) 3,436.7 2.1% 23.87 6.84 105.3% 0.7595 5.47 Radiology and Pathology 2,822.4 8.02 1.89 (20.0%) 2,257.9 (7.1%) 7.45 1.40 105.3% 0.7595 1.12 Outpatient Behavioral Health 81.2 49.96 0.34 (30.0%) 56.9 (3.0%) 48.46 0.23 105.3% 0.7595 0.18 Maternity 4.5 50.33 0.02 0.0% 4.5 0.0% 50.33 0.02 105.3% 0.7595 0.02 Chiropractor 6.6 10.16 0.01 (40.0%) 3.9 (0.0%) 10.16 0.00 105.3% 0.7595 0.00 Podiatrist 33.2 37.58 0.10 0.0% 33.2 0.0% 37.58 0.10 105.3% 0.7595 0.08 Vision - EyeCare & Eyewear - - - (10.0%) 0.0 0.0% 0.00 0.00 105.3% 0.7595 - Other Professional 8,710.0 3.90 2.83 10.0% 9,580.9 6.1% 4.14 3.30 105.3% 0.7595 2.64 DMHDD / DASA 134.2 83.23 0.93 (30.0%) 94.0 (14.5%) 71.15 0.56 105.3% 0.7595 0.45 PCCM Fee 2.00
Subtotal 18,652.9 $ 16.21 $ 25.20 0.1% 18,665.5 (6.0%) $ 15.24 $ 23.70 105.3% 0.7595 $ 20.96
Total Claims/Benefit Cost 23,755.1 $ 31.60 $ 62.56 (1.0%) 23,519.7 (12.1%) $ 27.76 $ 54.42 107.1% 0.7595 $ 46.28Copay Adjustment - Administration 7.07
Capitation Rate $ 53.35
ATTACHMENT 4 Milliman, Inc.Page 34 of 66

3/26/20132:40 PM
State of IllinoisDepartment of Healthcare and Family Services
VMC Rate Development: Apr to Dec 2013Region: 4
Population: 14 yrs thru 20 yrs - MaleSFY11 Member Months: 696,687 June 2012 HMO Member Months: 15,769
Annual Cost Managed Care Annual Managed CostUtilization Per Utilization Utilization Care Cost Per Selection Proposed
Type of Service Per 1,000 Service PMPM Adjustment Per 1,000 Adjustment Service PMPM Trend Adjustment Cap Rate
Inpatient HospitalMedical/Surgical 97.7 $ 1,981.00 $ 16.13 (20.0%) 78.1 6.3% $ 2,104.87 $ 13.71 104.0% 0.7423 $ 10.58Well Newborn - - - (10.0%) 0.0 0.6% 0.00 0.00 104.0% 0.7423 - Other Newborn 0.1 781.72 0.00 (10.0%) 0.0 1.6% 794.34 0.00 104.0% 0.7423 0.00 Maternity Non-Delivery - - 0.00 (10.0%) 0.0 1.8% 0.00 0.00 104.0% 0.7423 - Psychiatric/Substance Abuse 216.1 714.09 12.86 (30.0%) 151.2 23.7% 883.60 11.14 104.0% 0.7423 8.60 Long Term Care 2.7 183.50 0.04 (20.0%) 2.1 6.7% 195.83 0.03 100.0% 0.7423 0.03 Other Inpatient 1.7 11,566.28 1.64 (20.0%) 1.4 6.7% 12,343.40 1.40 104.0% 0.7423 1.08
Subtotal 318.2 $ 1,156.89 $ 30.67 (26.8%) 232.9 17.1% $ 1,354.20 $ 26.29 104.0% 0.7423 $ 20.29
Outpatient HospitalGeneral Outpatient 117.7 $ 448.19 $ 4.39 (10.0%) 105.9 (12.9%) $ 390.37 $ 3.45 102.6% 0.7423 $ 2.62Emergency Room 359.2 141.25 4.23 (20.0%) 287.4 9.7% 154.95 3.71 102.6% 0.7423 2.83 End-Stage Renal Disease 1.6 608.31 0.08 0.0% 1.6 0.0% 608.31 0.08 102.6% 0.7423 0.06
Subtotal 478.5 $ 218.30 $ 8.70 (17.5%) 394.9 0.7% $ 219.94 $ 7.24 102.6% 0.7423 $ 5.51
AncillariesPrescription Drugs 3,451.8 $ 84.43 $ 24.28 0.0% 3,451.8 (20.0%) $ 67.54 $ 19.43 116.5% 0.7423 $ 16.81Transportation 1,129.8 13.49 1.27 (20.0%) 903.9 0.0% 13.49 1.02 101.3% 0.7423 0.76 DME/Prosthetics/Orthotics 112.5 121.39 1.14 (30.0%) 78.8 2.5% 124.46 0.82 101.3% 0.7423 0.61 Home Health/Hospice 13.1 285.74 0.31 0.0% 13.1 0.0% 285.74 0.31 101.3% 0.7423 0.23 Other Ancillary 6.2 26.04 0.01 (10.0%) 5.6 0.1% 26.06 0.01 101.3% 0.7423 0.01
Subtotal 4,713.4 $ 68.79 $ 27.02 (5.5%) 4,453.1 (15.4%) $ 58.17 $ 21.59 115.0% 0.7423 $ 18.43
PhysicianSurgery 120.1 156.50 $ 1.57 (20.0%) 96.0 (3.1%) $ 151.69 $ 1.21 104.0% 0.7423 $ 0.94Anesthesia 28.8 199.52 0.48 (20.0%) 23.0 (0.1%) 199.39 0.38 104.0% 0.7423 0.30 Hospital Inpatient Visits 268.5 36.01 0.81 (20.0%) 214.8 6.9% 38.51 0.69 104.0% 0.7423 0.53 Office Visits/Consults 1,083.1 47.38 4.28 (10.0%) 974.8 (12.7%) 41.35 3.36 104.0% 0.7423 2.59 Well Baby Exams/Physical Exams 767.3 43.36 2.77 40.0% 1,074.2 0.4% 43.54 3.90 104.0% 0.7423 3.01 Emergency Room Visits 320.9 39.16 1.05 (20.0%) 256.7 1.4% 39.71 0.85 104.0% 0.7423 0.66 Clinic Visit/Services 3,631.8 21.29 6.44 (10.0%) 3,268.6 2.1% 21.74 5.92 104.0% 0.7423 4.57 Radiology and Pathology 3,453.4 10.32 2.97 (20.0%) 2,762.7 (7.1%) 9.58 2.21 104.0% 0.7423 1.70 Outpatient Behavioral Health 133.6 49.27 0.55 (30.0%) 93.5 (3.0%) 47.79 0.37 104.0% 0.7423 0.29 Maternity 4.7 49.82 0.02 0.0% 4.7 0.0% 49.82 0.02 104.0% 0.7423 0.02 Chiropractor 10.6 10.03 0.01 (40.0%) 6.4 (0.0%) 10.03 0.01 104.0% 0.7423 0.00 Podiatrist 57.8 43.17 0.21 0.0% 57.8 0.0% 43.17 0.21 104.0% 0.7423 0.16 Vision - EyeCare & Eyewear - - - (10.0%) 0.0 0.0% 0.00 0.00 104.0% 0.7423 - Other Professional 8,357.6 3.49 2.43 10.0% 9,193.4 6.1% 3.70 2.84 104.0% 0.7423 2.19 DMHDD / DASA 411.1 119.89 4.11 (30.0%) 287.8 (14.5%) 102.49 2.46 104.0% 0.7423 1.90 PCCM Fee 2.00
Subtotal 18,649.3 $ 17.81 $ 27.69 (1.8%) 18,314.5 (10.2%) $ 16.00 $ 24.42 104.0% 0.7423 $ 20.85
Total Claims/Benefit Cost 24,159.4 $ 46.73 $ 94.08 (3.2%) 23,395.4 (12.7%) $ 40.79 $ 79.53 106.9% 0.7423 $ 65.08Copay Adjustment - Administration 9.94
Capitation Rate $ 75.02
ATTACHMENT 4 Milliman, Inc.Page 35 of 66

3/26/20132:40 PM
State of IllinoisDepartment of Healthcare and Family Services
VMC Rate Development: Apr to Dec 2013Region: 4
Population: 14 yrs thru 20 yrs - FemaleSFY11 Member Months: 762,981 June 2012 HMO Member Months: 19,050
Annual Cost Managed Care Annual Managed CostUtilization Per Utilization Utilization Care Cost Per Selection Proposed
Type of Service Per 1,000 Service PMPM Adjustment Per 1,000 Adjustment Service PMPM Trend Adjustment Cap Rate
Inpatient HospitalMedical/Surgical 76.7 $ 1,924.41 $ 12.30 (20.0%) 61.4 6.3% $ 2,044.74 $ 10.45 104.0% 0.8353 $ 9.08Well Newborn - - 0.00 (10.0%) 0.0 0.6% 0.00 0.00 104.0% 0.8353 - Other Newborn 0.1 375.09 0.00 (10.0%) 0.0 1.6% 381.14 0.00 104.0% 0.8353 0.00 Maternity Non-Delivery 28.0 1,079.61 2.51 (10.0%) 25.2 1.8% 1,098.82 2.30 104.0% 0.8353 2.00 Psychiatric/Substance Abuse 224.5 708.12 13.25 (30.0%) 157.1 23.7% 876.21 11.47 104.0% 0.8353 9.97 Long Term Care 1.5 135.20 0.02 (20.0%) 1.2 6.7% 144.28 0.01 100.0% 0.8353 0.01 Other Inpatient 1.4 8,755.33 1.03 (20.0%) 1.1 6.7% 9,343.59 0.88 104.0% 0.8353 0.76
Subtotal 332.1 $ 1,052.01 $ 29.11 (25.9%) 246.0 16.5% $ 1,225.64 $ 25.13 104.0% 0.8353 $ 21.83
Outpatient HospitalGeneral Outpatient 326.1 $ 271.47 $ 7.38 (10.0%) 293.5 (12.9%) $ 236.45 $ 5.78 102.6% 0.8353 $ 4.96Emergency Room 525.0 145.33 6.36 (20.0%) 420.0 9.7% 159.43 5.58 102.6% 0.8353 4.78 End-Stage Renal Disease 1.2 784.15 0.08 0.0% 1.2 0.0% 784.15 0.08 102.6% 0.8353 0.07
Subtotal 852.3 $ 194.50 $ 13.81 (16.1%) 714.7 (1.2%) $ 192.11 $ 11.44 102.6% 0.8353 $ 9.81
AncillariesPrescription Drugs 5,157.2 $ 48.35 $ 20.78 0.0% 5,157.2 (20.0%) $ 38.68 $ 16.62 116.5% 0.8353 $ 16.18Transportation 1,135.6 16.44 1.56 (20.0%) 908.5 0.0% 16.44 1.24 101.3% 0.8353 1.05 DME/Prosthetics/Orthotics 129.2 110.04 1.18 (30.0%) 90.4 2.5% 112.82 0.85 101.3% 0.8353 0.72 Home Health/Hospice 13.0 64.39 0.07 0.0% 13.0 0.0% 64.39 0.07 101.3% 0.8353 0.06 Other Ancillary 5.3 26.54 0.01 (10.0%) 4.8 0.1% 26.56 0.01 101.3% 0.8353 0.01
Subtotal 6,440.4 $ 43.98 $ 23.60 (4.1%) 6,174.0 (16.9%) $ 36.54 $ 18.80 114.8% 0.8353 $ 18.02
PhysicianSurgery 93.8 153.56 $ 1.20 (20.0%) 75.0 (3.1%) $ 148.84 $ 0.93 104.0% 0.8353 $ 0.81Anesthesia 75.8 298.19 1.88 (20.0%) 60.6 (0.1%) 298.00 1.51 104.0% 0.8353 1.31 Hospital Inpatient Visits 330.4 36.78 1.01 (20.0%) 264.3 6.9% 39.33 0.87 104.0% 0.8353 0.75 Office Visits/Consults 1,475.5 46.86 5.76 (10.0%) 1,327.9 (12.7%) 40.89 4.53 104.0% 0.8353 3.93 Well Baby Exams/Physical Exams 759.3 44.18 2.80 40.0% 1,063.0 0.4% 44.37 3.93 104.0% 0.8353 3.41 Emergency Room Visits 495.8 42.57 1.76 (20.0%) 396.7 1.4% 43.17 1.43 104.0% 0.8353 1.24 Clinic Visit/Services 4,599.5 36.03 13.81 (10.0%) 4,139.6 2.1% 36.80 12.69 104.0% 0.8353 11.03 Radiology and Pathology 8,346.7 11.42 7.94 (20.0%) 6,677.4 (7.1%) 10.60 5.90 104.0% 0.8353 5.13 Outpatient Behavioral Health 138.4 51.16 0.59 (30.0%) 96.9 (3.0%) 49.63 0.40 104.0% 0.8353 0.35 Maternity 23.4 47.93 0.09 0.0% 23.4 0.0% 47.93 0.09 104.0% 0.8353 0.08 Chiropractor 14.2 10.32 0.01 (40.0%) 8.5 (0.0%) 10.32 0.01 104.0% 0.8353 0.01 Podiatrist 49.0 44.40 0.18 0.0% 49.0 0.0% 44.40 0.18 104.0% 0.8353 0.16 Vision - EyeCare & Eyewear - - - (10.0%) 0.0 0.0% 0.00 0.00 104.0% 0.8353 - Other Professional 8,405.8 5.45 3.82 10.0% 9,246.4 6.1% 5.78 4.45 104.0% 0.8353 3.87 DMHDD / DASA 305.8 100.14 2.55 (30.0%) 214.1 (14.5%) 85.60 1.53 104.0% 0.8353 1.33 PCCM Fee 2.00
Subtotal 25,113.3 $ 20.74 $ 43.41 (5.9%) 23,642.7 (5.9%) $ 19.51 $ 38.44 104.0% 0.8353 $ 35.39
Total Claims/Benefit Cost 32,738.1 $ 40.30 $ 109.94 (6.0%) 30,777.4 (9.2%) $ 36.58 $ 93.81 106.0% 0.8353 $ 85.05Copay Adjustment - Administration 12.99
Capitation Rate $ 98.04
ATTACHMENT 4 Milliman, Inc.Page 36 of 66

3/26/20132:40 PM
State of IllinoisDepartment of Healthcare and Family Services
VMC Rate Development: Apr to Dec 2013Region: 4
Population: 21 yrs thru 44 yrs - MaleSFY11 Member Months: 236,843 June 2012 HMO Member Months: 3,159
Annual Cost Managed Care Annual Managed CostUtilization Per Utilization Utilization Care Cost Per Selection Proposed
Type of Service Per 1,000 Service PMPM Adjustment Per 1,000 Adjustment Service PMPM Trend Adjustment Cap Rate
Inpatient HospitalMedical/Surgical 274.6 $ 1,876.65 $ 42.94 (20.0%) 219.7 6.3% $ 1,993.99 $ 36.50 101.3% 0.8624 $ 31.90Well Newborn - - - (10.0%) 0.0 0.6% 0.00 0.00 101.3% 0.8624 - Other Newborn - - - (10.0%) 0.0 1.6% 0.00 0.00 101.3% 0.8624 - Maternity Non-Delivery 0.1 1,734.51 0.01 (10.0%) 0.1 1.8% 1,765.38 0.01 101.3% 0.8624 0.01 Psychiatric/Substance Abuse 93.1 669.82 5.19 (30.0%) 65.1 23.7% 828.82 4.50 101.3% 0.8624 3.93 Long Term Care 18.7 125.46 0.20 (20.0%) 14.9 6.7% 133.89 0.17 100.0% 0.8624 0.14 Other Inpatient 5.8 5,295.85 2.58 (20.0%) 4.7 6.7% 5,651.67 2.20 101.3% 0.8624 1.92
Subtotal 392.2 $ 1,557.95 $ 50.92 (22.4%) 304.5 9.7% $ 1,709.65 $ 43.38 101.3% 0.8624 $ 37.90
Outpatient HospitalGeneral Outpatient 309.7 $ 412.33 $ 10.64 (10.0%) 278.8 (12.9%) $ 359.14 $ 8.34 102.6% 0.8624 $ 7.39Emergency Room 502.4 172.99 7.24 (20.0%) 401.9 9.7% 189.77 6.36 102.6% 0.8624 5.63 End-Stage Renal Disease 10.0 1,618.70 1.35 0.0% 10.0 0.0% 1,618.70 1.35 102.6% 0.8624 1.20
Subtotal 822.1 $ 280.77 $ 19.24 (16.0%) 690.7 (0.7%) $ 278.85 $ 16.05 102.6% 0.8624 $ 14.21
AncillariesPrescription Drugs 7,983.4 $ 54.90 $ 36.52 0.0% 7,983.4 (20.0%) $ 43.92 $ 29.22 116.5% 0.8624 $ 29.36Transportation 371.2 31.01 0.96 (20.0%) 297.0 0.0% 31.02 0.77 101.3% 0.8624 0.67 DME/Prosthetics/Orthotics 295.9 81.62 2.01 (30.0%) 207.1 2.5% 83.68 1.44 101.3% 0.8624 1.26 Home Health/Hospice 39.9 92.32 0.31 0.0% 39.9 0.0% 92.32 0.31 101.3% 0.8624 0.27 Other Ancillary 8.8 27.52 0.02 (10.0%) 7.9 0.1% 27.54 0.02 101.3% 0.8624 0.02
Subtotal 8,699.1 $ 54.93 $ 39.82 (1.9%) 8,535.2 (18.7%) $ 44.65 $ 31.76 115.3% 0.8624 $ 31.58
PhysicianSurgery 238.4 200.96 $ 3.99 (20.0%) 190.7 (3.1%) $ 194.79 $ 3.10 102.6% 0.8624 $ 2.74Anesthesia 60.1 196.88 0.99 (20.0%) 48.1 (0.1%) 196.75 0.79 102.6% 0.8624 0.70 Hospital Inpatient Visits 493.5 41.72 1.72 (20.0%) 394.8 6.9% 44.61 1.47 102.6% 0.8624 1.30 Office Visits/Consults 1,728.7 49.24 7.09 (10.0%) 1,555.9 (12.7%) 42.97 5.57 102.6% 0.8624 4.93 Well Baby Exams/Physical Exams 68.9 92.49 0.53 40.0% 96.5 0.4% 92.88 0.75 102.6% 0.8624 0.66 Emergency Room Visits 459.5 44.91 1.72 (20.0%) 367.6 1.4% 45.54 1.40 102.6% 0.8624 1.23 Clinic Visit/Services 2,782.8 27.49 6.38 (10.0%) 2,504.5 2.1% 28.07 5.86 102.6% 0.8624 5.19 Radiology and Pathology 7,384.3 10.53 6.48 (20.0%) 5,907.4 (7.1%) 9.78 4.81 102.6% 0.8624 4.26 Outpatient Behavioral Health 82.3 46.72 0.32 (30.0%) 57.6 (3.0%) 45.32 0.22 102.6% 0.8624 0.19 Maternity 1.1 48.46 0.00 0.0% 1.1 0.0% 48.46 0.00 102.6% 0.8624 0.00 Chiropractor - - - (40.0%) 0.0 (0.0%) 0.00 0.00 102.6% 0.8624 - Podiatrist 32.4 40.48 0.11 0.0% 32.4 0.0% 40.48 0.11 102.6% 0.8624 0.10 Vision - EyeCare & Eyewear - - - (10.0%) 0.0 0.0% 0.00 0.00 102.6% 0.8624 - Other Professional 8,118.4 6.79 4.59 10.0% 8,930.2 6.1% 7.20 5.36 102.6% 0.8624 4.74 DMHDD / DASA 133.2 71.30 0.79 (30.0%) 93.2 (14.5%) 60.95 0.47 102.6% 0.8624 0.42 PCCM Fee 2.00
Subtotal 21,583.6 $ 19.30 $ 34.72 (6.5%) 20,180.0 (7.9%) $ 17.78 $ 29.90 102.6% 0.8624 $ 28.47
Total Claims/Benefit Cost 31,497.0 $ 55.13 $ 144.70 (5.7%) 29,710.4 (11.3%) $ 48.91 $ 121.09 105.5% 0.8624 $ 112.16Copay Adjustment (0.85) Administration 17.00
Capitation Rate $ 128.31
ATTACHMENT 4 Milliman, Inc.Page 37 of 66

3/26/20132:40 PM
State of IllinoisDepartment of Healthcare and Family Services
VMC Rate Development: Apr to Dec 2013Region: 4
Population: 21 yrs thru 44 yrs - FemaleSFY11 Member Months: 1,263,084 June 2012 HMO Member Months: 38,608
Annual Cost Managed Care Annual Managed CostUtilization Per Utilization Utilization Care Cost Per Selection Proposed
Type of Service Per 1,000 Service PMPM Adjustment Per 1,000 Adjustment Service PMPM Trend Adjustment Cap Rate
Inpatient HospitalMedical/Surgical 210.4 $ 1,585.92 $ 27.80 (20.0%) 168.3 6.3% $ 1,685.09 $ 23.63 101.3% 0.8624 $ 20.65Well Newborn - - - (10.0%) 0.0 0.6% 0.00 0.00 101.3% 0.8624 - Other Newborn 0.4 1,656.75 0.06 (10.0%) 0.4 1.6% 1,683.49 0.05 101.3% 0.8624 0.04 Maternity Non-Delivery 66.5 1,164.96 6.45 (10.0%) 59.8 1.8% 1,185.69 5.91 101.3% 0.8624 5.17 Psychiatric/Substance Abuse 78.2 630.29 4.11 (30.0%) 54.7 23.7% 779.90 3.56 101.3% 0.8624 3.11 Long Term Care 23.7 130.24 0.26 (20.0%) 19.0 6.7% 138.99 0.22 100.0% 0.8624 0.19 Other Inpatient 0.7 7,212.64 0.39 (20.0%) 0.5 6.7% 7,697.24 0.34 101.3% 0.8624 0.29
Subtotal 379.8 $ 1,234.41 $ 39.07 (20.3%) 302.7 8.2% $ 1,336.24 $ 33.71 101.3% 0.8624 $ 29.45
Outpatient HospitalGeneral Outpatient 863.7 $ 283.95 $ 20.44 (10.0%) 777.4 (12.9%) $ 247.32 $ 16.02 102.6% 0.8624 $ 14.18Emergency Room 871.6 167.42 12.16 (20.0%) 697.3 9.7% 183.66 10.67 102.6% 0.8624 9.45 End-Stage Renal Disease 10.1 1,135.66 0.95 0.0% 10.1 0.0% 1,135.66 0.95 102.6% 0.8624 0.84
Subtotal 1,745.5 $ 230.67 $ 33.55 (14.9%) 1,484.7 (3.1%) $ 223.44 $ 27.65 102.6% 0.8624 $ 24.47
AncillariesPrescription Drugs 10,988.8 $ 48.22 $ 44.16 0.0% 10,988.8 (20.0%) $ 38.58 $ 35.33 116.5% 0.8624 $ 35.50Transportation 676.1 28.15 1.59 (20.0%) 540.9 0.0% 28.16 1.27 101.3% 0.8624 1.11 DME/Prosthetics/Orthotics 289.8 80.52 1.94 (30.0%) 202.9 2.5% 82.56 1.40 101.3% 0.8624 1.22 Home Health/Hospice 34.5 82.99 0.24 0.0% 34.5 0.0% 82.99 0.24 101.3% 0.8624 0.21 Other Ancillary 7.1 27.29 0.02 (10.0%) 6.4 0.1% 27.31 0.01 101.3% 0.8624 0.01
Subtotal 11,996.3 $ 47.96 $ 47.94 (1.9%) 11,773.4 (18.7%) $ 38.98 $ 38.24 115.4% 0.8624 $ 38.05
PhysicianSurgery 297.9 168.39 $ 4.18 (20.0%) 238.3 (3.1%) $ 163.22 $ 3.24 102.6% 0.8624 $ 2.87Anesthesia 196.3 256.59 4.20 (20.0%) 157.1 (0.1%) 256.43 3.36 102.6% 0.8624 2.97 Hospital Inpatient Visits 510.6 40.89 1.74 (20.0%) 408.5 6.9% 43.72 1.49 102.6% 0.8624 1.32 Office Visits/Consults 2,430.3 47.40 9.60 (10.0%) 2,187.3 (12.7%) 41.36 7.54 102.6% 0.8624 6.67 Well Baby Exams/Physical Exams 174.5 80.07 1.16 40.0% 244.2 0.4% 80.41 1.64 102.6% 0.8624 1.45 Emergency Room Visits 840.1 45.54 3.19 (20.0%) 672.1 1.4% 46.18 2.59 102.6% 0.8624 2.29 Clinic Visit/Services 5,621.5 42.83 20.06 (10.0%) 5,059.4 2.1% 43.74 18.44 102.6% 0.8624 16.33 Radiology and Pathology 17,369.8 12.94 18.73 (20.0%) 13,895.8 (7.1%) 12.02 13.91 102.6% 0.8624 12.32 Outpatient Behavioral Health 123.4 45.45 0.47 (30.0%) 86.4 (3.0%) 44.09 0.32 102.6% 0.8624 0.28 Maternity 27.9 49.29 0.11 0.0% 27.9 0.0% 49.29 0.11 102.6% 0.8624 0.10 Chiropractor - - - (40.0%) 0.0 (0.0%) 0.00 0.00 102.6% 0.8624 - Podiatrist 20.9 38.49 0.07 0.0% 20.9 0.0% 38.49 0.07 102.6% 0.8624 0.06 Vision - EyeCare & Eyewear - - - (10.0%) 0.0 0.0% 0.00 0.00 102.6% 0.8624 - Other Professional 8,367.2 12.54 8.75 10.0% 9,203.9 6.1% 13.30 10.20 102.6% 0.8624 9.03 DMHDD / DASA 272.1 82.93 1.88 (30.0%) 190.5 (14.5%) 70.89 1.13 102.6% 0.8624 1.00 PCCM Fee 2.00
Subtotal 36,252.6 $ 24.54 $ 74.14 (10.6%) 32,392.3 (3.3%) $ 23.72 $ 64.03 102.6% 0.8624 $ 58.68
Total Claims/Benefit Cost 50,374.1 $ 46.38 $ 194.70 (8.8%) 45,953.2 (7.9%) $ 42.73 $ 163.63 105.3% 0.8624 $ 150.66Copay Adjustment (2.22) Administration 22.67
Capitation Rate $ 171.10
ATTACHMENT 4 Milliman, Inc.Page 38 of 66

3/26/20132:40 PM
State of IllinoisDepartment of Healthcare and Family Services
VMC Rate Development: Apr to Dec 2013Region: 4
Population: 45 + YearsSFY11 Member Months: 397,831 June 2012 HMO Member Months: 5,133
Annual Cost Managed Care Annual Managed CostUtilization Per Utilization Utilization Care Cost Per Selection Proposed
Type of Service Per 1,000 Service PMPM Adjustment Per 1,000 Adjustment Service PMPM Trend Adjustment Cap Rate
Inpatient HospitalMedical/Surgical 550.3 $ 1,630.90 $ 74.79 (20.0%) 440.3 0.0% $ 1,630.90 $ 59.84 101.3% 0.8624 $ 52.28Well Newborn - - - (10.0%) 0.0 0.0% 0.00 0.00 101.3% 0.8624 - Other Newborn - - - (10.0%) 0.0 0.0% 0.00 0.00 101.3% 0.8624 - Maternity Non-Delivery 0.4 2,358.24 0.07 (10.0%) 0.3 0.0% 2,358.24 0.06 101.3% 0.8624 0.05 Psychiatric/Substance Abuse 110.6 651.24 6.00 (30.0%) 77.4 0.0% 651.24 4.20 101.3% 0.8624 3.67 Long Term Care 103.6 143.03 1.23 (20.0%) 82.9 0.0% 143.03 0.99 100.0% 0.8624 0.85 Other Inpatient 2.5 5,889.56 1.24 (20.0%) 2.0 0.0% 5,889.56 0.99 101.3% 0.8624 0.86
Subtotal 767.4 $ 1,303.19 $ 83.33 (21.4%) 602.9 0.9% $ 1,315.21 $ 66.07 101.3% 0.8624 $ 57.72
Outpatient HospitalGeneral Outpatient 844.2 $ 388.04 $ 27.30 (10.0%) 759.8 0.0% $ 388.04 $ 24.57 102.6% 0.8624 $ 21.75Emergency Room 518.8 199.36 8.62 (20.0%) 415.0 0.0% 199.36 6.90 102.6% 0.8624 6.10 End-Stage Renal Disease 41.0 1,092.28 3.73 0.0% 41.0 0.0% 1,092.28 3.73 102.6% 0.8624 3.30
Subtotal 1,404.0 $ 338.87 $ 39.65 (13.4%) 1,215.8 2.5% $ 347.37 $ 35.19 102.6% 0.8624 $ 31.16
AncillariesPrescription Drugs 22,624.4 $ 49.59 $ 93.49 0.0% 22,624.4 (20.0%) $ 39.67 $ 74.80 116.5% 0.8624 $ 75.17Transportation 1,890.7 14.34 2.26 (20.0%) 1,512.6 0.0% 14.34 1.81 101.3% 0.8624 1.58 DME/Prosthetics/Orthotics 806.2 66.74 4.48 (30.0%) 564.3 0.0% 66.74 3.14 101.3% 0.8624 2.74 Home Health/Hospice 142.7 89.24 1.06 0.0% 142.7 0.0% 89.24 1.06 101.3% 0.8624 0.93 Other Ancillary 17.1 27.10 0.04 (10.0%) 15.4 0.0% 27.10 0.03 101.3% 0.8624 0.03
Subtotal 25,481.0 $ 47.72 $ 101.34 (2.4%) 24,859.3 (18.2%) $ 39.02 $ 80.84 115.4% 0.8624 $ 80.45
PhysicianSurgery 520.1 210.56 $ 9.13 (20.0%) 416.1 0.0% $ 210.56 $ 7.30 102.6% 0.8624 $ 6.46Anesthesia 129.1 182.79 1.97 (20.0%) 103.3 0.0% 182.79 1.57 102.6% 0.8624 1.39 Hospital Inpatient Visits 971.6 40.87 3.31 (20.0%) 777.3 0.0% 40.87 2.65 102.6% 0.8624 2.34 Office Visits/Consults 3,444.6 48.86 14.02 (10.0%) 3,100.1 0.0% 48.86 12.62 102.6% 0.8624 11.17 Well Baby Exams/Physical Exams 114.0 86.75 0.82 40.0% 159.6 0.0% 86.75 1.15 102.6% 0.8624 1.02 Emergency Room Visits 488.9 49.33 2.01 (20.0%) 391.2 0.0% 49.33 1.61 102.6% 0.8624 1.42 Clinic Visit/Services 3,660.1 48.50 14.79 (10.0%) 3,294.1 0.0% 48.50 13.31 102.6% 0.8624 11.79 Radiology and Pathology 15,429.2 11.55 14.85 (20.0%) 12,343.3 0.0% 11.55 11.88 102.6% 0.8624 10.52 Outpatient Behavioral Health 149.6 40.38 0.50 (30.0%) 104.7 0.0% 40.38 0.35 102.6% 0.8624 0.31 Maternity 0.6 46.86 0.00 0.0% 0.6 0.0% 46.86 0.00 102.6% 0.8624 0.00 Chiropractor - - - (40.0%) 0.0 0.0% 0.00 0.00 102.6% 0.8624 - Podiatrist 113.0 35.27 0.33 0.0% 113.0 0.0% 35.27 0.33 102.6% 0.8624 0.29 Vision - EyeCare & Eyewear - - - (10.0%) 0.0 0.0% 0.00 0.00 102.6% 0.8624 - Other Professional 9,312.3 16.33 12.67 10.0% 10,243.5 0.0% 16.33 13.94 102.6% 0.8624 12.34 DMHDD / DASA 323.9 67.56 1.82 (30.0%) 226.7 0.0% 67.56 1.28 102.6% 0.8624 1.13 PCCM Fee 2.00
Subtotal 34,657.0 $ 26.40 $ 76.24 (9.8%) 31,273.5 (1.2%) $ 26.09 $ 68.00 0.8624 $ 62.20
Total Claims/Benefit Cost 62,309.4 $ 57.88 $ 300.56 (7.0%) 57,951.5 (10.5%) $ 51.79 $ 250.11 0.8624 $ 231.52Copay Adjustment (1.87) Administration 35.08
Capitation Rate $ 264.73
ATTACHMENT 4 Milliman, Inc.Page 39 of 66

3/26/20132:40 PM
State of IllinoisDepartment of Healthcare and Family Services
VMC Rate Development: Apr to Dec 2013Region: 4
Population: CompositeSFY11 Member Months: 8,024,691 June 2012 HMO Member Months: 200,831
Annual Cost Managed Care Annual Managed CostUtilization Per Utilization Utilization Care Cost Per Selection Proposed
Type of Service Per 1,000 Service PMPM Adjustment Per 1,000 Adjustment Service PMPM Trend Adjustment Cap Rate
Inpatient HospitalMedical/Surgical 146.0 $ 1,844.36 $ 22.44 (20.0%) 116.8 5.7% $ 1,949.86 $ 18.98 103.2% 0.8733 $ 17.10Well Newborn 4.0 2,620.86 0.88 (10.0%) 3.6 0.6% 2,636.50 0.80 108.1% 0.9000 0.78 Other Newborn 173.1 1,703.77 24.58 (10.0%) 155.8 1.6% 1,731.25 22.48 107.9% 0.9032 21.91 Maternity Non-Delivery 15.4 1,151.37 1.48 (10.0%) 13.9 1.8% 1,171.52 1.36 101.7% 0.8580 1.18 Psychiatric/Substance Abuse 76.0 702.65 4.45 (30.0%) 53.2 22.9% 863.70 3.83 103.0% 0.8016 3.16 Long Term Care 7.8 135.88 0.09 (20.0%) 6.3 4.3% 141.77 0.07 100.0% 0.8575 0.06 Other Inpatient 1.2 9,323.02 0.95 (20.0%) 1.0 6.5% 9,928.57 0.81 102.9% 0.8294 0.69
Subtotal 423.7 $ 1,554.19 $ 54.87 (17.2%) 350.6 6.4% $ 1,654.03 $ 48.33 105.4% 0.8813 $ 44.88
Outpatient HospitalGeneral Outpatient 290.0 $ 322.96 $ 7.80 (10.0%) 261.0 (11.7%) $ 285.02 $ 6.20 102.3% 0.8531 $ 5.41Emergency Room 574.0 133.98 6.41 (20.0%) 459.2 9.4% 146.53 5.61 102.1% 0.8569 4.90 End-Stage Renal Disease 3.5 1,110.77 0.32 0.0% 3.5 0.0% 1,110.77 0.32 102.6% 0.8577 0.28
Subtotal 867.4 $ 201.08 $ 14.53 (16.6%) 723.6 0.0% $ 201.12 $ 12.13 102.2% 0.8550 $ 10.60
AncillariesPrescription Drugs 6,322.6 $ 46.78 $ 24.65 0.0% 6,322.6 (20.0%) $ 37.42 $ 19.72 116.5% 0.8393 $ 19.28Transportation 589.8 19.22 0.94 (20.0%) 471.9 0.0% 19.23 0.76 101.8% 0.8383 0.65 DME/Prosthetics/Orthotics 215.2 99.40 1.78 (30.0%) 150.6 2.4% 101.75 1.28 102.1% 0.8500 1.11 Home Health/Hospice 24.0 208.75 0.42 0.0% 24.0 0.0% 208.75 0.42 102.3% 0.8909 0.38 Other Ancillary 21.4 27.09 0.05 (10.0%) 19.3 0.1% 27.11 0.04 102.5% 0.8617 0.04
Subtotal 7,173.0 $ 46.57 $ 27.84 (2.6%) 6,988.3 (18.1%) $ 38.14 $ 22.21 114.9% 0.8407 $ 21.46
PhysicianSurgery 167.6 153.17 $ 2.14 (20.0%) 134.1 (2.7%) $ 148.98 $ 1.66 103.6% 0.8556 $ 1.48Anesthesia 69.4 237.14 1.37 (20.0%) 55.5 (0.1%) 236.99 1.10 103.3% 0.8562 0.97 Hospital Inpatient Visits 481.2 71.69 2.88 (20.0%) 385.0 6.7% 76.51 2.45 103.1% 0.8916 2.26 Office Visits/Consults 1,925.1 47.16 7.57 (10.0%) 1,732.6 (12.1%) 41.44 5.98 104.3% 0.8510 5.31 Well Baby Exams/Physical Exams 1,670.2 35.11 4.89 40.0% 2,338.2 0.4% 35.26 6.87 104.6% 0.8781 6.31 Emergency Room Visits 541.3 40.21 1.81 (20.0%) 433.1 1.4% 40.77 1.47 104.0% 0.8600 1.32 Clinic Visit/Services 4,481.3 34.36 12.83 (10.0%) 4,033.2 2.1% 35.06 11.79 104.1% 0.8585 10.53 Radiology and Pathology 7,411.8 10.66 6.58 (20.0%) 5,929.4 (6.7%) 9.94 4.91 103.4% 0.8540 4.34 Outpatient Behavioral Health 79.7 48.26 0.32 (30.0%) 55.8 (2.9%) 46.87 0.22 104.0% 0.8084 0.18 Maternity 11.3 49.31 0.05 0.0% 11.3 0.0% 49.31 0.05 103.7% 0.8506 0.04 Chiropractor 5.2 10.19 0.00 (40.0%) 3.1 (0.0%) 10.19 0.00 104.8% 0.8082 0.00 Podiatrist 30.4 38.88 0.10 0.0% 30.4 0.0% 38.88 0.10 104.2% 0.8081 0.08 Vision - EyeCare & Eyewear - - - 0.0% 0.0 0.0% 0.00 0.00 104.2% - Other Professional 8,747.6 9.00 6.56 10.0% 9,622.3 5.7% 9.51 7.63 104.3% 0.8695 6.92 DMHDD / DASA 168.4 92.59 1.30 (30.0%) 117.9 (14.0%) 79.63 0.78 103.9% 0.8051 0.65 PCCM Fee 2.00
Subtotal 25,790.5 $ 22.52 $ 48.39 (3.5%) 24,881.9 (3.6%) $ 21.71 $ 45.01 104.1% 0.9050 $ 42.39
Total Claims/Benefit Cost 34,254.6 $ 51.02 $ 145.64 (3.8%) 32,944.4 (8.8%) $ 46.51 $ 127.68 106.3% 0.8794 $ 119.32Copay Adjustment (0.49) Administration 18.15
Capitation Rate $ 136.99
ATTACHMENT 4 Milliman, Inc.Page 40 of 66

3/26/20132:40 PM
State of IllinoisDepartment of Healthcare and Family Services
VMC Rate Development: Apr to Dec 2013Region: 5
Population: 0 thru 90 DaysSFY11 Member Months: 67,479 June 2012 HMO Member Months: 152
Annual Cost Managed Care Annual Managed CostUtilization Per Utilization Utilization Care Cost Per Selection Proposed
Type of Service Per 1,000 Service PMPM Adjustment Per 1,000 Adjustment Service PMPM Trend Adjustment Cap Rate
Inpatient HospitalMedical/Surgical 976.4 $ 1,814.16 $ 147.61 (20.0%) 781.1 6.3% $ 1,927.60 $ 125.47 108.1% 0.9000 $ 122.04Well Newborn 9.5 2,444.18 1.94 (10.0%) 8.6 0.6% 2,459.64 1.76 108.1% 0.9000 1.71 Other Newborn 6,872.9 1,392.06 797.29 (10.0%) 6,185.6 1.6% 1,414.53 729.15 108.1% 0.9000 709.18 Maternity Non-Delivery - - - (10.0%) 0.0 1.8% 0.00 0.00 108.1% 0.9000 - Psychiatric/Substance Abuse 3.6 1,231.63 0.37 (30.0%) 2.5 23.7% 1,523.99 0.32 108.1% 0.9000 0.31 Long Term Care - - - (20.0%) 0.0 6.7% 0.00 0.00 100.0% 0.9000 - Other Inpatient - - - (20.0%) 0.0 6.7% 0.00 0.00 108.1% 0.9000 -
Subtotal 7,862.4 $ 1,445.68 $ 947.21 (11.3%) 6,977.8 1.9% $ 1,473.29 $ 856.69 108.1% 0.9000 $ 833.23
Outpatient HospitalGeneral Outpatient 327.0 $ 259.61 $ 7.07 (10.0%) 294.3 (12.9%) $ 226.12 $ 5.54 101.3% 0.9000 $ 5.06Emergency Room 968.5 104.89 8.47 (20.0%) 774.8 9.7% 115.07 7.43 101.3% 0.9000 6.77 End-Stage Renal Disease 0.4 339.50 0.01 0.0% 0.4 0.0% 339.50 0.01 101.3% 0.9000 0.01
Subtotal 1,295.9 $ 144.00 $ 15.55 (17.5%) 1,069.5 1.2% $ 145.71 $ 12.99 101.3% 0.9000 $ 11.84
AncillariesPrescription Drugs 3,381.6 $ 34.42 $ 9.70 0.0% 3,381.6 (5.0%) $ 32.70 $ 9.21 116.5% 0.9000 $ 9.66Transportation 356.6 73.79 2.19 (20.0%) 285.3 0.0% 73.80 1.75 102.6% 0.9000 1.62 DME/Prosthetics/Orthotics 417.5 80.89 2.81 (30.0%) 292.2 2.5% 82.94 2.02 102.6% 0.9000 1.87 Home Health/Hospice 106.8 84.74 0.75 0.0% 106.8 0.0% 84.74 0.75 102.6% 0.9000 0.70 Other Ancillary 97.2 47.82 0.39 (10.0%) 87.5 0.1% 47.85 0.35 102.6% 0.9000 0.32
Subtotal 4,359.8 $ 43.62 $ 15.85 (4.7%) 4,153.5 (6.7%) $ 40.71 $ 14.09 111.7% 0.9000 $ 14.17
PhysicianSurgery 833.7 132.12 $ 9.18 (20.0%) 667.0 (3.1%) $ 128.06 $ 7.12 102.6% 0.9000 $ 6.58Anesthesia 77.8 267.49 1.73 (20.0%) 62.2 (0.1%) 267.32 1.39 102.6% 0.9000 1.28 Hospital Inpatient Visits 9,722.3 102.28 82.87 (20.0%) 7,777.8 6.9% 109.37 70.89 102.6% 0.9000 65.49 Office Visits/Consults 3,917.6 50.37 16.44 (10.0%) 3,525.8 (12.7%) 43.95 12.91 102.6% 0.9000 11.93 Well Baby Exams/Physical Exams 19,747.3 32.59 53.64 40.0% 27,646.2 0.4% 32.73 75.40 102.6% 0.9000 69.65 Emergency Room Visits 957.4 40.08 3.20 (20.0%) 765.9 1.4% 40.65 2.59 102.6% 0.9000 2.40 Clinic Visit/Services 2,884.8 102.44 24.63 (10.0%) 2,596.3 2.1% 104.62 22.63 102.6% 0.9000 20.91 Radiology and Pathology 22,420.1 5.46 10.20 (20.0%) 17,936.1 (7.1%) 5.07 7.58 102.6% 0.9000 7.00 Outpatient Behavioral Health 0.7 51.33 0.00 (30.0%) 0.5 (3.0%) 49.79 0.00 102.6% 0.9000 0.00 Maternity 11.6 49.71 0.05 0.0% 11.6 0.0% 49.71 0.05 102.6% 0.9000 0.04 Chiropractor 21.2 10.38 0.02 (40.0%) 12.7 (0.0%) 10.38 0.01 102.6% 0.9000 0.01 Podiatrist 7.3 41.58 0.03 0.0% 7.3 0.0% 41.58 0.03 102.6% 0.9000 0.02 Vision - EyeCare & Eyewear - - - (10.0%) 0.0 0.0% 0.00 0.00 102.6% 0.9000 - Other Professional 4,582.5 17.18 6.56 10.0% 5,040.7 6.1% 18.22 7.65 102.6% 0.9000 7.07 DMHDD / DASA 0.1 84.51 0.00 (30.0%) 0.0 (14.5%) 72.24 0.00 102.6% 0.9000 0.00 PCCM Fee 2.00
Subtotal 65,184.2 $ 38.39 $ 208.54 1.3% 66,050.2 (1.4%) $ 37.83 $ 208.25 102.6% 0.9000 $ 194.39
Total Claims/Benefit Cost 78,702.2 $ 181.01 $ 1,187.15 (0.6%) 78,251.0 (7.5%) $ 167.46 $ 1,092.02 107.0% 0.9000 $ 1,053.62Copay Adjustment - Administration 160.93
Capitation Rate $ 1,214.55
ATTACHMENT 4 Milliman, Inc.Page 41 of 66

3/26/20132:40 PM
State of IllinoisDepartment of Healthcare and Family Services
VMC Rate Development: Apr to Dec 2013Region: 5
Population: 91 Days thru 1 yearSFY11 Member Months: 340,180 June 2012 HMO Member Months: 546
Annual Cost Managed Care Annual Managed CostUtilization Per Utilization Utilization Care Cost Per Selection Proposed
Type of Service Per 1,000 Service PMPM Adjustment Per 1,000 Adjustment Service PMPM Trend Adjustment Cap Rate
Inpatient HospitalMedical/Surgical 215.0 $ 1,644.95 $ 29.47 (20.0%) 172.0 6.3% $ 1,747.81 $ 25.05 102.6% 1.0000 $ 25.72Well Newborn - - - (10.0%) 0.0 0.6% 0.00 0.00 102.6% 1.0000 - Other Newborn 22.1 2,063.48 3.79 (10.0%) 19.8 1.6% 2,096.79 3.47 102.6% 1.0000 3.56 Maternity Non-Delivery - - - (10.0%) 0.0 1.8% 0.00 0.00 102.6% 1.0000 - Psychiatric/Substance Abuse - - - (30.0%) 0.0 23.7% 0.00 0.00 102.6% 1.0000 - Long Term Care - - - (20.0%) 0.0 6.7% 0.00 0.00 100.0% 1.0000 - Other Inpatient - - 0.13 (20.0%) 0.0 6.7% 0.00 0.00 102.6% 1.0000 -
Subtotal 237.1 $ 1,690.41 $ 33.39 (19.1%) 191.9 5.5% $ 1,783.91 $ 28.52 102.6% 1.0000 $ 29.28
Outpatient HospitalGeneral Outpatient 145.6 $ 323.25 $ 3.92 (10.0%) 131.0 (12.9%) $ 281.55 $ 3.07 101.3% 1.0000 $ 3.11Emergency Room 1,138.5 88.58 8.40 (20.0%) 910.8 9.7% 97.17 7.38 101.3% 1.0000 7.47 End-Stage Renal Disease 0.4 1,174.26 0.03 0.0% 0.4 0.0% 1,174.26 0.03 101.3% 1.0000 0.03
Subtotal 1,284.4 $ 115.47 $ 12.36 (18.9%) 1,042.2 4.5% $ 120.72 $ 10.48 101.3% 1.0000 $ 10.62
AncillariesPrescription Drugs 6,050.5 $ 34.48 $ 17.38 0.0% 6,050.5 (5.0%) $ 32.76 $ 16.52 116.5% 1.0000 $ 19.25Transportation 187.1 47.22 0.74 (20.0%) 149.7 0.0% 47.23 0.59 102.6% 1.0000 0.60 DME/Prosthetics/Orthotics 408.0 84.46 2.87 (30.0%) 285.6 2.5% 86.60 2.06 102.6% 1.0000 2.12 Home Health/Hospice 56.7 241.29 1.14 0.0% 56.7 0.0% 241.29 1.14 102.6% 1.0000 1.17 Other Ancillary 44.5 30.48 0.11 (10.0%) 40.1 0.1% 30.50 0.10 102.6% 1.0000 0.10
Subtotal 6,746.8 $ 39.57 $ 22.24 (2.4%) 6,582.5 (6.0%) $ 37.20 $ 20.41 113.9% 1.0000 $ 23.24
PhysicianSurgery 180.4 128.20 $ 1.93 (20.0%) 144.3 (3.1%) $ 124.26 $ 1.49 105.3% 1.0000 $ 1.57Anesthesia 49.4 174.06 0.72 (20.0%) 39.5 (0.1%) 173.95 0.57 105.3% 1.0000 0.60 Hospital Inpatient Visits 439.6 81.13 2.97 (20.0%) 351.7 6.9% 86.75 2.54 105.3% 1.0000 2.68 Office Visits/Consults 4,092.3 47.16 16.08 (10.0%) 3,683.1 (12.7%) 41.15 12.63 105.3% 1.0000 13.30 Well Baby Exams/Physical Exams 9,704.9 24.42 19.75 40.0% 13,586.8 0.4% 24.52 27.77 105.3% 1.0000 29.25 Emergency Room Visits 1,140.0 36.46 3.46 (20.0%) 912.0 1.4% 36.97 2.81 105.3% 1.0000 2.96 Clinic Visit/Services 3,467.0 43.81 12.66 (10.0%) 3,120.3 2.1% 44.74 11.63 105.3% 1.0000 12.25 Radiology and Pathology 4,594.8 8.79 3.36 (20.0%) 3,675.8 (7.1%) 8.16 2.50 105.3% 1.0000 2.63 Outpatient Behavioral Health 0.2 48.90 0.00 (30.0%) 0.1 (3.0%) 47.43 0.00 105.3% 1.0000 0.00 Maternity 11.7 49.94 0.05 0.0% 11.7 0.0% 49.94 0.05 105.3% 1.0000 0.05 Chiropractor 25.7 10.38 0.02 (40.0%) 15.4 (0.0%) 10.38 0.01 105.3% 1.0000 0.01 Podiatrist 6.0 36.14 0.02 0.0% 6.0 0.0% 36.14 0.02 105.3% 1.0000 0.02 Vision - EyeCare & Eyewear - - - (10.0%) 0.0 0.0% 0.00 0.00 105.3% 1.0000 - Other Professional 10,983.2 10.83 9.91 10.0% 12,081.6 6.1% 11.49 11.56 105.3% 1.0000 12.18 DMHDD / DASA - - - (30.0%) 0.0 (14.5%) 0.00 0.00 105.3% 1.0000 - PCCM Fee 2.00
Subtotal 34,695.1 $ 24.53 $ 70.93 8.5% 37,628.3 (4.3%) $ 23.47 $ 73.59 105.3% 1.0000 $ 79.52
Total Claims/Benefit Cost 42,963.3 $ 38.80 $ 138.93 5.8% 45,444.8 (9.5%) $ 35.12 $ 133.01 105.8% 1.0000 $ 142.66Copay Adjustment - Administration 21.79
Capitation Rate $ 164.45
ATTACHMENT 4 Milliman, Inc.Page 42 of 66

3/26/20132:40 PM
State of IllinoisDepartment of Healthcare and Family Services
VMC Rate Development: Apr to Dec 2013Region: 5
Population: 2 yrs thru 5 yrsSFY11 Member Months: 741,065 June 2012 HMO Member Months: 1,021
Annual Cost Managed Care Annual Managed CostUtilization Per Utilization Utilization Care Cost Per Selection Proposed
Type of Service Per 1,000 Service PMPM Adjustment Per 1,000 Adjustment Service PMPM Trend Adjustment Cap Rate
Inpatient HospitalMedical/Surgical 68.7 $ 1,661.97 $ 9.51 (20.0%) 54.9 6.3% $ 1,765.89 $ 8.09 102.6% 0.8873 $ 7.36Well Newborn - - - (10.0%) 0.0 0.6% 0.00 0.00 102.6% 0.8873 - Other Newborn - - 0.00 (10.0%) 0.0 1.6% 0.00 0.00 102.6% 0.8873 - Maternity Non-Delivery - - - (10.0%) 0.0 1.8% 0.00 0.00 102.6% 0.8873 - Psychiatric/Substance Abuse 3.0 782.16 0.20 (30.0%) 2.1 23.7% 967.82 0.17 102.6% 0.8873 0.16 Long Term Care - - - (20.0%) 0.0 6.7% 0.00 0.00 100.0% 0.8873 - Other Inpatient 1.3 7,523.62 0.82 (20.0%) 1.0 6.7% 8,029.12 0.70 102.6% 0.8873 0.64
Subtotal 73.0 $ 1,730.92 $ 10.53 (20.4%) 58.1 6.9% $ 1,849.86 $ 8.96 102.6% 0.8873 $ 8.16
Outpatient HospitalGeneral Outpatient 81.1 $ 391.61 $ 2.65 (10.0%) 73.0 (12.9%) $ 341.09 $ 2.07 101.3% 0.8873 $ 1.86Emergency Room 600.7 92.23 4.62 (20.0%) 480.6 9.7% 101.18 4.05 101.3% 0.8873 3.64 End-Stage Renal Disease 0.2 1,659.42 0.03 0.0% 0.2 0.0% 1,659.42 0.03 101.3% 0.8873 0.02
Subtotal 682.0 $ 128.28 $ 7.29 (18.8%) 553.7 4.0% $ 133.35 $ 6.15 101.3% 0.8873 $ 5.53
AncillariesPrescription Drugs 3,926.8 $ 38.81 $ 12.70 0.0% 3,926.8 (5.0%) $ 36.87 $ 12.07 116.5% 0.8873 $ 12.47Transportation 155.5 31.15 0.40 (20.0%) 124.4 0.0% 31.16 0.32 102.6% 0.8873 0.29 DME/Prosthetics/Orthotics 179.8 109.42 1.64 (30.0%) 125.9 2.5% 112.19 1.18 102.6% 0.8873 1.07 Home Health/Hospice 12.8 799.28 0.85 0.0% 12.8 0.0% 799.28 0.85 102.6% 0.8873 0.77 Other Ancillary 45.6 27.63 0.10 (10.0%) 41.0 0.1% 27.65 0.09 102.6% 0.8873 0.09
Subtotal 4,320.5 $ 43.61 $ 15.70 (2.1%) 4,230.9 (5.6%) $ 41.15 $ 14.51 114.2% 0.8873 $ 14.70
PhysicianSurgery 131.7 114.22 $ 1.25 (20.0%) 105.3 (3.1%) $ 110.71 $ 0.97 105.3% 0.8873 $ 0.91Anesthesia 38.0 157.90 0.50 (20.0%) 30.4 (0.1%) 157.80 0.40 105.3% 0.8873 0.37 Hospital Inpatient Visits 104.7 42.20 0.37 (20.0%) 83.7 6.9% 45.12 0.31 105.3% 0.8873 0.29 Office Visits/Consults 2,631.6 46.54 10.21 (10.0%) 2,368.5 (12.7%) 40.61 8.02 105.3% 0.8873 7.49 Well Baby Exams/Physical Exams 2,565.6 31.04 6.64 40.0% 3,591.8 0.4% 31.17 9.33 105.3% 0.8873 8.72 Emergency Room Visits 589.3 35.55 1.75 (20.0%) 471.5 1.4% 36.05 1.42 105.3% 0.8873 1.32 Clinic Visit/Services 2,793.8 27.23 6.34 (10.0%) 2,514.4 2.1% 27.81 5.83 105.3% 0.8873 5.45 Radiology and Pathology 3,309.9 8.07 2.23 (20.0%) 2,647.9 (7.1%) 7.49 1.65 105.3% 0.8873 1.55 Outpatient Behavioral Health 5.4 53.99 0.02 (30.0%) 3.7 (3.0%) 52.37 0.02 105.3% 0.8873 0.02 Maternity 8.4 49.99 0.04 0.0% 8.4 0.0% 49.99 0.04 105.3% 0.8873 0.03 Chiropractor 29.8 10.32 0.03 (40.0%) 17.9 (0.0%) 10.32 0.02 105.3% 0.8873 0.01 Podiatrist 9.9 32.71 0.03 0.0% 9.9 0.0% 32.71 0.03 105.3% 0.8873 0.03 Vision - EyeCare & Eyewear - - - (10.0%) 0.0 0.0% 0.00 0.00 105.3% 0.8873 - Other Professional 10,989.6 9.99 9.15 10.0% 12,088.6 6.1% 10.59 10.67 105.3% 0.8873 9.98 DMHDD / DASA 7.4 79.58 0.05 (30.0%) 5.2 (14.5%) 68.03 0.03 105.3% 0.8873 0.03 PCCM Fee 2.00
Subtotal 23,215.2 $ 19.95 $ 38.59 3.2% 23,947.4 (2.7%) $ 19.41 $ 38.73 105.3% 0.8873 $ 38.20
Total Claims/Benefit Cost 28,290.6 $ 30.59 $ 72.11 1.8% 28,790.1 (6.9%) $ 28.49 $ 68.35 106.5% 0.8873 $ 66.59Copay Adjustment - Administration 10.17
Capitation Rate $ 76.76
ATTACHMENT 4 Milliman, Inc.Page 43 of 66

3/26/20132:40 PM
State of IllinoisDepartment of Healthcare and Family Services
VMC Rate Development: Apr to Dec 2013Region: 5
Population: 6 yrs thru 13 yrsSFY11 Member Months: 1,340,125 June 2012 HMO Member Months: 1,810
Annual Cost Managed Care Annual Managed CostUtilization Per Utilization Utilization Care Cost Per Selection Proposed
Type of Service Per 1,000 Service PMPM Adjustment Per 1,000 Adjustment Service PMPM Trend Adjustment Cap Rate
Inpatient HospitalMedical/Surgical 43.1 $ 1,709.16 $ 6.14 (20.0%) 34.5 6.3% $ 1,816.03 $ 5.22 102.6% 0.7595 $ 4.07Well Newborn - - - (10.0%) 0.0 0.6% 0.00 0.00 102.6% 0.7595 - Other Newborn - - - (10.0%) 0.0 1.6% 0.00 0.00 102.6% 0.7595 - Maternity Non-Delivery - - - (10.0%) 0.0 1.8% 0.00 0.00 102.6% 0.7595 - Psychiatric/Substance Abuse 57.0 689.65 3.28 (30.0%) 39.9 23.7% 853.35 2.84 102.6% 0.7595 2.21 Long Term Care - - - (20.0%) 0.0 6.7% 0.00 0.00 100.0% 0.7595 - Other Inpatient - - - (20.0%) 0.0 6.7% 0.00 0.00 102.6% 0.7595 -
Subtotal 100.1 $ 1,128.34 $ 9.42 (25.7%) 74.4 15.2% $ 1,299.35 $ 8.06 102.6% 0.7595 $ 6.28
Outpatient HospitalGeneral Outpatient 77.2 $ 404.94 $ 2.60 (10.0%) 69.5 (12.9%) $ 352.70 $ 2.04 101.3% 0.7595 $ 1.57Emergency Room 378.9 100.50 3.17 (20.0%) 303.1 9.7% 110.25 2.78 101.3% 0.7595 2.14 End-Stage Renal Disease 0.4 1,571.55 0.05 0.0% 0.4 0.0% 1,571.55 0.05 101.3% 0.7595 0.04
Subtotal 456.4 $ 153.10 $ 5.82 (18.3%) 372.9 2.4% $ 156.78 $ 4.87 101.3% 0.7595 $ 3.75
AncillariesPrescription Drugs 3,645.4 $ 64.54 $ 19.61 0.0% 3,645.4 (5.0%) $ 61.31 $ 18.63 116.5% 0.7595 $ 16.49Transportation 149.9 26.65 0.33 (20.0%) 119.9 0.0% 26.66 0.27 102.6% 0.7595 0.21 DME/Prosthetics/Orthotics 147.8 116.05 1.43 (30.0%) 103.5 2.5% 118.98 1.03 102.6% 0.7595 0.80 Home Health/Hospice 8.2 541.72 0.37 0.0% 8.2 0.0% 541.72 0.37 102.6% 0.7595 0.29 Other Ancillary 16.0 25.31 0.03 (10.0%) 14.4 0.1% 25.32 0.03 102.6% 0.7595 0.02
Subtotal 3,967.3 $ 65.85 $ 21.77 (1.9%) 3,891.4 (4.8%) $ 62.66 $ 20.32 115.4% 0.7595 $ 17.80
PhysicianSurgery 107.8 124.12 $ 1.12 (20.0%) 86.2 (3.1%) $ 120.31 $ 0.86 105.3% 0.7595 $ 0.69Anesthesia 26.7 164.64 0.37 (20.0%) 21.4 (0.1%) 164.53 0.29 105.3% 0.7595 0.23 Hospital Inpatient Visits 107.2 38.78 0.35 (20.0%) 85.8 6.9% 41.47 0.30 105.3% 0.7595 0.24 Office Visits/Consults 1,879.7 47.32 7.41 (10.0%) 1,691.7 (12.7%) 41.29 5.82 105.3% 0.7595 4.66 Well Baby Exams/Physical Exams 1,171.1 37.23 3.63 40.0% 1,639.5 0.4% 37.39 5.11 105.3% 0.7595 4.09 Emergency Room Visits 375.9 36.46 1.14 (20.0%) 300.7 1.4% 36.97 0.93 105.3% 0.7595 0.74 Clinic Visit/Services 2,613.2 22.30 4.86 (10.0%) 2,351.9 2.1% 22.77 4.46 105.3% 0.7595 3.57 Radiology and Pathology 2,654.3 8.70 1.92 (20.0%) 2,123.4 (7.1%) 8.08 1.43 105.3% 0.7595 1.14 Outpatient Behavioral Health 65.0 46.10 0.25 (30.0%) 45.5 (3.0%) 44.72 0.17 105.3% 0.7595 0.14 Maternity 6.1 49.83 0.03 0.0% 6.1 0.0% 49.83 0.03 105.3% 0.7595 0.02 Chiropractor 41.5 9.98 0.03 (40.0%) 24.9 (0.0%) 9.98 0.02 105.3% 0.7595 0.02 Podiatrist 28.1 38.66 0.09 0.0% 28.1 0.0% 38.66 0.09 105.3% 0.7595 0.07 Vision - EyeCare & Eyewear - - - (10.0%) 0.0 0.0% 0.00 0.00 105.3% 0.7595 - Other Professional 9,768.5 3.48 2.83 10.0% 10,745.3 6.1% 3.69 3.30 105.3% 0.7595 2.64 DMHDD / DASA 124.1 84.04 0.87 (30.0%) 86.9 (14.5%) 71.84 0.52 105.3% 0.7595 0.42 PCCM Fee 2.00
Subtotal 18,969.1 $ 15.75 $ 24.90 1.4% 19,237.4 (7.6%) $ 14.56 $ 23.33 105.3% 0.7595 $ 20.67
Total Claims/Benefit Cost 23,492.9 $ 31.62 $ 61.91 0.4% 23,576.1 (8.9%) $ 28.80 $ 56.58 108.2% 0.7595 $ 48.50Copay Adjustment - Administration 7.41
Capitation Rate $ 55.91
ATTACHMENT 4 Milliman, Inc.Page 44 of 66

3/26/20132:40 PM
State of IllinoisDepartment of Healthcare and Family Services
VMC Rate Development: Apr to Dec 2013Region: 5
Population: 14 yrs thru 20 yrs - MaleSFY11 Member Months: 335,354 June 2012 HMO Member Months: 395
Annual Cost Managed Care Annual Managed CostUtilization Per Utilization Utilization Care Cost Per Selection Proposed
Type of Service Per 1,000 Service PMPM Adjustment Per 1,000 Adjustment Service PMPM Trend Adjustment Cap Rate
Inpatient HospitalMedical/Surgical 75.8 $ 1,830.52 $ 11.57 (20.0%) 60.7 6.3% $ 1,944.98 $ 9.83 104.0% 0.7423 $ 7.59Well Newborn - - - (10.0%) 0.0 0.6% 0.00 0.00 104.0% 0.7423 - Other Newborn - - - (10.0%) 0.0 1.6% 0.00 0.00 104.0% 0.7423 - Maternity Non-Delivery - - - (10.0%) 0.0 1.8% 0.00 0.00 104.0% 0.7423 - Psychiatric/Substance Abuse 198.1 619.32 10.22 (30.0%) 138.6 23.7% 766.33 8.85 104.0% 0.7423 6.83 Long Term Care 9.3 126.94 0.10 (20.0%) 7.4 6.7% 135.47 0.08 100.0% 0.7423 0.06 Other Inpatient - - - (20.0%) 0.0 6.7% 0.00 0.00 104.0% 0.7423 -
Subtotal 283.2 $ 927.46 $ 21.89 (27.0%) 206.8 17.5% $ 1,089.45 $ 18.77 104.0% 0.7423 $ 14.49
Outpatient HospitalGeneral Outpatient 135.6 $ 404.61 $ 4.57 (10.0%) 122.0 (12.9%) $ 352.41 $ 3.58 102.6% 0.7423 $ 2.73Emergency Room 425.6 122.85 4.36 (20.0%) 340.5 9.7% 134.77 3.82 102.6% 0.7423 2.91 End-Stage Renal Disease 1.5 1,137.79 0.14 0.0% 1.5 0.0% 1,137.79 0.14 102.6% 0.7423 0.11
Subtotal 562.7 $ 193.45 $ 9.07 (17.5%) 464.0 0.9% $ 195.25 $ 7.55 102.6% 0.7423 $ 5.75
AncillariesPrescription Drugs 3,848.8 $ 84.97 $ 27.25 0.0% 3,848.8 (5.0%) $ 80.72 $ 25.89 116.5% 0.7423 $ 22.39Transportation 273.0 40.89 0.93 (20.0%) 218.4 0.0% 40.90 0.74 101.3% 0.7423 0.56 DME/Prosthetics/Orthotics 130.9 115.90 1.26 (30.0%) 91.6 2.5% 118.83 0.91 101.3% 0.7423 0.68 Home Health/Hospice 16.6 160.56 0.22 0.0% 16.6 0.0% 160.56 0.22 101.3% 0.7423 0.17 Other Ancillary 6.6 25.81 0.01 (10.0%) 5.9 0.1% 25.83 0.01 101.3% 0.7423 0.01
Subtotal 4,275.8 $ 83.31 $ 29.68 (2.2%) 4,181.3 (4.3%) $ 79.72 $ 27.78 115.5% 0.7423 $ 23.81
PhysicianSurgery 153.0 147.88 $ 1.89 (20.0%) 122.4 (3.1%) $ 143.34 $ 1.46 104.0% 0.7423 $ 1.13Anesthesia 33.4 193.34 0.54 (20.0%) 26.7 (0.1%) 193.22 0.43 104.0% 0.7423 0.33 Hospital Inpatient Visits 275.8 37.86 0.87 (20.0%) 220.7 6.9% 40.48 0.74 104.0% 0.7423 0.57 Office Visits/Consults 1,419.5 47.52 5.62 (10.0%) 1,277.5 (12.7%) 41.47 4.41 104.0% 0.7423 3.41 Well Baby Exams/Physical Exams 873.8 43.16 3.14 40.0% 1,223.3 0.4% 43.34 4.42 104.0% 0.7423 3.41 Emergency Room Visits 413.0 39.10 1.35 (20.0%) 330.4 1.4% 39.65 1.09 104.0% 0.7423 0.84 Clinic Visit/Services 2,675.6 19.97 4.45 (10.0%) 2,408.1 2.1% 20.39 4.09 104.0% 0.7423 3.16 Radiology and Pathology 3,257.1 10.92 2.96 (20.0%) 2,605.7 (7.1%) 10.14 2.20 104.0% 0.7423 1.70 Outpatient Behavioral Health 146.2 47.74 0.58 (30.0%) 102.3 (3.0%) 46.31 0.39 104.0% 0.7423 0.30 Maternity 5.7 50.23 0.02 0.0% 5.7 0.0% 50.23 0.02 104.0% 0.7423 0.02 Chiropractor 47.9 10.01 0.04 (40.0%) 28.8 (0.0%) 10.01 0.02 104.0% 0.7423 0.02 Podiatrist 54.2 43.97 0.20 0.0% 54.2 0.0% 43.97 0.20 104.0% 0.7423 0.15 Vision - EyeCare & Eyewear - - - (10.0%) 0.0 0.0% 0.00 0.00 104.0% 0.7423 - Other Professional 9,203.3 3.16 2.42 10.0% 10,123.6 6.1% 3.35 2.83 104.0% 0.7423 2.18 DMHDD / DASA 786.8 132.99 8.72 (30.0%) 550.8 (14.5%) 113.69 5.22 104.0% 0.7423 4.03 PCCM Fee 2.00
Subtotal 19,345.3 $ 20.35 $ 32.80 (1.4%) 19,080.1 (14.9%) $ 17.32 $ 27.54 104.0% 0.7423 $ 23.26
Total Claims/Benefit Cost 24,467.0 $ 45.83 $ 93.45 (2.2%) 23,932.2 (10.7%) $ 40.94 $ 81.64 107.8% 0.7423 $ 67.31Copay Adjustment - Administration 10.28
Capitation Rate $ 77.59
ATTACHMENT 4 Milliman, Inc.Page 45 of 66

3/26/20132:40 PM
State of IllinoisDepartment of Healthcare and Family Services
VMC Rate Development: Apr to Dec 2013Region: 5
Population: 14 yrs thru 20 yrs - FemaleSFY11 Member Months: 357,579 June 2012 HMO Member Months: 459
Annual Cost Managed Care Annual Managed CostUtilization Per Utilization Utilization Care Cost Per Selection Proposed
Type of Service Per 1,000 Service PMPM Adjustment Per 1,000 Adjustment Service PMPM Trend Adjustment Cap Rate
Inpatient HospitalMedical/Surgical 63.2 $ 1,725.10 $ 9.08 (20.0%) 50.5 6.3% $ 1,832.97 $ 7.72 104.0% 0.8353 $ 6.70Well Newborn - - - (10.0%) 0.0 0.6% 0.00 0.00 104.0% 0.8353 - Other Newborn 0.1 1,022.58 0.00 (10.0%) 0.0 1.6% 1,039.09 0.00 104.0% 0.8353 0.00 Maternity Non-Delivery 23.2 826.01 1.60 (10.0%) 20.9 1.8% 840.71 1.46 104.0% 0.8353 1.27 Psychiatric/Substance Abuse 206.9 580.16 10.00 (30.0%) 144.9 23.7% 717.87 8.67 104.0% 0.8353 7.53 Long Term Care 2.5 118.86 0.02 (20.0%) 2.0 6.7% 126.85 0.02 100.0% 0.8353 0.02 Other Inpatient 1.0 9,143.02 0.73 (20.0%) 0.8 6.7% 9,757.32 0.62 104.0% 0.8353 0.54
Subtotal 296.8 $ 866.99 $ 21.44 (26.2%) 219.0 16.9% $ 1,013.25 $ 18.49 104.0% 0.8353 $ 16.06
Outpatient HospitalGeneral Outpatient 365.7 $ 247.32 $ 7.54 (10.0%) 329.2 (12.9%) $ 215.42 $ 5.91 102.6% 0.8353 $ 5.07Emergency Room 632.7 125.00 6.59 (20.0%) 506.2 9.7% 137.13 5.78 102.6% 0.8353 4.96 End-Stage Renal Disease 1.1 474.95 0.04 0.0% 1.1 0.0% 474.95 0.04 102.6% 0.8353 0.04
Subtotal 999.5 $ 170.13 $ 14.17 (16.3%) 836.4 (1.0%) $ 168.36 $ 11.73 102.6% 0.8353 $ 10.06
AncillariesPrescription Drugs 5,266.8 $ 53.67 $ 23.56 0.0% 5,266.8 (5.0%) $ 50.99 $ 22.38 116.5% 0.8353 $ 21.78Transportation 331.7 39.81 1.10 (20.0%) 265.4 0.0% 39.82 0.88 101.3% 0.8353 0.75 DME/Prosthetics/Orthotics 113.3 99.38 0.94 (30.0%) 79.3 2.5% 101.89 0.67 101.3% 0.8353 0.57 Home Health/Hospice 12.4 83.96 0.09 0.0% 12.4 0.0% 83.96 0.09 101.3% 0.8353 0.07 Other Ancillary 4.8 25.27 0.01 (10.0%) 4.3 0.1% 25.28 0.01 101.3% 0.8353 0.01
Subtotal 5,729.0 $ 53.82 $ 25.69 (1.8%) 5,628.2 (4.8%) $ 51.23 $ 24.03 115.5% 0.8353 $ 23.18
PhysicianSurgery 136.1 137.49 $ 1.56 (20.0%) 108.9 (3.1%) $ 133.27 $ 1.21 104.0% 0.8353 $ 1.05Anesthesia 88.3 275.84 2.03 (20.0%) 70.6 (0.1%) 275.66 1.62 104.0% 0.8353 1.41 Hospital Inpatient Visits 337.4 36.80 1.03 (20.0%) 269.9 6.9% 39.35 0.89 104.0% 0.8353 0.77 Office Visits/Consults 1,958.4 47.94 7.82 (10.0%) 1,762.6 (12.7%) 41.83 6.14 104.0% 0.8353 5.34 Well Baby Exams/Physical Exams 908.3 43.22 3.27 40.0% 1,271.6 0.4% 43.40 4.60 104.0% 0.8353 3.99 Emergency Room Visits 640.7 42.21 2.25 (20.0%) 512.6 1.4% 42.81 1.83 104.0% 0.8353 1.59 Clinic Visit/Services 3,287.1 31.88 8.73 (10.0%) 2,958.4 2.1% 32.56 8.03 104.0% 0.8353 6.97 Radiology and Pathology 7,878.2 11.54 7.58 (20.0%) 6,302.5 (7.1%) 10.72 5.63 104.0% 0.8353 4.89 Outpatient Behavioral Health 128.4 56.08 0.60 (30.0%) 89.9 (3.0%) 54.40 0.41 104.0% 0.8353 0.35 Maternity 38.2 47.91 0.15 0.0% 38.2 0.0% 47.91 0.15 104.0% 0.8353 0.13 Chiropractor 55.5 10.11 0.05 (40.0%) 33.3 (0.0%) 10.11 0.03 104.0% 0.8353 0.02 Podiatrist 48.1 44.99 0.18 0.0% 48.1 0.0% 44.99 0.18 104.0% 0.8353 0.16 Vision - EyeCare & Eyewear - - - (10.0%) 0.0 0.0% 0.00 0.00 104.0% 0.8353 - Other Professional 9,766.7 6.26 5.09 10.0% 10,743.4 6.1% 6.64 5.94 104.0% 0.8353 5.16 DMHDD / DASA 431.1 109.78 3.94 (30.0%) 301.8 (14.5%) 93.85 2.36 104.0% 0.8353 2.05 PCCM Fee 2.00
Subtotal 25,702.6 $ 20.68 $ 44.30 (4.6%) 24,511.8 (7.6%) $ 19.10 $ 39.02 104.0% 0.8353 $ 35.89
Total Claims/Benefit Cost 32,727.9 $ 38.72 $ 105.60 (4.7%) 31,195.4 (7.3%) $ 35.88 $ 93.27 106.8% 0.8353 $ 85.20Copay Adjustment - Administration 13.01
Capitation Rate $ 98.21
ATTACHMENT 4 Milliman, Inc.Page 46 of 66

3/26/20132:40 PM
State of IllinoisDepartment of Healthcare and Family Services
VMC Rate Development: Apr to Dec 2013Region: 5
Population: 21 yrs thru 44 yrs - MaleSFY11 Member Months: 164,128 June 2012 HMO Member Months: 321
Annual Cost Managed Care Annual Managed CostUtilization Per Utilization Utilization Care Cost Per Selection Proposed
Type of Service Per 1,000 Service PMPM Adjustment Per 1,000 Adjustment Service PMPM Trend Adjustment Cap Rate
Inpatient HospitalMedical/Surgical 250.1 $ 2,029.01 $ 42.29 (20.0%) 200.1 6.3% $ 2,155.88 $ 35.95 101.3% 0.8624 $ 31.41Well Newborn - - - (10.0%) 0.0 0.6% 0.00 0.00 101.3% 0.8624 - Other Newborn - - - (10.0%) 0.0 1.6% 0.00 0.00 101.3% 0.8624 - Maternity Non-Delivery 0.1 677.84 0.00 (10.0%) 0.0 1.8% 689.90 0.00 101.3% 0.8624 0.00 Psychiatric/Substance Abuse 76.8 660.59 4.23 (30.0%) 53.8 23.7% 817.40 3.66 101.3% 0.8624 3.20 Long Term Care 25.4 108.35 0.23 (20.0%) 20.3 6.7% 115.63 0.20 100.0% 0.8624 0.17 Other Inpatient 2.1 5,118.97 0.90 (20.0%) 1.7 6.7% 5,462.90 0.77 101.3% 0.8624 0.67
Subtotal 354.5 $ 1,613.19 $ 47.65 (22.2%) 275.9 9.4% $ 1,764.90 $ 40.58 101.3% 0.8624 $ 35.45
Outpatient HospitalGeneral Outpatient 338.0 $ 410.94 $ 11.57 (10.0%) 304.2 (12.9%) $ 357.93 $ 9.07 102.6% 0.8624 $ 8.03Emergency Room 694.6 145.67 8.43 (20.0%) 555.7 9.7% 159.80 7.40 102.6% 0.8624 6.55 End-Stage Renal Disease 10.3 1,094.30 0.94 0.0% 10.3 0.0% 1,094.30 0.94 102.6% 0.8624 0.83
Subtotal 1,042.9 $ 241.02 $ 20.95 (16.6%) 870.2 (0.4%) $ 240.13 $ 17.41 102.6% 0.8624 $ 15.42
AncillariesPrescription Drugs 8,417.7 $ 51.81 $ 36.34 0.0% 8,417.7 (5.0%) $ 49.22 $ 34.53 116.5% 0.8624 $ 34.70Transportation 331.3 39.91 1.10 (20.0%) 265.1 0.0% 39.92 0.88 101.3% 0.8624 0.77 DME/Prosthetics/Orthotics 301.0 79.64 2.00 (30.0%) 210.7 2.5% 81.65 1.43 101.3% 0.8624 1.25 Home Health/Hospice 46.6 121.76 0.47 0.0% 46.6 0.0% 121.76 0.47 101.3% 0.8624 0.41 Other Ancillary 5.5 26.44 0.01 (10.0%) 5.0 0.1% 26.46 0.01 101.3% 0.8624 0.01
Subtotal 9,102.2 $ 52.64 $ 39.93 (1.7%) 8,945.0 (4.9%) $ 50.07 $ 37.33 115.4% 0.8624 $ 37.14
PhysicianSurgery 303.0 184.02 $ 4.65 (20.0%) 242.4 (3.1%) $ 178.37 $ 3.60 102.6% 0.8624 $ 3.19Anesthesia 74.0 182.75 1.13 (20.0%) 59.2 (0.1%) 182.63 0.90 102.6% 0.8624 0.80 Hospital Inpatient Visits 562.7 42.81 2.01 (20.0%) 450.1 6.9% 45.78 1.72 102.6% 0.8624 1.52 Office Visits/Consults 1,947.4 50.47 8.19 (10.0%) 1,752.6 (12.7%) 44.04 6.43 102.6% 0.8624 5.69 Well Baby Exams/Physical Exams 87.1 91.71 0.67 40.0% 122.0 0.4% 92.09 0.94 102.6% 0.8624 0.83 Emergency Room Visits 671.6 44.23 2.48 (20.0%) 537.3 1.4% 44.85 2.01 102.6% 0.8624 1.78 Clinic Visit/Services 2,357.2 18.48 3.63 (10.0%) 2,121.5 2.1% 18.87 3.34 102.6% 0.8624 2.95 Radiology and Pathology 6,801.5 11.55 6.55 (20.0%) 5,441.2 (7.1%) 10.72 4.86 102.6% 0.8624 4.30 Outpatient Behavioral Health 80.7 47.22 0.32 (30.0%) 56.5 (3.0%) 45.80 0.22 102.6% 0.8624 0.19 Maternity 1.6 50.42 0.01 0.0% 1.6 0.0% 50.42 0.01 102.6% 0.8624 0.01 Chiropractor - - - (40.0%) 0.0 (0.0%) 0.00 0.00 102.6% 0.8624 - Podiatrist 27.7 42.29 0.10 0.0% 27.7 0.0% 42.29 0.10 102.6% 0.8624 0.09 Vision - EyeCare & Eyewear - - - (10.0%) 0.0 0.0% 0.00 0.00 102.6% 0.8624 - Other Professional 8,459.3 6.76 4.76 10.0% 9,305.2 6.1% 7.17 5.56 102.6% 0.8624 4.92 DMHDD / DASA 225.9 70.23 1.32 (30.0%) 158.1 (14.5%) 60.04 0.79 102.6% 0.8624 0.70 PCCM Fee 2.00
Subtotal 21,599.7 $ 19.89 $ 35.80 (6.1%) 20,275.5 (9.3%) $ 18.03 $ 30.47 102.6% 0.8624 $ 28.97
Total Claims/Benefit Cost 32,099.3 $ 53.95 $ 144.32 (5.4%) 30,366.6 (7.9%) $ 49.71 $ 125.79 106.0% 0.8624 $ 116.98Copay Adjustment (0.63) Administration 17.77
Capitation Rate $ 134.12
ATTACHMENT 4 Milliman, Inc.Page 47 of 66

3/26/20132:40 PM
State of IllinoisDepartment of Healthcare and Family Services
VMC Rate Development: Apr to Dec 2013Region: 5
Population: 21 yrs thru 44 yrs - FemaleSFY11 Member Months: 601,222 June 2012 HMO Member Months: 1,102
Annual Cost Managed Care Annual Managed CostUtilization Per Utilization Utilization Care Cost Per Selection Proposed
Type of Service Per 1,000 Service PMPM Adjustment Per 1,000 Adjustment Service PMPM Trend Adjustment Cap Rate
Inpatient HospitalMedical/Surgical 220.3 $ 1,776.11 $ 32.61 (20.0%) 176.3 6.3% $ 1,887.17 $ 27.72 101.3% 0.8624 $ 24.22Well Newborn - - - (10.0%) 0.0 0.6% 0.00 0.00 101.3% 0.8624 - Other Newborn - - 0.00 (10.0%) 0.0 1.6% 0.00 0.00 101.3% 0.8624 - Maternity Non-Delivery 49.4 860.41 3.55 (10.0%) 44.5 1.8% 875.72 3.25 101.3% 0.8624 2.84 Psychiatric/Substance Abuse 79.3 517.60 3.42 (30.0%) 55.5 23.7% 640.46 2.96 101.3% 0.8624 2.59 Long Term Care 18.6 124.70 0.19 (20.0%) 14.9 6.7% 133.08 0.17 100.0% 0.8624 0.14 Other Inpatient 1.7 5,583.03 0.77 (20.0%) 1.3 6.7% 5,958.14 0.66 101.3% 0.8624 0.58
Subtotal 369.4 $ 1,317.14 $ 40.54 (20.8%) 292.5 8.2% $ 1,425.76 $ 34.75 101.3% 0.8624 $ 30.37
Outpatient HospitalGeneral Outpatient 923.7 $ 267.53 $ 20.59 (10.0%) 831.3 (12.9%) $ 233.02 $ 16.14 102.6% 0.8624 $ 14.29Emergency Room 1,103.3 147.58 13.57 (20.0%) 882.7 9.7% 161.90 11.91 102.6% 0.8624 10.54 End-Stage Renal Disease 5.6 1,594.57 0.75 0.0% 5.6 0.0% 1,594.57 0.75 102.6% 0.8624 0.66
Subtotal 2,032.6 $ 206.10 $ 34.91 (15.4%) 1,719.6 (2.5%) $ 200.97 $ 28.80 102.6% 0.8624 $ 25.49
AncillariesPrescription Drugs 12,209.5 $ 48.44 $ 49.29 0.0% 12,209.5 (5.0%) $ 46.02 $ 46.82 116.5% 0.8624 $ 47.05Transportation 473.2 40.26 1.59 (20.0%) 378.6 0.0% 40.27 1.27 101.3% 0.8624 1.11 DME/Prosthetics/Orthotics 246.2 86.69 1.78 (30.0%) 172.3 2.5% 88.88 1.28 101.3% 0.8624 1.12 Home Health/Hospice 34.2 73.03 0.21 0.0% 34.2 0.0% 73.03 0.21 101.3% 0.8624 0.18 Other Ancillary 6.0 27.03 0.01 (10.0%) 5.4 0.1% 27.05 0.01 101.3% 0.8624 0.01
Subtotal 12,969.0 $ 48.92 $ 52.88 (1.3%) 12,799.9 (5.0%) $ 46.49 $ 49.59 115.7% 0.8624 $ 49.47
PhysicianSurgery 404.4 167.50 $ 5.64 (20.0%) 323.5 (3.1%) $ 162.36 $ 4.38 102.6% 0.8624 $ 3.87Anesthesia 229.9 231.91 4.44 (20.0%) 183.9 (0.1%) 231.76 3.55 102.6% 0.8624 3.14 Hospital Inpatient Visits 595.7 41.30 2.05 (20.0%) 476.5 6.9% 44.16 1.75 102.6% 0.8624 1.55 Office Visits/Consults 3,101.5 49.40 12.77 (10.0%) 2,791.4 (12.7%) 43.11 10.03 102.6% 0.8624 8.88 Well Baby Exams/Physical Exams 338.6 63.14 1.78 40.0% 474.0 0.4% 63.40 2.50 102.6% 0.8624 2.22 Emergency Room Visits 1,127.1 45.59 4.28 (20.0%) 901.7 1.4% 46.23 3.47 102.6% 0.8624 3.08 Clinic Visit/Services 3,773.4 33.72 10.60 (10.0%) 3,396.1 2.1% 34.44 9.75 102.6% 0.8624 8.63 Radiology and Pathology 16,545.0 13.30 18.34 (20.0%) 13,236.0 (7.1%) 12.35 13.62 102.6% 0.8624 12.06 Outpatient Behavioral Health 151.7 43.19 0.55 (30.0%) 106.2 (3.0%) 41.90 0.37 102.6% 0.8624 0.33 Maternity 56.0 46.00 0.21 0.0% 56.0 0.0% 46.00 0.21 102.6% 0.8624 0.19 Chiropractor - - - (40.0%) 0.0 (0.0%) 0.00 0.00 102.6% 0.8624 - Podiatrist 18.1 40.97 0.06 0.0% 18.1 0.0% 40.97 0.06 102.6% 0.8624 0.05 Vision - EyeCare & Eyewear - - - (10.0%) 0.0 0.0% 0.00 0.00 102.6% 0.8624 - Other Professional 9,973.0 13.15 10.93 10.0% 10,970.3 6.1% 13.95 12.75 102.6% 0.8624 11.29 DMHDD / DASA 320.1 76.41 2.04 (30.0%) 224.1 (14.5%) 65.32 1.22 102.6% 0.8624 1.08 PCCM Fee 2.00
Subtotal 36,634.5 $ 24.14 $ 73.71 (9.5%) 33,157.8 (4.5%) $ 23.04 $ 63.67 102.6% 0.8624 $ 58.37
Total Claims/Benefit Cost 52,005.6 $ 46.62 $ 202.04 (7.8%) 47,969.8 (5.1%) $ 44.23 $ 176.82 106.0% 0.8624 $ 163.70Copay Adjustment (1.46) Administration 24.78
Capitation Rate $ 187.02
ATTACHMENT 4 Milliman, Inc.Page 48 of 66

3/26/20132:40 PM
State of IllinoisDepartment of Healthcare and Family Services
VMC Rate Development: Apr to Dec 2013Region: 5
Population: 45 + YearsSFY11 Member Months: 213,484 June 2012 HMO Member Months: 247
Annual Cost Managed Care Annual Managed CostUtilization Per Utilization Utilization Care Cost Per Selection Proposed
Type of Service Per 1,000 Service PMPM Adjustment Per 1,000 Adjustment Service PMPM Trend Adjustment Cap Rate
Inpatient HospitalMedical/Surgical 489.8 $ 1,963.98 $ 80.16 (20.0%) 391.8 0.0% $ 1,963.98 $ 64.13 101.3% 0.8624 $ 56.03Well Newborn - - - (10.0%) 0.0 0.0% 0.00 0.00 101.3% 0.8624 - Other Newborn - - - (10.0%) 0.0 0.0% 0.00 0.00 101.3% 0.8624 - Maternity Non-Delivery 0.5 778.59 0.03 (10.0%) 0.4 0.0% 778.59 0.03 101.3% 0.8624 0.02 Psychiatric/Substance Abuse 73.6 535.72 3.29 (30.0%) 51.5 0.0% 535.72 2.30 101.3% 0.8624 2.01 Long Term Care 106.9 134.47 1.20 (20.0%) 85.5 0.0% 134.47 0.96 100.0% 0.8624 0.83 Other Inpatient 2.8 1,413.04 0.33 (20.0%) 2.2 0.0% 1,413.04 0.26 101.3% 0.8624 0.23
Subtotal 673.5 $ 1,514.48 $ 84.99 (21.1%) 531.5 0.9% $ 1,527.97 $ 67.67 101.3% 0.8624 $ 59.12
Outpatient HospitalGeneral Outpatient 834.8 $ 360.26 $ 25.06 (10.0%) 751.3 0.0% $ 360.26 $ 22.56 102.6% 0.8624 $ 19.97Emergency Room 593.5 175.02 8.66 (20.0%) 474.8 0.0% 175.02 6.92 102.6% 0.8624 6.13 End-Stage Renal Disease 29.7 958.38 2.37 0.0% 29.7 0.0% 958.38 2.37 102.6% 0.8624 2.10
Subtotal 1,458.0 $ 297.03 $ 36.09 (13.9%) 1,255.8 2.5% $ 304.35 $ 31.85 102.6% 0.8624 $ 28.20
AncillariesPrescription Drugs 20,535.1 $ 51.22 $ 87.65 0.0% 20,535.1 (5.0%) $ 48.66 $ 83.27 116.5% 0.8624 $ 83.68Transportation 940.9 22.79 1.79 (20.0%) 752.7 0.0% 22.79 1.43 101.3% 0.8624 1.25 DME/Prosthetics/Orthotics 761.7 67.04 4.26 (30.0%) 533.2 0.0% 67.04 2.98 101.3% 0.8624 2.60 Home Health/Hospice 136.3 88.37 1.00 0.0% 136.3 0.0% 88.37 1.00 101.3% 0.8624 0.88 Other Ancillary 15.8 26.05 0.03 (10.0%) 14.2 0.0% 26.05 0.03 101.3% 0.8624 0.03
Subtotal 22,389.8 $ 50.77 $ 94.73 (1.9%) 21,971.5 (4.6%) $ 48.45 $ 88.71 115.6% 0.8624 $ 88.44
PhysicianSurgery 602.3 200.50 $ 10.06 (20.0%) 481.8 0.0% $ 200.50 $ 8.05 102.6% 0.8624 $ 7.13Anesthesia 148.8 173.80 2.15 (20.0%) 119.0 0.0% 173.80 1.72 102.6% 0.8624 1.53 Hospital Inpatient Visits 945.5 42.62 3.36 (20.0%) 756.4 0.0% 42.62 2.69 102.6% 0.8624 2.38 Office Visits/Consults 3,546.2 51.11 15.10 (10.0%) 3,191.6 0.0% 51.11 13.59 102.6% 0.8624 12.03 Well Baby Exams/Physical Exams 172.9 86.04 1.24 40.0% 242.1 0.0% 86.04 1.74 102.6% 0.8624 1.54 Emergency Room Visits 591.6 49.29 2.43 (20.0%) 473.2 0.0% 49.29 1.94 102.6% 0.8624 1.72 Clinic Visit/Services 2,799.9 30.64 7.15 (10.0%) 2,519.9 0.0% 30.64 6.43 102.6% 0.8624 5.70 Radiology and Pathology 13,829.9 12.38 14.27 (20.0%) 11,063.9 0.0% 12.38 11.41 102.6% 0.8624 10.10 Outpatient Behavioral Health 136.4 40.56 0.46 (30.0%) 95.5 0.0% 40.56 0.32 102.6% 0.8624 0.29 Maternity 1.1 50.27 0.00 0.0% 1.1 0.0% 50.27 0.00 102.6% 0.8624 0.00 Chiropractor - - - (40.0%) 0.0 0.0% 0.00 0.00 102.6% 0.8624 - Podiatrist 82.2 37.70 0.26 0.0% 82.2 0.0% 37.70 0.26 102.6% 0.8624 0.23 Vision - EyeCare & Eyewear - - - (10.0%) 0.0 0.0% 0.00 0.00 102.6% 0.8624 - Other Professional 9,486.3 14.48 11.45 10.0% 10,434.9 0.0% 14.48 12.59 102.6% 0.8624 11.15 DMHDD / DASA 223.8 68.55 1.28 (30.0%) 156.7 0.0% 68.55 0.89 102.6% 0.8624 0.79 PCCM Fee 2.00
Subtotal 32,567.0 $ 25.50 $ 69.22 (9.1%) 29,618.5 (2.0%) $ 24.98 $ 61.65 0.8624 $ 56.58
Total Claims/Benefit Cost 57,088.2 $ 59.91 $ 285.03 (6.5%) 53,377.2 (6.2%) $ 56.18 $ 249.89 0.8624 $ 232.33Copay Adjustment (1.23) Administration 35.30
Capitation Rate $ 266.40
ATTACHMENT 4 Milliman, Inc.Page 49 of 66

3/26/20132:40 PM
State of IllinoisDepartment of Healthcare and Family Services
VMC Rate Development: Apr to Dec 2013Region: 5
Population: CompositeSFY11 Member Months: 4,160,616 June 2012 HMO Member Months: 6,053
Annual Cost Managed Care Annual Managed CostUtilization Per Utilization Utilization Care Cost Per Selection Proposed
Type of Service Per 1,000 Service PMPM Adjustment Per 1,000 Adjustment Service PMPM Trend Adjustment Cap Rate
Inpatient HospitalMedical/Surgical 151.5 $ 1,798.15 $ 22.70 (20.0%) 121.2 5.4% $ 1,894.38 $ 19.13 103.0% 0.8736 $ 17.21Well Newborn 0.2 2,444.18 0.05 (10.0%) 0.2 0.6% 2,459.64 0.04 108.1% 0.9000 0.04 Other Newborn 174.6 1,399.72 20.36 (10.0%) 157.1 1.6% 1,422.29 18.62 108.0% 0.9016 18.13 Maternity Non-Delivery 10.8 854.61 0.77 (10.0%) 9.7 1.8% 869.80 0.70 101.7% 0.8581 0.61 Psychiatric/Substance Abuse 67.8 607.10 3.43 (30.0%) 47.4 22.8% 745.57 2.95 102.8% 0.8033 2.44 Long Term Care 9.9 126.81 0.10 (20.0%) 7.9 3.6% 131.35 0.09 100.0% 0.8543 0.07 Other Inpatient 0.8 5,954.55 0.41 (20.0%) 0.7 3.4% 6,159.90 0.34 102.2% 0.8673 0.30
Subtotal 415.6 $ 1,380.81 $ 47.82 (17.2%) 344.3 5.7% $ 1,459.63 $ 41.87 105.2% 0.8812 $ 38.80
Outpatient HospitalGeneral Outpatient 314.8 $ 305.38 $ 8.01 (10.0%) 283.3 (11.3%) $ 271.01 $ 6.40 102.4% 0.8545 $ 5.60Emergency Room 679.3 119.29 6.75 (20.0%) 543.4 9.2% 130.26 5.90 102.1% 0.8603 5.18 End-Stage Renal Disease 3.1 1,211.23 0.32 0.0% 3.1 0.0% 1,211.23 0.32 102.6% 0.8559 0.28
Subtotal 997.3 $ 181.48 $ 15.08 (16.8%) 829.9 0.5% $ 182.41 $ 12.62 102.2% 0.8572 $ 11.06
AncillariesPrescription Drugs 6,540.9 $ 51.11 $ 27.86 0.0% 6,540.9 (5.0%) $ 48.55 $ 26.47 116.5% 0.8414 $ 25.95Transportation 282.0 36.33 0.85 (20.0%) 225.6 0.0% 36.34 0.68 101.8% 0.8544 0.59 DME/Prosthetics/Orthotics 230.8 93.10 1.79 (30.0%) 161.6 2.3% 95.23 1.28 102.1% 0.8565 1.12 Home Health/Hospice 28.7 209.52 0.50 0.0% 28.7 (0.0%) 209.52 0.50 102.3% 0.8727 0.45 Other Ancillary 21.7 29.75 0.05 (10.0%) 19.6 0.1% 29.76 0.05 102.5% 0.8818 0.04
Subtotal 7,104.1 $ 52.46 $ 31.06 (1.8%) 6,976.3 (5.0%) $ 49.85 $ 28.98 115.3% 0.8428 $ 28.15
PhysicianSurgery 226.2 152.51 $ 2.88 (20.0%) 181.0 (2.6%) $ 148.50 $ 2.24 103.4% 0.8573 $ 1.99Anesthesia 81.5 213.07 1.45 (20.0%) 65.2 (0.1%) 212.94 1.16 103.3% 0.8575 1.03 Hospital Inpatient Visits 554.0 70.76 3.27 (20.0%) 443.2 6.6% 75.46 2.79 103.1% 0.8923 2.56 Office Visits/Consults 2,527.3 48.13 10.14 (10.0%) 2,274.5 (12.0%) 42.38 8.03 104.2% 0.8595 7.19 Well Baby Exams/Physical Exams 2,353.5 31.60 6.20 40.0% 3,294.8 0.4% 31.73 8.71 104.5% 0.8916 8.12 Emergency Room Visits 679.2 40.59 2.30 (20.0%) 543.3 1.3% 41.14 1.86 103.9% 0.8638 1.67 Clinic Visit/Services 2,987.9 30.72 7.65 (10.0%) 2,689.2 2.0% 31.35 7.02 104.1% 0.8631 6.31 Radiology and Pathology 7,076.6 11.10 6.55 (20.0%) 5,661.3 (6.5%) 10.38 4.90 103.3% 0.8567 4.33 Outpatient Behavioral Health 77.1 46.28 0.30 (30.0%) 54.0 (2.8%) 44.98 0.20 103.7% 0.8171 0.17 Maternity 18.2 47.41 0.07 0.0% 18.2 (0.0%) 47.41 0.07 103.6% 0.8556 0.06 Chiropractor 27.6 10.11 0.02 (40.0%) 16.6 (0.0%) 10.10 0.01 104.9% 0.8165 0.01 Podiatrist 26.1 40.23 0.09 0.0% 26.1 (0.0%) 40.22 0.09 104.1% 0.8124 0.07 Vision - EyeCare & Eyewear - - - 0.0% 0.0 0.0% 0.00 0.00 104.1% - Other Professional 9,873.1 8.15 6.70 10.0% 10,860.4 5.6% 8.61 7.79 104.1% 0.8702 7.05 DMHDD / DASA 201.8 96.91 1.63 (30.0%) 141.3 (14.1%) 83.30 0.98 103.8% 0.7992 0.81 PCCM Fee 2.00
Subtotal 26,710.1 $ 22.12 $ 49.23 (1.7%) 26,269.0 (5.3%) $ 20.95 $ 45.86 104.0% 0.9101 $ 43.39
Total Claims/Benefit Cost 35,227.0 $ 48.78 $ 143.19 (2.3%) 34,419.4 (7.6%) $ 45.09 $ 129.33 106.7% 0.8796 $ 121.40Copay Adjustment (0.35) Administration 18.49
Capitation Rate $ 139.54
ATTACHMENT 4 Milliman, Inc.Page 50 of 66

3/26/20132:40 PM
State of IllinoisDepartment of Healthcare and Family Services
VMC Rate Development: Apr to Dec 2013Region: Statewide
Population: 0 thru 90 DaysSFY11 Member Months: 310,807 HMO Member Months: 4,285
Annual Cost Managed Care Annual Managed CostUtilization Per Utilization Utilization Care Cost Per Selection Proposed
Type of Service Per 1,000 Service PMPM Adjustment Per 1,000 Adjustment Service PMPM Trend Adjustment Cap Rate
Inpatient HospitalMedical/Surgical 984.4 $ 2,091.59 $ 171.58 (20.0%) 787.5 6.3% $ 2,222.38 $ 145.84 108.1% 0.9000 $ 141.85Well Newborn 190.8 2,609.37 41.48 (10.0%) 171.7 0.6% 2,625.88 37.57 108.1% 0.9000 36.54 Other Newborn 8,397.1 1,674.72 1,171.89 (10.0%) 7,557.4 1.6% 1,701.75 1,071.73 108.1% 0.9000 1,042.38 Maternity Non-Delivery - - - 0.0% 0.0 0.0% 0.00 0.00 108.1% 0.9000 - Psychiatric/Substance Abuse 3.5 1,837.59 0.54 (30.0%) 2.5 23.7% 2,273.78 0.47 108.1% 0.9000 0.45 Long Term Care - - - 0.0% 0.0 0.0% 0.00 0.00 108.1% 0.9000 - Other Inpatient 1.3 7,482.15 0.81 (20.0%) 1.0 6.7% 7,984.86 0.69 108.1% 0.9000 0.67
Subtotal 9,577.0 $ 1,737.03 $ 1,386.29 (11.0%) 8,520.0 1.9% $ 1,769.42 $ 1,256.30 108.1% 0.9000 $ 1,221.89
Outpatient HospitalGeneral Outpatient 316.3 $ 355.31 $ 9.37 (10.0%) 284.7 (12.9%) $ 309.47 $ 7.34 101.3% 0.9000 $ 6.69Emergency Room 957.9 119.46 9.54 (20.0%) 766.3 9.7% 131.05 8.37 101.3% 0.9000 7.63 End-Stage Renal Disease 0.0 535.19 0.00 0.0% 0.0 0.0% 535.19 0.00 101.3% 0.9000 0.00
Subtotal 1,274.2 $ 178.01 $ 18.90 (17.5%) 1,051.0 0.8% $ 179.38 $ 15.71 101.3% 0.9000 $ 14.33
AncillariesPrescription Drugs 4,419.8 $ 25.49 $ 9.39 0.0% 4,419.8 (18.8%) $ 20.69 $ 7.62 116.5% 0.9000 $ 7.99Transportation 347.0 62.95 1.82 (20.0%) 277.6 0.0% 62.96 1.46 102.6% 0.9000 1.35 DME/Prosthetics/Orthotics 272.4 78.76 1.79 (30.0%) 190.7 2.5% 80.75 1.28 102.6% 0.9000 1.19 Home Health/Hospice 112.5 93.70 0.88 0.0% 112.5 (0.0%) 93.70 0.88 102.6% 0.9000 0.81 Other Ancillary 36.8 46.30 0.14 (10.0%) 33.1 0.1% 46.33 0.13 102.6% 0.9000 0.12
Subtotal 5,188.4 $ 32.42 $ 14.02 (3.0%) 5,033.6 (16.4%) $ 27.09 $ 11.37 112.0% 0.9000 $ 11.45
PhysicianSurgery 674.6 147.87 $ 8.31 (20.0%) 539.7 (3.1%) $ 143.34 $ 6.45 102.6% 0.9000 $ 5.96Anesthesia 71.8 289.85 1.73 (20.0%) 57.5 (0.1%) 289.67 1.39 102.6% 0.9000 1.28 Hospital Inpatient Visits 10,233.6 107.13 91.36 (20.0%) 8,186.8 6.9% 114.56 78.16 102.6% 0.9000 72.20 Office Visits/Consults 2,405.8 50.07 10.04 (10.0%) 2,165.2 (12.7%) 43.69 7.88 102.6% 0.9000 7.28 Well Baby Exams/Physical Exams 13,542.4 35.33 39.87 40.0% 18,959.3 0.4% 35.48 56.06 102.6% 0.9000 51.79 Emergency Room Visits 883.9 40.45 2.98 (20.0%) 707.1 1.4% 41.01 2.42 102.6% 0.9000 2.23 Clinic Visit/Services 4,063.5 108.39 36.70 (10.0%) 3,657.1 2.1% 110.69 33.74 102.6% 0.9000 31.17 Radiology and Pathology 24,040.9 5.40 10.82 (20.0%) 19,232.7 (7.1%) 5.02 8.04 102.6% 0.9000 7.43 Outpatient Behavioral Health 3.0 51.85 0.01 (30.0%) 2.1 (3.0%) 50.29 0.01 102.6% 0.9000 0.01 Maternity 6.9 49.94 0.03 0.0% 6.9 0.0% 49.94 0.03 102.6% 0.9000 0.03 Chiropractor 1.9 10.35 0.00 (40.0%) 1.1 (0.1%) 10.35 0.00 102.6% 0.9000 0.00 Podiatrist 3.4 48.41 0.01 0.0% 3.4 0.0% 48.41 0.01 102.6% 0.9000 0.01 Vision - EyeCare & Eyewear - - - 0.0% 0.0 0.0% 0.00 0.00 102.6% 0.9000 - Other Professional 3,273.5 26.46 7.22 10.0% 3,600.8 6.0% 28.06 8.42 102.6% 0.9000 7.78 DMHDD / DASA 0.0 81.96 0.00 (30.0%) 0.0 (14.5%) 70.07 0.00 102.6% 0.9000 0.00 PCCM Fee 2.00
Subtotal 59,205.0 $ 42.38 $ 209.09 (3.5%) 57,119.8 0.4% $ 42.56 $ 202.59 102.6% 0.9000 $ 189.16
Total Claims/Benefit Cost 75,244.7 $ 259.68 $ 1,628.30 (4.7%) 71,724.5 (4.3%) $ 248.61 $ 1,485.97 107.3% 0.9000 $ 1,436.83Copay Adjustment - Administration 219.46
Capitation Rate $ 1,656.29
ATTACHMENT 4 Milliman, Inc.Page 51 of 66

3/26/20132:40 PM
State of IllinoisDepartment of Healthcare and Family Services
VMC Rate Development: Apr to Dec 2013Region: Statewide
Population: 91 Days thru 1 yearSFY11 Member Months: 1,437,583 HMO Member Months: 15,425
Annual Cost Managed Care Annual Managed CostUtilization Per Utilization Utilization Care Cost Per Selection Proposed
Type of Service Per 1,000 Service PMPM Adjustment Per 1,000 Adjustment Service PMPM Trend Adjustment Cap Rate
Inpatient HospitalMedical/Surgical 291.2 $ 2,026.49 $ 49.17 (20.0%) 232.9 6.3% $ 2,153.27 $ 41.80 102.6% 1.0000 $ 42.90Well Newborn - - - 0.0% 0.0 0.0% 0.00 0.00 102.6% 1.0000 - Other Newborn 60.7 2,233.21 11.30 (10.0%) 54.6 1.6% 2,269.41 10.33 102.6% 1.0000 10.60 Maternity Non-Delivery - - - 0.0% 0.0 0.0% 0.00 0.00 102.6% 1.0000 - Psychiatric/Substance Abuse 0.1 585.82 0.00 (30.0%) 0.1 23.8% 724.96 0.00 102.6% 1.0000 0.00 Long Term Care - - - 0.0% 0.0 0.0% 0.00 0.00 102.6% 1.0000 - Other Inpatient 0.7 11,017.76 0.69 (20.0%) 0.6 6.1% 11,685.34 0.58 102.6% 1.0000 0.60
Subtotal 352.7 $ 2,080.70 $ 61.16 (18.3%) 288.2 5.5% $ 2,194.70 $ 52.71 102.6% 1.0000 $ 54.11
Outpatient HospitalGeneral Outpatient 150.2 $ 365.22 $ 4.57 (10.0%) 135.2 (12.9%) $ 318.10 $ 3.58 101.3% 1.0000 $ 3.63Emergency Room 1,089.8 102.96 9.35 (20.0%) 871.8 9.7% 112.94 8.21 101.3% 1.0000 8.31 End-Stage Renal Disease 0.4 717.86 0.02 0.0% 0.4 (0.0%) 717.84 0.02 101.3% 1.0000 0.02
Subtotal 1,240.4 $ 134.91 $ 13.94 (18.8%) 1,007.4 4.3% $ 140.71 $ 11.81 101.3% 1.0000 $ 11.97
AncillariesPrescription Drugs 7,092.8 $ 30.93 $ 18.28 0.0% 7,092.8 (18.9%) $ 25.07 $ 14.82 116.5% 1.0000 $ 17.27Transportation 216.6 42.05 0.76 (20.0%) 173.3 0.0% 42.06 0.61 102.6% 1.0000 0.62 DME/Prosthetics/Orthotics 336.4 86.34 2.42 (30.0%) 235.5 2.5% 88.52 1.74 102.6% 1.0000 1.78 Home Health/Hospice 66.2 288.18 1.59 0.0% 66.2 0.0% 288.19 1.59 102.6% 1.0000 1.63 Other Ancillary 38.1 27.09 0.09 (10.0%) 34.3 0.0% 27.10 0.08 102.6% 1.0000 0.08
Subtotal 7,750.1 $ 35.82 $ 23.14 (1.9%) 7,602.1 (17.0%) $ 29.72 $ 18.83 113.6% 1.0000 $ 21.38
PhysicianSurgery 187.7 135.82 $ 2.12 (20.0%) 150.2 (3.1%) $ 131.64 $ 1.65 105.3% 1.0000 $ 1.74Anesthesia 49.3 195.16 0.80 (20.0%) 39.4 (0.1%) 195.03 0.64 105.3% 1.0000 0.68 Hospital Inpatient Visits 496.1 85.19 3.52 (20.0%) 396.9 6.9% 91.10 3.01 105.3% 1.0000 3.17 Office Visits/Consults 2,821.9 46.77 11.00 (10.0%) 2,539.7 (12.7%) 40.82 8.64 105.3% 1.0000 9.10 Well Baby Exams/Physical Exams 7,160.6 26.79 15.99 40.0% 10,024.9 0.4% 26.90 22.47 105.3% 1.0000 23.67 Emergency Room Visits 1,033.9 36.33 3.13 (20.0%) 827.1 1.4% 36.84 2.54 105.3% 1.0000 2.67 Clinic Visit/Services 5,664.1 43.51 20.54 (10.0%) 5,097.7 2.1% 44.44 18.88 105.3% 1.0000 19.88 Radiology and Pathology 5,181.9 8.02 3.46 (20.0%) 4,145.5 (7.2%) 7.45 2.57 105.3% 1.0000 2.71 Outpatient Behavioral Health 1.6 52.16 0.01 (30.0%) 1.2 (3.0%) 50.61 0.00 105.3% 1.0000 0.01 Maternity 8.3 50.10 0.03 0.0% 8.3 (0.0%) 50.09 0.03 105.3% 1.0000 0.04 Chiropractor 5.8 10.34 0.00 (40.0%) 3.5 (0.0%) 10.34 0.00 105.3% 1.0000 0.00 Podiatrist 7.3 36.35 0.02 0.0% 7.3 (0.0%) 36.35 0.02 105.3% 1.0000 0.02 Vision - EyeCare & Eyewear - - - 0.0% 0.0 0.0% 0.00 0.00 105.3% 1.0000 - Other Professional 9,351.3 14.47 11.27 10.0% 10,286.4 6.1% 15.34 13.15 105.3% 1.0000 13.86 DMHDD / DASA 0.0 89.97 0.00 (30.0%) 0.0 (14.5%) 76.92 0.00 105.3% 1.0000 0.00 PCCM Fee 2.00
Subtotal 31,969.9 $ 26.99 $ 71.91 4.9% 33,528.0 (2.4%) $ 26.35 $ 73.62 105.3% 1.0000 $ 79.55
Total Claims/Benefit Cost 41,313.0 $ 49.42 $ 170.15 2.7% 42,425.7 (10.2%) $ 44.40 $ 156.97 105.1% 1.0000 $ 167.01Copay Adjustment - Administration 25.51
Capitation Rate $ 192.52
ATTACHMENT 4 Milliman, Inc.Page 52 of 66

3/26/20132:40 PM
State of IllinoisDepartment of Healthcare and Family Services
VMC Rate Development: Apr to Dec 2013Region: Statewide
Population: 2 yrs thru 5 yrsSFY11 Member Months: 2,971,333 HMO Member Months: 41,031
Annual Cost Managed Care Annual Managed CostUtilization Per Utilization Utilization Care Cost Per Selection Proposed
Type of Service Per 1,000 Service PMPM Adjustment Per 1,000 Adjustment Service PMPM Trend Adjustment Cap Rate
Inpatient HospitalMedical/Surgical 80.8 $ 1,866.13 $ 12.57 (20.0%) 64.6 6.4% $ 1,986.27 $ 10.70 102.6% 0.8873 $ 9.75Well Newborn - - - 0.0% 0.0 0.0% 0.00 0.00 102.6% 0.8873 - Other Newborn 0.0 4,808.98 0.02 (10.0%) 0.0 1.3% 4,872.99 0.02 102.6% 0.8873 0.02 Maternity Non-Delivery - - 0.00 0.0% 0.0 0.0% 0.00 0.00 102.6% 0.8873 - Psychiatric/Substance Abuse 3.1 803.85 0.20 (30.0%) 2.1 23.4% 992.03 0.18 102.6% 0.8873 0.16 Long Term Care - - - 0.0% 0.0 0.0% 0.00 0.00 102.6% 0.8873 - Other Inpatient 1.6 9,480.53 1.30 (20.0%) 1.3 6.5% 10,099.60 1.11 102.6% 0.8873 1.01
Subtotal 85.6 $ 1,976.70 $ 14.09 (20.4%) 68.1 6.9% $ 2,113.92 $ 12.00 102.6% 0.8873 $ 10.93
Outpatient HospitalGeneral Outpatient 88.5 $ 458.88 $ 3.38 (10.0%) 79.6 (12.7%) $ 400.53 $ 2.66 101.3% 0.8873 $ 2.39Emergency Room 577.7 105.06 5.06 (20.0%) 462.1 10.0% 115.54 4.45 101.3% 0.8873 4.00 End-Stage Renal Disease 0.0 1,635.38 0.00 0.0% 0.0 (32.8%) 1,099.66 0.00 101.3% 0.8873 0.00
Subtotal 666.1 $ 152.07 $ 8.44 (18.7%) 541.8 3.5% $ 157.44 $ 7.11 101.3% 0.8873 $ 6.39
AncillariesPrescription Drugs 4,845.4 $ 33.61 $ 13.57 0.0% 4,845.4 (18.8%) $ 27.29 $ 11.02 116.5% 0.8873 $ 11.39Transportation 132.6 33.95 0.38 (20.0%) 106.1 0.6% 34.16 0.30 102.6% 0.8873 0.28 DME/Prosthetics/Orthotics 222.3 120.54 2.23 (30.0%) 155.6 3.0% 124.14 1.61 102.6% 0.8873 1.47 Home Health/Hospice 12.0 685.09 0.69 0.0% 12.0 0.3% 686.82 0.69 102.6% 0.8873 0.63 Other Ancillary 49.3 26.41 0.11 (10.0%) 44.4 (0.0%) 26.40 0.10 102.6% 0.8873 0.09
Subtotal 5,261.6 $ 38.71 $ 16.97 (1.9%) 5,163.5 (17.7%) $ 31.88 $ 13.72 113.8% 0.8873 $ 13.85
PhysicianSurgery 120.0 112.83 $ 1.13 (20.0%) 96.0 (3.2%) $ 109.21 $ 0.87 105.3% 0.8873 $ 0.82Anesthesia 34.1 170.39 0.48 (20.0%) 27.3 0.1% 170.48 0.39 105.3% 0.8873 0.36 Hospital Inpatient Visits 106.8 40.22 0.36 (20.0%) 85.4 6.8% 42.95 0.31 105.3% 0.8873 0.29 Office Visits/Consults 2,169.7 46.27 8.37 (10.0%) 1,952.7 (13.1%) 40.20 6.54 105.3% 0.8873 6.11 Well Baby Exams/Physical Exams 2,188.2 34.27 6.25 40.0% 3,063.5 0.2% 34.33 8.76 105.3% 0.8873 8.19 Emergency Room Visits 537.0 35.52 1.59 (20.0%) 429.6 1.4% 36.02 1.29 105.3% 0.8873 1.21 Clinic Visit/Services 4,496.4 29.94 11.22 (10.0%) 4,046.8 3.1% 30.87 10.41 105.3% 0.8873 9.73 Radiology and Pathology 3,894.5 7.39 2.40 (20.0%) 3,115.6 (7.1%) 6.87 1.78 105.3% 0.8873 1.67 Outpatient Behavioral Health 9.5 51.89 0.04 (30.0%) 6.7 (2.6%) 50.53 0.03 105.3% 0.8873 0.03 Maternity 6.0 50.22 0.03 0.0% 6.0 (0.7%) 49.88 0.03 105.3% 0.8873 0.02 Chiropractor 6.0 10.22 0.01 (40.0%) 3.6 (5.2%) 9.69 0.00 105.3% 0.8873 0.00 Podiatrist 14.4 32.02 0.04 0.0% 14.4 (0.1%) 32.00 0.04 105.3% 0.8873 0.04 Vision - EyeCare & Eyewear - - - 0.0% 0.0 0.0% 0.00 0.00 105.3% 0.8873 - Other Professional 9,898.4 13.15 10.85 10.0% 10,888.2 6.4% 14.00 12.70 105.3% 0.8873 11.87 DMHDD / DASA 14.8 106.10 0.13 (30.0%) 10.4 (14.0%) 91.29 0.08 105.3% 0.8873 0.07 PCCM Fee 2.00
Subtotal 23,496.1 $ 21.90 $ 42.88 1.1% 23,746.4 (0.3%) $ 21.85 $ 43.23 105.3% 0.8873 $ 42.40
Total Claims/Benefit Cost 29,509.4 $ 33.50 $ 82.39 0.0% 29,519.8 (7.7%) $ 30.92 $ 76.06 106.1% 0.8873 $ 73.58Copay Adjustment - Administration 11.24
Capitation Rate $ 84.81
ATTACHMENT 4 Milliman, Inc.Page 53 of 66

3/26/20132:40 PM
State of IllinoisDepartment of Healthcare and Family Services
VMC Rate Development: Apr to Dec 2013Region: Statewide
Population: 6 yrs thru 13 yrsSFY11 Member Months: 5,492,572 HMO Member Months: 67,363
Annual Cost Managed Care Annual Managed CostUtilization Per Utilization Utilization Care Cost Per Selection Proposed
Type of Service Per 1,000 Service PMPM Adjustment Per 1,000 Adjustment Service PMPM Trend Adjustment Cap Rate
Inpatient HospitalMedical/Surgical 50.7 $ 1,928.50 $ 8.14 (20.0%) 40.5 6.4% $ 2,051.08 $ 6.93 102.6% 0.7595 $ 5.40Well Newborn - - - 0.0% 0.0 0.0% 0.00 0.00 102.6% 0.7595 - Other Newborn 0.0 2,199.74 0.00 (10.0%) 0.0 (40.7%) 1,305.20 0.00 102.6% 0.7595 0.00 Maternity Non-Delivery 0.0 3,800.45 0.00 (10.0%) 0.0 (70.2%) 1,133.67 0.00 102.6% 0.7595 0.00 Psychiatric/Substance Abuse 58.5 742.45 3.62 (30.0%) 41.0 23.9% 919.94 3.14 102.6% 0.7595 2.45 Long Term Care - - - 0.0% 0.0 0.0% 0.00 0.00 102.6% 0.7595 - Other Inpatient 0.8 11,416.80 0.76 (20.0%) 0.6 6.3% 12,135.16 0.64 102.6% 0.7595 0.50
Subtotal 110.0 $ 1,366.03 $ 12.52 (25.3%) 82.2 14.6% $ 1,564.95 $ 10.71 102.6% 0.7595 $ 8.35
Outpatient HospitalGeneral Outpatient 77.2 $ 402.21 $ 2.59 (10.0%) 69.5 (12.7%) $ 351.05 $ 2.03 101.3% 0.7595 $ 1.56Emergency Room 339.9 113.92 3.23 (20.0%) 271.9 10.5% 125.92 2.85 101.3% 0.7595 2.20 End-Stage Renal Disease 0.3 1,152.75 0.03 0.0% 0.3 1.1% 1,165.61 0.03 101.3% 0.7595 0.02
Subtotal 417.4 $ 167.89 $ 5.84 (18.1%) 341.7 2.7% $ 172.50 $ 4.91 101.3% 0.7595 $ 3.78
AncillariesPrescription Drugs 3,961.9 $ 53.25 $ 17.58 0.0% 3,961.9 (17.3%) $ 44.02 $ 14.53 116.5% 0.7595 $ 12.86Transportation 497.8 12.67 0.53 (20.0%) 398.2 0.8% 12.77 0.42 102.6% 0.7595 0.33 DME/Prosthetics/Orthotics 134.8 122.25 1.37 (30.0%) 94.4 2.4% 125.16 0.98 102.6% 0.7595 0.77 Home Health/Hospice 6.6 292.12 0.16 0.0% 6.6 (1.8%) 286.89 0.16 102.6% 0.7595 0.12 Other Ancillary 19.4 25.36 0.04 (10.0%) 17.5 0.4% 25.46 0.04 102.6% 0.7595 0.03
Subtotal 4,620.5 $ 51.11 $ 19.68 (3.1%) 4,478.6 (15.4%) $ 43.23 $ 16.14 115.1% 0.7595 $ 14.11
PhysicianSurgery 86.4 128.23 $ 0.92 (20.0%) 69.1 (2.9%) $ 124.53 $ 0.72 105.3% 0.7595 $ 0.57Anesthesia 23.0 174.80 0.33 (20.0%) 18.4 0.3% 175.34 0.27 105.3% 0.7595 0.21 Hospital Inpatient Visits 118.9 37.48 0.37 (20.0%) 95.1 6.7% 40.01 0.32 105.3% 0.7595 0.25 Office Visits/Consults 1,486.5 46.90 5.81 (10.0%) 1,337.9 (13.4%) 40.62 4.53 105.3% 0.7595 3.62 Well Baby Exams/Physical Exams 1,015.6 38.51 3.26 40.0% 1,421.9 (0.5%) 38.32 4.54 105.3% 0.7595 3.63 Emergency Room Visits 318.6 36.50 0.97 (20.0%) 254.8 1.9% 37.18 0.79 105.3% 0.7595 0.63 Clinic Visit/Services 3,811.3 23.61 7.50 (10.0%) 3,430.2 3.9% 24.54 7.01 105.3% 0.7595 5.61 Radiology and Pathology 2,781.9 8.13 1.89 (20.0%) 2,225.5 (7.3%) 7.54 1.40 105.3% 0.7595 1.12 Outpatient Behavioral Health 81.5 49.45 0.34 (30.0%) 57.0 (2.8%) 48.07 0.23 105.3% 0.7595 0.18 Maternity 4.4 50.30 0.02 0.0% 4.4 (1.3%) 49.66 0.02 105.3% 0.7595 0.01 Chiropractor 9.8 10.17 0.01 (40.0%) 5.9 2.0% 10.37 0.01 105.3% 0.7595 0.00 Podiatrist 32.3 37.74 0.10 0.0% 32.3 (0.8%) 37.46 0.10 105.3% 0.7595 0.08 Vision - EyeCare & Eyewear - - - 0.0% 0.0 0.0% 0.00 0.00 105.3% 0.7595 - Other Professional 8,725.1 3.87 2.81 10.0% 9,597.7 5.8% 4.09 3.27 105.3% 0.7595 2.62 DMHDD / DASA 138.7 82.64 0.96 (30.0%) 97.1 (14.3%) 70.86 0.57 105.3% 0.7595 0.46 PCCM Fee 2.00
Subtotal 18,634.0 $ 16.28 $ 25.28 0.1% 18,647.3 (6.0%) $ 15.30 $ 23.77 105.3% 0.7595 $ 21.02
Total Claims/Benefit Cost 23,781.9 $ 31.95 $ 63.32 (1.0%) 23,549.7 (11.4%) $ 28.30 $ 55.53 107.3% 0.7595 $ 47.26Copay Adjustment - Administration 7.22
Capitation Rate $ 54.48
ATTACHMENT 4 Milliman, Inc.Page 54 of 66

3/26/20132:40 PM
State of IllinoisDepartment of Healthcare and Family Services
VMC Rate Development: Apr to Dec 2013Region: Statewide
Population: 14 yrs thru 20 yrs - MaleSFY11 Member Months: 1,500,171 HMO Member Months: 16,957
Annual Cost Managed Care Annual Managed CostUtilization Per Utilization Utilization Care Cost Per Selection Proposed
Type of Service Per 1,000 Service PMPM Adjustment Per 1,000 Adjustment Service PMPM Trend Adjustment Cap Rate
Inpatient HospitalMedical/Surgical 96.2 $ 1,977.71 $ 15.85 (20.0%) 76.9 6.4% $ 2,104.19 $ 13.49 104.0% 0.7423 $ 10.41Well Newborn - - - 0.0% 0.0 0.0% 0.00 0.00 104.0% 0.7423 - Other Newborn 0.0 781.72 0.00 (10.0%) 0.0 1.7% 795.10 0.00 104.0% 0.7423 0.00 Maternity Non-Delivery - - 0.00 0.0% 0.0 0.0% 0.00 0.00 104.0% 0.7423 - Psychiatric/Substance Abuse 215.5 708.80 12.73 (30.0%) 150.8 23.8% 877.26 11.03 104.0% 0.7423 8.51 Long Term Care 2.8 176.28 0.04 (20.0%) 2.3 3.0% 181.57 0.03 100.0% 0.7423 0.03 Other Inpatient 1.6 11,431.16 1.55 (20.0%) 1.3 7.1% 12,243.93 1.33 104.0% 0.7423 1.02
Subtotal 316.1 $ 1,145.13 $ 30.17 (26.8%) 231.4 17.2% $ 1,342.21 $ 25.88 104.0% 0.7423 $ 19.97
Outpatient HospitalGeneral Outpatient 120.7 $ 444.39 $ 4.47 (10.0%) 108.7 (12.3%) $ 389.74 $ 3.53 102.6% 0.7423 $ 2.69Emergency Room 371.4 139.43 4.31 (20.0%) 297.1 10.5% 154.01 3.81 102.6% 0.7423 2.91 End-Stage Renal Disease 1.6 633.41 0.08 0.0% 1.6 (3.0%) 614.65 0.08 102.6% 0.7423 0.06
Subtotal 493.6 $ 215.57 $ 8.87 (17.5%) 407.3 1.4% $ 218.66 $ 7.42 102.6% 0.7423 $ 5.65
AncillariesPrescription Drugs 3,553.9 $ 84.05 $ 24.89 0.0% 3,553.9 (18.3%) $ 68.67 $ 20.34 116.5% 0.7423 $ 17.59Transportation 1,072.7 14.11 1.26 (20.0%) 858.2 0.8% 14.21 1.02 101.3% 0.7423 0.76 DME/Prosthetics/Orthotics 114.1 120.39 1.14 (30.0%) 79.9 2.4% 123.23 0.82 101.3% 0.7423 0.62 Home Health/Hospice 14.1 273.58 0.32 0.0% 14.1 3.7% 283.57 0.33 101.3% 0.7423 0.25 Other Ancillary 6.3 25.94 0.01 (10.0%) 5.7 0.3% 26.03 0.01 101.3% 0.7423 0.01
Subtotal 4,761.1 $ 69.64 $ 27.63 (5.2%) 4,511.7 (14.0%) $ 59.89 $ 22.52 115.1% 0.7423 $ 19.23
PhysicianSurgery 123.4 156.18 $ 1.61 (20.0%) 98.7 (2.8%) $ 151.79 $ 1.25 104.0% 0.7423 $ 0.96Anesthesia 29.5 198.36 0.49 (20.0%) 23.6 0.2% 198.73 0.39 104.0% 0.7423 0.30 Hospital Inpatient Visits 268.4 35.94 0.80 (20.0%) 214.7 6.5% 38.29 0.69 104.0% 0.7423 0.53 Office Visits/Consults 1,093.3 47.27 4.31 (10.0%) 984.0 (13.5%) 40.89 3.35 104.0% 0.7423 2.59 Well Baby Exams/Physical Exams 759.4 43.18 2.73 40.0% 1,063.1 (0.6%) 42.91 3.80 104.0% 0.7423 2.93 Emergency Room Visits 332.9 39.04 1.08 (20.0%) 266.3 1.9% 39.79 0.88 104.0% 0.7423 0.68 Clinic Visit/Services 3,642.1 21.52 6.53 (10.0%) 3,277.9 4.2% 22.43 6.13 104.0% 0.7423 4.73 Radiology and Pathology 3,412.0 10.49 2.98 (20.0%) 2,729.6 (7.0%) 9.75 2.22 104.0% 0.7423 1.71 Outpatient Behavioral Health 134.2 48.96 0.55 (30.0%) 93.9 (3.4%) 47.32 0.37 104.0% 0.7423 0.29 Maternity 4.6 49.84 0.02 0.0% 4.6 (1.3%) 49.17 0.02 104.0% 0.7423 0.01 Chiropractor 16.2 10.02 0.01 (40.0%) 9.7 6.5% 10.67 0.01 104.0% 0.7423 0.01 Podiatrist 56.7 43.26 0.20 0.0% 56.7 (0.7%) 42.94 0.20 104.0% 0.7423 0.16 Vision - EyeCare & Eyewear - - - 0.0% 0.0 0.0% 0.00 0.00 104.0% 0.7423 - Other Professional 8,359.9 3.48 2.42 10.0% 9,195.9 5.6% 3.68 2.82 104.0% 0.7423 2.17 DMHDD / DASA 447.7 121.36 4.53 (30.0%) 313.4 (14.4%) 103.90 2.71 104.0% 0.7423 2.09 PCCM Fee 2.00
Subtotal 18,680.2 $ 18.16 $ 28.27 (1.9%) 18,332.1 (10.5%) $ 16.26 $ 24.84 104.0% 0.7423 $ 21.17
Total Claims/Benefit Cost 24,251.1 $ 46.98 $ 94.94 (3.2%) 23,482.5 (12.3%) $ 41.22 $ 80.66 107.0% 0.7423 $ 66.03Copay Adjustment - Administration 10.09
Capitation Rate $ 76.12
ATTACHMENT 4 Milliman, Inc.Page 55 of 66

3/26/20132:40 PM
State of IllinoisDepartment of Healthcare and Family Services
VMC Rate Development: Apr to Dec 2013Region: Statewide
Population: 14 yrs thru 20 yrs - FemaleSFY11 Member Months: 1,651,258 HMO Member Months: 20,387
Annual Cost Managed Care Annual Managed CostUtilization Per Utilization Utilization Care Cost Per Selection Proposed
Type of Service Per 1,000 Service PMPM Adjustment Per 1,000 Adjustment Service PMPM Trend Adjustment Cap Rate
Inpatient HospitalMedical/Surgical 77.0 $ 1,907.15 $ 12.24 (20.0%) 61.6 6.9% $ 2,038.78 $ 10.46 104.0% 0.8353 $ 9.09Well Newborn - - 0.00 0.0% 0.0 0.0% 0.00 0.00 104.0% 0.8353 - Other Newborn 0.1 422.47 0.00 (10.0%) 0.0 3.1% 435.44 0.00 104.0% 0.8353 0.00 Maternity Non-Delivery 28.1 1,051.91 2.46 (10.0%) 25.3 2.1% 1,074.34 2.26 104.0% 0.8353 1.97 Psychiatric/Substance Abuse 223.3 701.13 13.04 (30.0%) 156.3 23.6% 866.83 11.29 104.0% 0.8353 9.81 Long Term Care 1.5 134.07 0.02 (20.0%) 1.2 4.9% 140.69 0.01 100.0% 0.8353 0.01 Other Inpatient 1.3 8,765.13 0.98 (20.0%) 1.1 6.3% 9,316.60 0.84 104.0% 0.8353 0.73
Subtotal 331.2 $ 1,041.51 $ 28.75 (25.9%) 245.5 16.7% $ 1,215.75 $ 24.87 104.0% 0.8353 $ 21.60
Outpatient HospitalGeneral Outpatient 334.4 $ 270.07 $ 7.53 (10.0%) 301.0 (12.4%) $ 236.61 $ 5.93 102.6% 0.8353 $ 5.09Emergency Room 545.8 143.07 6.51 (20.0%) 436.6 10.2% 157.66 5.74 102.6% 0.8353 4.92 End-Stage Renal Disease 1.2 769.62 0.07 0.0% 1.2 0.0% 769.70 0.07 102.6% 0.8353 0.06
Subtotal 881.3 $ 192.09 $ 14.11 (16.2%) 738.7 (0.7%) $ 190.79 $ 11.75 102.6% 0.8353 $ 10.07
AncillariesPrescription Drugs 5,292.0 $ 48.62 $ 21.44 0.0% 5,292.0 (18.1%) $ 39.79 $ 17.55 116.5% 0.8353 $ 17.08Transportation 1,083.0 17.13 1.55 (20.0%) 866.4 0.8% 17.26 1.25 101.3% 0.8353 1.05 DME/Prosthetics/Orthotics 128.8 109.32 1.17 (30.0%) 90.2 2.6% 112.13 0.84 101.3% 0.8353 0.71 Home Health/Hospice 13.2 64.79 0.07 0.0% 13.2 (0.4%) 64.55 0.07 101.3% 0.8353 0.06 Other Ancillary 5.4 26.31 0.01 (10.0%) 4.9 0.5% 26.45 0.01 101.3% 0.8353 0.01
Subtotal 6,522.5 $ 44.60 $ 24.24 (3.9%) 6,266.7 (15.3%) $ 37.76 $ 19.72 114.9% 0.8353 $ 18.92
PhysicianSurgery 98.5 152.79 $ 1.25 (20.0%) 78.8 (2.9%) $ 148.42 $ 0.98 104.0% 0.8353 $ 0.85Anesthesia 78.2 294.84 1.92 (20.0%) 62.5 0.4% 296.04 1.54 104.0% 0.8353 1.34 Hospital Inpatient Visits 330.8 36.70 1.01 (20.0%) 264.7 6.8% 39.20 0.86 104.0% 0.8353 0.75 Office Visits/Consults 1,499.5 46.70 5.83 (10.0%) 1,349.5 (13.5%) 40.39 4.54 104.0% 0.8353 3.95 Well Baby Exams/Physical Exams 757.2 43.90 2.77 40.0% 1,060.1 (0.3%) 43.75 3.86 104.0% 0.8353 3.36 Emergency Room Visits 516.4 42.34 1.82 (20.0%) 413.1 1.6% 43.02 1.48 104.0% 0.8353 1.29 Clinic Visit/Services 4,617.4 36.17 13.92 (10.0%) 4,155.7 3.8% 37.55 13.01 104.0% 0.8353 11.30 Radiology and Pathology 8,322.1 11.56 8.02 (20.0%) 6,657.7 (6.9%) 10.77 5.97 104.0% 0.8353 5.19 Outpatient Behavioral Health 138.1 51.24 0.59 (30.0%) 96.7 (3.1%) 49.65 0.40 104.0% 0.8353 0.35 Maternity 24.2 47.94 0.10 0.0% 24.2 (2.5%) 46.74 0.09 104.0% 0.8353 0.08 Chiropractor 21.6 10.23 0.02 (40.0%) 12.9 3.7% 10.61 0.01 104.0% 0.8353 0.01 Podiatrist 48.2 44.50 0.18 0.0% 48.2 (0.5%) 44.28 0.18 104.0% 0.8353 0.15 Vision - EyeCare & Eyewear - - - 0.0% 0.0 0.0% 0.00 0.00 104.0% 0.8353 - Other Professional 8,452.6 5.61 3.95 10.0% 9,297.9 5.3% 5.91 4.58 104.0% 0.8353 3.98 DMHDD / DASA 321.9 101.33 2.72 (30.0%) 225.4 (14.4%) 86.71 1.63 104.0% 0.8353 1.41 PCCM Fee 2.00
Subtotal 25,226.7 $ 20.98 $ 44.10 (5.9%) 23,747.3 (5.7%) $ 19.78 $ 39.14 104.0% 0.8353 $ 36.00
Total Claims/Benefit Cost 32,961.8 $ 40.48 $ 111.20 (6.0%) 30,998.2 (8.7%) $ 36.96 $ 95.47 106.1% 0.8353 $ 86.59Copay Adjustment - Administration 13.23
Capitation Rate $ 99.82
ATTACHMENT 4 Milliman, Inc.Page 56 of 66
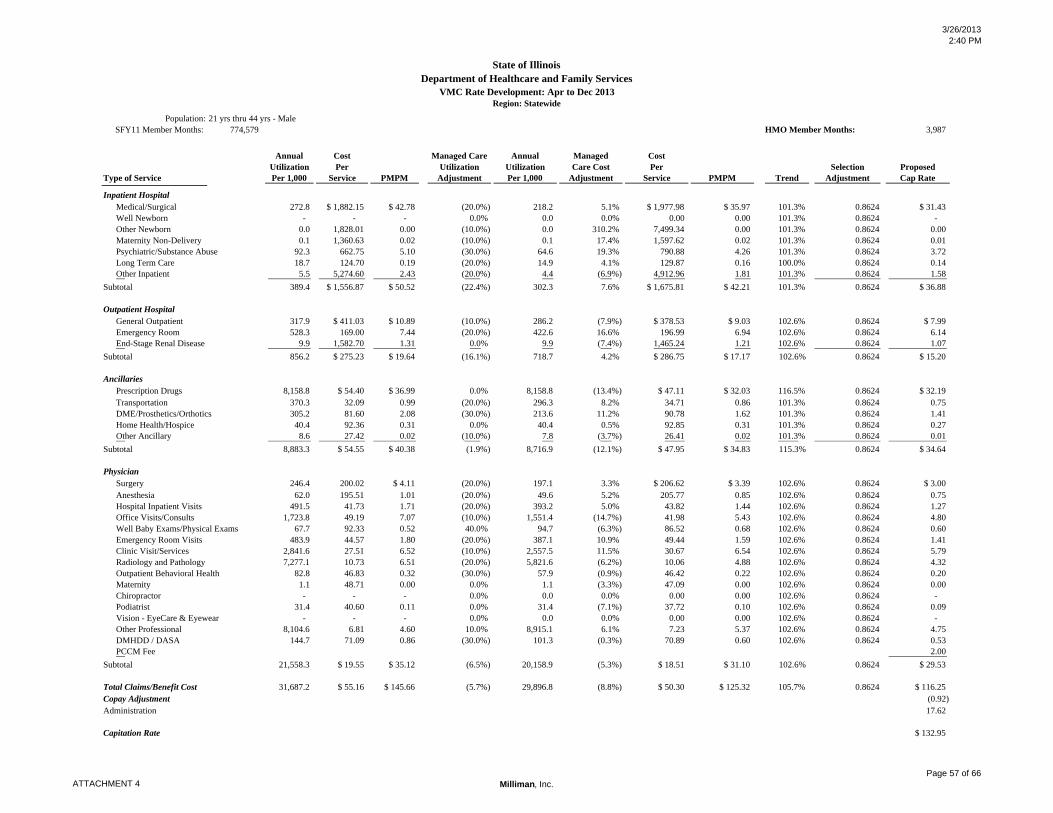
3/26/20132:40 PM
State of IllinoisDepartment of Healthcare and Family Services
VMC Rate Development: Apr to Dec 2013Region: Statewide
Population: 21 yrs thru 44 yrs - MaleSFY11 Member Months: 774,579 HMO Member Months: 3,987
Annual Cost Managed Care Annual Managed CostUtilization Per Utilization Utilization Care Cost Per Selection Proposed
Type of Service Per 1,000 Service PMPM Adjustment Per 1,000 Adjustment Service PMPM Trend Adjustment Cap Rate
Inpatient HospitalMedical/Surgical 272.8 $ 1,882.15 $ 42.78 (20.0%) 218.2 5.1% $ 1,977.98 $ 35.97 101.3% 0.8624 $ 31.43Well Newborn - - - 0.0% 0.0 0.0% 0.00 0.00 101.3% 0.8624 - Other Newborn 0.0 1,828.01 0.00 (10.0%) 0.0 310.2% 7,499.34 0.00 101.3% 0.8624 0.00 Maternity Non-Delivery 0.1 1,360.63 0.02 (10.0%) 0.1 17.4% 1,597.62 0.02 101.3% 0.8624 0.01 Psychiatric/Substance Abuse 92.3 662.75 5.10 (30.0%) 64.6 19.3% 790.88 4.26 101.3% 0.8624 3.72 Long Term Care 18.7 124.70 0.19 (20.0%) 14.9 4.1% 129.87 0.16 100.0% 0.8624 0.14 Other Inpatient 5.5 5,274.60 2.43 (20.0%) 4.4 (6.9%) 4,912.96 1.81 101.3% 0.8624 1.58
Subtotal 389.4 $ 1,556.87 $ 50.52 (22.4%) 302.3 7.6% $ 1,675.81 $ 42.21 101.3% 0.8624 $ 36.88
Outpatient HospitalGeneral Outpatient 317.9 $ 411.03 $ 10.89 (10.0%) 286.2 (7.9%) $ 378.53 $ 9.03 102.6% 0.8624 $ 7.99Emergency Room 528.3 169.00 7.44 (20.0%) 422.6 16.6% 196.99 6.94 102.6% 0.8624 6.14 End-Stage Renal Disease 9.9 1,582.70 1.31 0.0% 9.9 (7.4%) 1,465.24 1.21 102.6% 0.8624 1.07
Subtotal 856.2 $ 275.23 $ 19.64 (16.1%) 718.7 4.2% $ 286.75 $ 17.17 102.6% 0.8624 $ 15.20
AncillariesPrescription Drugs 8,158.8 $ 54.40 $ 36.99 0.0% 8,158.8 (13.4%) $ 47.11 $ 32.03 116.5% 0.8624 $ 32.19Transportation 370.3 32.09 0.99 (20.0%) 296.3 8.2% 34.71 0.86 101.3% 0.8624 0.75 DME/Prosthetics/Orthotics 305.2 81.60 2.08 (30.0%) 213.6 11.2% 90.78 1.62 101.3% 0.8624 1.41 Home Health/Hospice 40.4 92.36 0.31 0.0% 40.4 0.5% 92.85 0.31 101.3% 0.8624 0.27 Other Ancillary 8.6 27.42 0.02 (10.0%) 7.8 (3.7%) 26.41 0.02 101.3% 0.8624 0.01
Subtotal 8,883.3 $ 54.55 $ 40.38 (1.9%) 8,716.9 (12.1%) $ 47.95 $ 34.83 115.3% 0.8624 $ 34.64
PhysicianSurgery 246.4 200.02 $ 4.11 (20.0%) 197.1 3.3% $ 206.62 $ 3.39 102.6% 0.8624 $ 3.00Anesthesia 62.0 195.51 1.01 (20.0%) 49.6 5.2% 205.77 0.85 102.6% 0.8624 0.75 Hospital Inpatient Visits 491.5 41.73 1.71 (20.0%) 393.2 5.0% 43.82 1.44 102.6% 0.8624 1.27 Office Visits/Consults 1,723.8 49.19 7.07 (10.0%) 1,551.4 (14.7%) 41.98 5.43 102.6% 0.8624 4.80 Well Baby Exams/Physical Exams 67.7 92.33 0.52 40.0% 94.7 (6.3%) 86.52 0.68 102.6% 0.8624 0.60 Emergency Room Visits 483.9 44.57 1.80 (20.0%) 387.1 10.9% 49.44 1.59 102.6% 0.8624 1.41 Clinic Visit/Services 2,841.6 27.51 6.52 (10.0%) 2,557.5 11.5% 30.67 6.54 102.6% 0.8624 5.79 Radiology and Pathology 7,277.1 10.73 6.51 (20.0%) 5,821.6 (6.2%) 10.06 4.88 102.6% 0.8624 4.32 Outpatient Behavioral Health 82.8 46.83 0.32 (30.0%) 57.9 (0.9%) 46.42 0.22 102.6% 0.8624 0.20 Maternity 1.1 48.71 0.00 0.0% 1.1 (3.3%) 47.09 0.00 102.6% 0.8624 0.00 Chiropractor - - - 0.0% 0.0 0.0% 0.00 0.00 102.6% 0.8624 - Podiatrist 31.4 40.60 0.11 0.0% 31.4 (7.1%) 37.72 0.10 102.6% 0.8624 0.09 Vision - EyeCare & Eyewear - - - 0.0% 0.0 0.0% 0.00 0.00 102.6% 0.8624 - Other Professional 8,104.6 6.81 4.60 10.0% 8,915.1 6.1% 7.23 5.37 102.6% 0.8624 4.75 DMHDD / DASA 144.7 71.09 0.86 (30.0%) 101.3 (0.3%) 70.89 0.60 102.6% 0.8624 0.53 PCCM Fee 2.00
Subtotal 21,558.3 $ 19.55 $ 35.12 (6.5%) 20,158.9 (5.3%) $ 18.51 $ 31.10 102.6% 0.8624 $ 29.53
Total Claims/Benefit Cost 31,687.2 $ 55.16 $ 145.66 (5.7%) 29,896.8 (8.8%) $ 50.30 $ 125.32 105.7% 0.8624 $ 116.25Copay Adjustment (0.92) Administration 17.62
Capitation Rate $ 132.95
ATTACHMENT 4 Milliman, Inc.Page 57 of 66

3/26/20132:40 PM
State of IllinoisDepartment of Healthcare and Family Services
VMC Rate Development: Apr to Dec 2013Region: Statewide
Population: 21 yrs thru 44 yrs - FemaleSFY11 Member Months: 3,118,170 HMO Member Months: 41,949
Annual Cost Managed Care Annual Managed CostUtilization Per Utilization Utilization Care Cost Per Selection Proposed
Type of Service Per 1,000 Service PMPM Adjustment Per 1,000 Adjustment Service PMPM Trend Adjustment Cap Rate
Inpatient HospitalMedical/Surgical 210.7 $ 1,590.72 $ 27.93 (20.0%) 168.5 6.1% $ 1,687.25 $ 23.70 101.3% 0.8624 $ 20.71Well Newborn - - - 0.0% 0.0 0.0% 0.00 0.00 101.3% 0.8624 - Other Newborn 0.4 1,659.86 0.05 (10.0%) 0.3 0.5% 1,668.22 0.05 101.3% 0.8624 0.04 Maternity Non-Delivery 65.4 1,143.44 6.23 (10.0%) 58.9 1.2% 1,157.55 5.68 101.3% 0.8624 4.96 Psychiatric/Substance Abuse 78.0 620.35 4.03 (30.0%) 54.6 23.4% 765.57 3.48 101.3% 0.8624 3.04 Long Term Care 22.9 130.54 0.25 (20.0%) 18.3 5.9% 138.22 0.21 100.0% 0.8624 0.18 Other Inpatient 0.7 7,023.92 0.40 (20.0%) 0.5 4.4% 7,330.42 0.33 101.3% 0.8624 0.29
Subtotal 378.1 $ 1,234.30 $ 38.89 (20.3%) 301.3 7.9% $ 1,332.40 $ 33.45 101.3% 0.8624 $ 29.23
Outpatient HospitalGeneral Outpatient 869.0 $ 284.25 $ 20.58 (10.0%) 782.1 (12.5%) $ 248.72 $ 16.21 102.6% 0.8624 $ 14.35Emergency Room 897.8 164.67 12.32 (20.0%) 718.2 10.0% 181.20 10.85 102.6% 0.8624 9.60 End-Stage Renal Disease 9.7 1,136.86 0.92 0.0% 9.7 (0.9%) 1,127.08 0.91 102.6% 0.8624 0.81
Subtotal 1,776.5 $ 228.49 $ 33.83 (15.0%) 1,510.0 (2.7%) $ 222.27 $ 27.97 102.6% 0.8624 $ 24.76
AncillariesPrescription Drugs 11,265.3 $ 48.08 $ 45.14 0.0% 11,265.3 (17.6%) $ 39.62 $ 37.20 116.5% 0.8624 $ 37.38Transportation 667.4 28.87 1.61 (20.0%) 534.0 1.1% 29.18 1.30 101.3% 0.8624 1.13 DME/Prosthetics/Orthotics 291.0 80.79 1.96 (30.0%) 203.7 3.2% 83.36 1.41 101.3% 0.8624 1.24 Home Health/Hospice 35.1 81.60 0.24 0.0% 35.1 0.7% 82.15 0.24 101.3% 0.8624 0.21 Other Ancillary 7.0 27.23 0.02 (10.0%) 6.3 (0.7%) 27.05 0.01 101.3% 0.8624 0.01
Subtotal 12,265.9 $ 47.90 $ 48.96 (1.8%) 12,044.4 (16.4%) $ 40.02 $ 40.17 115.4% 0.8624 $ 39.98
PhysicianSurgery 309.1 169.16 $ 4.36 (20.0%) 247.3 (1.9%) $ 165.87 $ 3.42 102.6% 0.8624 $ 3.03Anesthesia 199.4 253.73 4.22 (20.0%) 159.5 0.1% 253.98 3.38 102.6% 0.8624 2.99 Hospital Inpatient Visits 509.8 40.83 1.73 (20.0%) 407.9 6.3% 43.40 1.48 102.6% 0.8624 1.31 Office Visits/Consults 2,445.9 47.35 9.65 (10.0%) 2,201.3 (13.6%) 40.89 7.50 102.6% 0.8624 6.64 Well Baby Exams/Physical Exams 185.5 77.14 1.19 40.0% 259.7 (0.0%) 77.12 1.67 102.6% 0.8624 1.48 Emergency Room Visits 865.9 45.31 3.27 (20.0%) 692.7 1.8% 46.11 2.66 102.6% 0.8624 2.36 Clinic Visit/Services 5,622.8 42.61 19.96 (10.0%) 5,060.6 3.9% 44.26 18.66 102.6% 0.8624 16.52 Radiology and Pathology 17,172.7 13.04 18.66 (20.0%) 13,738.2 (7.3%) 12.09 13.84 102.6% 0.8624 12.25 Outpatient Behavioral Health 124.3 45.38 0.47 (30.0%) 87.0 (3.3%) 43.89 0.32 102.6% 0.8624 0.28 Maternity 29.2 49.01 0.12 0.0% 29.2 (2.6%) 47.71 0.12 102.6% 0.8624 0.10 Chiropractor - - - 0.0% 0.0 0.0% 0.00 0.00 102.6% 0.8624 - Podiatrist 20.4 38.61 0.07 0.0% 20.4 (1.0%) 38.21 0.06 102.6% 0.8624 0.06 Vision - EyeCare & Eyewear - - - 0.0% 0.0 0.0% 0.00 0.00 102.6% 0.8624 - Other Professional 8,422.1 12.66 8.88 10.0% 9,264.3 5.8% 13.40 10.34 102.6% 0.8624 9.15 DMHDD / DASA 278.9 82.00 1.91 (30.0%) 195.2 (14.3%) 70.25 1.14 102.6% 0.8624 1.01 PCCM Fee 2.00
Subtotal 36,186.1 $ 24.70 $ 74.49 (10.6%) 32,363.3 (3.0%) $ 23.95 $ 64.59 102.6% 0.8624 $ 59.18
Total Claims/Benefit Cost 50,606.5 $ 46.51 $ 196.16 (8.7%) 46,218.9 (7.2%) $ 43.14 $ 166.18 105.5% 0.8624 $ 153.14Copay Adjustment (2.25) Administration 23.05
Capitation Rate $ 173.94
ATTACHMENT 4 Milliman, Inc.Page 58 of 66

3/26/20132:40 PM
State of IllinoisDepartment of Healthcare and Family Services
VMC Rate Development: Apr to Dec 2013Region: Statewide
Population: 45 + YearsSFY11 Member Months: 895,037 HMO Member Months: 5,739
Annual Cost Managed Care Annual Managed CostUtilization Per Utilization Utilization Care Cost Per Selection Proposed
Type of Service Per 1,000 Service PMPM Adjustment Per 1,000 Adjustment Service PMPM Trend Adjustment Cap Rate
Inpatient HospitalMedical/Surgical 549.7 $ 1,642.01 $ 75.22 (20.0%) 439.8 0.2% $ 1,645.14 $ 60.29 101.3% 0.8624 $ 52.68Well Newborn - - - 0.0% 0.0 0.0% 0.00 0.00 101.3% 0.8624 - Other Newborn - - - 0.0% 0.0 0.0% 0.00 0.00 101.3% 0.8624 - Maternity Non-Delivery 0.3 2,257.63 0.07 (10.0%) 0.3 (3.4%) 2,181.93 0.06 101.3% 0.8624 0.05 Psychiatric/Substance Abuse 107.7 643.70 5.77 (30.0%) 75.4 (2.0%) 630.97 3.96 101.3% 0.8624 3.46 Long Term Care 103.0 142.06 1.22 (20.0%) 82.4 (0.7%) 141.07 0.97 100.0% 0.8624 0.84 Other Inpatient 2.6 5,773.25 1.26 (20.0%) 2.1 5.0% 6,061.67 1.06 101.3% 0.8624 0.92
Subtotal 763.4 $ 1,313.23 $ 83.54 (21.4%) 600.0 1.0% $ 1,326.82 $ 66.34 101.3% 0.8624 $ 57.95
Outpatient HospitalGeneral Outpatient 851.7 $ 386.36 $ 27.42 (10.0%) 766.5 0.6% $ 388.50 $ 24.82 102.6% 0.8624 $ 21.97Emergency Room 533.3 195.48 8.69 (20.0%) 426.6 0.6% 196.63 6.99 102.6% 0.8624 6.19 End-Stage Renal Disease 40.5 1,070.37 3.61 0.0% 40.5 (1.7%) 1,052.06 3.55 102.6% 0.8624 3.14
Subtotal 1,425.5 $ 334.38 $ 39.72 (13.5%) 1,233.6 2.9% $ 343.92 $ 35.36 102.6% 0.8624 $ 31.30
AncillariesPrescription Drugs 22,778.5 $ 49.65 $ 94.24 0.0% 22,778.5 (17.5%) $ 40.95 $ 77.73 116.5% 0.8624 $ 78.11Transportation 1,846.6 14.84 2.28 (20.0%) 1,477.3 1.8% 15.11 1.86 101.3% 0.8624 1.63 DME/Prosthetics/Orthotics 829.0 67.02 4.63 (30.0%) 580.3 2.8% 68.90 3.33 101.3% 0.8624 2.91 Home Health/Hospice 144.6 88.61 1.07 0.0% 144.6 0.7% 89.22 1.08 101.3% 0.8624 0.94 Other Ancillary 16.9 27.01 0.04 (10.0%) 15.2 (1.2%) 26.69 0.03 101.3% 0.8624 0.03
Subtotal 25,615.6 $ 47.90 $ 102.26 (2.4%) 24,995.9 (15.8%) $ 40.34 $ 84.03 115.4% 0.8624 $ 83.62
PhysicianSurgery 533.2 209.95 $ 9.33 (20.0%) 426.6 1.5% $ 213.07 $ 7.57 102.6% 0.8624 $ 6.70Anesthesia 132.2 181.78 2.00 (20.0%) 105.8 1.2% 184.02 1.62 102.6% 0.8624 1.44 Hospital Inpatient Visits 964.6 40.86 3.28 (20.0%) 771.7 (0.6%) 40.63 2.61 102.6% 0.8624 2.31 Office Visits/Consults 3,412.8 48.87 13.90 (10.0%) 3,071.5 (1.1%) 48.33 12.37 102.6% 0.8624 10.95 Well Baby Exams/Physical Exams 114.6 86.57 0.83 40.0% 160.4 (1.1%) 85.65 1.14 102.6% 0.8624 1.01 Emergency Room Visits 502.9 49.07 2.06 (20.0%) 402.3 1.4% 49.75 1.67 102.6% 0.8624 1.48 Clinic Visit/Services 3,714.8 47.63 14.74 (10.0%) 3,343.3 1.4% 48.30 13.46 102.6% 0.8624 11.91 Radiology and Pathology 15,212.5 11.69 14.82 (20.0%) 12,170.0 (0.0%) 11.69 11.85 102.6% 0.8624 10.49 Outpatient Behavioral Health 148.8 40.41 0.50 (30.0%) 104.2 (0.2%) 40.32 0.35 102.6% 0.8624 0.31 Maternity 0.6 47.05 0.00 0.0% 0.6 (1.0%) 46.58 0.00 102.6% 0.8624 0.00 Chiropractor - - - 0.0% 0.0 0.0% 0.00 0.00 102.6% 0.8624 - Podiatrist 109.8 35.40 0.32 0.0% 109.8 (1.7%) 34.78 0.32 102.6% 0.8624 0.28 Vision - EyeCare & Eyewear - - - 0.0% 0.0 0.0% 0.00 0.00 102.6% 0.8624 - Other Professional 9,287.6 16.48 12.76 10.0% 10,216.4 0.9% 16.63 14.16 102.6% 0.8624 12.53 DMHDD / DASA 323.7 67.40 1.82 (30.0%) 226.6 0.3% 67.60 1.28 102.6% 0.8624 1.13 PCCM Fee 2.00
Subtotal 34,458.1 $ 26.59 $ 76.36 (9.7%) 31,109.1 (0.8%) $ 26.39 $ 68.41 102.6% 0.8624 $ 62.56
Total Claims/Benefit Cost 62,262.6 $ 58.18 $ 301.88 (6.9%) 57,938.6 (9.5%) $ 52.63 $ 254.13 106.5% 0.8624 $ 235.43Copay Adjustment (1.88) Administration 35.67
Capitation Rate $ 269.22
ATTACHMENT 4 Milliman, Inc.Page 59 of 66

3/26/20132:40 PM
State of IllinoisDepartment of Healthcare and Family Services
VMC Rate Development: Apr to Dec 2013Region: Statewide
Population: CompositeSFY11 Member Months: 18,151,510 June 2012 HMO Member Months: 217,123
Annual Cost Managed Care Annual Managed CostUtilization Per Utilization Utilization Care Cost Per Selection Proposed
Type of Service Per 1,000 Service PMPM Adjustment Per 1,000 Adjustment Service PMPM Trend Adjustment Cap Rate
Inpatient HospitalMedical/Surgical 146.1 $ 1,834.81 $ 22.34 (20.0%) 116.9 5.7% $ 1,939.42 $ 18.89 103.1% 0.8728 $ 17.00Well Newborn 3.8 2,610.30 0.82 (10.0%) 3.4 0.6% 2,625.88 0.74 108.1% 0.9000 0.72 Other Newborn 170.1 1,688.99 23.94 (10.0%) 153.1 1.6% 1,716.24 21.90 107.9% 0.9032 21.34 Maternity Non-Delivery 15.3 1,128.64 1.44 (10.0%) 13.8 1.4% 1,143.89 1.31 101.8% 0.8579 1.15 Psychiatric/Substance Abuse 76.2 695.50 4.42 (30.0%) 53.4 22.7% 853.48 3.80 103.0% 0.8013 3.13 Long Term Care 7.9 135.63 0.09 (20.0%) 6.3 3.3% 140.11 0.07 100.0% 0.8576 0.06 Other Inpatient 1.2 9,196.98 0.91 (20.0%) 1.0 5.6% 9,712.79 0.77 102.8% 0.8315 0.66
Subtotal 420.5 $ 1,539.69 $ 53.96 (17.3%) 347.7 6.4% $ 1,638.50 $ 47.48 105.3% 0.8809 $ 44.06
Outpatient HospitalGeneral Outpatient 294.6 $ 322.11 $ 7.91 (10.0%) 265.2 (11.2%) $ 285.92 $ 6.32 102.3% 0.8529 $ 5.51Emergency Room 588.4 132.63 6.50 (20.0%) 470.8 9.9% 145.76 5.72 102.1% 0.8564 5.00 End-Stage Renal Disease 3.5 1,107.72 0.32 0.0% 3.5 (1.6%) 1,090.06 0.32 102.6% 0.8576 0.28
Subtotal 886.6 $ 199.42 $ 14.73 (16.6%) 739.4 0.5% $ 200.47 $ 12.35 102.2% 0.8546 $ 10.79
AncillariesPrescription Drugs 6,438.8 $ 47.25 $ 25.35 0.0% 6,438.8 (17.7%) $ 38.88 $ 20.86 116.5% 0.8386 $ 20.38Transportation 571.8 20.07 0.96 (20.0%) 457.4 1.0% 20.27 0.77 101.8% 0.8394 0.66 DME/Prosthetics/Orthotics 217.9 98.81 1.79 (30.0%) 152.5 2.9% 101.72 1.29 102.1% 0.8503 1.12 Home Health/Hospice 24.9 202.87 0.42 0.0% 24.9 0.2% 203.28 0.42 102.3% 0.8888 0.38 Other Ancillary 21.7 26.93 0.05 (10.0%) 19.6 0.0% 26.93 0.04 102.5% 0.8621 0.04
Subtotal 7,275.1 $ 47.13 $ 28.57 (2.5%) 7,093.2 (16.0%) $ 39.57 $ 23.39 115.0% 0.8400 $ 22.59
PhysicianSurgery 173.3 153.79 $ 2.22 (20.0%) 138.7 (1.9%) $ 150.89 $ 1.74 103.6% 0.8554 $ 1.54Anesthesia 71.3 234.14 1.39 (20.0%) 57.0 0.3% 234.73 1.12 103.3% 0.8561 0.99 Hospital Inpatient Visits 479.3 71.28 2.85 (20.0%) 383.5 6.6% 75.98 2.43 103.1% 0.8913 2.23 Office Visits/Consults 1,939.8 47.07 7.61 (10.0%) 1,745.8 (12.8%) 41.07 5.97 104.3% 0.8512 5.30 Well Baby Exams/Physical Exams 1,675.1 34.74 4.85 40.0% 2,345.2 0.0% 34.76 6.79 104.6% 0.8789 6.25 Emergency Room Visits 555.2 40.13 1.86 (20.0%) 444.1 1.8% 40.87 1.51 104.0% 0.8594 1.35 Clinic Visit/Services 4,469.5 34.40 12.81 (10.0%) 4,022.6 3.5% 35.59 11.93 104.1% 0.8577 10.65 Radiology and Pathology 7,343.1 10.79 6.60 (20.0%) 5,874.5 (6.8%) 10.06 4.92 103.4% 0.8540 4.35 Outpatient Behavioral Health 80.2 48.02 0.32 (30.0%) 56.1 (2.9%) 46.62 0.22 104.0% 0.8088 0.18 Maternity 11.5 49.16 0.05 0.0% 11.5 (2.0%) 48.16 0.05 103.7% 0.8510 0.04 Chiropractor 7.9 10.18 0.01 (40.0%) 4.7 2.0% 10.38 0.00 104.7% 0.8068 0.00 Podiatrist 29.7 39.01 0.10 0.0% 29.7 (0.9%) 38.66 0.10 104.2% 0.8082 0.08 Vision - EyeCare & Eyewear - - - 0.0% 0.0 0.0% 0.00 0.00 104.2% 0.8786 - Other Professional 8,774.6 8.98 6.56 10.0% 9,652.0 5.8% 9.49 7.64 104.3% 0.8693 6.92 DMHDD / DASA 176.1 92.80 1.36 (30.0%) 123.3 (13.7%) 80.12 0.82 103.9% 0.8043 0.69 PCCM Fee 2.00
Subtotal 25,786.6 $ 22.61 $ 48.59 (3.5%) 24,888.7 (3.5%) $ 21.82 $ 45.25 104.0% 0.9045 $ 42.58
Total Claims/Benefit Cost 34,368.9 $ 50.92 $ 145.85 (3.8%) 33,069.1 (8.5%) $ 46.62 $ 128.47 106.3% 0.8786 $ 120.02Copay Adjustment (0.50) Administration 18.26
Capitation Rate $ 137.77
ATTACHMENT 4 Milliman, Inc.Page 60 of 66

3/26/20132:40 PM
State of IllinoisDepartment of Healthcare and Family Services
VMC Maternity Rate Development: Apr to Dec 2013Region 1
Populations : AllSFY11 FFS Admits: 6,537 Estimated HMO deliveries per month: 1
Annual Cost Managed Care Annual Managed CostUtilization Per Utilization Utilization Care Cost Per Adjusted Cost Proposed
Type of Service Per 1,000 Service Per Delivery Adjustment Per 1,000 Adjustment Service Per Delivery Trend Cap Rate
Inpatient HospitalMaternity Delivery 2,639.7 $ 917.34 $ 2,421.55 (1.5%) 2,600.2 0.0% 917.34 2,385.22 102.6% 2,448.34
Subtotal 2,639.7 $ 917.34 $ 2,421.55 (1.5%) 2,600.2 0.0% $ 917.34 $ 2,385.22 102.6% $ 2,448.34
PhysicianNormal Deliveries 679.2 $ 915.28 $ 621.70 4.5% 709.8 0.0% 915.28 649.67 101.3% 658.23 Cesarean Deliveries 442.6 766.42 339.25 (10.5%) 396.2 0.0% 766.42 303.63 101.3% 307.63
Subtotal 1,121.9 $ 856.55 $ 960.95 (1.4%) 1,106.0 0.6% $ 861.96 $ 953.30 101.3% $ 965.86
Total Claims/Benefit Cost 3,761.6 $ 899.21 $ 3,382.49 (1.5%) 3,706.1 0.2% $ 900.81 $ 3,338.52 102.3% $ 3,414.21
Administration 123.83 Maternity Case Rate $ 3,538.04
ATTACHMENT 4 Milliman, Inc. Page 61 of 66

3/26/20132:40 PM
State of IllinoisDepartment of Healthcare and Family Services
VMC Maternity Rate Development: Apr to Dec 2013Region 2
Populations : AllSFY11 FFS Admits: 5,890 Estimated HMO deliveries per month: 1
Annual Cost Managed Care Annual Managed CostUtilization Per Utilization Utilization Care Cost Per Adjusted Cost Proposed
Type of Service Per 1,000 Service Per Delivery Adjustment Per 1,000 Adjustment Service Per Delivery Trend Cap Rate
Inpatient HospitalMaternity Delivery 2,382.3 $ 961.48 $ 2,290.50 (1.5%) 2,346.5 0.0% 961.48 2,256.13 102.6% 2,315.84
Subtotal 2,382.3 $ 961.48 $ 2,290.50 (1.5%) 2,346.5 0.0% $ 961.48 $ 2,256.13 102.6% $ 2,315.84
PhysicianNormal Deliveries 693.7 $ 916.47 $ 635.78 4.5% 725.0 0.0% 916.47 664.40 101.3% 673.15 Cesarean Deliveries 412.1 781.23 321.94 (10.5%) 368.8 0.0% 781.23 288.14 101.3% 291.93
Subtotal 1,105.8 $ 866.07 $ 957.73 (1.1%) 1,093.8 0.6% $ 870.87 $ 952.53 101.3% $ 965.09
Total Claims/Benefit Cost 3,488.1 $ 931.23 $ 3,248.23 (1.4%) 3,440.3 0.2% $ 932.67 $ 3,208.67 102.3% $ 3,280.93
Administration 119.00 Maternity Case Rate $ 3,399.92
ATTACHMENT 4 Milliman, Inc. Page 62 of 66

3/26/20132:40 PM
State of IllinoisDepartment of Healthcare and Family Services
VMC Maternity Rate Development: Apr to Dec 2013Region 3
Populations : AllSFY11 FFS Admits: 5,458 Estimated HMO deliveries per month: 16
Annual Cost Managed Care Annual Managed CostUtilization Per Utilization Utilization Care Cost Per Adjusted Cost Proposed
Type of Service Per 1,000 Service Per Delivery Adjustment Per 1,000 Adjustment Service Per Delivery Trend Cap Rate
Inpatient HospitalMaternity Delivery 2,531.3 $ 974.88 $ 2,467.75 (1.5%) 2,493.4 0.0% 974.88 2,430.73 102.6% 2,495.05
Subtotal 2,531.3 $ 974.88 $ 2,467.75 (1.5%) 2,493.4 0.0% $ 974.88 $ 2,430.73 102.6% $ 2,495.05
PhysicianNormal Deliveries 683.8 $ 914.73 $ 625.54 4.5% 714.6 0.0% 914.73 653.69 101.3% 662.30 Cesarean Deliveries 337.2 939.01 316.61 (10.5%) 301.8 0.0% 939.01 283.36 101.3% 287.10
Subtotal 1,021.0 $ 922.75 $ 942.14 (0.5%) 1,016.4 (0.1%) $ 921.94 $ 937.05 101.3% $ 949.40
Total Claims/Benefit Cost 3,552.3 $ 959.90 $ 3,409.89 (1.2%) 3,509.7 (0.0%) $ 959.55 $ 3,367.77 102.3% $ 3,444.45
Administration 124.93 Maternity Case Rate $ 3,569.38
ATTACHMENT 4 Milliman, Inc. Page 63 of 66

3/26/20132:40 PM
State of IllinoisDepartment of Healthcare and Family Services
VMC Maternity Rate Development: Apr to Dec 2013Region 4
Populations : AllSFY11 FFS Admits: 19,045 Estimated HMO deliveries per month: 344
Annual Cost Managed Care Annual Managed CostUtilization Per Utilization Utilization Care Cost Per Adjusted Cost Proposed
Type of Service Per 1,000 Service Per Delivery Adjustment Per 1,000 Adjustment Service Per Delivery Trend Cap Rate
Inpatient HospitalMaternity Delivery 2,702.4 $ 1,271.20 $ 3,435.27 (1.5%) 2,661.8 0.0% 1,271.20 3,383.73 102.6% 3,473.27
Subtotal 2,702.4 $ 1,271.20 $ 3,435.27 (1.5%) 2,661.8 0.0% $ 1,271.20 $ 3,383.73 102.6% $ 3,473.27
PhysicianNormal Deliveries 652.2 $ 918.58 $ 599.07 4.0% 678.3 0.0% 918.58 623.03 101.3% 631.25 Cesarean Deliveries 280.5 940.11 263.66 (10.5%) 251.0 0.0% 940.11 235.98 101.3% 239.09
Subtotal 932.6 $ 925.05 $ 862.73 (0.4%) 929.3 (0.1%) $ 924.40 $ 859.01 101.3% $ 870.33
Total Claims/Benefit Cost 3,635.0 $ 1,182.39 $ 4,298.00 (1.2%) 3,591.1 (0.1%) $ 1,181.46 $ 4,242.74 102.4% $ 4,343.60
Administration 157.54 Maternity Case Rate $ 4,501.14
ATTACHMENT 4 Milliman, Inc. Page 64 of 66

3/26/20132:40 PM
State of IllinoisDepartment of Healthcare and Family Services
VMC Maternity Rate Development: Apr to Dec 2013Region 5
Populations : AllSFY11 FFS Admits: 8,388 Estimated HMO deliveries per month: 12
Annual Cost Managed Care Annual Managed CostUtilization Per Utilization Utilization Care Cost Per Adjusted Cost Proposed
Type of Service Per 1,000 Service Per Delivery Adjustment Per 1,000 Adjustment Service Per Delivery Trend Cap Rate
Inpatient HospitalMaternity Delivery 2,494.3 $ 1,082.08 $ 2,699.00 (1.5%) 2,456.9 0.0% 1,082.08 2,658.51 102.6% 2,728.86
Subtotal 2,494.3 $ 1,082.08 $ 2,699.00 (1.5%) 2,456.9 0.0% $ 1,082.08 $ 2,658.51 102.6% $ 2,728.86
PhysicianNormal Deliveries 675.5 $ 917.55 $ 619.82 4.5% 705.9 0.0% 917.55 647.71 101.3% 656.24 Cesarean Deliveries 405.3 799.38 323.99 (10.5%) 362.7 0.0% 799.38 289.97 101.3% 293.79
Subtotal 1,080.8 $ 873.24 $ 943.80 (1.1%) 1,068.6 0.5% $ 877.44 $ 937.67 101.3% $ 950.03
Total Claims/Benefit Cost 3,575.1 $ 1,018.94 $ 3,642.80 (1.4%) 3,525.5 0.1% $ 1,020.05 $ 3,596.18 102.3% $ 3,678.89
Administration 133.43 Maternity Case Rate $ 3,812.33
ATTACHMENT 4 Milliman, Inc. Page 65 of 66

3/26/20132:40 PM
State of IllinoisDepartment of Healthcare and Family Services
VMC Maternity Rate Development: Apr to Dec 2013Region: Composite
Populations : AllSFY11 FFS Admits: 45,318 Estimated HMO deliveries per month: 374
Annual Cost Managed Care Annual Managed CostUtilization Per Utilization Utilization Care Cost Per Adjusted Cost Proposed
Type of Service Per 1,000 Service Per Delivery Adjustment Per 1,000 Adjustment Service Per Delivery Trend Cap Rate
Inpatient HospitalMaternity Delivery 2,687.4 $ 1,251.97 $ 3,364.48 (1.5%) 2,647.0 0.0% 1,251.96 3,314.00 102.6% 3,401.70
Subtotal 2,687.4 $ 1,251.97 $ 3,364.48 (1.5%) 2,647.0 0.0% $ 1,251.96 $ 3,314.00 102.6% $ 3,401.70
PhysicianNormal Deliveries 654.5 $ 918.35 $ 601.03 4.0% 680.9 0.0% 918.36 625.32 101.3% 633.56 Cesarean Deliveries 287.7 932.37 268.22 (10.5%) 257.5 0.0% 932.37 240.06 101.3% 243.22
Subtotal 942.1 $ 922.63 $ 869.25 (0.4%) 938.4 0.0% $ 922.20 $ 865.38 101.3% $ 876.78
Total Claims/Benefit Cost 3,629.5 $ 1,166.48 $ 4,233.73 (1.2%) 3,585.4 0.0% $ 1,165.66 $ 4,179.38 102.4% $ 4,278.48
Administration 155.18 Maternity Case Rate $ 4,433.66
RateStatewide Mat Milliman, Inc. Page 66 of 66

T:\2013\ILM\3.038-ILM39\12-VMC Apr-Dec 2013 Capitation Rate Documentation-FINAL - Enc 3.doc
Milliman makes no representations or warranties regarding the contents of this letter to third parties. Likewise, third parties are instructed that they are to place no reliance upon this letter prepared for HFS by Milliman that would result in the creation of any duty or liability under any theory of law by Milliman or its employees to third parties. Other parties receiving this letter must rely upon their own experts in drawing conclusions about the capitation rates, assumptions, and trends.
ATTACHMENT 5

3/26/20132:41 PM
State of IllinoisDepartment of Healthcare and Family Services
Capitation Rate ComparisonContract Period: 4/1/2013 - 12/31/2013
June 2012 Current Current Proposed Proposed Percentage DollarRegion: 1 Population Distribution Cap Rate Expenditures Cap Rate Expenditures Change Change
0 Thru 90 Days 24 $ 1,291.79 $ 279,000 $ 1,400.01 $ 302,000 8.4% $ 23,00091 Days Thru 1 Year 87 124.28 97,000 153.41 120,000 23.4% 23,000 2 Thru 5 Years 89 52.03 42,000 71.61 57,000 37.6% 15,000 6 Thru 13 Years 156 46.91 66,000 70.18 99,000 49.6% 33,000 14 Thru 20 Male 33 79.95 24,000 93.28 28,000 16.7% 4,000 14 Thru 20 Female 46 129.17 53,000 125.75 52,000 (2.6%) (1,000) 21 Thru 44 Male 51 111.39 51,000 143.76 66,000 29.1% 15,000 21 Thru 44 Female 145 165.23 216,000 190.69 249,000 15.4% 33,000 45+ Years 28 228.43 58,000 297.40 75,000 30.2% 17,000
Composite 659 $ 149.29 $ 886,000 $ 176.69 $ 1,048,000 18.4% $ 162,000
June 2012 Current Current Proposed Proposed Percentage DollarRegion: 2 Population Distribution Cap Rate Expenditures Cap Rate Expenditures Change Change
0 Thru 90 Days 13 $ 1,301.60 $ 152,000 $ 1,290.37 $ 151,000 (0.9%) $ (1,000)91 Days Thru 1 Year 45 142.44 58,000 175.18 71,000 23.0% 13,000 2 Thru 5 Years 60 57.58 31,000 83.21 45,000 44.5% 14,000 6 Thru 13 Years 52 54.88 26,000 81.25 38,000 48.1% 12,000 14 Thru 20 Male 8 86.99 6,000 110.27 8,000 26.8% 2,000 14 Thru 20 Female 12 139.34 15,000 142.10 15,000 2.0% - 21 Thru 44 Male 24 121.04 26,000 158.96 34,000 31.3% 8,000 21 Thru 44 Female 74 167.15 111,000 205.48 137,000 22.9% 26,000 45+ Years 17 251.49 38,000 343.67 53,000 36.7% 15,000
Composite 305 $ 169.04 $ 463,000 $ 201.07 $ 552,000 18.9% $ 89,000
June 2012 Current Current Proposed Proposed Percentage DollarRegion: 3 Population Enrollment Cap Rate Expenditures Cap Rate Expenditures Change Change
0 Thru 90 Days 115 $ 1,166.45 $ 1,207,000 $ 1,249.89 $ 1,294,000 7.2% $ 87,00091 Days Thru 1 Year 415 153.95 575,000 188.38 704,000 22.4% 129,000 2 Thru 5 Years 1,430 63.98 823,000 88.40 1,138,000 38.2% 315,000 6 Thru 13 Years 2,977 54.23 1,453,000 76.01 2,037,000 40.2% 584,000 14 Thru 20 Male 752 96.02 650,000 97.29 658,000 1.3% 8,000 14 Thru 20 Female 820 143.03 1,056,000 139.83 1,032,000 (2.2%) (24,000) 21 Thru 44 Male 432 139.38 542,000 163.26 635,000 17.1% 93,000 21 Thru 44 Female 2,020 184.66 3,357,000 218.56 3,973,000 18.4% 616,000 45+ Years 314 293.48 829,000 338.18 956,000 15.2% 127,000
Composite 9,275 $ 125.70 $ 10,492,000 $ 148.86 $ 12,427,000 18.4% $ 1,935,000
June 2012 Current Current Proposed Proposed Percentage DollarRegion: 4 Population Enrollment Cap Rate Expenditures Cap Rate Expenditures Change Change
0 Thru 90 Days 3,981 $ 1,460.40 $ 52,325,000 $ 1,687.63 $ 60,466,000 15.6% $ 8,141,00091 Days Thru 1 Year 14,332 142.30 18,355,000 194.00 25,023,000 36.3% 6,668,000 2 Thru 5 Years 38,431 58.45 20,215,000 84.93 29,375,000 45.3% 9,160,000 6 Thru 13 Years 62,368 43.61 24,478,000 53.35 29,947,000 22.3% 5,469,000 14 Thru 20 Male 15,769 66.62 9,454,000 75.02 10,647,000 12.6% 1,193,000 14 Thru 20 Female 19,050 105.77 18,135,000 98.04 16,809,000 (7.3%) (1,326,000) 21 Thru 44 Male 3,159 111.42 3,168,000 128.31 3,648,000 15.2% 480,000 21 Thru 44 Female 38,608 156.40 54,346,000 171.10 59,454,000 9.4% 5,108,000 45+ Years 5,133 221.74 10,244,000 264.73 12,230,000 19.4% 1,986,000
Composite 200,831 $ 116.58 $ 210,720,000 $ 136.99 $ 247,599,000 17.5% $ 36,879,000
June 2012 Current Current Proposed Proposed Percentage DollarRegion: 5 Population Distribution Cap Rate Expenditures Cap Rate Expenditures Change Change
0 Thru 90 Days 152 $ 1,191.25 $ 1,630,000 $ 1,214.55 $ 1,662,000 2.0% $ 32,00091 Days Thru 1 Year 546 128.33 631,000 164.45 808,000 28.1% 177,000 2 Thru 5 Years 1,021 53.43 491,000 76.76 705,000 43.7% 214,000 6 Thru 13 Years 1,810 43.76 713,000 55.91 911,000 27.8% 198,000 14 Thru 20 Male 395 80.26 285,000 77.59 276,000 (3.3%) (9,000) 14 Thru 20 Female 459 105.13 434,000 98.21 406,000 (6.6%) (28,000) 21 Thru 44 Male 321 154.78 447,000 134.12 387,000 (13.3%) (60,000) 21 Thru 44 Female 1,102 162.82 1,615,000 187.02 1,855,000 14.9% 240,000 45+ Years 247 267.96 596,000 266.40 592,000 (0.6%) (4,000)
Composite 6,053 $ 125.58 $ 6,842,000 $ 139.54 $ 7,602,000 11.1% $ 760,000
All Region Member Months June 2012 Current Current Proposed Proposed Percentage DollarStatewide Population Enrollment Cap Rate Expenditures Cap Rate Expenditures Change Change
0 Thru 90 Days 4,285 $ 1,441.54 $ 55,593,000 $ 1,656.29 $ 63,875,000 14.9% $ 8,282,00091 Days Thru 1 Year 15,425 142.02 19,716,000 192.52 26,726,000 35.6% 7,010,000 2 Thru 5 Years 41,031 58.50 21,602,000 84.81 31,320,000 45.0% 9,718,000 6 Thru 13 Years 67,363 44.10 26,735,000 54.48 33,031,000 23.5% 6,296,000 14 Thru 20 Male 16,957 68.27 10,419,000 76.12 11,617,000 11.5% 1,198,000 14 Thru 20 Female 20,387 107.33 19,693,000 99.82 18,314,000 (7.0%) (1,379,000) 21 Thru 44 Male 3,987 118.00 4,234,000 132.95 4,771,000 12.7% 537,000 21 Thru 44 Female 41,949 157.98 59,644,000 173.94 65,668,000 10.1% 6,024,000 45+ Years 5,739 227.77 11,765,000 269.22 13,905,000 18.2% 2,140,000
Composite 217,123 $ 117.39 $ 229,401,000 $ 137.77 $ 269,227,000 17.4% $ 39,826,000
ATTACHMENT 5 Milliman, Inc. Page 1 of 2

3/26/20132:41 PM
State of IllinoisDepartment of Healthcare and Family Services
Delivery Rate ComparisonContract Period: 4/1/2013 - 12/31/2013
Monthly Current Current Proposed Proposed Percentage DollarPopulation Deliveries Cap Rate Expenditures Cap Rate Expenditures Change ChangeRegion 1 1 $ 3,755.59 $ 34,000 $ 3,538.04 $ 32,000 (5.8%) $ (2,000)
Region 2 1 3,585.62 32,000 3,399.92 31,000 (5.2%) (1,000)
Region 3 16 3,857.71 556,000 3,569.38 514,000 (7.5%) (42,000)
Region 4 344 4,425.10 13,700,000 4,501.14 13,936,000 1.7% 236,000
Region 5 12 3,988.78 431,000 3,812.33 412,000 (4.4%) (19,000)
Composite 374 $ 4,382.79 $ 14,753,000 $ 4,433.66 $ 14,925,000 1.2% $ 172,000
ATTACHMENT 5 Milliman, Inc.Page 2 of 2


![ACOs, GLOBAL PAYMENTS AND CAPITATION REIMBURSEMENT · PDF file1 Chapter 17 ACOs, GLOBAL PAYMENTS AND CAPITATION REIMBURSEMENT [Eliminating Fee-For-Service Physician Compensation] David](https://img.pdfslide.net/doc/110x75/5aa95fd37f8b9a72188ccbbd/acos-global-payments-and-capitation-reimbursement-chapter-17-acos-global-payments.jpg)