Embed Size (px)
Citation preview

The author(s) shown below used Federal funds provided by the U.S. Department of Justice and prepared the following final report:
Document Title: Re-entry: Dynamic Risk Assessment
Author: Robert D. Morgan, Ph.D., Daryl G. Kroner, Ph.D., Jeremy F. Mills, Ph.D.
Document No.: 238075
Date Received: March 2012 Award Number: 2007-IJ-CX-0027
This report has not been published by the U.S. Department of Justice. To provide better customer service, NCJRS has made this Federally-funded grant final report available electronically in addition to traditional paper copies.
Opinions or points of view expressed are those of the author(s) and do not necessarily reflect
the official position or policies of the U.S. Department of Justice.

Re-entry: Dynamic Risk Assessment 1
TECHNICAL REPORT
RE-ENTRY: DYNAMIC RISK ASSESSMENT
Award Number: 2007-IJ-CX-0027
Author(s): Robert D. Morgan, Ph.D., Daryl G. Kroner, Ph.D., and Jeremy F. Mills, Ph.D.
This project was supported by Award No. 2007-IJ-CX-0027 awarded by the National
Institute of Justice, Office of Justice Programs, U.S. Department of Justice. The opinions,
findings, and conclusions or recommendations expressed in this publication/program/exhibition
are those of the author(s) and do not necessarily reflect the views of the Department of Justice.
The research contained in this document was coordinated in part by the Texas Department of
Criminal Justice (Research Agreement #547-RL07). The contents of this report reflect the views
of the author and do not necessarily reflect the views or policies of the Texas Department of
Criminal Justice.
This document is a research report submitted to the U.S. Department of Justice. This report has not been published by the Department. Opinions or points of view expressed are those of the author(s) and do not necessarily reflect the official position or policies of the U.S. Department of Justice.

Re-entry: Dynamic Risk Assessment 2
Abstract
Much research has gone into the prediction of criminal and violent behavior. The majority of
studies in this area of risk assessment have focused on risk factors that are defined through pre-
incarceration behavior and background. With little exception, these historical risk factors are
rated by a professional based upon interview and file review. Considerable time can elapse
between initial incarceration and release and therefore the risk factors central to the risk
assessment process represent old, albeit important information. The focus on historical variables
precludes key factors of: (a) current psycho/social functioning, (b) predictors sensitive to
measuring community functioning, and (c) details of the offender’s social situation at release.
The purpose of this prospective study was to evaluate recidivism as a process, focusing on the
ability of dynamic factors to predict release performance. This project aimed to provide an initial
step towards providing supervising staff with the tools to make meaningful assessments of a
change in risk and hence change in likelihood to re-offend. Thus, this project emphasized re-
entry as a dynamic process rather than an event (crime / no crime).
For this study we had the overarching goal to investigate the dynamic predictors of post-release
performance in a correctional sample entering the community. Three specific goals led the
investigation:
Goal #1: Replicate a predominantly mental health study that successfully measured
dynamic change as it related to release incidents.
Goal #2: Expand the dynamic content to areas of psycho/social functioning.
Goal #3: Improve the methodology of previous studies, thereby allowing for stronger
conclusions.
To accomplish these goals data were obtained from 133 male offenders paroled from Texas
Department of Criminal Justice (TDCJ) correctional facilities from June 11, 2008 – January 31,
2011. Although we aimed to recruit 318 inmates, the actual sample size was significantly less
largely due to fewer parolees released to Lubbock County, the home county of the researchers,
than initially expected. Although some offenders declined to participate (refused participation),
these refusals did not account for a significant decrease in the sample size. Participants had a
mean age of 34.9 years (SD = 11.09 years) and were predominantly black (33.8%) or white
(19.5%) with approximately one-half of participants of Hispanic ethnicity (45.9%). Participants
completed, on average, 10.7 years of education and 38% of the sample graduate high school.
Offenders that participated in this study were primarily convicted of non-violent offenses
(84.3%), and 52% of participants failed a prior sentence of community supervision. Participants
were recruited to participate in a 7-wave data collection procedure (upon community re-entry
and monthly follow-up for minimum of 6 months) with measures designed to measure criminal
risk or that have proven related to criminal outcomes.
Results indicated adequate internal consistency reliability and temporal stability; however, inter-
rater reliability and convergent validity for the selected rated measures were unstable.
Consequently, the inclusion of dynamic risk factors did not contribute to the predictive power of
This document is a research report submitted to the U.S. Department of Justice. This report has not been published by the Department. Opinions or points of view expressed are those of the author(s) and do not necessarily reflect the official position or policies of the U.S. Department of Justice.

Re-entry: Dynamic Risk Assessment 3
static variables. Most notably, in this study changes in offenders dynamic functioning was not
associated with changes in community outcomes. That is, measuring change in offenders
functioning using rated measures did not increase our ability to predict community failure.
Importantly however, offenders were able to self-report risk areas that were predictive of
community failure suggesting that offenders should be involved in the criminal risk assessment.
Finally, the results of this study support previous findings that current measures of risk
prediction may not be culturally sensitive. That is, the measures appear to be better at predicting
criminal risk for white offenders, but less accurate when predicting criminal behavior for non-
white offenders (i.e., black and Hispanic offenders in this study). Implications of these findings
for clinicians and policy makers are discussed.
This document is a research report submitted to the U.S. Department of Justice. This report has not been published by the Department. Opinions or points of view expressed are those of the author(s) and do not necessarily reflect the official position or policies of the U.S. Department of Justice.

Re-entry: Dynamic Risk Assessment 4
Table of Contents
Report Title………………………………………………………………………………………..1
Award Number…………………………………………………………………………………….1
List of Authors…………………………………………………………………………………….1
Abstract………………………………………………………………………………………….2-3
Executive Summary……………………………………………………………………………..5-6
Technical Report…………………………………………………………………………………..7
Introduction…………………………………………………………………………………....7
A. Statement of the Problem………………...…………………………………………....7
B. Literature Review…………...……………………………………………………..7-16
C. Research Hypotheses…………………………………….……………………….16-17
Methods………………………………………….……………….…………………………..17
A. Participants………………...…………………………………………………………17
B. Materials……….………………...…………………..…………………………...18-22
C. Procedures………………...…………………………...………………….……...22-26
Results………………………………………………………………………………………..26
A. Statement of Results………………………………...……………………………27-37
B. Tables……………………………………………….……………………..…….38-108
C. Figures…………………………………………………………………...…….109-113
Conclusions…………………………………………………….……………………...114-118
References……………………………………………………..………………………119-127
Dissemination of Research Findings…………………………….………………..………..128
This document is a research report submitted to the U.S. Department of Justice. This report has not been published by the Department. Opinions or points of view expressed are those of the author(s) and do not necessarily reflect the official position or policies of the U.S. Department of Justice.

Re-entry: Dynamic Risk Assessment 5
Executive Summary
Much research has gone into the prediction of criminal and violent behavior. The majority of
studies in this area of risk assessment have focused on risk factors that are defined through pre-
incarceration behavior and background. With little exception, these historical risk factors are
rated by a professional based upon interview and file review. Considerable time can elapse
between initial incarceration and release and therefore the risk factors central to the risk
assessment process represent old, albeit important information. The focus on historical variables
precludes key factors of: (a) current psycho/social functioning, (b) predictors sensitive to
measuring community functioning, and (c) details of the offender’s social situation at release.
The purpose of this prospective study was to evaluate recidivism as a process, focusing on the
ability of dynamic factors to predict release performance. This project aimed to provide an initial
step towards providing supervising staff with the tools to make meaningful assessments of a
change in risk and hence change in likelihood to re-offend. Thus, this project emphasized re-
entry as a dynamic process rather than an event (crime / no crime).
For this study we had the overarching goal to investigate the dynamic predictors of post-release
performance in a correctional sample entering the community. Three specific goals led the
investigation:
Goal #1: Replicate a predominantly mental health study that successfully measured
dynamic change as it related to release incidents.
Goal #2: Expand the dynamic content to areas of psycho/social functioning.
Goal #3: Improve the methodology of previous studies, thereby allowing for stronger
conclusions.
To accomplish these goals data were obtained from 133 male offenders paroled from Texas
Department of Criminal Justice (TDCJ) correctional facilities from June 11, 2008 – January 31,
2011. Although we aimed to recruit 318 inmates, the actual sample size was significantly less
largely due to fewer parolees released to Lubbock County, the home county of the researchers,
than initially expected. Although some offenders declined to participate (refused participation),
these refusals did not account for a significant decrease in the obtained sample size. Participants
had a mean age of 34.9 years (SD = 11.09 years) and were predominantly black (33.8%) or white
(19.5%) with approximately one-half of participants of Hispanic ethnicity (45.9%). Participants
completed, on average, 10.7 years of education and 38% of the sample graduate high school.
Offenders that participated in this study were primarily convicted of non-violent offenses
(84.3%), and 52% of participants failed a prior sentence of community supervision. Participants
were recruited to participate in a 7-wave data collection procedure (upon community re-entry
and monthly follow-up for minimum of 6 months) with measures designed to measure criminal
risk or that have proven related to criminal outcomes.
Results indicated adequate internal consistency reliability and temporal stability; however, inter-
rater reliability and convergent validity for the selected rated measures were unstable.
Consequently, the inclusion of dynamic risk factors did not contribute to the predictive power of
This document is a research report submitted to the U.S. Department of Justice. This report has not been published by the Department. Opinions or points of view expressed are those of the author(s) and do not necessarily reflect the official position or policies of the U.S. Department of Justice.

Re-entry: Dynamic Risk Assessment 6
static variables. Most notably, in this study changes in offenders dynamic functioning was not
associated with changes in community outcomes. That is, measuring change in offenders
functioning using rated measures did not increase our ability to predict community failure.
Importantly however, offenders were able to self-report risk areas that were predictive of
community failure suggesting that offenders should be involved in the criminal risk assessment.
Finally, the results of this study support previous findings that current measures of risk
prediction may not be culturally sensitive. That is, the measures appear to be better at predicting
criminal risk for white offenders, but less accurate when predicting criminal behavior for non-
white offenders (i.e., black and Hispanic offenders in this study).
We anticipated that the results of this study would provide both practical/operational deliverables
and theoretical advances for clinicians, criminal justice administrators, and policy makers alike.
Although the results of this study did not produce the anticipated findings, two practical results
were obtained. First, offenders offer an important piece of information when it comes to
predicting successful re-entry; thus, incorporating offenders into the assessment process should
become standard operating practice in all risk assessments. Secondly, it appears that our risk
prediction measures are not culturally sensitive. Given arrest and conviction rates of non-white
individuals, it is imperative that future research examine the utility of current risk prediction
measures for non-white offender populations
Much research remains to be done in the field of criminal risk prediction. Future studies of this
nature should utilize a less taxing research plan than was utilized in this study by assessing
offenders at three month intervals for a minimum of 18 months. Notably, this would provide the
same number of assessment contacts per offender as was sought in this study (i.e., 6 contacts
post release). It is also recommended that future research use fewer self-report measures and rely
on parole officer ratings. In addition to reducing offender attrition (including from time
constraints and/or study burnout), it is possible that a revised methodology along these lines
would produce greater dynamic predictive ability and more closely simulate real work risk
prediction. Finally, it is recommended that future clinicians and researchers incorporate data
guided follow-up assessment based on dynamic prediction (triage assessment plan) into their
work and research protocols. Although we were unable to incorporate this strategy into this
study, such a procedure would prove a significant advance for the field. Furthermore, it would
likely produce the most reliable and valid measure of risk prediction and likely establish a new
standard for evidenced-based risk assessment.
This document is a research report submitted to the U.S. Department of Justice. This report has not been published by the Department. Opinions or points of view expressed are those of the author(s) and do not necessarily reflect the official position or policies of the U.S. Department of Justice.

Re-entry: Dynamic Risk Assessment 7
TECHNICAL REPORT
RE-ENTRY: DYNAMIC RISK ASSESSMENT
Introduction
Statement of the problem:
Much research has gone into the prediction of criminal and violent behavior. The majority of
studies in this area of risk assessment have focused on risk factors that are defined through pre-
incarceration behavior and background. With little exception, these historical risk factors are
rated by a professional based upon interview and file review. Considerable time can elapse
between initial incarceration and release and therefore the risk factors central to the risk
assessment process represent old, albeit important information. The focus on historical variables
precludes key factors of: (a) current psycho/social functioning, (b) predictors sensitive to
measuring community functioning, and (c) details of the releasing social situations. The purpose
of this prospective study is to evaluate recidivism as a process, focusing on the ability of
dynamic factors to predict release performance. This project will provide an initial step towards
providing supervising staff with the tools to make meaningful assessments of a change in risk
and hence change in likelihood to re-offend. In addition, the content of the risk variables will be
developed to correspond with realistic treatment/intervention targets. As such, the content areas
will focus on current psycho/social functioning. To successfully monitor the re-entry process the
functioning of the individual in the community needs to be the focus rather than a dichotomous
crime/no crime outcome: Thus, the results of this project will emphasize re-entry as a dynamic
process rather than an event (crime / no crime).
Literature Review:
Dynamic Variables and Recidivism
This document is a research report submitted to the U.S. Department of Justice. This report has not been published by the Department. Opinions or points of view expressed are those of the author(s) and do not necessarily reflect the official position or policies of the U.S. Department of Justice.

Re-entry: Dynamic Risk Assessment 8
Advances in risk assessment have moved from clinical judgment (with accuracy often not
much better than chance) to actuarial assessments based predominantly on historical risk factors.
These assessment instruments drew on persistent personality psychopathology such as
psychopathy (Psychopathy Checklist – Revised [PCL-R]; Hare, 2003), empirically derived static
variables (Violence Risk Appraisal Guide [VRAG], Quinsey, Harris, Rice, & Cormier, 1998;
Lifestyle Criminality Screening Form [LCSF], Walters, White, & Denney, 1991), or a risk/need
conceptualization (Level of Service Inventory-Revised [LSI-R]; Andrews & Bonta, 1995) to
determine the likelihood of recidivism (Holsinger, Lowenkamp, & Lattessa, 2006). These
approaches rely heavily on static, unchanging, variables; however, more recent developments in
risk assessment introduced dynamic factors through a structured-clinical judgment approach.
The structured-clinical judgment approach has been developed in the area of violence risk
(Historical-Clinical-Risk Management-20 [HCR-20]; Webster, Douglas, Eaves, & Hart, 1997),
risk for spousal violence (Kropp, Hart, Webster, & Eaves, 1999) and risk for sexual violence
(Boer, Hart, Kropp, & Webster, 1997). One particular advantage that the HCR-20 has over other
risk assessment instruments is the use of 10 dynamic variables: five clinical variables (lack of
insight, negative attitudes, active symptoms of major mental illness, impulsivity, and
unresponsiveness to treatment) and five risk management variables (plans lack feasibility,
exposure to destabilizers, lack of personal support, non-compliance with remediation attempts,
and stress). Conceptually, changes in these dynamic variables reflect potential changes in risk.
But the sensitivity of these dynamic variables to detect change over time has not been
demonstrated. Acknowledging that circumstances and personal experiences change over time
emphasizes offender re-entry as a dynamic process.
This document is a research report submitted to the U.S. Department of Justice. This report has not been published by the Department. Opinions or points of view expressed are those of the author(s) and do not necessarily reflect the official position or policies of the U.S. Department of Justice.

Re-entry: Dynamic Risk Assessment 9
An extensive retrospective study by Zamble and Quinsey (1997) offered an introductory
examination of the dynamic factors leading to recidivism. Their data showed that offenders were
able to identify problem areas (e.g., employment, physical or emotional health, financial
problems, family problems) that precipitated their slide into crime. Many significant differences
between recidivist and non-recidivist groups were found for both static and dynamic variables.
Most importantly, however, is that these differences remained between the groups for many
more of the dynamic variables than static variables after criminal history and age were
statistically controlled. For example, previous statistically significant differences between the
groups on static variables such as highest school grade completed, accommodation, and age of
first legal trouble disappeared when age and criminal history were controlled. However, dynamic
self-report variables such as criminal socialization, life worries, problem indices (substance
abuse, physical/emotional health, family, and friends) alcohol consumption, and emotional states
(depression, anger, and loneliness) all remained significantly different between groups.
In spite of the retrospective research design, Zamble and Quinsey (1997) provided one of the few
studies that attempted to identify dynamic variables leading to recidivism. Notably, the study
clearly demonstrated that offenders can self-identify relevant problem areas associated with their
recidivism and that psycho/social variables serve as an antecedent to crime. Further, the ability of
dynamic variables to distinguish recidivist from non-recidivist underscores the importance of
measuring proximal, relevant antecedents to crime immediately prior to the re-entry process.
Other research has examined the prediction of risk through the lens of static and dynamic
variables (Beech, Friendship, Erickson, & Hanson, 2002, Hanson & Harris, 2000). Hanson and
Harris (Hanson & Harris, 2000), for example, divided dynamic variables into stable dynamic
factors (those expected to remain unchanged for months) and acute dynamic variables (those that
This document is a research report submitted to the U.S. Department of Justice. This report has not been published by the Department. Opinions or points of view expressed are those of the author(s) and do not necessarily reflect the official position or policies of the U.S. Department of Justice.

Re-entry: Dynamic Risk Assessment 10
could change within hours or days) to predict sexual recidivism. Results showed that dynamic
variables made the largest contribution to the prediction of sexual recidivism. Although these
studies demonstrated that dynamic variables are important proximal antecedents in the prediction
of criminal behavior, they were limited by their use of retrospective research designs.
Multi-wave, Prospective Studies of Dynamic Risk Factors
Brown (2002) conducted a prospective study that examined a number of static and dynamic
measures during the re-entry process. The dynamic variables were assessed pre-release, and
again 1 month and 3 months post-release. A number of dynamic variables demonstrated change:
employment problems, marital instability, financial problems, perceived stress, perceived
problem level, negative affect, social support, criminal associates, coping ability, expected
negative value of crime, and substance abuse. When static and dynamic variables were
compared, the strongest dynamic variables outperformed the static variables in predicting
conditional release failure. The greatest level of accuracy was achieved when both static and
dynamic measures were included.
Within the set of dynamic variables, the strongest and most robust predictors were:
employment and marital support, perceived problem level, negative affect, substance abuse,
social support, and expected positive consequences of crime. Of these six robust predictors four
were of a self-report nature. Within a sample of intellectual disabled individuals, Lindsay et al
(2004) found negative affect to be predictive of institutional incidents.
Dynamic variables have also been used to assess the likelihood of mentally disordered
offenders eloping from custody or re-offending (Philipse, Koeter, van der Staak, & van den
Brink, 2006, Quinsey, Coleman, Jones, & Altrows, 1997). Quinsey et al., (1997) measured five
problem areas six months before the outcome (psychotic behaviors, skill deficits, inappropriate
This document is a research report submitted to the U.S. Department of Justice. This report has not been published by the Department. Opinions or points of view expressed are those of the author(s) and do not necessarily reflect the official position or policies of the U.S. Department of Justice.

Re-entry: Dynamic Risk Assessment 11
and procriminal social behaviors, mood problems, and social withdrawal) and four proximal
indicators one month before the outcome (dynamic antisociality, psychiatric symptoms, poor
compliance, and medication compliance/dysphoria). Of the combined nine areas studied, seven
significantly differentiated between eloper/offenders and matched controls after controlling for
static risk as measured by the VRAG. These same seven areas also differentiated the
eloper/offender group at the time of the event as compared to the same individuals at a time prior
to the event. Philipse et al (2006) also included static risk variables but found none of the six
dynamic scales added to the static variables.
In a large, multi-wave study, Quinsey et al., (2006) developed a 29-item dynamic prediction
scale to predict any incident (general risk) and violent incidents (violent risk). This scale was
completed by the clients’ caregiver and had a General Risk and Violent Risk sub-scales. With a
substantial sample (n = 568), they conducted a truly prospective study. They assessed their
clients (forensic mental health) monthly for an average of 33 months. During the follow-up
period there were 256 incidents, which occurred both in the hospital and in the community.
There was a linear relationship between the General Risk scores and incidents of any type, and a
linear relationship between Violent Risk and violent incidents. For the General Risk scores, the
probability of a high risk patient having an event in the next month increased by 3% for every
unit in the General Risk score from the score of the previous month. Of note, the predictors
appeared to perform similarly across hospital and community settings. Predictive cross-
validation has been shown with both the General Risk and Violent Risk sub-scales in a very
different sample, that of high-risk men with intellectual disabilities (Quinsey, Book, & Skilling,
2004).
The Role of Psycho/social Variables
This document is a research report submitted to the U.S. Department of Justice. This report has not been published by the Department. Opinions or points of view expressed are those of the author(s) and do not necessarily reflect the official position or policies of the U.S. Department of Justice.

Re-entry: Dynamic Risk Assessment 12
Why focus on psycho/social variables? The key published studies examining the predictive
nature of dynamic variables have focused on predominantly mental health/intellectual disability
samples, with specialized item content (i.e., Quinsey et al., 2006; Lindsay et al., 2004). We
proposed to expand dynamic assessment to psycho/social variables. Psycho/social variables are
focused upon for the following reasons: (a) they can be evaluated to permit increased focus on
interventions, which is consistent with the conceptualization that criminal offending is a process,
(b) they have made a substantial contribution to the risk assessment enterprise, and (c) they have
a long history in explaining behavior, including criminal behavior. Psycho/social variables are
grouped according to personal, social and behavioral domains (Kroner, 2005). Within the
personal domain, the four areas of impulsivity, boredom, negative affect, and criminal thinking
are covered. For many, impulsivity is seen as central to criminal offending (Gottfredson &
Hrschi, 1990) and is included as a predictor item in both the PCL-R (Hare, 2003) and the HCR-
20 (Webster, 1997). Boredom, and the closely related area of excitement, distinguished
recidivists from non-recidivists in the month prior to re-offending (Zamble & Quinsey, 1997),
and have increased intensity during criminal activities (Cantor & Ioannou, 2004). In the studies
that have examined dynamic variables, the presence of negative affect increases as failure grew
temporally closer (Zamble & Quinsey, 1997; Hanson & Harris, 2000; Brown, 2002; and Lindsay
et al., 2004). In fact, negative affect has consistently emerged as an important dynamic variable
associated with criminal acts (Cantor & Ioannou, 2004). Criminal thinking has been postulated to
support and maintain a criminal lifestyle, and thinking styles can be predictive of a variety of
criminal outcomes, including recidivism (Walters, 2002). Similarly meta-analysis of sex
offenders suggests that antisocial orientation is predictive of violent recidivism (Hanson &
Morton-Bourgon, 2005).
This document is a research report submitted to the U.S. Department of Justice. This report has not been published by the Department. Opinions or points of view expressed are those of the author(s) and do not necessarily reflect the official position or policies of the U.S. Department of Justice.

Re-entry: Dynamic Risk Assessment 13
Within the social domain, social pressure, social alienation, interpersonal and family
concerns have had empirical support for their relationship with crime. Antisocial associates
(social pressure) are predictive of recidivism, even after a statistical prediction tool has been
accounted for (Mills, Kroner, & Hemmati, 2004). Compared with recidivists, Zamble and
Quinsey (1997) found non recidivists to be more conventional and more likely to be a part of
society, and less isolated. A meta-analytic review concluded that delinquency is 10 to 15%
higher in broken homes than in intact homes (Wells & Rankin, 1991). Upon release, recidivists
experience more family problems than non-recidivists (Zamble & Quinsey, 1997).
The social situation that an offender is released to or is living in is infrequently taken into
account in risk assessment. The focus has been on person-based variables. Risk assessment
instruments (e.g., PCL-R, LSI-R, HCR-20, LCSF, VRAG) do not take into account the nature of
the social situation that an offender is being released to. For example, research has shown that
the availability of resources (i.e., professional) makes a difference in the likelihood of violence
among forensic patients (Estroff & Zimmer, 1994). There are certain social situations upon
release for which an offender has no control. Some of these include; stability of family structure,
strength of non-professional support, location of residence (i.e., high crime area), and work
associates. These can change upon release and we plan to account for these with the Social
Release Sheet.
Within the behavioral domain, substance abuse, financial/employment, and leisure are covered.
The literature shows a relationship between re-offending and substance abuse (Zamble &
Quinsey, 1997; Hanson & Harris, 2000; Friedman, 1998), financial/employment (Hanson &
Harris, 2000; Brown, 2002), and leisure (Zamble & Quinsey, 1997). In addition, the LSI-R
measures substance abuse, financial/employment, and leisure areas (Andrews & Bonta, 1995).
This document is a research report submitted to the U.S. Department of Justice. This report has not been published by the Department. Opinions or points of view expressed are those of the author(s) and do not necessarily reflect the official position or policies of the U.S. Department of Justice.

Re-entry: Dynamic Risk Assessment 14
Methodologies Central in Assessing Dynamic Risk Variables
In examining dynamic risk among offenders, four areas are of central importance: (a)
conceptual measure clarity (static vs. dynamic), (b) reliability, (c) source of data, and (d) study
design/statistical analyses.
Distinguishing between static and dynamic variables has not consistently been applied to risk
assessment inventories. For example, the Education/Employment scale on the LSI-R has some
items of a static nature and others of a dynamic nature (Mills, Kroner, & Hemmati, 2003).
Similarly, the SAQ (Loza, 2005) has both static and dynamic items embedded in a single
subscale (i.e., Criminal Tendencies). The present study will explicitly differentiate between static
and dynamic variables.
It is necessary that a dynamic item has sufficient reliability so that it will change only under
the specific conditions contained in the content of that item (Lindsay et al., 2004). A recent study
on dynamic risk predictors highlighted some of the practical issues of reliability and
measurement (Philipse et al., 2006). Using clinicians as raters, they found difficulties in
obtaining adequate reliability with dynamic items. This reduced reliability decreases the
likelihood that a single rater can continuously make a reliable judgment, thereby concluding that
the optimal method includes multiple raters. But in the applied community setting there is only
one parole officer directly working with an offender, precluding multiple ratings on each
offender. In addition, we want to ensure a maximum amount of information in the measures (less
uncertainty) to indicate potential changes of the offenders. Thus, our attention to issues of
reliability.
With regard to the source of the data, many forensic/correctional professionals believe that
self-report questionnaires are either not valid when used to predict offender recidivism or that
This document is a research report submitted to the U.S. Department of Justice. This report has not been published by the Department. Opinions or points of view expressed are those of the author(s) and do not necessarily reflect the official position or policies of the U.S. Department of Justice.

Re-entry: Dynamic Risk Assessment 15
they have inferior validity as compared to professionally rated measures. Specific concerns
regarding self-report measures are their vulnerability to lying, manipulation and self-presentation
biases (Gendreau, Irvine, & Knight, 1973; Holden, Kroner, Fekken, & Popham, 1992; Posey &
Hess, 1984; Schretlen & Arkowitz, 1990). Despite the assumption that self-report measures are
more susceptible to deception, evidence exists that self-report questionnaires can be accurate,
valid (Kendall & Norton-Ford, 1982), and equivalent to traditional methods of predicting
recidivism (Motiuk, Bonta, & Andrews, 1986; Quinsey, Khanna, & Malcolm, 1998). Self-
reported psychopathology has also been shown to be predictive of institutional adjustment
problems in samples of both violent and sexual offenders (Mills & Kroner, 2003). In addition,
the SAQ (Loza, 2005), a self-report questionnaire which was designed specifically to predict
offender general and violent recidivism, was repeatedly found to be at least as effective in
predicting offender post-release outcome when compared to four other widely used and
professional rated measures (Loza & Loza-Fanous, 2001; Kroner & Loza, 2001).
When research examining the relationship of offender completed psychometric testing is
taken together with research demonstrating offender insight into the recidivism process it is our
contention that involving the offender in anticipating (predicting) post-release performance is a
potentially valuable adjunct to the current approach to risk assessment. Offender endorsement of
anticipated antisocial activity has been predictive of later recidivism (Mills et al., 2004);
however, our current approach is to have the offender anticipate difficulties during reintegration,
not to predict his own criminal behavior. Therefore, the current research proposes to build on the
previously established efficacy of offender self-report and extend the offenders’ involvement
into the self-prediction of reintegration problems or difficulties.
This document is a research report submitted to the U.S. Department of Justice. This report has not been published by the Department. Opinions or points of view expressed are those of the author(s) and do not necessarily reflect the official position or policies of the U.S. Department of Justice.

Re-entry: Dynamic Risk Assessment 16
Apart from Quinsey and Lindsay studies, the research into dynamic variables has been
retrospective (Zamble & Quinsey, 1997; Hanson & Harris, 2000) or measured a single incident
(Walters, 2002; Philipse et al., 2006). The design of this study will involve multiple assessments,
incorporating repeated and trajectory statistical procedures. This will allow us to determine not
only which variables are dynamic, but those that are predictive over time.
Research Hypothesis
As noted above, this study was guided by three research goals. Specific hypothesis for each
of these goals are listed below.
Goal #1: Replicate a predominantly mental health study that successfully measured dynamic
change as it relates to release incidents.
Hypothesis 1: Dynamic domains can be reliably measured.
Goal #2: Expand the dynamic content to areas of psycho/social functioning.
Hypothesis 2: Concurrent Validity will be demonstrated
Hypothesis 2a: The dynamic domain will have stronger relationships among the dynamic
measures than with the static measures.
Hypothesis 2b: Dynamic domains will account for additional variance above static
variables.
Goal #3: Improve the methodology of previous studies, thereby allowing for stronger
conclusions.
Hypothesis 3: Predictive Validity will be demonstrated
Hypothesis 3a: Dynamic domains will be predictive of post-release performance.
Hypothesis 3b: Changes in the dynamic measures will reflect changes in post-release
performance.
This document is a research report submitted to the U.S. Department of Justice. This report has not been published by the Department. Opinions or points of view expressed are those of the author(s) and do not necessarily reflect the official position or policies of the U.S. Department of Justice.

Re-entry: Dynamic Risk Assessment 17
Hypothesis 3c: Dynamic domains will account for additional variance over static
variables in the prediction of post-release performance
Method
Participants
Participants consisted of 133 male offenders released from Texas Department of Criminal
Justice (TDCJ) correctional facilities. The inmates had a mean age of 34.9 years (SD = 11.09)
and were predominantly Hispanic (n = 61, 46.0%), African-American (n = 45, 33.8%) and
Caucasian (n = 26, 19.5%). They completed, on average, 10.8 years (SD = 2.0) of education, and
52 (39% earned a General Equivalency Diploma; GED). Participants were incarcerated for a
variety of crimes with the majority committing non-violent offenses (n = 107, 84.3%); 20
(15.7%) participants committed a violent offense. Only 14 participants (10.5%) were convicted
of multiple index offenses. Participants were sentenced to an average of 193 months (16 years)
in prison. A majority of participants had a criminal history as 86.2% were sentenced to
incarceration prior to their current index offense. In addition, participants in this study were
convicted, on average, of their first adult conviction at 20.5 years-of-age (SD = 4.9), and one-half
(n = 71, 53.8%) failed a prior sentence of community supervision.
Several of the above demographics and status variables of the participants in this study were
highly consistent with that of all offenders incarcerated in TDCJ prison facilities in 2005 (Texas
Department of Criminal Justice, 2006), including mean age, years of completed education, and
length of prison sentence for index offense (see Table 1). It is noted however, that this study
included an over representation of Hispanic offenders and an under-representation of Caucasian
offenders.
This document is a research report submitted to the U.S. Department of Justice. This report has not been published by the Department. Opinions or points of view expressed are those of the author(s) and do not necessarily reflect the official position or policies of the U.S. Department of Justice.

Re-entry: Dynamic Risk Assessment 18
Materials
This study included a multimethod approach to data collection which is summarized in Table
2. Data were collected from information forms, rating measures (completed by Research
Assistants), and self-report measures (completed by offenders under the Research Assistants’
supervision).
Information Forms
Demographic Sheet. The Demographic Sheet requested basic demographic information from
participants including their age, race, index offence, length of sentence, past psychiatric
diagnosis (DSM-IV-TR Axis I and Axis II), and current psychotropic medication if any. The
Demographic Sheet was completed by the researcher via semi-structured interview.
Incident Report Sheet (1). This sheet was completed in the community for any offender
incident. This sheet requested the date, nature and type of incident (e.g., property, nonviolent,
violent, sexual, etc.), record of victims, victim injury, charges, and place of residence (e.g., half-
way house, home, etc.). The Incident Report Sheet was completed by a Research Assistant.
Rating Measures
Dynamic Risk Appraisal Scale (DRAS; Quinsey et al., 2006). The DRAS is a 29-item rating
scale with two subscales. The General Risk subscale has 29 items and the Violent Risk subscale
has 10 items. For purposes of this study we utilized the 16 “Frontline Staff” items (note: our
research methodology did not allow for collecting data from clinical staff for the “Clinical
Items”). All items were rated on a 5-point Likert-type scale ranging from 0 (no problem) to 4
(severe problem). Higher scores indicated a greater corresponding risk level. The DRAS was
developed on sample of 595 psychiatric patients released over a 54-month period, and only items
This document is a research report submitted to the U.S. Department of Justice. This report has not been published by the Department. Opinions or points of view expressed are those of the author(s) and do not necessarily reflect the official position or policies of the U.S. Department of Justice.

Re-entry: Dynamic Risk Assessment 19
that were predictive of dynamic risk were retained. The items have strong face validity and
therefore minimal training was necessary for completion.
Level of Service Inventory – Revised (LSI-R; Andrews & Bonta, 1995). The LSI-R is a 54
item rating scale designed to measure criminal risk and need for treatment. Ratings of criminal
risk include both static and dynamic risk. The instrument was developed primarily on
probationers and briefly incarcerated offenders (sentenced to less than two years) for the purpose
of determining supervision requirements or halfway house placement. The 10 empirically
supported subscales of criminogenic factors include: Criminal History, Education/Employment,
Financial, Family Marital, Accommodation, Leisure/Recreation, Companions, Alcohol/Drug
Problem, Emotional/Personal, and Attitudes/Orientation. The items were scored following an
interview and file review using a dichotomous rating format (0 = absent, 1 = present). Scores on
the LSI-R range from 0 to 54. Inter-rater reliability coefficients range from .80 to .96 (Andrews
& Bonta, 1995). Validity studies with samples similar to the initial validation sample show that
higher LSI-R scores have been associated with parole failure and a return to custody (Motiuk,
Bonta, & Andrews, 1986; Bonta & Motiuk, 1990) as well as institutional misconduct (Bonta,
1989; Bonta & Motiuk, 1987). Studies employing the LSI-R have been undertaken with samples
other than those similar to the initial validation samples. Loza and Simourd (1994) reported on
the validity of the LSI-R with Canadian offenders sentenced to two or more years in prison.
Simourd and Malcolm (1998) showed the LSI-R to be valid with a sample of incarcerated sex
offenders. The LSI-R and a variant of the LSI-R have also been shown to be predictive among
native and young offender samples, respectively (Bonta, LaPrarie, & Wallace-Capretta, 1997;
Jung & Rawana, 1999).
This document is a research report submitted to the U.S. Department of Justice. This report has not been published by the Department. Opinions or points of view expressed are those of the author(s) and do not necessarily reflect the official position or policies of the U.S. Department of Justice.

Re-entry: Dynamic Risk Assessment 20
Current Problem Checklist (CPC). This 9-item checklist was developed for purposes of this
study for two reasons. First, not all of the items comprising the LSI-R and SAQ "dynamic" scales
are explicitly dynamic. For example, the Family/Marital subscale (LSI-R) has an item,
"Criminal-Family/Spouse," which if endorsed cannot change with the passage of time. Second,
as noted in the Introduction, psychosocial dynamic areas have not been used with repeated
assessments. The items included in the CPC include the same nine domains covered in the
Release and Reintegration Inventory (described below) and are theoretically separated into one
of three categories (Personal, Social, and Behavioral). CPC-Personal items include: Impulsivity,
Excitement, and Negative Affect. CPC-Social items include: Social Pressure, Social Alienation,
and Interpersonal and Family Concerns. CPC-Behavioral items include: Substance Abuse,
Financial/Employment, and Leisure. Each item has bi-polar adjectives with a 9-point Likert-type
rating scale. See Figure 1 for a copy of the CPC.
Social Release Sheet (SRS). This 11-item checklist (Figure 2) was developed for purposes of
this study to assess the social situation that an offender was released to or was currently residing.
Various facets of the offender's social situation were assessed, including situations that were
beyond the offender's control. Thus, items measure stability of family structure (SRS-Lifestyle),
strength of non-professional support (SRS-Support), and location of home, services etc. (SRS-
Structures). As with the CPC, the items are rated on 9-point Likert-type rating scales with
descriptors along the 9-points. All the items were changeable and therefore of a dynamic nature.
Self-Report Measures
Self-Appraisal Questionnaire (SAQ; Loza, 2005). The SAQ consisted of 72 “True” or
“False” items and results in one validity subscale and seven clinical subscales. The validity sub-
scale, designed to predict careless responses or other problems associated with responding to
This document is a research report submitted to the U.S. Department of Justice. This report has not been published by the Department. Opinions or points of view expressed are those of the author(s) and do not necessarily reflect the official position or policies of the U.S. Department of Justice.

Re-entry: Dynamic Risk Assessment 21
self-report measures, consists of eight items that are included in the seven clinical sub-scales.
The Clinical subscales are: Criminal Tendencies (antisocial attitudes, beliefs, behaviors, and
feelings), Antisocial Personality Problems (characteristics similar to those used to diagnose
Antisocial Personality Disorder), Conduct Problems (assesses childhood behavioral problems),
Criminal History, Alcohol/Drug Abuse, Anti-Social Associates (the offender's perception of the
effect of his associates on his criminal activities), Anger (measures reaction to anger). Offender
responses are compared to the criminal record sheet to check for inaccuracies in responding. The
reliability, construct, and concurrent validity of the SAQ have previously been demonstrated
(Loza, 2005), as has the predictive validity of the SAQ over a 2-year (Loza & Loza-Fanous,
2001; Kroner & Loza, 2001) and 5-year period (Loza & Loza-Fanous, 2003). Also, the SAQ was
found to be effective for the prediction of recidivism (Loza & Loza-Fanous, 2001). Further, the
SAQ has been cross-validated with an Australian, British, and Singaporean samples (Loza et al.,
2004).
Psychological Inventory of Criminal Thinking Styles - Historical and Current Scales (PICTS;
Walters, 2002). The PICTS is a self-report measure of thinking styles that support a criminal
lifestyle. Two recently developed scales, Historical and Current scales, from the PICTS were
utilized in this study. These rationally developed scales were derived from the 64 items that
make up the eight PICTS thinking styles. The rational procedure involved expert ratings,
distribution analyses, comparisons among custody level groups, principal component analysis,
and internal/external scale correlations. This resulted in a 13-item Current scale and a 12-item
Historical scale. As expected, the test-retest stability was strong (.77) for the Historical scale and
(.73) for the Current scale (2).
This document is a research report submitted to the U.S. Department of Justice. This report has not been published by the Department. Opinions or points of view expressed are those of the author(s) and do not necessarily reflect the official position or policies of the U.S. Department of Justice.

Re-entry: Dynamic Risk Assessment 22
Release and Reintegration Inventory (RRI; Kroner & Mills, 2003). The RRI was developed
to assess areas that may be of difficulty for individuals released from a correctional institution or
hospital. These areas have been shown to be a precursor to antisocial and criminal activity. The
RRI has nine subscales under the three domains: RRI - Personal (Impulsivity, Excitement,
Negative Affect), RRI - Social (Social Pressure, Social Alienation, Interpersonal and Family
Concerns), RRI - Behavior (Substance Abuse, Financial/Employment, Leisure). The instructions
for the RRI are of a self-prediction nature, "The following statements describe some thoughts,
feelings, and situations that people deal with when released. Read each statement and indicate
whether you agree or disagree that the statement will apply to you upon release to the
community." The instructional set for the RRI was changed for the community administrations.
The last phrase was changed to, "...will apply to you in the next month of community living."
Outcome Performance Measures.
Outcome performance measures included: unscheduled changes in reporting frequency,
parole rule violations, suspensions, revocation, arrests, and convictions for new offenses. The
number of occurrences within each of the six categories and the date of the occurrence was
recorded. Thus, the count of each type of incident is calculated. From the dates, the number of
days an offender was released (opportunity to re-offend) was calculated. For certain analyses, the
data are collapsed into incident vs. no incident (Quinsey et al., 2006). This data was collected by
the research assistant on the days that the offender was scheduled to meet with his Parole
Officer.
Procedure
All procedures utilized in this study were approved by the Texas Tech University (TTU)
Institutional Review Board for the Protection of Human Subjects TTU Committee, TTU Health
This document is a research report submitted to the U.S. Department of Justice. This report has not been published by the Department. Opinions or points of view expressed are those of the author(s) and do not necessarily reflect the official position or policies of the U.S. Department of Justice.

Re-entry: Dynamic Risk Assessment 23
Sciences Center Institutional Review Board, and the Texas Department of Criminal Justice.
Research assistants were trained by the primary investigators prior to the initiation of data
collection. This study incorporated a 7-wave assessment process to assess participants in prison
prior to their release and for a minimum of 6 monthly follow-up assessment sessions. See Tables
3a and 3b for frequency statistics regarding the number of participants that completed each wave
of assessment.
Participants for this study were initially recruited from Texas Department of Criminal Justice
(TDCJ) correctional facilities within approximately 120 mile radius of Lubbock County, Texas
(the home county of the principal investigator). TDCJ is the Texas organization that operates
state prisons, state jails, parole, and provides funding and certain oversight of community
supervision for primarily adult offenders (persons aged 17 or older) (Kroner & Loza, 2001).
Although TDCJ is responsible for prison, jail, and parole/community supervision services, for
purposes of this study, only participants incarcerated (or released, as noted below) within TDCJ
prisons were recruited for participation. Offenders incarcerated in TDCJ prisons have been
convicted of a felony (i.e., first degree, second degree, third degree, or capital felony) and
sentenced to prison.
All inmates within the 120 mile catchment area scheduled for release to Lubbock County
were identified as potential participants in this study. These potential participants were identified
from the TDCJ administrative database which provides a roster of all inmates incarcerated in
TDCJ prisons, and includes a variety of data elements on each inmate including: gender, age,
crime, institutional assignment, security classification, and Priority Designation Alert Code.
Participants were contacted for the recruitment and initial data collection session approximately
one month (30 days) prior to their scheduled release. Logistical complications (e.g., research
This document is a research report submitted to the U.S. Department of Justice. This report has not been published by the Department. Opinions or points of view expressed are those of the author(s) and do not necessarily reflect the official position or policies of the U.S. Department of Justice.

Re-entry: Dynamic Risk Assessment 24
assistants traveling to a facility to learn inmates were moved prior to the scheduled release date,
had their release date rescinded or delayed, were no longer releasing to Lubbock, County)
resulted in delayed participant enrollments for participants from prison facilities within 120 mile
radius of Texas Tech University (TTU; home institution of the principal investigator and
research assistants). Thus, the investigators began including recruitment of offenders from
outlying prisons as they presented to the Lubbock County Parole Office for their first parole
meeting (within 24 hours of release from prison). Although these offenders were not recruited
within the prison system as initially planned, they were assessed within 24-hours of release (the
exception being offenders released late on a Friday or over the weekend who were scheduled to
report by 8:00 am Monday morning may have been released for as long as 60 hours pre
participation recruitment).
Participants recruited in prison (n = 9) were met at a scheduled appointment time. Scheduled
appointments were coordinated with TDCJ staff to prevent instances of the potential participant
being unavailable (e.g., participating in external work assignments). These scheduled
appointments took place in a designated area per the institution (i.e. visitation room,
administrative office, group room) and were approximately 90 minutes in duration. Participants
recruited at the parole office (following their release from prison) were escorted to the
researchers by the assigned parole officer or escorted by the researcher from the waiting area at
the conclusion of the first parole officer meeting. This initial session in the parole office
generally lasted approximately 60 minutes. TDCJ staff and parole officers were not informed of
the results of recruitment sessions. At the scheduled assessment times, researchers associated
with this study provided inmates a verbal explanation of the nature and purpose of the study and
provided them an opportunity to volunteer their participation. Individuals agreeing to participate
This document is a research report submitted to the U.S. Department of Justice. This report has not been published by the Department. Opinions or points of view expressed are those of the author(s) and do not necessarily reflect the official position or policies of the U.S. Department of Justice.

Re-entry: Dynamic Risk Assessment 25
were provided a consent form. They were asked to review the consent form individually (or the
consent form was read to them by the researcher). They were then provided an opportunity to ask
questions, and after all questions were satisfactorily answered, they were asked to sign the
consent form and were provided the study instruments. Each consenting offender participated in
a semi-structured standardized interview, after which they were instructed to complete the
remaining instruments. The Wave 2 – Wave 7 sessions were scheduled to coordinate with each
participant’s next monthly parole officer meeting with each follow-up session generally lasting
45 minutes in duration. Session times varied marginally across participants due to work
commitments of the offender or verboseness in responding. All sessions including recruitment
took place in a private office with the door closed to ensure confidentiality, with only the
participant and researchers present. On rare occasions, due to staffing and office availability
limitations, participants would complete the written questionnaire portion of the assessments in
the presence of another participant. In such cases, verbal consent was received from each
offender and no identifying information, communication, or data was exchanged between the
participants. Interviews were never conducted in the presence of other offenders
All participants were enrolled in the study by doctoral level research assistants from the
American Psychological Association accredited doctoral program in Counseling Psychology at
TTU. All data was collected by the principal investigator and/or research assistants (primarily
doctoral level research assistants) trained in research methodology and the ethical principles for
psychologists (American Psychological Association, 2002). All data was maintained at TTU in a
locked file cabinet in the principal investigator’s secure laboratory data storage closet that
requires the passage of two locked doors to enter. Security of the data on the computer used for
This document is a research report submitted to the U.S. Department of Justice. This report has not been published by the Department. Opinions or points of view expressed are those of the author(s) and do not necessarily reflect the official position or policies of the U.S. Department of Justice.

Re-entry: Dynamic Risk Assessment 26
data analysis was ensured by the use of a security pass code available only to the principal
investigator and research assistants.
Although basic demographic information was obtained for describing the sample we did not
request identifying information. No identifying information was provided on research forms with
the exception of the consent from which was maintained separate from the research forms. For
purposes of follow-up data collection, a research log was used to track inmate name and research
number. To protect participant’s confidentiality, this research log was maintained in a secure file
cabinet in the secure research lab separate from the location of data and only accessed by the
primary researcher.
Results
Missing Data
On occasion offender files had missing data. To address the problem of missing data multiple
imputation was used to provide a statistical estimate of the missing values. Multiple imputation
fills in the missing variables from each participant’s observed values, with random noise added
to keep a correct amount of variability within the distribution (Graham, 2009; Schafer &
Graham, 2002). Using a single imputation tends to underestimate levels of uncertainty, whereas
multiple imputations better reflect levels of uncertainty in the missing data (King, Honaker,
Joseph, & Scheve, 2001). Thus, multiple imputations were run to construct multiple data sets.
This consisted of using an expectation-maximization algorithm. In the expectation phase, the
current guess of the parameters is used to fill in the missing data. The maximization phase uses
both observed and the current guess to estimate the completed data parameters. The final step
pools the multiple results. An R-based program, Amelia II (Honaker, King, & Blackwell, 2009)
was used to conduct the multiple imputations. As recommended, between eight and ten (m)
This document is a research report submitted to the U.S. Department of Justice. This report has not been published by the Department. Opinions or points of view expressed are those of the author(s) and do not necessarily reflect the official position or policies of the U.S. Department of Justice.

Re-entry: Dynamic Risk Assessment 27
imputations were conducted and the average of the m estimates was used as the point estimate. In
the final data set the observed values remained unchanged.
A. Statement of Results
Hypothesis 1: Dynamic domains can be reliably measured.
Internal Consistency. Cronbach’s Alpha coefficient (α) was used as a measure of internal
consistency reliability for both self-report and rating instruments, and was calculated at the
institutional phase (i.e., first contact) as well as the first community phase (i.e., second contact).
At the institution phase, self-report instruments (i.e., PICTS, SAQ, RRI) demonstrated excellent
total scale internal consistency (α ranged from .90 to .92; see Table 4a). Additionally, subscale
internal consistency was generally good for all self-report instruments (see Table 4a). With
regard to rating instruments, the DRAS demonstrated acceptable total scale internal consistency
(α = .62), while the majority of the LSI-R subscales (with the exception of the Family/Marital
subscale, α = .07) demonstrated acceptable internal consistency at the institution phase (α ranged
from .36 to .73; see Table 4b). At the first community phase, self-report instruments evidenced
similar internal consistency reliability, with total scales demonstrating excellent internal
consistency (α ranged from .91 to .92) and subscales demonstrating good internal consistency
(see Table 4c). With regard to rating instruments, the DRAS and CPC demonstrated acceptable
internal consistency (α = .62 and .63, respectively). The LSI-R Dynamic scales (with the
exception of the Accommodation scale, α = -.02) evidenced generally acceptable internal
consistency (α ranged from .40 to .92).The CPRG total scale (α = .56) and subscales (α ranged
from .17 to .42), however, evidenced poor internal consistency (see Table 4d).
Temporal Stability. Temporal stability was calculated using Pearson’s correlation
coefficient. Temporal stability for all self-report instruments (i.e., PICTS, SAQ, RRI) was
This document is a research report submitted to the U.S. Department of Justice. This report has not been published by the Department. Opinions or points of view expressed are those of the author(s) and do not necessarily reflect the official position or policies of the U.S. Department of Justice.

Re-entry: Dynamic Risk Assessment 28
measured by calculating test-retest reliability at Wave 1 (community re-entry) and Wave 2 (first
monthly follow-up). Test-retest reliability for self-report measures was generally acceptable,
with PICTS scales ranging from .39 to .68, SAQ scales ranging from .38 to .76, and RRI scales
ranging from .40 to .70 (see Table 5a). Temporal stability for all rating instruments (i.e., DRAS,
LSI-R, CPRG, CPC) was measured by calculating test-retest reliability at Wave 2 (first monthly
follow-up) and Wave 3 (second monthly follow-up). The DRAS General Risk scale
demonstrated acceptable test-retest reliability (r = .70); however, test-retest reliability for the
remaining rating instruments was generally unacceptable (see Table 5b).
Inter-rater Reliability. Inter-rater reliability was calculated using Pearson’s correlation
coefficients. Inter-rater reliability statistics for all rating instruments at both institution and
community phases are presented in Table 6. At the institution phase, the DRAS Total scale
demonstrated strong inter-rater reliability (r = .82), while the DRAS Violent scale yielded
adequate inter-rater reliability (r = .68). The LSI-R Total score demonstrated excellent inter-
rater reliability (r = .96), while inter-rater reliability for the LSI-R subscales was generally strong
(r ranged from .73 to .98). In the community phase, inter-rater reliability was adequate for the
DRAS Total scale (r = .69), but poor for the DRAS Violent scale (r = .37). The LSI-R Total
score demonstrated excellent inter-rater reliability (r = .96), while inter-rater reliability for LSI-R
subscales ranged from marginal to strong (r ranged from .32 to 1.0). Inter-rater reliability for
CPRG subscales was generally adequate (r ranged from .38 to .78), while the CPC items
demonstrated generally strong inter-rater reliability (r ranged from .63 to .87).
Hypothesis 2: Concurrent Validity will be demonstrated
Hypothesis 2a: The dynamic domain will have stronger relationships among the
dynamic measures than with the static measures.
This document is a research report submitted to the U.S. Department of Justice. This report has not been published by the Department. Opinions or points of view expressed are those of the author(s) and do not necessarily reflect the official position or policies of the U.S. Department of Justice.

Re-entry: Dynamic Risk Assessment 29
Concurrent validity was examined using a series of bivariate correlation analyses. Inter-
correlations among dynamic scales were compared to those of static scales. Additionally, the
relationship among dynamic scales was compared to the relationship between dynamic and static
scales. Dynamic and static scale inter-correlations at each wave of the study are presented in
Tables 7a through 7q. A summary of scale inter-correlations across all waves is presented in
Table 7r. Mean inter-correlations between both dynamic and static variables were generally
weak (see Table 7r); however, on average, dynamic scales (r = .29) were more closely related to
one another than were static scales (r = .26). This trend was repeated across all waves of the
study (see Table 7r). Additionally, the mean dynamic scale inter-correlation (r = .29) was
notably higher than the relationship between static and dynamic scales (r = .22). These findings
are consistent with our predictions though less strongly correlated in absolute terms than
expected.
Hypothesis 2b: Dynamic domains will account for additional variance above static
variables.
The next analytic steps sought to test the hypothesis that dynamic variables will account
for additional predictive variance above static variables alone. To test this hypothesis we focused
on the well-known LSI-R that contains criminal history variables, static criminogenic risk
variables and potentially dynamic criminogenic risk variables and the DRAS which is comprised
of 16 dynamic items. When using the LSI-R we chose to make a distinction between the criminal
history items (the first 10 items of the LSI-R) and the static and potentially dynamic
criminogenic items of the LSI-R because the theoretical difference between criminal risk and
need (criminogenic variables) as held by the RNR model. To that end we identified 14 static
criminogenic items within the LSI-R (i.e. less than regular Grade 10, 3 or more address changes
This document is a research report submitted to the U.S. Department of Justice. This report has not been published by the Department. Opinions or points of view expressed are those of the author(s) and do not necessarily reflect the official position or policies of the U.S. Department of Justice.

Re-entry: Dynamic Risk Assessment 30
in the past year) and 30 potentially dynamic items (i.e. financial problems, criminal associates)
that were measured repeatedly through the multi-wave study.
Three items of the DRAS were very difficult to rate within our current sample because of
the low incidence of mental illness: Item 13 Poor compliance with medication, Item 14
Psychiatric symptoms are not in remission, and Item 15 Therapeutic alliance. For this reason
these items were not included in the DRAS total. Table 8 contains the point-biserial relationship
between the LSI-R, DRAS and any post-release failure. Any post-release failure was used due to
the low baserate over the study period. The results were uncharacteristically absent of any
meaningful correlation between any of the study variables and post release failure.
For this first set of analyses we employed only the LSI-R and DRAS as measured on first
contact with the participant. In order to test the hypothesis that dynamic variables added to static
variables three logistic hierarchical regression procedures were undertaken. In the first, the LSR-
R criminal history variable was entered into the equation first with the LSI-R static and dynamic
criminogenic variable totals allowed to enter in the second step using a Forward Wald procedure.
Neither the static nor dynamic LSI-R totals added to the criminal history variable χ2 = .033, df =
1, n = 135, n.s. In the second logistic regression as in the first we entered the LSR-R criminal
history variable into the equation first with all of the DRAS items individually allowed to enter
in the second step using a Forward Wald procedure and the results were the same in that none of
the DRAS items added to criminal history. In the third logistic regression, the LSI-R static
criminogenic total score was entered first and the dynamic variable total allowed to enter in the
second step using a Forward Wald procedure. The dynamic variable total did enter the equation
on the second step β = -.15, p < .05 to produce a significant overall model χ2 = 5.7, df = 1, n =
135, p <.05.
This document is a research report submitted to the U.S. Department of Justice. This report has not been published by the Department. Opinions or points of view expressed are those of the author(s) and do not necessarily reflect the official position or policies of the U.S. Department of Justice.

Re-entry: Dynamic Risk Assessment 31
In order to investigate truly dynamic variables we formed a variable referred to as the
Current DRAS. Because the multi-wave study permitted us to re-evaluate many of the
participants multiple times we used the Current DRAS score which was that score most proximal
to failure or for those who did not fail the last time it was measured. The point biserial
correlation of the Current DRAS with Any Failure was r = .01 n = 135. Overall there was a trend
for the DRAS scores to diminish upon a second administration. Anecdotal reports from the
research assistants indicated that many of the participants were initially interviewed shortly after
they disembarked from a very long and tiring bus ride which may have impacted the
participant’s initial presentation. We therefore examined a subset of the participants (n = 74) for
whom there was more than one rating of the DRAS and utilized the last DRAS rating which
resulted in a point biserial correlation was r = .14, n.s. Though the absolute value of the
correlation improved it was not statistically significant.
As with the DRAS above we undertook to develop a LSI-R Current Dynamic variable
utilizing the most recent LSI-R Dynamic score that was available in the multi-wave follow-up.
The point biserial correlation between the LSI-R Current Dynamic score and Any Failure was r
= -.11, n.s. We again looked at the subset of offenders for whom multiple measures of the LSR-R
Dynamic variables were available (n = 74) and the point biserial correlation with Any Failure
was r = -.12, n.s. Neither of these more current measures improved the correlation of the LSI-R
with our outcome of any failure.
Hypothesis 3: Predictive Validity will be demonstrated
Hypothesis 3a: Dynamic domains will be predictive of post-release performance.
Table 9 presents the results of Wave 1 measures predicting any failure, violent failure, and
severity of failure across all of the waves of outcome data. The base rate for any failure (coded 0,
This document is a research report submitted to the U.S. Department of Justice. This report has not been published by the Department. Opinions or points of view expressed are those of the author(s) and do not necessarily reflect the official position or policies of the U.S. Department of Justice.

Re-entry: Dynamic Risk Assessment 32
1) was 18.2% and 1.5% for violent failure. Wave1 was to be collected within an institution and
consequently did not include the RCS and CPC instruments, because they were based on
community performance. Among the dynamic rated measures (DRAS, LSI-R) there were no
scales that were predictive of the three outcomes. Three self-prediction scales of Impulsivity,
Substance Abuse, and Leisure were statistically significant in predicting Any Failure. Similar
correlations for Impulsivity and Leisure were noted for predicting Severity of Failure. No scales
were predictive of Violent Failure.
Tables 10 through 13 record the results of each wave of data collected predicting the total of
the subsequent outcome data. Thus, the measures collected at Wave 2 predicting the outcome
data from Wave 2 to Wave 5, measures at Wave 3 predicted the outcome data from Wave 3 to
Wave 5, etc. These data assess which measures are consistently predictive over various outcome
time frames. A more consistent predictive measure will be a more robust predictor. To
summarize these results, we will highlight the most consistent correlations for Any Failure (since
Severity of Failure produced similar results). The focus will be on those scales with a correlation
of .15 and above.
With the rating measures, LSI-R Accommodation and the RCS Integration of Care each had
consistent correlations in two assessment waves. It appears that housing deficits and a lack of
continuity of care may contribute to community failure. From Tables A2 through A5 all other
scales had one correlation above .15 except for LSI-R Substance Abuse, LSI-R Attitudes, RCS
Resource Engagement, CPC Social Pressure, CPC Interpersonal and Family Concerns, and CPC
Leisure.
In contrast to the rating instruments, the dynamic self-report instruments showed a more
consistent relationship with subsequent outcomes. Three RRI scales demonstrated correlations
This document is a research report submitted to the U.S. Department of Justice. This report has not been published by the Department. Opinions or points of view expressed are those of the author(s) and do not necessarily reflect the official position or policies of the U.S. Department of Justice.

Re-entry: Dynamic Risk Assessment 33
above .15 across all five assessment waves; Excitement/Boredom, Interpersonal/Family
Concerns, and Leisure. RRI Impulsivity, RRI Substance Abuse, and the SAQ Criminal
Tendencies had consistent correlations across four assessment waves.
The next set of analyses used a 2-month follow-up. Thus, Wave 1 assessment was used to
predict the subsequent Wave 1 and Wave 2 follow-up periods, and Wave 2 assessment to predict
the subsequent Wave 2 and Wave 3 follow-up periods, etc. The Wave 5 follow-up period
covered only 1 month. These results are in Table 14. LSI-R Employment/Education and LSI-R
Finances were predictive for two waves. With the self-report, RRI Excitement/Boredom was
predictive across four waves. RRI Substance Abuse, Interpersonal/Family Concerns, and Leisure
were predictive across two waves.
General Self-report vs. Self-predictive. Self-report measures can be placed into categories of
self-report (general) and self-predictive. Of the dynamic measures, the PICTS Current Thinking
and the SAQ Criminal Tendencies are general self-report measures, whereas the RRI is a self-
prediction measure. Of these two categories the self-prediction scales repeatedly had stronger
and more consistent predictive correlations.
To integrate time into the analyses, Cox regressions were computed. To reduce the number of
analyses only the more robust scales from the correlational analysis were used as predictors in
the Cox regression models. Also, only the Any Failure (coded 0, 1) outcome was used. Table 15
presents the results with the dynamic rating measures. Neither the individual scales nor the
overall predictive model were statistically significant. In Table 16 three self-prediction RRI
scales of Impulsivity, Substance Abuse, and Leisure produced an overall statistically significant
model (X2 = 9.6, p > .02). No one scale was statistically significant, but the Impulsivity and
Leisure scales were the more powerful predictors. The two self-report predictors of Current
This document is a research report submitted to the U.S. Department of Justice. This report has not been published by the Department. Opinions or points of view expressed are those of the author(s) and do not necessarily reflect the official position or policies of the U.S. Department of Justice.

Re-entry: Dynamic Risk Assessment 34
Criminal Thinking and Criminal Tendencies did not result in an overall significant model,
although the SAQ Criminal Tendencies scale was close to statistical significance (Table 17). The
next Cox regression used one self-prediction scale (Impulsivity) and one self-report scale
(Criminal Tendencies) in the prediction model (Table 18). The overall model was statistically
significant (X2 = 7.6, p < .02) and the Impulsivity approached significance (p< .06). Overall,
there was a trend for the self-prediction scales to produce stronger correlations with failure over
time.
Hypothesis 3b: Changes in the dynamic measures will reflect changes in post-release
performance.
Table 19 contains the correlation between change scores between two consecutive waves and
the subsequent two wave follow-up periods. The “1_2” reflected the scores of the second
administration minus the scores of the first administration, “2_3” second and third
administration, etc. Correlations are reported for all of the subsequent follow-up periods. Overall,
there was no consistent relationship pattern of changes between the dynamic measures and
subsequent follow-up periods. In fact, the results were quite unstable. One potential exception
might be RRI Excitement/Boredom scale. With this scale, 4 of the possible predictive
correlations were over .21.
To examine the issues of change in dynamic scales able to predict failure over time, change
scores were calculated between Wave 1 and Wave 2. This change score was then used to predict
Wave 3 through 6. The same scales that were used in Tables 15 to 18 were used in Tables 20 to
23. None of the individual scales were statistically significant. Overall, no dynamic change
scores were able to predict failure over time.
This document is a research report submitted to the U.S. Department of Justice. This report has not been published by the Department. Opinions or points of view expressed are those of the author(s) and do not necessarily reflect the official position or policies of the U.S. Department of Justice.

Re-entry: Dynamic Risk Assessment 35
Hypothesis 3c: Dynamic domains will account for additional variance over static
variables in the prediction of post-release performance
One final attempt to measure the potential for dynamic risk factors to add to criminal
history was the utilization of the Current Problem Checklist. Only a subsample of offenders who
were assessed one month after release (n = 72) could be included in this analysis. The point
biserial relationship with Any Failure was r = .19, n.s.; however, the Current Problem Checklist
did not enter a logistic regression in the second step after the LSI-R Criminal History variable
when predicting Any Failure.
Post Hoc Exploration of Low Correlation with Outcome
The uncharacteristically low correlation of the predictor variables with outcome was a clear
concern worthy of further exploration. The LSI-R has a very robust relationship with recidivism
and post release failure in the literature in almost all instances. There are, however, two studies
that call into question the efficacy of the LSI-R with non-Caucasian samples. Schlager and
Simourd (2007) followed 333 African American and 112 Hispanic offenders who were released
to either a half-way house or day reporting center. Recidivism was coded as either re-arrest or
reconviction over a 2-year follow-up period. Baserates for re-arrest and reconviction were 31.9%
and 22.3% respectively for African Americans and 38.7% and 31.5% respectively for Hispanic
offenders. The baserate for re-offending was not a limiting factor in this study. Nonetheless,
point biserial correlations of the LSI-R Total with rearrest and reconviction for African
American offenders were r = .08 and r = .11. The correlations of the LSI-R Total with rearrest
and reconviction for Hispanic offenders was even poorer r = .02 and r = .04. Also noted was the
generally weak to moderate relationship between the LSI-R Criminal History variable and the
other criminogenic subscales of the LSI-R for both ethnic groups.
This document is a research report submitted to the U.S. Department of Justice. This report has not been published by the Department. Opinions or points of view expressed are those of the author(s) and do not necessarily reflect the official position or policies of the U.S. Department of Justice.

Re-entry: Dynamic Risk Assessment 36
In a similar study, Fass, Heilbrun, Dematteo, and Fretz (2008) followed a sample of
offenders for 12-months following release and coded for re-arrest which had a baserate of 21%.
The sample was predominantly African American (n = 696) but also included a large sample of
Hispanic (n = 146) and Caucasian (n = 133) offenders. It should be noted that this study did not
report point biserial correlations but rather chose to report the relationship of the LSI-R with re-
arrest using Area Under the Curve from Receiver Operating Characteristic analysis. The AUC
for African Americans, Hispanics, and Caucasians were 0.61, 0.54, and 0.55 respectively all
falling within the low predictive validity or chance levels of accuracy.
Given the relatively poor performance of the LSI-R in predicting post release failure within
ethnic minority samples we conducted a post hoc analysis of our data. We were aware that our
sample size was relatively small so the reliability might suffer but these were post hoc
exploratory analyses. Table 24 shows the group size and means for the primary variables of
interest in our initial follow-up analysis. An ANOVA indicated group differences for the LSI-R
Dynamic Criminogenic items F (2, 132) = 6.1, p < .01. ANOVA’s conducted on the remaining
variables showed the differences were not significant. Nonetheless, there appeared to be a trend
for African American and Hispanic offenders to have lower criminogenic need scores than the
Caucasian offenders. Correlations among the variables were conducted for each of the ethnic
groups and the relationships reported in Table 25. From these results there is a clear negative or
zero correlation between the LSI-R and outcome for Hispanic and African American offenders
but a positive though not statistically significant relationship between the LSI-R and outcome for
the Caucasian offenders. As a final examination we calculated the AUC statistic between the
predictor variables and the outcome of Any Failure for each of the ethnic groups separately.
AUC statistics are more robust when used with lower baserate and smaller samples. The results
This document is a research report submitted to the U.S. Department of Justice. This report has not been published by the Department. Opinions or points of view expressed are those of the author(s) and do not necessarily reflect the official position or policies of the U.S. Department of Justice.
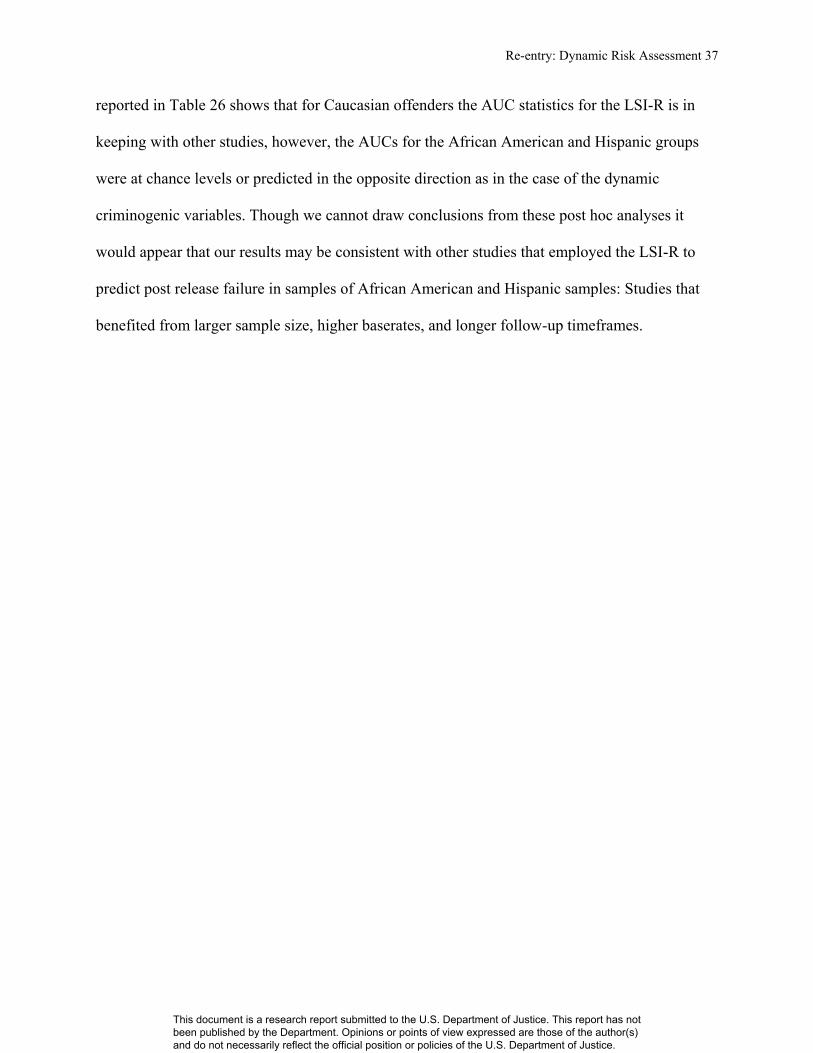
Re-entry: Dynamic Risk Assessment 37
reported in Table 26 shows that for Caucasian offenders the AUC statistics for the LSI-R is in
keeping with other studies, however, the AUCs for the African American and Hispanic groups
were at chance levels or predicted in the opposite direction as in the case of the dynamic
criminogenic variables. Though we cannot draw conclusions from these post hoc analyses it
would appear that our results may be consistent with other studies that employed the LSI-R to
predict post release failure in samples of African American and Hispanic samples: Studies that
benefited from larger sample size, higher baserates, and longer follow-up timeframes.
This document is a research report submitted to the U.S. Department of Justice. This report has not been published by the Department. Opinions or points of view expressed are those of the author(s) and do not necessarily reflect the official position or policies of the U.S. Department of Justice.

Re-entry: Dynamic Risk Assessment 38
B. Tables
Table 1
Race, Age, Years of Education, and Length of Sentence in the Current Sample and Population of
TDCJ Prisoners
---------------------------------------------------------------------------------------------------------------------
Current Sample TDCJ Prisoner Population
---------------------------------------------------------------------------------------------------------------------
Race (%)
Black/African American 33.8 38.3
Hispanic/Latino 46.0 31.2
White/Caucasian 19.5 30.0
Age (in years) 34.9 37
Years Education Completed 10.8 9.7
Median Sentence Length 193 months; 16 years 235.2 months; 19.5 years
---------------------------------------------------------------------------------------------------------------------
This document is a research report submitted to the U.S. Department of Justice. This report has not been published by the Department. Opinions or points of view expressed are those of the author(s) and do not necessarily reflect the official position or policies of the U.S. Department of Justice.

Re-entry: Dynamic Risk Assessment 39
Table 2
Multi-method assessment.
________________________________________________________________________
Dynamic Scales Static scales
___________________________________________________________________
Rating Scales
______________________
DRASb
General Risk
LSI-R*b (LSI-R-Dynamic) LSI-R**
I (LSI-R-Static)
Family/Marital Criminal History
Leisure/Recreation Education/Employment
Companions Financial
Attitudes/Orientation Accommodation
Alcohol/Drug
CPCc
Release Sheetc
Self-Report
________________________
SAQb (SAQ – Dynamic) SAQ
i (SAQ – Static)
Criminal Tendencies Criminal History
Alcohol/Drug Abuse* Conduct Problems
Antisocial Personality
Problems
Antisocial Associates**
PICTS PICTS
Currentb
Historicali
RRIb
(RRI – Personal)
Impulsivity
Boredom
Negative Affect
(RRI-Social)
Social Pressure
Social Alienation
Interpersonal and Family Concerns
(RRI – Behavior)
Substance Abuse
This document is a research report submitted to the U.S. Department of Justice. This report has not been published by the Department. Opinions or points of view expressed are those of the author(s) and do not necessarily reflect the official position or policies of the U.S. Department of Justice.

Re-entry: Dynamic Risk Assessment 40
Financial/Employment
Leisure
____________________________________________________________________
Note: *historical items will be removed from the scale for analyses.
**dynamic items will be removed from the scale for analyses. DRAS = Dynamic Risk Appraisal
Scale, LSI-R = Level of Service Inventory - Revised. CPC = Current Problem Checklist. SAQ =
Self-Appraisal Questionnaire. PICTS = Psychological Inventory of Criminal Thinking Styles.
RRI = Release and Reintegration Inventory (with institutional and community instructional sets). badministration in both institution and community.
iadministration only in institution.
cadministration only in community.
This document is a research report submitted to the U.S. Department of Justice. This report has not been published by the Department. Opinions or points of view expressed are those of the author(s) and do not necessarily reflect the official position or policies of the U.S. Department of Justice.

Re-entry: Dynamic Risk Assessment 41
Table 3a Individual follow-up sessions completed
Initial
Session
0
Months
of
Follow-
up
(Attritio
n)
1 month
of
follow-
up
2
months
of
follow-
up
3
months
of
follow-
up
4
months
of
follow-
up
5
months
of
follow-
up
6
months
of
follow-
up
7
months
of
follow-
up
136 65 24 18 6 6 4 10 3
Table 3b Cumulative follow-up sessions completed
Initial
Session
0 Months
of
follow-up (Attrition)
1 month
follow-
up
2 month
follow-
up
3 month
follow-
up
4
months
follow-
up
5
months
follow-
up
6
months
follow-
up
7
months
follow-
up
136 65 71 47 29 23 17 13 3
Note. Each month follow-up occurred as per each offender’s initial assessment schedule.
This document is a research report submitted to the U.S. Department of Justice. This report has not been published by the Department. Opinions or points of view expressed are those of the author(s) and do not necessarily reflect the official position or policies of the U.S. Department of Justice.

Re-entry: Dynamic Risk Assessment 42
Table 4a
Internal Consistency of Self-Report Instruments at Institution Phase
Scale/Subscale Range Mean Standard Deviation Cronbach’s α
PICTS .92
PICTS-CO 40 (40-80) 50.90 09.58 .77
PICTS-EN 49 (38-87) 51.99 10.55 .58
PICTS-PRB 39 (40-79) 51.92 09.75 .83
PICTS-AST 45 (40-85) 54.42 11.18 .84
PICTS-CUR 34 (39-73) 50.66 09.84 .88
PICTS-HIS 43 (39-82) 54.85 11.58 .86
PICTS-PT 45 (35-80) 53.28 10.96 .86
PICTS-RT 35 (38-73) 50.81 09.66 .89
SAQ .90
SAQ-CT 24 (0-24) 08.40 04.72 .79
SAQ-AP 12 (0-12) 01.89 01.55 .52
SAQ-CP 18 (0-18) 06.57 04.43 .87
SAQ-CH 6 (0-6) 02.56 01.45 .49
SAQ-AD 7 (0-7) 03.26 01.74 .55
SAQ-AA 3 (0-3) 01.67 00.85 -.03
SAQ-AN 5 (0-5) 01.00 01.41 .55
RRI .92
RRI-I 9 (0-9) 03.76 02.27 .63
RRI-SPA 10 (0-10) 03.24 02.23 .67
RRI-EB 10 (0-10) 03.20 02.32 .66
This document is a research report submitted to the U.S. Department of Justice. This report has not been published by the Department. Opinions or points of view expressed are those of the author(s) and do not necessarily reflect the official position or policies of the U.S. Department of Justice.

Re-entry: Dynamic Risk Assessment 43
RRI-NA 10 (0-10) 04.46 02.73 .70
RRI-SocA 10 (-2-8) 02.06 02.50 .58
RRI-SubA 10 (0-10) 02.23 02.21 .76
RRI-FE 9 (0-9) 03.24 03.24 .73
RRI-FC 12 (-3-9) -00.74 02.09 .41
RRI-L 9 (-2-7) 01.41 01.88 .52
.63
This document is a research report submitted to the U.S. Department of Justice. This report has not been published by the Department. Opinions or points of view expressed are those of the author(s) and do not necessarily reflect the official position or policies of the U.S. Department of Justice.

Re-entry: Dynamic Risk Assessment 44
Table 4b
Internal Consistency of Rating Scales at Institution Phase
Scale/Subscale Range Mean Standard
Deviation Cronbach’s α
DRAS 34 (0-34) 10.76 07.47 .62
LSI-R CH 8 (1-9) 4.91 01.81 .52
LSI-R EE 10 (0-10) 3.58 2.53 .73
LSI-R F 2 (0-2) .62 .69 .36
LSI-R FM 4 (0-4) 1.41 .90 .07
LSI-R A 3 (0-3) .81 00.94 .54
LSI-R LR 2 (0-2) .78 .51 .41
LSI-R C 5 (0-5) 2.33 01.50 .63
LSI-R ADP 9 (0-9) 3.79 2.26 .71
LSI-R EP 4 (0-4) .45 00.86 .61
LSI-R AO 4 (0-4) 1.07 1.23 .66
This document is a research report submitted to the U.S. Department of Justice. This report has not been published by the Department. Opinions or points of view expressed are those of the author(s) and do not necessarily reflect the official position or policies of the U.S. Department of Justice.

Re-entry: Dynamic Risk Assessment 45
Table 4c
Summary Internal Consistency of Self-Report Instruments at Community I Phase
Scale/Subscale Range Mean Standard
Deviation Cronbach’s α
PICTS .92
PICTS-CO 22 (40-62) 47.08 06.91 .69
PICTS-EN 39 (38-77) 48.94 09.75 .70
PICTS-PRB 27 (40-67) 48.70 08.23 .84
PICTS-AST 28 (40-67) 48.70 08.23 .79
PICTS-CUR 67 (0-67) 46.38 10.45 .87
PICTS-HIS 29 (39-68) 49.94 09.11 .83
PICTS-PT 32 (38-70) 49.38 09.07 .86
PICTS-RT 28 (36-64) 47.30 07.64 .89
SAQ .92
SAQ-CT 23 (0-23) 08.57 05.27 .84
SAQ-AP 4 (0-4) 01.53 05.27 .49
SAQ-CP 17 (0-17) 06.78 04.85 .88
SAQ-CH 5 (0-5) 02.51 01.43 .48
SAQ-AD 7 (0-7) 02.90 01.96 .66
SAQ-AA 3 (0-3) 01.76 00.93 .39
SAQ-AN 5 (0-5) 01.06 01.55 .64
RRI .91
RRI-I 10 (0-10) 02.91 02.48 .76
RRI-SPA 9 (0-9) 02.98 02.09 .67
RRI-EB 9 (0-9) 03.04 02.34 .69
This document is a research report submitted to the U.S. Department of Justice. This report has not been published by the Department. Opinions or points of view expressed are those of the author(s) and do not necessarily reflect the official position or policies of the U.S. Department of Justice.

Re-entry: Dynamic Risk Assessment 46
RRI-NA 9 (0-9) 03.83 02.62 .75
RRI-SocA 9 (-2-7) 01.80 02.28 .50
RRI-SubA 8 (0-8) 01.57 02.12 .80
RRI-FE 10 (0-10) 03.20 02.56 .76
RRI-FC 9 (-3-6) -00.64 02.34 .63
RRI-L 9 (-2-7) 02.02 02.44 .46
This document is a research report submitted to the U.S. Department of Justice. This report has not been published by the Department. Opinions or points of view expressed are those of the author(s) and do not necessarily reflect the official position or policies of the U.S. Department of Justice.

Re-entry: Dynamic Risk Assessment 47
Table 4d
Summary Internal Consistency of Rating Scales at Community I Phase
Scale/Subscale Range Mean Standard
Deviation Cronbach’s α
DRAS 36 (0-36) 08.54 07.40 .62
LSI-R Dynamic
EE 5 (0-5) 1.80 2.00 .92
F 2 (0-2) .74 .78 .55
FM 3 (0-3) .44 .72 .40
A 2 (0-2) .45 .58 -.02
LR 1 (0-1) .38 .49 --
C 5 (0-5) 1.16 1.29 .62
ADP 8 (0-8) .48 1.18 .66
EP 1 (0-1) .06 .24 --
AO 4 (0-4) .86 1.02 .52
CPC 54 (12-66) 28.20 10.15 .63
CPRG .56
CPRG RE 20 (9-29) 16.24 03.82 .17
CPRG SFP 33 (12-45) 30.53 06.99 .42
CPRG IC 18 (7-25) 16.14 03.97 .38
CPRG SS 32 (-5-27) 04.85 05.86 .26
This document is a research report submitted to the U.S. Department of Justice. This report has not been published by the Department. Opinions or points of view expressed are those of the author(s) and do not necessarily reflect the official position or policies of the U.S. Department of Justice.

Re-entry: Dynamic Risk Assessment 48
Table 5a
Temporal Stability Reliability Statistics for Self-Report Instruments at Wave 1 and Wave 2
Scale Pearson’s r
PICTS
Proactive .62
Reactive .40
Cutoff .39
Entitlement .58
Problem Avoidance .45
Self Assertion .68
Current .42
Historical .64
SAQ Total .75
CT .76
APP .53
CP .76
CH .52
ADA .65
AA .38
AN .52
RRI
I .47
SPA .40
EB .64
NA .58
This document is a research report submitted to the U.S. Department of Justice. This report has not been published by the Department. Opinions or points of view expressed are those of the author(s) and do not necessarily reflect the official position or policies of the U.S. Department of Justice.

Re-entry: Dynamic Risk Assessment 49
SA .58
SubA .70
FE .62
FC .51
L .58
This document is a research report submitted to the U.S. Department of Justice. This report has not been published by the Department. Opinions or points of view expressed are those of the author(s) and do not necessarily reflect the official position or policies of the U.S. Department of Justice.

Re-entry: Dynamic Risk Assessment 50
Table 5b
Test-Retest Reliability Statistics for Rating Instruments at Wave 2 and Wave 3
Scale Pearson’s r
DRAS General Risk .70
DRAS Violence Risk .41
LSI-R Dynamic Total .38
EE .24
F .20
FM .54
A .47
LR .37
C .42
ADP .39
EP .54
AO .39
CPRG RE .30
CPRG SFP .29
CPRG IC .10
CPRG SS .41
CPC 1 .22
CPC 2 .45
CPC 3 .57
CPC 4 .49
This document is a research report submitted to the U.S. Department of Justice. This report has not been published by the Department. Opinions or points of view expressed are those of the author(s) and do not necessarily reflect the official position or policies of the U.S. Department of Justice.

Re-entry: Dynamic Risk Assessment 51
CPC 5 .46
CPC 6 .28
CPC 7 .42
CPC 8 .44
CPC 9 .43
Table 6
Inter-rater Reliability Statistics
Scale Pearson’s r
Institution
DRAS Total .82
DRAS Violent .68
LSI-R Total .96
LSI-R-CH .98
LSI-R-EE .98
LSI-R-F .94
LSI-R-FM .90
LSI-R-A .82
LSI-R-LR .81
LSI-R-C .89
LSI-R-ADP .93
This document is a research report submitted to the U.S. Department of Justice. This report has not been published by the Department. Opinions or points of view expressed are those of the author(s) and do not necessarily reflect the official position or policies of the U.S. Department of Justice.

Re-entry: Dynamic Risk Assessment 52
LSI-R-EP .89
LSI-R-AO .73
Community
DRAS Total .69
DRAS Violent .37
LSI-R Total .96
LSI-R-EE .99
LSI-R-F .88
LSI-R-FM .70
LSI-R-A .71
LSI-R-LR .32
LSI-R-C .52
LSI-R-ADP .43
LSI-R-EP 1.0
LSI-R-AO .84
CPRG RE .38
CPRG SFP .70
CPRG IC .62
CPRG SS .78
CPC 1 .85
CPC 2 .83
CPC 3 .69
CPC 4 .63
CPC 5 .76
CPC 6 .66
CPC 7 .87
This document is a research report submitted to the U.S. Department of Justice. This report has not been published by the Department. Opinions or points of view expressed are those of the author(s) and do not necessarily reflect the official position or policies of the U.S. Department of Justice.

Re-entry: Dynamic Risk Assessment 53
CPC 8 .66
CPC 9 .70
This document is a research report submitted to the U.S. Department of Justice. This report has not been published by the Department. Opinions or points of view expressed are those of the author(s) and do not necessarily reflect the official position or policies of the U.S. Department of Justice.

Re-entry: Dynamic Risk Assessment 54
Table 7a
Intercorrelations between Dynamic Variables at Wave 1 Scale 1 2 3 4 5 6 7 8 9 10 11 12 13 14 15 16 17
1. DRAS G -- .13 .06 .14 .66 .29 .02 .12 .15 .15 .15 .13 .03 .20 .09 -.08 .17
2. LSI-R FM -- .09 .18 .05 .09 .29 .20 .00 .01 .07 .09 .19 .14 -.01 .10 .01
3. LSI-R LR -- .14 -.14 -.02 .10 .04 -.06 .17 .04 -.10 -.01 .00 .11 .10 .03
4. LSI-R C -- .02 .33 .33 .18 .09 .28 .04 .20 .21 .14 .07 .14 .19
5. LSI-R AO -- .32 -.01 .09 .07 -.04 .05 -.01 -.07 .12 .03 -.25 .10
6. SAQ CT -- .30 .23 .36 .31 .39 .27 .29 .34 .16 -.03 .31
7. SAQ ADA -- .32 .23 .17 .25 .39 .35 .43 .23 .39 .08
8. PICTS C -- .46 .45 .36 .50 .43 .34 .41 .32 .27
9. RRI I -- .27 .51 .39 .24 .45 .36 .25 .30
10. RRI SPA -- .46 .52 .54 .21 .59 .34 .49
11. RRI EB -- .47 .40 .45 .42 .33 .46
12. RRI NA -- .60 .38 .54 .37 .35
13. RRI SocA -- .23 .44 .33 .38
14. RRI SubA -- .34 .34 .30
15. RRI FE -- .35 .46
16. RRI FC -- .18
17. RRI L --
Note: Range r = .00-.66. Mean r = .24. SD r = .16.
This document is a research report submitted to the U.S. Department of Justice. This report has not been published by the Department. Opinions or points of view expressed are those of the author(s) and do not necessarily reflect the official position or policies of the U.S. Department of Justice.

Re-entry: Dynamic Risk Assessment 55
Table 7b
Intercorrelations between Static Variables at Wave 1 Scale 1 2 3 4 5 6 7 8 9 10
1. LSI-R CH -- .27 .06 .19 .22 .46 .46 .21 .10 .17
2. LSI-R EE -- .06 .22 .05 .25 .34 .16 .19 .18
3. LSI-R F -- .05 .08 .13 -.13 -.05 -.04 -.05
4. LSI-R A -- .26 .13 .19 .12 .21 .24
5. LSI-R ADP -- .19 .19 .16 .11 .38
6. SAQ CH -- .35 .19 .25 .30
7. SAQ CP -- .41 .40 .41
8. SAQ AP -- .09 .25
9. SAQ AA -- .25
10. PICTS H --
Note. Range r = .04-.46. Mean r = .20. SD r = .12.
This document is a research report submitted to the U.S. Department of Justice. This report has not been published by the Department. Opinions or points of view expressed are those of the author(s) and do not necessarily reflect the official position or policies of the U.S. Department of Justice.

Re-entry: Dynamic Risk Assessment 56
Table 7c
Relationship between Static and Dynamic Variables at Wave 1 LSI-R Dynamic SAQ Dynamic PICTS Dynamic
FM LR C AO CT ADA C
LSI-R Static
CH .25 .02 .24 .02 .20 .17 .00
EE .12 .09 .30 .01 .12 -.02 -.07
F .12 .01 -.05 .04 -.11 .06 .18
A .10 .21 .38 -.03 .11 .18 .14
ADP .23 .15 .35 -.11 .05 .51 .37
SAQ Static
CH .19 .09 .19 .02 .29 .36 .13
CP .18 .04 .37 .10 .48 .31 .18
AP .07 -.15 .17 .05 .40 .19 .18
AA .07 -.01 .24 .03 .32 .19 .06
PICTS Static
H .18 .12 .45 -.14 .38 .48 .58
Note. Range r = .00-.58. Mean r = .18. SD r = .14.
This document is a research report submitted to the U.S. Department of Justice. This report has not been published by the Department. Opinions or points of view expressed are those of the author(s) and do not necessarily reflect the official position or policies of the U.S. Department of Justice.

Re-entry: Dynamic Risk Assessment 57
Table 7d
Intercorrelations between Dynamic Variables at Wave 2 Scale 1 2 3 4 5 6 7 8 9 10 11 12 13 14 15 16 17 18 19 20 21
1. DRAS -- .31 .38 .14 .36 .46 .24 .35 .52 .33 .43 .30 .33 .08 .13 .27 .04 .31 .33 .09 .28
2. LSI-R FM -- -.06 .15 .15 .23 .2 .16 .38 .10 .13 .13 .15 -.12 -.08 .12 .08 .17 -.07 .29 .17
3. LSI-R LR -- .09 .23 .15 .17 .46 .43 .23 -.18 .26 .17 -.02 .16 .09 -.13 -.00 .26 -.05 .41
4. LSI-R C -- .23 .31 .23 .21 .32 .07 .20 .14 .07 .12 -.06 .18 .19 .07 .24 .23 .10
5. LSI-R AO -- .08 .32 .46 .33 .32 .26 .21 .12 .00 -.18 .01 .15 .15 .21 .01 .14
6. CPRG RE -- -.02 .23 .24 .07 .01 .15 .31 .13 .19 .18 -.01 .27 .14 .00 .38
7. CPRG SFP -- .51 .44 .05 .09 .11 -.09 -.06 -.19 -.03 .11 -.18 .19 .11 -.09
8. CPRG IC -- .50 .21 .06 .27 .19 .12 .08 .15 .04 .09 .31 .11 .23
9. CPRG SS -- .5 .23 .34 .36 -.02 .28 .24 .10 .37 .30 .30 .29
10. SAQ CT -- .50 .57 .50 .25 .47 .39 .15 .44 .23 .24 .32
11. SAQ ADA -- .28 .16 .14 .11 -.01 .07 .25 -.09 .35 .10
12. PICTS C -- .46 .29 .39 .41 .34 .30 .50 .42 .32
13. RRI I -- .44 .53 .53 .19 .58 .66 .47 .30
14. RRI SPA -- .43 .69 .45 .46 .45 .58 .39
15. RRI EB -- .54 .36 .58 .34 .36 .44
16. RRI NA -- .53 .54 .43 .48 .54
17. RRI SocA -- .25 .36 .35 .14
18. RRI SubA -- .31 .54 .49
Scale 1 2 3 4 5 6 7 8 9 10 11 12 13 14 15 16 17 18 19 20 21
19. RRI FE -- .40 .21
This document is a research report submitted to the U.S. Department of Justice. This report has not been published by the Department. Opinions or points of view expressed are those of the author(s) and do not necessarily reflect the official position or policies of the U.S. Department of Justice.

Re-entry: Dynamic Risk Assessment 58
20. RRI FC -- .27
21. RRI L --
Note. Range r = .00-.69. Mean r = .25. SD r = .16.
This document is a research report submitted to the U.S. Department of Justice. This report has not been published by the Department. Opinions or points of view expressed are those of the author(s) and do not necessarily reflect the official position or policies of the U.S. Department of Justice.

Re-entry: Dynamic Risk Assessment 59
Table 7e
Intercorrelations between Static Variables at Wave 2 Scales 1 2 3 4 5 6 7 8 9
1. LSI-R EE -- .40 .28 -.03 .08 .17 .06 .21 -.12
2. LSI-R F -- .12 .07 -.14 -.19 -.15 -.05 -.32
3. LSI-R A -- -.05 .14 .17 .28 .05 .04
4. LSI-R ADP -- -.05 -.14 -.06 -.11 -.16
5. SAQ CH -- .36 .30 .20 .28
6. SAQ CP -- .70 .52 .46
7. SAQ AP -- .34 .50
8. SAQ AA -- .30
9. PICTS H --
Note. Range r = .03-.70. Mean r = .21. SD r = .16.
This document is a research report submitted to the U.S. Department of Justice. This report has not been published by the Department. Opinions or points of view expressed are those of the author(s) and do not necessarily reflect the official position or policies of the U.S. Department of Justice.

Re-entry: Dynamic Risk Assessment 60
Table 7f
Relationship between Static and Dynamic Variables at Wave 2 LSI-R Dynamic SAQ Dynamic PICTS Dynamic
FM LR C AO CT ADA C
LSI-R Static
EE -.07 .26 .12 .27 .20 .07 .25
F .02 .34 .12 .36 -.01 -.19 .06
A -.00 .19 .04 -.02 .35 .22 .19
ADP .25 -.06 -.02 .03 -.15 -.09 -.12
SAQ Static
CH -.01 -.10 -.13 .10 .27 .32 .14
CP .01 .11 -.01 .10 .40 .32 .14
AP .15 .10 -.08 .05 .38 .29 .26
AA .04 -.11 .21 .25 .19 .34 .07
PICTS Static
H .05 -.22 -.02 .05 .41 .36 .35
Note. Range r = .00-.41. Mean r = .16. SD r = .12.
This document is a research report submitted to the U.S. Department of Justice. This report has not been published by the Department. Opinions or points of view expressed are those of the author(s) and do not necessarily reflect the official position or policies of the U.S. Department of Justice.

Re-entry: Dynamic Risk Assessment 61
Table 7g
Intercorrelations between Dynamic Variables at Wave 3 Scale 1 2 3 4 5 6 7 8 9 10 11 12 13 14 15 16 17 18 19 20 21
1. DRAS -- .40 .24 .14 .29 .24 -.03 .22 .24 .37 .39 .03 .21 .04 .20 .28 -.04 .37 -.11 .26 .11
2. LSI-R FM -- .20 -.02 -.14 .09 .03 .11 .37 .01 .20 .11 -.09 .13 .06 .19 .02 .31 -.28 .18 .07
3. LSI-R LR -- .21 .22 .05 .15 .28 .19 .22 -.05 .19 .21 .39 .32 .32 .05 .39 .23 .03 .39
4. LSI-R C -- .38 .13 .02 .30 .18 .08 -.01 .31 .26 .44 .38 .24 .39 .47 .32 .38 .34
5. LSI-R AO -- -.04 .07 .32 .05 .22 -.16 .02 .38 .20 .07 .09 .07 .13 .23 .34 -.21
6. CPRG RE -- .22 .30 .07 .17 .18 .17 .45 .35 .01 .18 .28 .28 -.06 .26 -.04
7. CPRG SFP -- .26 -.02 -.01 -.44 -.16 -.18 -.12 -.07 -.11 -.12 -.17 .03 -.08 .22
8. CPRG IC -- .36 .11 -.05 -.10 .26 .18 .16 -.01 -.09 .27 .14 .35 -.12
9. CPRG SS -- .12 .18 -.12 -.12 -.01 -.16 -.11 -.31 .24 -.21 .06 .15
10. SAQ CT -- .35 .42 .36 .06 .37 .34 -.04 .36 .29 .14 .43
11. SAQ ADA -- .22 .31 -.08 .23 .21 .07 .37 -.26 .08 .20
12. PICTS C -- .39 .28 .32 .34 .30 .23 .15 .16 .30
13. RRI I -- .61 .53 .49 .33 .53 .40 .60 .20
14. RRI SPA -- .39 .55 .55 .61 .61 .61 .24
15. RRI EB -- .76 .38 .61 .48 .47 .46
16. RRI NA -- .49 .58 .45 .45 .44
17. RRI SocA -- .48 .37 .40 .17
18. RRI SubA -- .34 .61 .36
Scale 1 2 3 4 5 6 7 8 9 10 11 12 13 14 15 16 17 18 19 20 21
19. RRI FE -- .43 .32
This document is a research report submitted to the U.S. Department of Justice. This report has not been published by the Department. Opinions or points of view expressed are those of the author(s) and do not necessarily reflect the official position or policies of the U.S. Department of Justice.

Re-entry: Dynamic Risk Assessment 62
20. RRI FC -- .03
21. RRI L --
Note. Range r = .01-.76. Mean r = .24. SD r = .16.
This document is a research report submitted to the U.S. Department of Justice. This report has not been published by the Department. Opinions or points of view expressed are those of the author(s) and do not necessarily reflect the official position or policies of the U.S. Department of Justice.

Re-entry: Dynamic Risk Assessment 63
Table 7h
Intercorrelations between Static Variables at Wave 3 Scales 1 2 3 4 5 6 7 8 9
1. LSI-R EE -- .47 .08 -.05 .32 -.01 -.06 .13 -.07
2. LSI-R F -- .08 -.14 .32 -.17 -.10 .18 -.13
3. LSI-R A -- .06 -.12 .21 .07 .08 ..22
4. LSI-R ADP -- .04 .18 .05 -.11 .19
5. SAQ CH -- .39 .23 .47 -.12
6. SAQ CP -- .61 .54 .33
7. SAQ AP -- .53 .36
8. SAQ AA -- .30
9. PICTS H --
Note. Range r = .01-.61. Mean r = .21. SD r = .16.
This document is a research report submitted to the U.S. Department of Justice. This report has not been published by the Department. Opinions or points of view expressed are those of the author(s) and do not necessarily reflect the official position or policies of the U.S. Department of Justice.

Re-entry: Dynamic Risk Assessment 64
Table 7i
Intercorrelations between Dynamic Variables at Wave 4 Scale 1 2 3 4 5 6 7 8 9 10 11 12 13 14 15 16 17 18 19 20 21
1. DRAS -- .02 .43 .10 .35 .57 .25 .45 .44 .18 .02 .30 .05 -.13 .14 .10 -.11 .07 .31 .15 .39
2. LSI-R FM -- -.20 .09 -.22 -.16 .42 .26 .38 -.28 .16 -.11 -.17 .14 -.41 -.10 -.20 -.08 .09 -.08 -.06
3. LSI-R LR -- .51 .30 .39 .33 .58 -.00 .66 .39 .43 .37 .40 .49 .46 .16 .36 .54 .45 .57
4. LSI-R C -- -.02 .26 .34 .71 .19 .38 .31 .37 .10 .53 .35 .54 -.03 .41 .63 .06 .39
5. LSI-R AO -- -.12 .18 .46 .18 .64 .13 .26 .20 -.09 .22 .11 .25 -.07 .17 .41 .42
6. CPRG RE -- .32 -.06 -.00 .16 .10 .02 -.14 -.28 .03 .08 -.26 -.03 .09 -.16 .20
7. CPRG SFP -- .30 .10 .01 .26 .23 .14 .34 -.03 .27 .06 .24 .30 .22 .52
8. CPRG IC -- .56 .33 .28 .41 -.02 .41 .13 .38 -.02 .41 .69 .29 .38
9. CPRG SS -- -.38 -.29 -.04 -.50 -.16 -.33 -.12 -.62 -.18 .10 -.57 .00
10. SAQ CT -- .59 .61 .57 .34 .55 .64 .34 .41 .42 .44 .54
11. SAQ ADA -- .43 .44 .31 .08 .49 .17 .47 .24 .37 .15
12. PICTS C -- .64 .55 .55 .75 .41 .61 .66 .39 .79
13. RRI I -- .39 .53 .44 .31 .53 .35 .48 .49
14. RRI SPA -- .35 .75 .51 .67 .65 .39 .55
15. RRI EB -- .58 .34 .32 .50 .28 .73
16. RRI NA -- .42 .61 .58 .28 .77
17. RRI SocA -- .50 .39 .72 .34
18. RRI SubA -- .62 .39 .30
Scale 1 2 3 4 5 6 7 8 9 10 11 12 13 14 15 16 17 18 19 20 21
19. RRI FE -- .50 .56
This document is a research report submitted to the U.S. Department of Justice. This report has not been published by the Department. Opinions or points of view expressed are those of the author(s) and do not necessarily reflect the official position or policies of the U.S. Department of Justice.

Re-entry: Dynamic Risk Assessment 65
20. RRI FC -- .30
21. RRI L --
Note. Range r = .00-.79. Mean r = .33. SD r = .20.
This document is a research report submitted to the U.S. Department of Justice. This report has not been published by the Department. Opinions or points of view expressed are those of the author(s) and do not necessarily reflect the official position or policies of the U.S. Department of Justice.

Re-entry: Dynamic Risk Assessment 66
Table 7j
Intercorrelations between Static Variables at Wave 4 Scales 1 2 3 4 5 6 7 8 9
1. LSI-R EE -- .64 .30 .21 .01 .10 -.01 .48 .17
2. LSI-R F -- .39 .35 -.06 .01 -.03 .25 .30
3. LSI-R A -- .37 .23 -.19 .11 .41 .33
4. LSI-R ADP -- .07 -.31 -.17 .03 .20
5. SAQ CH -- .50 .31 .69 .53
6. SAQ CP -- .64 .50 .51
7. SAQ AP -- .53 .41
8. SAQ AA -- .56
9. PICTS H --
Note. Range r = .01-.69. Mean r = .30. SD r = .20.
This document is a research report submitted to the U.S. Department of Justice. This report has not been published by the Department. Opinions or points of view expressed are those of the author(s) and do not necessarily reflect the official position or policies of the U.S. Department of Justice.

Re-entry: Dynamic Risk Assessment 67
Table 7k
Intercorrelations between Dynamic Variables at Wave 5 Scale 1 2 3 4 5 6 7 8 9 10 11 12 13 14 15 16 17 18 19 20 21
1. DRAS -- .32 -.17 -.09 .05 .44 .53 .62 .61 .15 .08 -.01 -.09 -.24 -.10 .04 -.40 -.36 -.22 -.34 .02
2. LSI-R FM -- .08 -.17 .21 .20 .76 .33 .32 .01 -.01 -.03 -.28 -.03 -.29 .06 -.23 -.22 .04 -.17 -.02
3. LSI-R LR -- .57 .37 -.25 .23 .28 .15 .22 .14 .20 .35 .19 .38 .49 .29 .55 .65 .75 .38
4. LSI-R C -- .34 -.38 .01 .65 .49 .18 .28 .08 .15 .72 .00 .27 .47 .66 .72 .52 -.02
5. LSI-R AO -- -.49 .06 .25 .45 .59 -.16 .62 .28 -.01 .38 .47 .06 -.03 -.05 -.19 .63
6. CPRG RE -- .46 -.08 -.21 .05 -.27 .06 -.03 -.01 -.06 -.12 -.06 -.14 .20 -.05 .17
7. CPRG SFP -- .45 .27 .32 .16 .22 .10 .25 .03 .35 .07 .14 .31 .14 .26
8. CPRG IC -- .75 .20 .20 .06 -.10 .24 -.31 -.02 -.16 -.23 .34 -.14 -.08
9. CPRG SS -- .14 -.11 -.04 -.17 -.28 -.17 -.02 -.36 -.38 -.24 -.47 -.06
10. SAQ CT -- .35 .78 .80 .41 .60 .56 .28 .25 .49 .44 .45
11. SAQ ADA -- .26 .30 .33 .30 .31 .24 .44 .18 .41 -.01
12. PICTS C -- .56 .50 .55 .64 .32 .24 .39 .28 .73
13. RRI I -- .48 .69 .42 .12 .43 .48 .61 .49
14. RRI SPA -- .27 .49 .40 .55 .88 .70 .39
15. RRI EB -- .68 .41 .46 .11 .59 .64
16. RRI NA -- .70 .54 .25 .58 .66
17. RRI SocA -- .54 .31 .45 .28
18. RRI SubA -- .35 .67 .21
Scale 1 2 3 4 5 6 7 8 9 10 11 12 13 14 15 16 17 18 19 20 21
19. RRI FE -- .62 .19
This document is a research report submitted to the U.S. Department of Justice. This report has not been published by the Department. Opinions or points of view expressed are those of the author(s) and do not necessarily reflect the official position or policies of the U.S. Department of Justice.

Re-entry: Dynamic Risk Assessment 68
20. RRI FC -- .25
21. RRI L --
Note. Range r = .00-.88. Mean r = .31. SD r = .21.
This document is a research report submitted to the U.S. Department of Justice. This report has not been published by the Department. Opinions or points of view expressed are those of the author(s) and do not necessarily reflect the official position or policies of the U.S. Department of Justice.

Re-entry: Dynamic Risk Assessment 69
Table 7l
Intercorrelations between Static Variables at Wave 5 Scales 1 2 3 4 5 6 7 8 9
1. LSI-R EE -- .63 .41 .00 -.30 -.24 .02 -.09 -.00
2. LSI-R F -- .79 .13 -.10 .03 .12 .06 .39
3. LSI-R A -- .08 .61 -.10 .30 -.04 -.04
4. LSI-R ADP -- -.04 .22 -.02 .30 -.37
5. SAQ CH -- .33 .30 .16 .22
6. SAQ CP -- .62 .81 .49
7. SAQ AP -- .63 .66
8. SAQ AA -- .44
9. PICTS H --
Note. Range r = .00-.81. Mean r = .28. SD r = .24.
This document is a research report submitted to the U.S. Department of Justice. This report has not been published by the Department. Opinions or points of view expressed are those of the author(s) and do not necessarily reflect the official position or policies of the U.S. Department of Justice.

Re-entry: Dynamic Risk Assessment 70
Table 7m
Intercorrelations between Dynamic Variables at Wave 6 Scale 1 2 3 4 5 6 7 8 9 10 11 12 13 14 15 16 17 18 19 20 21
1. DRAS -- .30 .45 .06 .09 .28 .17 .30 .56 .21 .30 .74 .44 .56 .46 .01 .16 .61 .12 -.01 .25
2. LSI-R FM -- -.26 -.30 .28 -.41 .29 -.20 .71 .15 -.36 -.26 -.40 -.34 -.48 -.34 .09 -.26 .24 -.18 -.52
3. LSI-R LR -- .00 -.38 .56 .16 .44 .00 -.07 .22 .53 .09 .39 .23 -.19 .06 .37 .22 .00 -.04
4. LSI-R C -- -.26 .17 -.11 .21 -.07 .29 .47 .14 .59 .38 .31 .65 -.08 .48 .66 .59 .08
5. LSI-R AO -- -.07 .12 .17 .32 .83 .24 .22 .33 -.11 .00 -.18 -.11 -.03 .24 -.33 .12
6. CPRG RE -- -.42 .19 -.27 .30 .43 .75 .47 .55 .54 -.05 .35 .39 .44 .00 .47
7. CPRG SFP -- .53 .52 .29 .39 .03 .14 -.06 .03 .02 -.21 .02 -.14 -.09 .08
8. CPRG IC -- .06 .60 .52 .15 .30 -.16 -.02 -.26 -.39 -.09 .14 -.17 .09
9. CPRG SS -- .51 .39 .61 .49 .38 .09 .03 -.00 .60 .56 .22 -.06
10. SAQ CT -- .48 .45 .60 .23 .33 .08 .12 .27 .53 -.12 .16
11. SAQ ADA -- .20 .84 .29 .58 .31 .30 .58 .12 .43 .34
12. PICTS C -- .44 .86 .61 .37 .50 .57 .54 .00 .60
13. RRI I -- .56 .77 .57 .48 .73 .37 .55 .42
14. RRI SPA -- .73 .74 .70 .73 .49 .38 .66
15. RRI EB -- .69 .63 .65 .23 .29 .64
16. RRI NA -- .57 .56 .29 .64 .62
17. RRI SocA -- .64 .10 .40 .48
18. RRI SubA -- .33 .56 .23
Scale 1 2 3 4 5 6 7 8 9 10 11 12 13 14 15 16 17 18 19 20 21
19. RRI FE -- .27 .05
This document is a research report submitted to the U.S. Department of Justice. This report has not been published by the Department. Opinions or points of view expressed are those of the author(s) and do not necessarily reflect the official position or policies of the U.S. Department of Justice.

Re-entry: Dynamic Risk Assessment 71
20. RRI FC -- .14
21. RRI L --
Note. Range r = .00-.86. Mean r = .33. SD r = .22.
This document is a research report submitted to the U.S. Department of Justice. This report has not been published by the Department. Opinions or points of view expressed are those of the author(s) and do not necessarily reflect the official position or policies of the U.S. Department of Justice.

Re-entry: Dynamic Risk Assessment 72
Table 7n
Intercorrelations between Static Variables at Wave 6 Scales 1 2 3 4 5 6 7 8 9
1. LSI-R EE -- .64 .22 -.12 .29 .10 .06 .32 .80
2. LSI-R F -- .37 .16 .30 -.33 .00 -.17 .60
3. LSI-R A -- .21 .36 .16 .17 .22 .03
4. LSI-R ADP -- .18 -.13 -.52 -.48 -.31
5. SAQ CH -- .56 -.14 .32 .62
6. SAQ CP -- .23 .75 .47
7. SAQ AP -- .23 .28
8. SAQ AA -- .33
9. PICTS H --
Note. Range r = .00-.80. Mean r = .31. SD r = .20.
This document is a research report submitted to the U.S. Department of Justice. This report has not been published by the Department. Opinions or points of view expressed are those of the author(s) and do not necessarily reflect the official position or policies of the U.S. Department of Justice.

Re-entry: Dynamic Risk Assessment 73
Table 7o
Intercorrelations between Dynamic Variables at Wave 7 Scale 1 2 3 4 5 6 7 8 9 10 11 12 13 14 15 16 17 18 19 20 21
1. DRAS -- -.40 .29 .45 -.30 .32 .22 -.02 .53 .29 -.34 .15 .09 -.20 .07 -.07 -.27 .00 .07 -.02 -.05
2. LSI-R FM -- -.30 -.20 -.31 -.21 -.29 -.35 .05 -.45 -.33 -.02 -.20 -.06 -.20 -.03 .16 -.16 -.34 .27 -.05
3. LSI-R LR -- .66 .29 -.04 .74 .36 .29 .59 .19 .27 .26 .08 -.03 -.07 -.41 -.06 .16 -.24 -.24
4. LSI-R C -- .10 -.21 .43 .03 .04 .69 .30 .65 .42 .23 .24 .34 .00 .31 .33 .14 .02
5. LSI-R AO -- -.41 .06 .12 -.45 .24 .18 -.22 .13 .00 -.08 -.41 -.57 -.33 .16 -.38 -.15
6. CPRG RE -- -.07 .17 .32 -.35 -.49 .03 -.51 -.36 -.27 -.20 -.19 -.09 -.50 -.15 -.19
7. CPRG SFP -- .62 .56 .83 .48 .40 .61 .46 .39 .31 .08 .28 .60 .12 .19
8. CPRG IC -- .27 .70 .11 -.02 .10 .35 .28 .01 .17 .09 .70 .33 .54
9. CPRG SS -- .27 -.25 .31 -.11 -.01 .14 -.13 .02 -.02 .04 .38 .34
10. SAQ CT -- .37 .34 .57 .47 .52 .36 .20 .32 .86 .30 .36
11. SAQ ADA -- -.05 .78 .65 .59 .47 .53 .74 .45 .25 -.10
12. PICTS C -- .07 .43 .44 .69 .33 .37 .37 .33 .85
13. RRI I -- .72 .74 .58 .41 .70 .60 .38 -.01
14. RRI SPA -- .95 .76 .75 .86 .79 .76 .55
15. RRI EB -- .76 .73 .87 .83 .77 .58
16. RRI NA -- .75 .78 .60 .52 .58
17. RRI SocA -- .84 .55 .80 .48
18. RRI SubA -- .58 .71 .33
Scale 1 2 3 4 5 6 7 8 9 10 11 12 13 14 15 16 17 18 19 20 21
19. RRI FE -- .63 .67
This document is a research report submitted to the U.S. Department of Justice. This report has not been published by the Department. Opinions or points of view expressed are those of the author(s) and do not necessarily reflect the official position or policies of the U.S. Department of Justice.

Re-entry: Dynamic Risk Assessment 74
20. RRI FC -- .56
21. RRI L --
Note. Range r = .00-.95. Mean r = .35. SD r = .24.
This document is a research report submitted to the U.S. Department of Justice. This report has not been published by the Department. Opinions or points of view expressed are those of the author(s) and do not necessarily reflect the official position or policies of the U.S. Department of Justice.

Re-entry: Dynamic Risk Assessment 75
Table 7p
Intercorrelations between Static Variables at Wave 7 Scales 1 2 3 4 5 6 7 8 9
1. LSI-R EE -- .33 .26 .70 -.06 -.42 -.36 .07 -.09
2. LSI-R F -- -.26 .26 -.23 -.36 .26 .12 -.06
3. LSI-R A -- -.14 .21 -.11 -.19 -.04 .49
4. LSI-R ADP -- .15 .16 -.15 .52 .03
5. SAQ CH -- .60 .34 .43 .34
6. SAQ CP -- .38 .67 .71
7. SAQ AP -- .40 .43
8. SAQ AA -- .81
9. PICTS H --
Note. Range r = .03-.81. Mean r = .31. SD r = .21.
This document is a research report submitted to the U.S. Department of Justice. This report has not been published by the Department. Opinions or points of view expressed are those of the author(s) and do not necessarily reflect the official position or policies of the U.S. Department of Justice.

Re-entry: Dynamic Risk Assessment 76
Table 7q
Relationship between Static and Dynamic Variables at Wave 7 LSI-R Dynamic SAQ Dynamic PICTS Dynamic
FM LR C AO CT ADA C
LSI-R Static
EE -.15 .39 .26 .72 .48 .52 -.05
F -.28 .39 .09 .55 .52 .-.04 -.45
A -.20 .22 .71 .10 .54 -.26 .78
ADP -.20 .00 -.14 .48 .14 .48 -.36
SAQ Static
CH -.62 -.27 -.05 .06 .03 .50 .13
CP -.19 -.66 -.27 -.53 -.11 .47 -.23
AP -.34 .03 .19 -.17 -.19 .10 -.43
AA -.58 -.05 .06 -.20 .31 .54 -.14
PICTS Static
H -.29 .31 .68 -.25 .45 .69 .25
Note. Range r = .00-.78. Mean r = .32. SD r = .21.
This document is a research report submitted to the U.S. Department of Justice. This report has not been published by the Department. Opinions or points of view expressed are those of the author(s) and do not necessarily reflect the official position or policies of the U.S. Department of Justice.

Re-entry: Dynamic Risk Assessment 77
Table 7r
Summary of Static and Dynamic Scale Intercorrelations across Waves
Wave
Dynamic r Static r Dynamic and Static r
1
.24 .20 .18
2
.25 .21 .16
3
.24 .21 --
4
.33 .30 --
5
.31 .28 --
6
.33 .31 --
7
.35 .31 .32
Mean
.29
.26
.22
Range
.24-.35 .20-.31 .16-.32
This document is a research report submitted to the U.S. Department of Justice. This report has not been published by the Department. Opinions or points of view expressed are those of the author(s) and do not necessarily reflect the official position or policies of the U.S. Department of Justice.

Re-entry: Dynamic Risk Assessment 78
Table 8
Predictor Point Biserial r
LSI-R Total
LSI-R Criminal History -.02
LSI-R Static .07
LSI-R Dynamic -.14
DRAS Total -.04
Previous violence .02
No responsibility .06
Anxiety, anger, frustration .01
No remorse .04
Unrealistic discharge plans -.12
Escape or escape attempt -.12
Unusual thought content .05
Complaints about staff -.08
No empathy for others .03
This document is a research report submitted to the U.S. Department of Justice. This report has not been published by the Department. Opinions or points of view expressed are those of the author(s) and do not necessarily reflect the official position or policies of the U.S. Department of Justice.

Re-entry: Dynamic Risk Assessment 79
Antisocial attitudes -.12
Poor compliance -.10
Few coping skills -.04
Denies all problems .02
This document is a research report submitted to the U.S. Department of Justice. This report has not been published by the Department. Opinions or points of view expressed are those of the author(s) and do not necessarily reflect the official position or policies of the U.S. Department of Justice.

Re-entry: Dynamic Risk Assessment 80
Table 9
Zero-order correlations between Wave 1 DRAS, LSI-R, RRI, PICTS, SAQ, and outcome measures (across all waves, N = 137)
__________________________________________________________________________________
Instruments Any Failure Violent Failure Severity of Failure
__________________________________________________________________________________
Ratings
DRASa -.06 .00 -.08
LSI-R (Total dynamic) -.14 -.13 -.18*
Employment/Education -.08 -.11 -.08
Finances -.01 -.02 -.03
Family .07 -.03 .00
Accommodation -.18* -.11 -.22*
Companions -.10 -.07 -.12
Substance Abuse -.12 -.11 -.16
Attitude .00 .04 -.01
Self-Report
Release and Reintegration Inventory
Impulsivity .20* .03 .21*
Social Pressure and Associates .00 -.02 -.01
Excitement/Boredom .15 -.05 .14
This document is a research report submitted to the U.S. Department of Justice. This report has not been published by the Department. Opinions or points of view expressed are those of the author(s) and do not necessarily reflect the official position or policies of the U.S. Department of Justice.

Re-entry: Dynamic Risk Assessment 81
Negative Affect -.05 .00 -.06
Social Alienation .00 .02 .02
Substance Abuse .21* .10 .14
Financial/Employment .00 -.01 .02
Interpersonal/Family Concerns .10 .05 .09
Leisure .25* .05 .24*
PICTS Current Thinking .01 .03 -.02
SAQ Criminal Tendencies .08 .11 .10
___________________________________________________________________________________
Note: *p < .05. Base rates: Any Failure = .182 (fail_1_5), Violent Failure = .015 (vio_1_5), Severity of Failure = .182 (conv_1_5).
This document is a research report submitted to the U.S. Department of Justice. This report has not been published by the Department. Opinions or points of view expressed are those of the author(s) and do not necessarily reflect the official position or policies of the U.S. Department of Justice.

Re-entry: Dynamic Risk Assessment 82
Table 10
Zero-order correlations between Wave 2 DRAS, LSI-R RRI, PICTS, SAQ, RCS, CPC and outcome measures (Wave 2 through Wave 5; N = 72)
__________________________________________________________________________________
Instruments Any Failure Violent Failure Severity of Failure
__________________________________________________________________________________
Ratings
DRASa -.06 .00 -.08
LSI-R (Total dynamic) .03 -.01 .07
Employment/Education .19 .14 .16
Finances -.03 .04 -.02
Family .06 -.08 .05
Accommodation .30* -.09 .24*
Companions -.21 -.11 -.24*
Substance Abuse .13 -.07 .07
Attitude -.10 .02 -.11
Risk Context Scale
Resource Engagement .06 -.12 .00
Social Friendship Presence -.26* -.14 -.27*
Integration of Care -.07 .01 -.07
Social Stability .02 -.14 .00
This document is a research report submitted to the U.S. Department of Justice. This report has not been published by the Department. Opinions or points of view expressed are those of the author(s) and do not necessarily reflect the official position or policies of the U.S. Department of Justice.

Re-entry: Dynamic Risk Assessment 83
Current Problem Checklist
Impulsivity .00 -.05 -.02
Boredom .08 .05 .09
Negative Affect .37* .24 .41*
Social Pressure .00 -.08 .00
Social Alienation -.07 -.14 -.05
Interpersonal and Family Concerns .07 -.09 .09
Substance Abuse .08 -.07 .01
Financial/Employment .13 .01 .12
Leisure .09 -.07 .10
Self-Report
Release and Reintegration Inventory (n = 52)
Impulsivity .17 --a .15
Social Pressure and Associates .01 -- .02
Excitement/Boredom .17 -- .18
Negative Affect .02 -- .00
Social Alienation -.18 -- -.16
Substance Abuse .28* --- .25
Financial/Employment .05 -- .09
Interpersonal/Family Concerns .23 -- .26
This document is a research report submitted to the U.S. Department of Justice. This report has not been published by the Department. Opinions or points of view expressed are those of the author(s) and do not necessarily reflect the official position or policies of the U.S. Department of Justice.

Re-entry: Dynamic Risk Assessment 84
Leisure .18 -- .16
PICTS Current Thinking .18 -- .18
SAQ Criminal Tendencies .16 -- .17
____________________________________________________________________________________________
Note: *p < .05. aNo recidivism among completed scales. Base rates: Any Failure = .182 (fail_1_5), Violent Failure = .015 (vio_1_5), Severity of Failure = .182
(conv_1_5).
This document is a research report submitted to the U.S. Department of Justice. This report has not been published by the Department. Opinions or points of view expressed are those of the author(s) and do not necessarily reflect the official position or policies of the U.S. Department of Justice.

Re-entry: Dynamic Risk Assessment 85
Table 11
Zero-order correlations between Wave 3 DRAS, LSI-R RRI, PICTS, SAQ RCS, CPC and outcome measures (Wave 3 through wave 5; N = 45)
___________________________________________________________________________________
Instruments Any Failure Violent Failure Severity of Failure
___________________________________________________________________________________
Ratings
DRASa .15 -- .03
LSI-R (Total dynamic) .06 -- .01
Employment/Education .03 -- .02
Finances -.08 -- -.07
Family .29 -- .22
Accommodation .09 -- .15
Companions .00 -- -.02
Substance Abuse - .02 -- -.09
Attitude -.04 -- -.10
Risk Context Scale
Resource Engagement -.15 -- -.21
Social Friendship Presence -.04 -- .01
Integration of Care .17 -- .11
Social Stability .30* -- .18
This document is a research report submitted to the U.S. Department of Justice. This report has not been published by the Department. Opinions or points of view expressed are those of the author(s) and do not necessarily reflect the official position or policies of the U.S. Department of Justice.

Re-entry: Dynamic Risk Assessment 86
Current Problem Checklist
Impulsivity .23 -- .23
Boredom -.13 -- -.13
Negative Affect .17 -- .17
Social Pressure .07 -- .07
Social Alienation -.03 -- -.03
Interpersonal and Family Concerns .13 -- .13
Substance Abuse .14 -- .14
Financial/Employment .25 -- .25
Leisure -.03 -- -.03
Self-Report
Release and Reintegration Inventory (n = 45)
Impulsivity .07 --a .04
Social Pressure and Associates .01 -- .00
Excitement/Boredom .32* -- .35*
Negative Affect .10 -- .06
Social Alienation .03 -- .03
Substance Abuse .48* -- .40*
Financial/Employment .15 -- .17
Interpersonal/Family Concerns .38* -- .34*
This document is a research report submitted to the U.S. Department of Justice. This report has not been published by the Department. Opinions or points of view expressed are those of the author(s) and do not necessarily reflect the official position or policies of the U.S. Department of Justice.

Re-entry: Dynamic Risk Assessment 87
Leisure .15 -- .13
PICTS Current Thinking .14 -- .09
SAQ Criminal Tendenciesb .40* -- .39*
___________________________________________________________________________________________
Note: *p < .05. aNo recidivism among completed scales. bn = 38. Base rates: Any Failure = .073 (fail_2_5), Severity of Failure = .051 (conv_2_5).
This document is a research report submitted to the U.S. Department of Justice. This report has not been published by the Department. Opinions or points of view expressed are those of the author(s) and do not necessarily reflect the official position or policies of the U.S. Department of Justice.

Re-entry: Dynamic Risk Assessment 88
Table 12
Zero-order correlations between Wave 4 DRAS, LSI-R RRI, PICTS, SAQ RCS, CPC and outcome measures (wave 4 through wave 5; N = 25)
__________________________________________________________________________________
Instruments Any Failure Violent Failure Severity of Failure
__________________________________________________________________________________
Ratings
DRASa -.17 -- -.17
LSI-R (Total dynamic) .16 -- .16
Employment/Education .05 -- .05
Finances .13 -- .13
Family -.24 -- -.24
Accommodation .12 -- .12
Companions .37 -- .37
Substance Abuse - .13 -- -.13
Attitude .06 -- .06
Risk Context Scale
Resource Engagement -.13 -- -.13
Social Friendship Presence -.22 -- -.22
Integration of Care .24 -- .24
Social Stability -.27 -- -.27
This document is a research report submitted to the U.S. Department of Justice. This report has not been published by the Department. Opinions or points of view expressed are those of the author(s) and do not necessarily reflect the official position or policies of the U.S. Department of Justice.

Re-entry: Dynamic Risk Assessment 89
Current Problem Checklist
Impulsivity .06 -- .06
Boredom -.27 -- -.27
Negative Affect -.25 -- -.25
Social Pressure .12 -- .12
Social Alienation -.29 -- -.29
Interpersonal and Family Concerns -.23 -- -.23
Substance Abuse -.22 -- -.22
Financial/Employment .04 -- .04
Leisure -.16 -- -.16
Self-Report
Release and Reintegration Inventory (n = 21)
Impulsivity .23 --a .23
Social Pressure and Associates -.01 -- -.01
Excitement/Boredom .43* -- .43*
Negative Affect -.07 -- -.07
Social Alienation .16 -- .16
Substance Abuse .10 -- .10
Financial/Employment .17 -- .17
Interpersonal/Family Concerns .40* -- .40*
This document is a research report submitted to the U.S. Department of Justice. This report has not been published by the Department. Opinions or points of view expressed are those of the author(s) and do not necessarily reflect the official position or policies of the U.S. Department of Justice.

Re-entry: Dynamic Risk Assessment 90
Leisure .17 -- .17
PICTS Current Thinking .03 -- .03
SAQ Criminal Tendenciesb .21 -- .21
__________________________________________________________________________________________
Note: *p < .05. aNo recidivism among completed scales. bn = 19. Base rates: Any Failure = .051 (fail_3_5), Severity of Failure = .051 (conv_3_5).
This document is a research report submitted to the U.S. Department of Justice. This report has not been published by the Department. Opinions or points of view expressed are those of the author(s) and do not necessarily reflect the official position or policies of the U.S. Department of Justice.

Re-entry: Dynamic Risk Assessment 91
Table 13
Zero-order correlations between Wave 5 DRAS, LSI-R RRI, PICTS, SAQ RCS, CPC and outcome measures (Wave 5; N = 18)
__________________________________________________________________________________
Instruments Any Failure Violent Failure Severity of Failure
__________________________________________________________________________________
Ratings
DRASa -.32 -- -.32
LSI-R (Total dynamic) -.02 -- -.02
Employment/Education -.15 -- -.15
Finances .25 -- .25
Family -.18 -- -.18
Accommodation .30 -- .30
Companions .00 -- .00
Substance Abuse - .12 -- -.12
Attitude -.02 -- -.02
Risk Context Scale
Resource Engagement -.12 -- -.12
Social Friendship Presence .20 -- 20
Integration of Care -.28 -- -.28
Social Stability -.11 -- -.11
This document is a research report submitted to the U.S. Department of Justice. This report has not been published by the Department. Opinions or points of view expressed are those of the author(s) and do not necessarily reflect the official position or policies of the U.S. Department of Justice.

Re-entry: Dynamic Risk Assessment 92
Current Problem Checklist
Impulsivity -.02 -- -.02
Boredom .38 -- .38
Negative Affect -.18 -- -.18
Social Pressure -.05 -- -.05
Social Alienation .26 -- .26
Interpersonal and Family Concerns -.16 -- -.16
Substance Abuse -.03 -- -.03
Financial/Employment .03 -- .03
Leisure -.15 -- -.15
Self-Report
Release and Reintegration Inventory (n = 16)
Impulsivity .67* --a .67*
Social Pressure and Associates .52* -- .52*
Excitement/Boredom .49 -- .49
Negative Affect .35 -- .35
Social Alienation .38 -- .38
Substance Abuse .43 -- .43
Financial/Employment .52* -- .52*
Interpersonal/Family Concerns .72* -- .72*
This document is a research report submitted to the U.S. Department of Justice. This report has not been published by the Department. Opinions or points of view expressed are those of the author(s) and do not necessarily reflect the official position or policies of the U.S. Department of Justice.

Re-entry: Dynamic Risk Assessment 93
Leisure .46 -- .46
PICTS Current Thinking .49 -- .49
SAQ Criminal Tendenciesb .52* -- .52*
_________________________________________________________________________________________
Note: *p < .05. aNo recidivism among completed scales. bn = 19. Base rates: Any Failure = .022 (fail_4_5), Severity of Failure = .022 (conv_4_5).
This document is a research report submitted to the U.S. Department of Justice. This report has not been published by the Department. Opinions or points of view expressed are those of the author(s) and do not necessarily reflect the official position or policies of the U.S. Department of Justice.

Re-entry: Dynamic Risk Assessment 94
Table 14
Zero-order correlations between each Wave of DRAS, LSI-R RRI, PICTS, SAQ, RCS, and the subsequent 2 months of follow-up for any failure.
____________________________________________________________________________
Any Failure within 2 months
__________________________________________________
Instruments Wave 1 Wave 2 Wave 3 Wave 4 Wave5
______________________________________________________________________________________
Ratings
DRASa -.12 .04 -- -.05 -.32
LSI-R (Total dynamic) -.13 .06 -.02 .18 -.02
Employment/Education -.05 .23* .07 .15 -.15
Finances -.06 .04 .02 .26 .25
Family .06 -.11 .13 -.19 -.18
Accommodation -.17* .10 -.01 .01 .30
Companions -.10 -.20 -.13 .30 .00
Substance Abuse -.11 .10 -.11 -.10 -.12
Attitude -.03 -.03 -.06 .05 -.02
Risk Context Scale
Resource Engagement -- .08 -.05 -.16 -.12
Social Friendship Presence -- -.18 .09 -.21 20
This document is a research report submitted to the U.S. Department of Justice. This report has not been published by the Department. Opinions or points of view expressed are those of the author(s) and do not necessarily reflect the official position or policies of the U.S. Department of Justice.

Re-entry: Dynamic Risk Assessment 95
Integration of Care -- .12 .06 .25 -.28
Social Stability -- .01 -.27 -.24 -.11
Self-Report
Release and Reintegration Inventory
Impulsivity .11 .10 .00 .18 .67*
Social Pressure and Associates .04 .07 -.05 -.22 .52*
Excitement/Boredom .11 .16 .16 .18 .49
Negative Affect -.05 -.04 .01 -.28 .35
Social Alienation .01 -.09 .06 -.03 .38
Substance Abuse .07 .11 .16 -.13 .43
Financial/Employment .06 .08 .12 -.07 .52*
Interpersonal/Family Concerns .08 .01 .25 .01 .72*
Leisure .21* .04 .05 -.04 .46
PICTS Current Thinking -.02 .21 -.04 -.26 .49
SAQ Criminal Tendencies .00 -.07 .18 -.06 .52*
_______________________________________________________________________________________
Note: *p < .05. aNo recidivism among completed scales. Wave 1 N = 137, ) bn = 19. Base rates: Any Failure = .022 (fail_4_5), Severity of Failure = .022
(conv_4_5). Wave 5 administration of instruments had only 1 month of subsequent follow-up. CPC omitted because of single items.
This document is a research report submitted to the U.S. Department of Justice. This report has not been published by the Department. Opinions or points of view expressed are those of the author(s) and do not necessarily reflect the official position or policies of the U.S. Department of Justice.

Re-entry: Dynamic Risk Assessment 96
Table 15: Cox Regression Analyses for Ratings of LSI-R Dynamic items and DRAS predicting Any Failure (N = 74).
Risk Ratio (95% Confidence Intervals)
Wald Significance
LSI-R Dynamic Items .19 .66
DRAS .00 .95
Note: Overall model, X2 = .20, ns.
Table 16: Cox Regression Analyses for Release and Reintegration Inventory Scales of Impulsivity, Substance Abuse, and Leisure
predicting Any Failure (N = 74).
Risk Ratio (95% Confidence Intervals)
Wald Significance
Impulsivity 1.8 .18
Substance Abuse
Leisure
.84 .26
1.3 .36
Note: Overall model, X2 = 9.6, p< .02.
Table 17: Cox Regression Analyses for PICTS Current Criminal Thinking and the SAQ Criminal Tendencies predicting Any Failure
(N = 74).
Risk Ratio (95% Confidence Intervals)
Wald Significance
Current Criminal Thinking .02 .90
Criminal Tendencies 3.1 .08
Note: Overall model, X2 = 3.5, ns.
This document is a research report submitted to the U.S. Department of Justice. This report has not been published by the Department. Opinions or points of view expressed are those of the author(s) and do not necessarily reflect the official position or policies of the U.S. Department of Justice.

Re-entry: Dynamic Risk Assessment 97
Table 18: Cox Regression Analyses for RRI Impulsivity and the SAQ Criminal Tendencies predicting Any Failure (N = 74).
Wald Significance
Impulsivity 3.6 .06
Criminal Tendencies 1.2 .28
Note: Overall model, X2 = 7.6, p < .02.
This document is a research report submitted to the U.S. Department of Justice. This report has not been published by the Department. Opinions or points of view expressed are those of the author(s) and do not necessarily reflect the official position or policies of the U.S. Department of Justice.

Re-entry: Dynamic Risk Assessment 98
Table 19
Zero-order correlations between each the raw score change between two waves of the DRAS, LSI-R RRI, PICTS, SAQ, RCS, and the subsequent 2 months of
follow-up for any failure.
_____________________________________________________________________________________
Instrument Change (Wave) Wave 2_3 Wave 3_4 Wave 4_5 Wave 5
_____________________________________________________________________________________
Ratings
DRAS (1_2) .14 -.07 -.04 .00
DRAS (2_3) .01 -.01 -.05
DRAS (3_4) -.21 --a
DRAS (4_5) --a
LSI-R (Total dynamic) (1_2) .04 -.05 -.04 .04
LSI-R (Total dynamic) (2_3) .13 -.01 - .27
LSI-R (Total dynamic) (3_4) .22 --a
LSI-R (Total dynamic) (4_5) --a
Employment/Education (1_2) .17 .16 -.08 -.05
Employment/Education (2_3) .20 .09 -.18
Employment/Education (3_4) .00 --a
Employment/Education (4_5) --a
Finances (1_2) .04 -.06 -.08 -.03
This document is a research report submitted to the U.S. Department of Justice. This report has not been published by the Department. Opinions or points of view expressed are those of the author(s) and do not necessarily reflect the official position or policies of the U.S. Department of Justice.

Re-entry: Dynamic Risk Assessment 99
Finances (2_3) .10 .05 -.31*
Finances (3_4) .34 --a
Finances (4_5) --a
Family (1_2) -.22 -.06 .05 .09
Family (2_3) .08 .07 .01
Family (3_4) .04 --a
Family (4_5) --a
Accommodation (1_2) .18 .15 .14 .13
Accommodation (2_3) -.07 -.18 -.25
Accommodation (3_4) .03 --a
Accommodation (4_5) --a
Companions (1_2) -.13 -.14 -.05 .02
Companions (2_3) .04 -.04 .02
Companions (3_4) .46 --a
Companions (4_5) --a
Substance Abuse (1_2) --a -.14 -.14 -.03
Substance Abuse (2_3) .03 .03 --a
Substance Abuse (3_4) -.09 --a
Substance Abuse (4_5) --a
Attitude (1_2) -.02 -.20 -.11 .02
This document is a research report submitted to the U.S. Department of Justice. This report has not been published by the Department. Opinions or points of view expressed are those of the author(s) and do not necessarily reflect the official position or policies of the U.S. Department of Justice.

Re-entry: Dynamic Risk Assessment 100
Attitude (2_3) .06 -.01 -.14
Attitude (3_4) -.16 --a
Attitude (4_5) --a
Risk Context Scale
Social Friendship Presence (2_3) -- -.16 -.08 .14
Social Friendship Presence (3_4) -- .18 --a
Social Friendship Presence (4_5) --a
Resource Engagement (2_3) -- .10 .15 .13
Resource Engagement (3_4) -- -.40 -.40
Resource Engagement (4_5) -- --a
Integration of Care(2_3) -- -.27 .25 -.01
Integration of Care(3_4) -- -.41 --a
Integration of Care(4_5) -- --a
Social Stability(2_3) -- -.29 -.15 .24
Social Stability(3_4) -- .19 --a
Social Stability(4_5) -- --a
Self-Report
Release and Reintegration Inventory
Impulsivity (1_2) -.01 -.15 -.18 -.05
Impulsivity (2_3) .03 -.33 -.37*
This document is a research report submitted to the U.S. Department of Justice. This report has not been published by the Department. Opinions or points of view expressed are those of the author(s) and do not necessarily reflect the official position or policies of the U.S. Department of Justice.

Re-entry: Dynamic Risk Assessment 101
Impulsivity (3_4) .22 .32
Impulsivity (4_5) --a
Social Pressure & Associates (1_2) .06 -.01 -.02 -.01
Social Pressure & Associates (2_3) .04 .11 .12
Social Pressure & Associates (3_4) -.02 -.05
Social Pressure & Associates (4_5) --a
Excitement/Boredom (1_2) .21 .11 -.17 -.11
Excitement/Boredom (2_3) .01 .21 .03
Excitement/Boredom (3_4) .27 .31
Excitement/Boredom (4_5) --a
Negative Affect (1_2) .02 -.03 -.05 -.05
Negative Affect (2_3) .23 -.08 -.16
Negative Affect (3_4) .05 -.05
Negative Affect (4_5) --a
Social Alienation (1_2) .09 -.00 -.14 -.06
Social Alienation (2_3) .29 .08 -.07
Social Alienation (3_4) .28 .53*
Social Alienation (4_5) --a
Substance Abuse (1_2) .02 -.10 -.19 -.05
Substance Abuse (2_3) .04 .05 -.06
This document is a research report submitted to the U.S. Department of Justice. This report has not been published by the Department. Opinions or points of view expressed are those of the author(s) and do not necessarily reflect the official position or policies of the U.S. Department of Justice.

Re-entry: Dynamic Risk Assessment 102
Substance Abuse (3_4) -.18 -.10
Substance Abuse (4_5) --a
Financial/Employment (1_2) .05 .02 .05 .14
Financial/Employment (2_3) -.05 -.11 -.24
Financial/Employment (3_4) .04 .02
Financial/Employment (4_5) --a
Interpersonal/Family Concerns (1_2) -.07 .18 .18 .03
Interpersonal/Family Concerns (2_3) .03 -.11 .09
Interpersonal/Family Concerns (3_4) .13 .15
Interpersonal/Family Concerns (4_5) --a
Leisure (1_2) -.03 .07 .12 .05
Leisure (2_3) .00 -.14 -.24
Leisure (3_4) .20 .47
Leisure (4_5) --a
PICTS Current Thinking (1_2) .03 .01 -.02 .01
PICTS Current Thinking (2_3) .17 .04 -.12
PICTS Current Thinking (3_4) -.08 -.09
PICTS Current Thinking (4_5) --a
SAQ Criminal Tendencies (1_2) .07 .13 .09 .13
SAQ Criminal Tendencies (2_3) .17 -.12 -.27
This document is a research report submitted to the U.S. Department of Justice. This report has not been published by the Department. Opinions or points of view expressed are those of the author(s) and do not necessarily reflect the official position or policies of the U.S. Department of Justice.
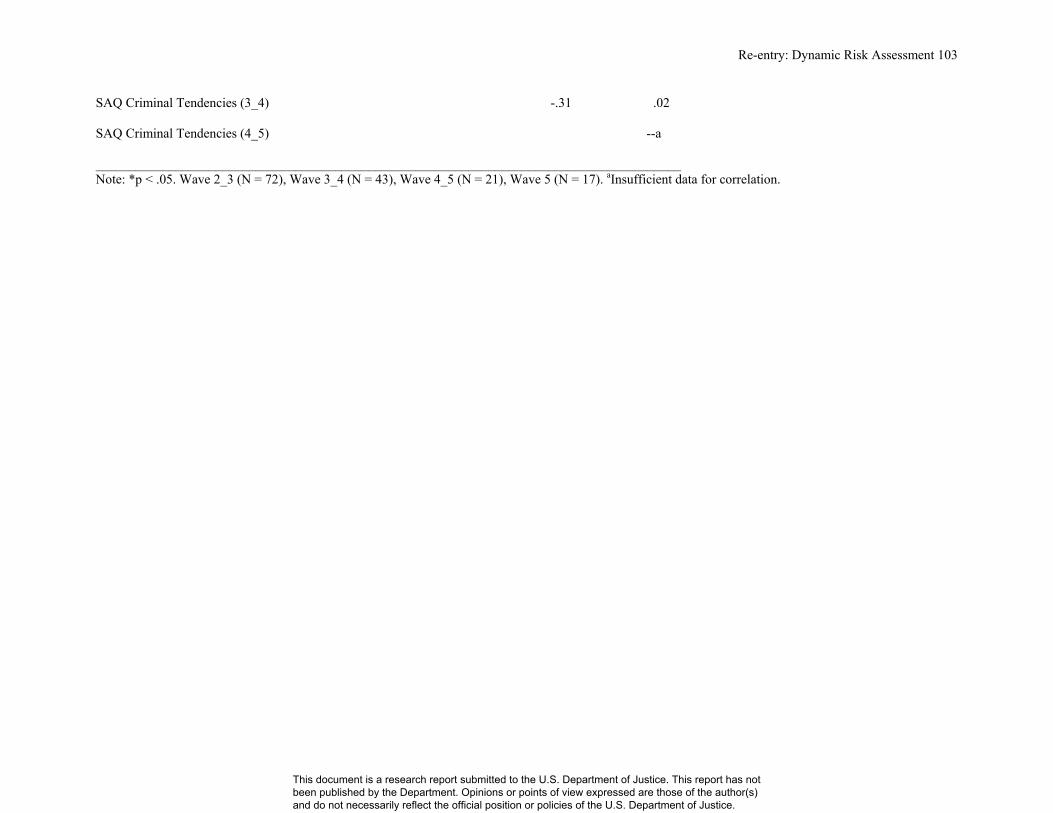
Re-entry: Dynamic Risk Assessment 103
SAQ Criminal Tendencies (3_4) -.31 .02
SAQ Criminal Tendencies (4_5) --a
________________________________________________________________________________________
Note: *p < .05. Wave 2_3 (N = 72), Wave 3_4 (N = 43), Wave 4_5 (N = 21), Wave 5 (N = 17). aInsufficient data for correlation.
This document is a research report submitted to the U.S. Department of Justice. This report has not been published by the Department. Opinions or points of view expressed are those of the author(s) and do not necessarily reflect the official position or policies of the U.S. Department of Justice.

Re-entry: Dynamic Risk Assessment 104
Table 20: Cox Regression Analyses for Ratings of LSI-R Dynamic items Change from Wave 1 to Wave 2 and DRAS Change from
Wave 1 to Wave 2 predicting Any Failure (N = 60).
Wald Significance
LSI-R Dynamic Items (W1_W2) .62 .43
DRAS (W1_W2) .02 .90
Note: Overall model, X2 = .74, ns.
Table 21: Cox Regression Analyses for Release and Reintegration Inventory Scales of Impulsivity, Substance Abuse, and Leisure
Change from Wave 1 to Wave 2 predicting Any Failure (N = 46).
Wald Significance
Impulsivity (W1_W2) .49 .48
Substance Abuse (W1_W2)
Leisure (W1_W2)
.71 .40
.24 .62
Note: Overall model, X2 = 1.1, ns.
Table 22: Cox Regression Analyses for PICTS Current Criminal Thinking Change from Wave 1 to Wave 2 and the SAQ Criminal
Tendencies Change from Wave 1 to Wave 2 predicting Any Failure (N = 47).
Wald Significance
Current Criminal Thinking(W1_W2) 1.1 .30
Criminal Tendencies (W1_W2) 0.3 .58
Note: Overall model, X2 = 1.2, ns.
This document is a research report submitted to the U.S. Department of Justice. This report has not been published by the Department. Opinions or points of view expressed are those of the author(s) and do not necessarily reflect the official position or policies of the U.S. Department of Justice.
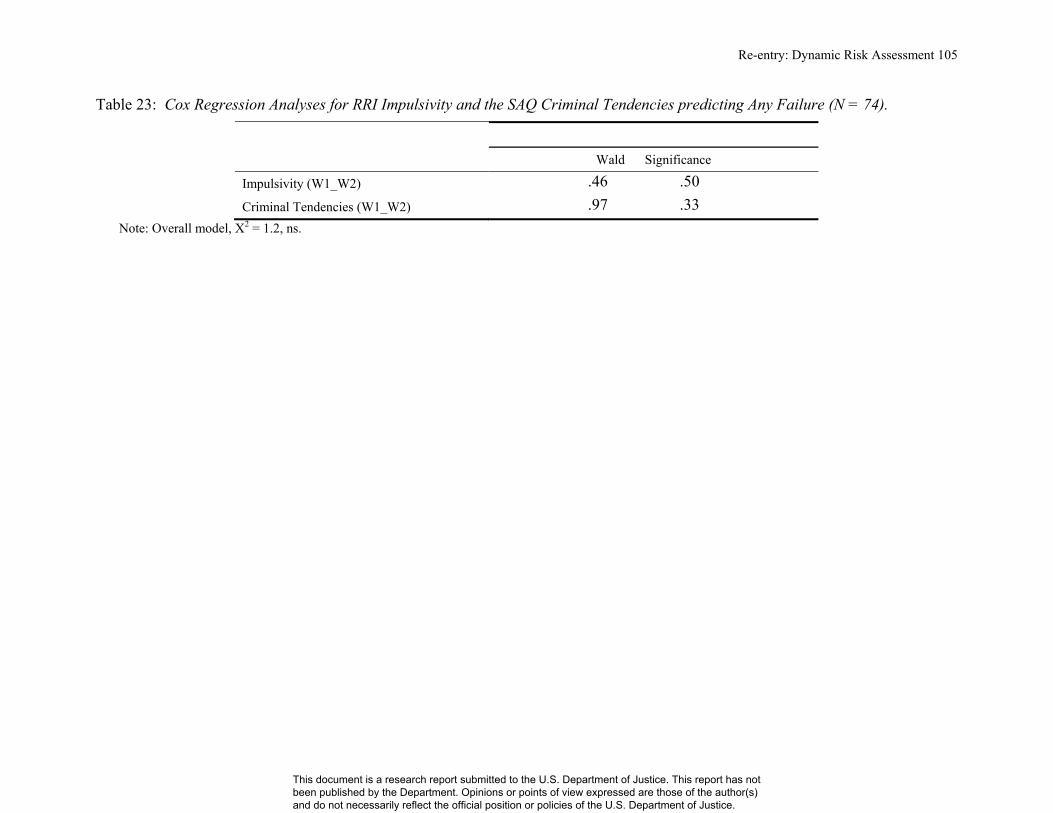
Re-entry: Dynamic Risk Assessment 105
Table 23: Cox Regression Analyses for RRI Impulsivity and the SAQ Criminal Tendencies predicting Any Failure (N = 74).
Wald Significance
Impulsivity (W1_W2) .46 .50
Criminal Tendencies (W1_W2) .97 .33
Note: Overall model, X2 = 1.2, ns.
This document is a research report submitted to the U.S. Department of Justice. This report has not been published by the Department. Opinions or points of view expressed are those of the author(s) and do not necessarily reflect the official position or policies of the U.S. Department of Justice.

Re-entry: Dynamic Risk Assessment 106
Table 24
Study Variable Hispanic
(n = 61)
African American
(n = 47)
Caucasian
(n = 27)
Any Failure .13 .23 .15
LSI-R Criminal History 5.3 4.5 4.7
LSI-R Static Criminogenic items 5.1 5.2 6.0
LSI-R Dynamic Criminogenic
items
9.3 9.5 12.6
This document is a research report submitted to the U.S. Department of Justice. This report has not been published by the Department. Opinions or points of view expressed are those of the author(s) and do not necessarily reflect the official position or policies of the U.S. Department of Justice.

Re-entry: Dynamic Risk Assessment 107
Table 25
Hispanic
(n = 61)
African American
(n = 47)
Caucasian
(n = 27)
Any
Failure
LSI-R
Criminal
History
LSI-R Static
Criminogenic
Any
Failure
LSI-R
Criminal
History
LSI-R Static
Criminogenic
Any
Failure
LSI-R
Criminal
History
LSI-R Static
Criminogenic
LSI-R Criminal
History
-.06 -.08 .21
LSI-R Static
Criminogenic
-.06 .58** .08 .19 .28 .23
LSI-R Dynamic
Criminogenic
-.26* .45** .49** -.29* .35* .52** .22 .25 .45*
Note. * = p < .05, ** = p < .001
This document is a research report submitted to the U.S. Department of Justice. This report has not been published by the Department. Opinions or points of view expressed are those of the author(s) and do not necessarily reflect the official position or policies of the U.S. Department of Justice.

Re-entry: Dynamic Risk Assessment 108
Table 26
AUCs of the Predictors with Any Failure
Study Variable Hispanic
(n = 61)
African American
(n = 47)
Caucasian
(n = 27)
LSI-R Criminal History .488 .451 .690
LSI-R Static Criminogenic items .474 .543 .717
LSI-R Dynamic Criminogenic items .288 .285 .652
This document is a research report submitted to the U.S. Department of Justice. This report has not been published by the Department. Opinions or points of view expressed are those of the author(s) and do not necessarily reflect the official position or policies of the U.S. Department of Justice.

Re-entry: Dynamic Risk Assessment 109
D. Figures
Figure 1
Current Problem Checklist (CPC)
Participant Coding number ______
Please rate the role each area is having with re-entry.
1. Impulsivity
1 2 3 4 5 6 7 8 9
Much difficulty Minimal difficulty
2. Boredom
1 2 3 4 5 6 7 8 9
Much difficulty Minimal difficulty
3. Negative Affect
1 2 3 4 5 6 7 8 9
Much difficulty Minimal difficulty
4. Social Pressure
1 2 3 4 5 6 7 8 9
Much difficulty Minimal difficulty
5. Social Alienation
1 2 3 4 5 6 7 8 9
Much difficulty Minimal difficulty
6. Interpersonal and Family Concerns
1 2 3 4 5 6 7 8 9
Much difficulty Minimal difficulty
7. Substance Abuse
1 2 3 4 5 6 7 8 9
Much difficulty Minimal difficulty
8. Financial/Employment
1 2 3 4 5 6 7 8 9
Much difficulty Minimal difficulty
9. Leisure
1 2 3 4 5 6 7 8 9
Much difficulty Minimal difficulty
This document is a research report submitted to the U.S. Department of Justice. This report has not been published by the Department. Opinions or points of view expressed are those of the author(s) and do not necessarily reflect the official position or policies of the U.S. Department of Justice.

Re-entry: Dynamic Risk Assessment 110
Figure 2
Social Release Sheet (CPRG – Social )
Instructions: Based on the last month to the past 4 months rate the following items on your client. Rating end-points ("1" or "9") are used between 5 to 10% of the ratings.
Date: _______ ______ ______ YYYY MM DD
Participation in Social Structures / Situations
1. Effort needed by supervisor/clinician for the fulfillment of supervision/treatment requirements
1 2 3 4 5 6 7 8 9
Minimal Average Strong effort Substantial effort
effort effort more than other
other clients
2. Strength of non-professional involvement
1 2 3 4 5 6 7 8 9
Family & Only family Poor quality no non-professional
friends or & is involved
highly involved only friend inconsistent
3. Willingness of client to allow for Professional involvement
1 2 3 4 5 6 7 8 9
High Compliance with Compliance, but Poor Compliance
willingness no encouragement only on issues that have
encouragement immediate benefit
4. Participation of different social structures
1 2 3 4 5 6 7 8 9
Only when
coordinated in Participation only similar to incident
providing services when showing symptoms (i.e., mental health, criminal event)
This document is a research report submitted to the U.S. Department of Justice. This report has not been published by the Department. Opinions or points of view expressed are those of the author(s) and do not necessarily reflect the official position or policies of the U.S. Department of Justice.

Re-entry: Dynamic Risk Assessment 111
5. Based on the client's current lifestyle, rate the potential of him/her entering into high risk situations
1 2 3 4 5 6 7 8 9
Positive lifestyle low moderate high potential for high risk
potential situations (i.e., guns, substances, lack of money
victim group, criminal associates)
6. Participation in positive social structures
1 2 3 4 5 6 7 8 9
More than 3 Two One No involvement
social structures
(supervision, family, sports, work, church, mental health clinic, school)
7. Quality of friendships
1 2 3 4 5 6 7 8 9
Stable Casual Criminal associates Loner
and casual
8. Housing
1 2 3 4 5 6 7 8 9
Somewhat One of three Two of three Three of three
stable (Daily, unstructured, and criminal setting)
9. Availability of non-family resources
1 2 3 4 5 6 7 8 9
Easy access to professional Access to either Difficult to access Very difficult to access non-family
and non-family resources resources - geographic and
non professional support personal limitations
10. Number of inconsistent or stable resources available (do not rate if used or not, only if available
1 2 3 4 5 6 7 8 9
None One two three one one stable Two three (+)
inconsistent stable w/ one two stable stable
inconsistent inconsistent inconsistent
(home care, immediate family, extended family, work, school, counsellor, friend, pastor)
This document is a research report submitted to the U.S. Department of Justice. This report has not been published by the Department. Opinions or points of view expressed are those of the author(s) and do not necessarily reflect the official position or policies of the U.S. Department of Justice.

Re-entry: Dynamic Risk Assessment 112
11. Stability of Family Unit
1 2 3 4 5 6 7 8 9
Highly stable ↓ Stable with one Changes in ↓ Unstable
↓ In non-functional stability frequent
↓ role changes
stable, split from
partner, but still amicable
12. Friends
1 2 3 4 5 6 7 8 9
Has many friends Has very few
acquaintances
13.
1 2 3 4 5 6 7 8 9
Delights in chatting Does not talk
with others much
14.
1 2 3 4 5 6 7 8 9
Feels uncomfortable Seems to enjoy
around others people
15. Interpersonal participation
1 2 3 4 5 6 7 8 9
Avoids being around Participates in group
people activities
16. Family ties (immediate family or extended family who function as immediate family)
1 2 3 4 5 6 7 8 9
Close family no family Critical of
ties ties family
17. Coordination of professional involvement (includes entities like AA, home care)
1 2 3 4 5 6 7 8 9
Three or more Three or more Two Only involvement
groups coordinate but no involved by one when
effort coordination severe symptoms present
This document is a research report submitted to the U.S. Department of Justice. This report has not been published by the Department. Opinions or points of view expressed are those of the author(s) and do not necessarily reflect the official position or policies of the U.S. Department of Justice.

Re-entry: Dynamic Risk Assessment 113
18. Coordination of non-professional involvement
1 2 3 4 5 6 7 8 9
Three or more Three or more Two One Only involvement
groups coordinate but no involved by one when
effort coordination severe symptoms present
(family, sports, church, work, school)
19. Continuousness of professional care
1 2 3 4 5 6 7 8 9
No breaks ↓ Break in care after Care only when
↓ legal requirements severe symptoms present
supervision
20. Continuousness of non-professional care
1 2 3 4 5 6 7 8 9
No breaks no family inconsistent/ Care only when
unpredictable severe symptoms present
This document is a research report submitted to the U.S. Department of Justice. This report has not been published by the Department. Opinions or points of view expressed are those of the author(s) and do not necessarily reflect the official position or policies of the U.S. Department of Justice.

Re-entry: Dynamic Risk Assessment 114
Conclusions
Discussion of findings
Contrary to prior studies (e.g., Beech, Friendship, Erikson, & Hanson, 2002; Brown, 2002)
we were unable to use dynamic risk factors to significantly improve accuracy over static risk
factors in the prediction of criminal risk. Notably, the inter-rater reliability at Wave 2 was
notably poorer for the DRAS than was obtained at Wave 1 (the LSI-R produced stable inter-rater
reliability at Waves 1 & 2). Furthermore, the nature of the dynamic variables utilized in this
study appeared unstable for this population as convergent validity was not obtained.
Consequently, the majority of hypothesized relationships were not obtained in this study (note:
additional analyses to better understand the relationships of static and dynamic variables in this
study are being completed, and reports will be made available to the National Institute of
Justice). Of greatest surprise in this study was that changes in dynamic functioning were not
associated with changes in community outcomes. It was expected that by measuring changes in
offenders functioning we would be able to identify criminal risk; however, this relationship did
not materialize. The limitations noted in this report (i.e., altered methodology that prohibited
Wave 1 assessment from occurring in the institution, inter-rater reliability concerns, instability of
dynamic measures) likely contributed to this outcome and further examination of the data is
ongoing.
Of note was there was some evidence that offenders are able to indicate when they are at risk
for re-offense. As evidenced in this study, offenders were able to self-predict when their
impulsivity, substance abuse, or leisure was interfering with their parole success (i.e., they were
able to indicate problems in these domains prior to their failure). These findings, though
susceptible to type I error, may prove direction for the fields future research as it appears that we
need to incorporate offender evaluations of their future success into risk assessment
This document is a research report submitted to the U.S. Department of Justice. This report has not been published by the Department. Opinions or points of view expressed are those of the author(s) and do not necessarily reflect the official position or policies of the U.S. Department of Justice.

Re-entry: Dynamic Risk Assessment 115
considerations. That is, we need to question offenders around those issues that are placing them
most at risk.
Although the results of this study were surprising in that the dynamic variables did not
improve prediction of failure over static variables, some findings were expected. For example,
consistent with previous research, interruption of care (failure to maintain continuity of care) and
impoverished housing situations is predictive of community failure. This provides further
evidence that support instituted in an institution should be continued in as fluid a manner as
possible (i.e., achieve continuity of care) when offenders re-enter society. Furthermore, if basic
housing needs are not met, offenders will likely not experience a successful re-entry.
Of greatest concern from the results of this study is further evidence of cultural insensitivity
of static predictors and the potential that dynamic measures may also not be culturally sensitive
(i.e., they do not perform as well for non-white males as for white males). Although this analysis
was considered post-hoc, it is nevertheless, consistent with previous research (Fass et al., 2008;
Schlager & Simourd, 2007), and suggests that much more research is needed to determine the
appropriateness of the measures included in this study for non-white populations. This is a
concern that has become increasingly evident as a problem in United States legal proceedings
involving risk assessments (see Campbell, 2010), and is enhanced by the fact that the majority of
risk assessment measures currently available were normed on white males, particularly in
Canada. Clearly, much more work in this area is necessary. It may no longer be acceptable to
rely on Canadian developed risk measures for non-white/non-Canadian offenders with the
rational that there is no better measure available to guide our practices -- the current measures
may not adequately guide our practices for those individuals that do not fit the specific
characteristics of the normative sample
This document is a research report submitted to the U.S. Department of Justice. This report has not been published by the Department. Opinions or points of view expressed are those of the author(s) and do not necessarily reflect the official position or policies of the U.S. Department of Justice.

Re-entry: Dynamic Risk Assessment 116
Implications for policy and practice
We anticipated that the results of this study would provide both practical/operational
deliverables and theoretical advances for clinicians, criminal justice administrators, and policy
makers alike. In addition, it was anticipated that the results of this study would establish a
foundation from which to pursue future advances.
Although the results of this study did not produce the anticipated findings, two practical
results were obtained. First, offenders offer an important piece of information when it comes to
predicting successful re-entry. Asking offenders about problem areas that increase their risk for
community failure should become standard operating practice for all probation and parole
officers. Too often the offender is not included as a source of information in risk assessments
with minimal involvement in the preparation for release or the anticipation of problem areas to
be addressed. The results of this study suggest offenders not only can, but should be involved in
their preparation for release and concerns should become active targets for intervention.
Additionally, it appears that standardized risk assessment measures and potentially newer
dynamic measures are not culturally sensitive. Given arrest and conviction rates of non-white
individuals, it is imperative that future research examine the utility of current risk assessment
measures for non-white offender populations. In addition, until further information is provided,
clinicians must be cognizant of the cultural limitations of their measures and clinical
decisions/recommendations should be made accordingly.
Implications for further research
Much work remains to be done in the field of criminal risk assessment. Despite the results of
this study, including reliability and predictive validity of selected measures; future research
should improve upon the limitations of this and the Quinsey et al (2006) studies. Specifically, we
This document is a research report submitted to the U.S. Department of Justice. This report has not been published by the Department. Opinions or points of view expressed are those of the author(s) and do not necessarily reflect the official position or policies of the U.S. Department of Justice.

Re-entry: Dynamic Risk Assessment 117
make the following methodological recommendations to improve the nature of this work:
Assessing offenders’ once-per-month was too frequent, and six month follow-up period was too
brief. The assessment plan utilized in this study proved taxing and did not provide an adequate
base-rate to maximize assessment of static versus dynamic risk factors. Furthermore, offenders’
situations changed minimally during the course of this study, simply as a function of limited time
for changes in life situation. Thus, it is recommended that future studies of this nature assess
offenders at three month intervals for a minimum of 18 months. Notably, this would provide the
same number of assessment contacts per offender as was sought in this study (i.e., 6 contacts
post release).
As noted above, this study was limited by offender’s time to participate as the assessments
were not part of the parole office visit. That is, to participate, offenders had to be willing to
spend the required assessment time beyond the time of their parole office visit. Although the
majority of offenders were willing to participate and often provided data in spite of time
restrictions, incorporating the assessment into the parole office visit and/or integrating the parole
officer into the assessment process will likely improve compliance and reduce missing data. To
further reduce time constraints for participants, although the continued use of self-report
measures is warranted, it is also recommended that future research use fewer self-report
measures (see Brown, Amand, & Zamble, 2009) and rely on parole officer ratings. In addition to
reducing offender attrition from study burnout, it is possible that a revised methodology along
these lines would produce greater dynamic predictive ability and more closely simulate real work
risk assessment. Given the time commitment of participation in longitudinal research of this
nature, compensating offenders for their time would likely decrease participation attrition that is
not related to failure.
This document is a research report submitted to the U.S. Department of Justice. This report has not been published by the Department. Opinions or points of view expressed are those of the author(s) and do not necessarily reflect the official position or policies of the U.S. Department of Justice.

Re-entry: Dynamic Risk Assessment 118
Finally, it is recommended that future clinicians and researchers incorporate data guided
follow-up assessment based on dynamic prediction (triage assessment plan) into their work and
research protocols. Although we were unable to incorporate this strategy into this study, such a
procedure would prove a significant advance for the field. Furthermore, it would likely produce
the most reliable and valid measure of risk prediction and likely establish a new standard for
evidenced-based risk assessment.
Concluding comment
The present project experienced a number of methodological challenges due to the real world
complexities of collecting multiple wave information among offenders within the community
resulting in limitations for the generalizability of the results. Some of these limitations related to
the site of data collection, sample of relative convenience, lack of multiple controls, maturational
issues, and no interfacing with Parole Officers. These challenges were not all evident at the
beginning of the project and adaption of method compensated in some measure but not sufficient
to overcome the primary limitation of statistical power. At that time there were no criminal
justice studies that examined the ability of standardized instruments to dynamically predict
failure over 6 months. Thus, some design features were sacrificed for fidelity and increasing
understanding in the assessment of dynamic risk over time at a parole office. This has resulted in
specific findings related to dynamic risk, such as the importance of self-prediction, which, over
time will move the dynamic risk assessment field forward.
This document is a research report submitted to the U.S. Department of Justice. This report has not been published by the Department. Opinions or points of view expressed are those of the author(s) and do not necessarily reflect the official position or policies of the U.S. Department of Justice.

Re-entry: Dynamic Risk Assessment 119
References
American Psychological Association (2002). Ethical principles of psychologists and code of
conduct. American Psychologist, 57, 1060-1073.
Andrews, D. A., & Bonta, J. L. (1995). The Level of Service Inventory - Revised. Toronto: Multi
Health Systems.
Beech, A., Friendship, C., Erickson, M., & Hanson, R. K. (2002). The relationship between static
and dynamic risk factors and reconviction in a sample of U.K. child abusers. Sexual
Abuse: A Journal of Research and Treatment, 14, 155-167.
Boer, D. P., Hart, S. D., Kropp, P. R., & Webster, C. D. (1997). Manual for the Sexual Violence
Risk – 20. Mental Health Law and Policy Institute, Simon Fraser University, Burnaby,
Canada.
Bonta, J. (1989). Native inmates: Institutional response, risk and needs. Canadian Journal of
Criminology, 31, 49-62.
Bonta, J., LaPrarie, C., & Wallace-Capretta, S. (1997). Risk prediction and re-offending:
Aboriginal and non-aboriginal offenders. Canadian Journal of Criminology, 39, 127-144.
Bonta, J., & Motiuk, L. L. (1987). The diversion of incarcerated offenders to correctional
halfway houses. Journal of Research in Crime and Delinquency, 24, 302-323.
Bonta, J., & Motiuk, L. L. (1990). Classification to correctional halfway houses: A quasi-
experimental evaluation. Criminology, 28, 497-506.
Brown, S. L. (2002). The dynamic prediction of criminal recidivism. Unpublished doctoral
dissertation, Queen’s University, Kingston, Ontario, Canada.
Brown, S. L., Amand, M. D. St., & Zamble, E. (2009). The dynamic prediction of criminal
recidivism: A three-wave prospective study. Law and Human Behavior, 33, 25-45.
This document is a research report submitted to the U.S. Department of Justice. This report has not been published by the Department. Opinions or points of view expressed are those of the author(s) and do not necessarily reflect the official position or policies of the U.S. Department of Justice.
Re-entry: Dynamic Risk Assessment 120
Byrne, B. M. (2001). Structural Equation Modeling with AMOS: Basic concepts, applications
and programming. Mahwah, NJ: Erlbaum.
Campbell, T. W. (2010). Maximizing accuracy and welcoming scrutiny in SVP evaluations: An
additional response to Wilson and Looman. Journal of Forensic Psychology, 2, 337-346.
Cantor, D. V., & Ioannou, M. (2004). Criminals' emotional experiences during crimes.
International Journal of Forensic Psychology, 1, 71-81.
Douglas, K. S., & Skeem, J. L. (2005). Violence risk assessment: Getting specific about being
dynamic. Psychology, Public Policy, and Law, 11, 347-383.
Dunn, G. (1989). Design and analysis of reliability studies. New York: Edward Arnold.
Estroff, S. E., & Zimmer, C. (1994).Social networks, social support, and violence among persons
with severe, persistent mental illness. In J. Monahan & H. J. Steadman (Eds.), Violence
and mental disorder: Developments in risk assessment (pp. 259-295.). Chicago:
University of Chicago Press.
Fass, T. L., Heilbrun, K., Dematteo, D., & Fretz, R. (2008). The LSI-R and the COMPAS:
Validation data on two risk-needs tools. Criminal Justice and Behavior, 35, 1095-1108. DOI:
10.1177/0093854808320497
Friedman, A. S. (1998). Substance use/abuse as a predictor to illegal and violent behavior: A
review of the relevant literature. Aggression and Violent Behavior: A Review Journal, 3,
339-355.
Gardner, W. Mulvey, E. P., & Shaw, E. C. (1995). Regression analyses of counts and rates:
Poisson, overdispersed poisson, and negative binomial models. Psychological Bulletin,
118, 392-404.
This document is a research report submitted to the U.S. Department of Justice. This report has not been published by the Department. Opinions or points of view expressed are those of the author(s) and do not necessarily reflect the official position or policies of the U.S. Department of Justice.

Re-entry: Dynamic Risk Assessment 121
Gendreau, P., Irvine, M., & Knight, S. (1973). Evaluating response set styles on the MMPI with
prisoners: Faking good adjustment and maladjustment. Canadian Journal of Behavioural
Science, 5, 183-194.
Gottfredson, M. R., & Hrschi, T. (1990). A general theory of crime. Stanford, CA; Stanford
University Press.
Hanson, R. K., & Harris A. J. R. (2000). Where should we intervene? Dynamic predictors of
sexual offence recidivism. Criminal Justice and Behavior, 27, 6-35.
Hanson, R. K., & Morton-Bourgon, K. E. (2005). The characteristics of persistent sexual
offenders: A meta-analysis of recidivism studies. Journal of Consulting and Clinical
Psychology, 73, 1154-1163.
Hare, R. D. (1991). The Hare Psychopathy Checklist-Revised (Manual). Multi-Health Systems.
Toronto, Ontario.
Hare, R. D. (2003). The Hare Psychopathy Checklist-Revised (Manual 2nd
Edition). Multi-Health
Systems. Toronto, Ontario.
Holden, R. R., Kroner, D. G., Fekken, G. C., & Popham, S. M. (1992). A model of personality
test item response dissimulation. Journal of Personality and Social Psychology, 63, 272-
279.
Holsinger, A. M., Lowenkamp, C.T., & Lattessa, E. J. (2006). Exploring the validity of the Level
of Service Inventory – Revised with Native American offenders. Journal of Criminal
Justice, 34, 331-337.
Jones, B. L., Nagin, D. S., Roeder, K. (1998). A SAS procedure based on mixture models for
estimating developmental trajectories. Carnegie Mellon University, Pittsburgh, PA:
Authors.
This document is a research report submitted to the U.S. Department of Justice. This report has not been published by the Department. Opinions or points of view expressed are those of the author(s) and do not necessarily reflect the official position or policies of the U.S. Department of Justice.

Re-entry: Dynamic Risk Assessment 122
Jung, S., & Rawana, E. P. (1999). Risk and need assessment of juvenile offenders. Criminal
Justice and Behavior, 26, 69-89.
Kendall, P.C., & Norton-Ford, J. D. (1982). Clinical psychology: Scientific and professional
dimensions. New York: John Wiley and Sons.
Kroner, D. G. (2005). Issues in violent risk assessment: Lessons learned and future directions.
Journal of Interpersonal Violence, 20, 231-235.
Kroner, D. G., & Loza, W. (2001). Evidence for the efficacy of self-report in predicting violent
and nonviolent criminal recidivism. Journal of Interpersonal Violence, 16, 168-177.
Kroner, D. G., & Mills, J. F. (2003). Release and Reintegration Inventory (RRI). Authors.
Kroner, D. G., Mills, J. F., & Reddon, J. R. (2005). A coffee can, factor analysis, and prediction
of antisocial behavior: The structure of criminal risk. International Journal of Law and
Psychiatry, 28, 360-374.
Kropp, P. R., Hart, S. D, Webster, C. D., & Eaves, D. (1999). Spousal Assault Risk Assessment
Guide, User’s Manual. Toronto, Canada: Multi-Health Systems.
Li, H., Rosenthal, R., & Rubin, D. B. (1996). Reliability of measurement in psychology: From
Spearman-Brown to maximal reliability. Psychological Methods, 1, 98-107.
Lindsay, W. R., Murphy, L., Smith, G., Murphy, D., Edwards, Z., Chittock, C, Grieve, A, &
Young, S. J. (2004). The dynamic risk assessment and management system: An
assessment of immediate risk of violence for individuals with offending and challenging
behaviour. Journal of Applied Research in Intellectual Disabilities, 17, 267-274.
Loza, W. (2005). Self-Appraisal Questionnaire (SAQ). Multi-Health Systems. Toronto, Ontario.
Loza, L., Cumbleton, A., Shahinfar, A, Neo, L. H., Evens, M., Conley, M., & Summers, R.
(2004). Cross-validation of the Self-Appraisal Questionnaire (SAQ): An offender risk
This document is a research report submitted to the U.S. Department of Justice. This report has not been published by the Department. Opinions or points of view expressed are those of the author(s) and do not necessarily reflect the official position or policies of the U.S. Department of Justice.

Re-entry: Dynamic Risk Assessment 123
and need assessment measure on Australian, British, Canadian, Singaporean, and
American Offenders. Journal of Interpersonal Violence, 19, 1172-1190.
Loza, W., & Simourd, D. J. (1994). Psychometric evaluation of the Level of Supervision
Inventory (LSI) among male Canadian federal offenders. Criminal Justice and Behavior,
21, 468-480.
Loza, W., & Loza-Fanous, A. (2001). The effectiveness of the Self-Appraisal Questionnaire
(SAQ) in predicting offenders' post-release outcome: A comparison study. Criminal
Justice and Behavior, 28, 105-121.
Loza, W., & Loza-Fanous, A. (2003). More evidence for the validity of the Self-Appraisal
Questionnaire for predicting violent and non-violent recidivism: A 5-year follow-up
study. Criminal Justice and Behavior, 30, 709-721.
Mills, J. F., & Kroner, D. G. (2003). Antisocial constructs in predicting institutional violence
among violent offenders and child molesters. International Journal of Offender Therapy and
Comparative Criminology, 47, 324-334.
Mills, J. F., Kroner, D. G., & Hemmati, T. (2003). Predicting violent behavior through a
static/stable variable lens. Journal of Interpersonal Violence, 18, 891-904.
Mills, J. F., Kroner, D. G., & Hemmati, T. (2004). The Measures of Criminal Attitudes and
Associates (MCAA): The prediction of general and violent recidivism. Criminal Justice
and Behavior, 31, 717-733.
Morgan, R. D., & Flora, D. B. (2002). Group psychotherapy with incarcerated offenders: A
research synthesis. Group Dynamics: Theory, Research, and Practice, 6, 203-218.
Morgan, R. D., Rozycki, A. T., & Wilson, S. (2004). Inmate perceptions of mental health
services. Professional Psychology: Research and Practice, 35, 389-396.
This document is a research report submitted to the U.S. Department of Justice. This report has not been published by the Department. Opinions or points of view expressed are those of the author(s) and do not necessarily reflect the official position or policies of the U.S. Department of Justice.

Re-entry: Dynamic Risk Assessment 124
Morgan, R. D., Winterowd, C. L., & Ferrell, S. W. (1999). A national survey of group
psychotherapy services in correctional facilities. Professional Psychology: Research and
Practice, 30, 600-606.
Morgan, R. D., Winterowd, C. L., & Fuqua, D. R. (1999). The efficacy of an integrated
theoretical approach to group psychotherapy for male inmates. Journal of Contemporary
Psychotherapy, 29, 203-222.
Motiuk, L. L., Bonta, J., & Andrews, D. A. (1986). Classification in correctional halfway houses:
The relative and incremental predictive criterion validities of the Megargee-MMPI and
LSI systems. Criminal Justice and Behavior, 13, 33-46.
Motiuk, M., Motiuk, L., & Bonta, J. (1992). A comparison between self-report and interview-
based inventories in offender classification. Criminal Justice and Behavior, 19, 143-159.
Nagin, D. S. (1999). Analyzing developmental trajectories: A semi-parametric, group-based
approach. Psychological Methods, 4, 139-157.
Philipse, M. W. G., Koeter, M. W. J., van der Staak, C. P. F., & van den Brink, W. (2005).
Reliability and discriminant validity of dynamic reoffending risk indicators in forensic
clinical practice. Criminal Justice and Behavior, 32, 643-664.
Philipse, M. W. G., Koeter, M. W. J., van der Staak, C. P. F., & van den Brink, W. (2006). Static
and dynamic patient characteristics as predictors of criminal recidivism: A prospective
study in a Dutch forensic psychiatric sample. Law and Human Behavior, 30, 309-327.
Piquero, A. R., Blumstein, A., Brame, R., Haapanen, R., Mulvey, E. P. & Nagin, D. S. (2001).
Assessing the impact of exposure time and incapacitation on longitudinal trajectories of
criminal offending. Journal of Adolescent Research, 16, 54-74.
This document is a research report submitted to the U.S. Department of Justice. This report has not been published by the Department. Opinions or points of view expressed are those of the author(s) and do not necessarily reflect the official position or policies of the U.S. Department of Justice.

Re-entry: Dynamic Risk Assessment 125
Piquero, A., Paternoster, R., Mazerolle, P., Brame, R., Dean, C. W. (1999). Onset age and
offense specialization. Journal of Research in Crime and Delinquency, 36, 275-299.
Posey, C. D., & Hess, A. K. (1984). The fakability of subtle and obvious measures of aggression
by male prisoners. Journal of Personality Assessment, 48, 137-144.
Quinsey, V. L., Book, A. S., & Skilling, T. A. (2004). A follow-up of deinstitutionalized men
with intellectual disabilities and histories of antisocial behavior. Journal of Applied
Research in Intellectual Abilities, 17, 243-254.
Quinsey, V. L., Coleman, G., Jones, B., & Altrows, I. F. (1997). Proximal antecedents of eloping
and reoffending among supervised mentally disordered offenders. Journal of
Interpersonal Violence, 12, 794-813.
Quinsey, V. L., Harris, G. T., Rice, M. E., & Cormier, C. A. (1998). Violence Offenders:
Appraising and Managing Risk. Washington, DC: American Psychological Association.
Quinsey, V. L., Jones, G. B., Book, A. S., & Barr, K. N. (2006). The dynamic prediction of
antisocial behavior among forensic psychiatric patients: A prospective field study.
Journal of Interpersonal Violence, 21, 1539-1565.
Quinsey, V. L., Khanna, A., & Malcolm, B. (1998). A retrospective evaluation of the Regional
Treatment Center Sex Offender Treatment Program. Journal of Interpersonal Violence,
13, 621-644.
Rindskopf, D. (2001). The next steps in latent variable models for change. In L. M. Collins and
A. G. Sayer (Eds.). New methods for the analysis of change. Washington, DC: American
Psychological Association.
Schlager, M. D., & Simourd, D. J. (2007). Validity of the Level of Service Inventory-Revised
This document is a research report submitted to the U.S. Department of Justice. This report has not been published by the Department. Opinions or points of view expressed are those of the author(s) and do not necessarily reflect the official position or policies of the U.S. Department of Justice.

Re-entry: Dynamic Risk Assessment 126
(LSI-R) among African American and Hispanic male offenders. Criminal Justice and
Behavior, 34, 545-554. DOI: 10.1177/0093854806296039.
Schretlen, D., & Arkowitz, H. (1990). A psychological test battery to detect prison inmates who
fake insanity or mental retardation. Behavioral Sciences and the Law, 8, 75-84.
Simourd, D. J., & Malcolm, P. B. (1998). Reliability and validity of the Level of Service
Inventory – Revised among federally incarcerated sex offenders. Journal of Interpersonal
Violence, 13, 261-274.
Simourd, D. J., & Olver, M. E. (2002). The future of criminal attitudes research and practice.
Criminal Justice and Behavior, 29, 427-446.
Texas Department of Criminal Justice (n.d.). Homepage. Retrieved December 22, 2005 from
Texas Department of Criminal Justice Web site: http://www.tdcj.state.tx.us/.
Texas Department of Criminal Justice (2001). Fiscal year 2004: Statistical summary. Retrieved
December 22, 2005 from
http://www.tdcj.state.tx.us/publications/executive/FY2004%20Statistical%20Summary.p
df.
Walters, G. D., White, T. W., & Denney, D. (1991). The Lifestyle Criminality Screening From:
Preliminary data. Criminal Justice and Behavior, 18, 406-418.
Walters, G. (2002). Current and Historical content scales for the Psychological Inventory of
Criminal Thinking Styles (PICTS). Legal and Criminological Psychology, 7, 73-86.
Ward, T., Vess, J., Collie, R. M., & Gannon, T. A. (2006). Risk management or goods
promotion: The relationship between approach and avoidance goals in treatment for sex
offenders. Aggression and Violent Behavior, 11, 378-393.
This document is a research report submitted to the U.S. Department of Justice. This report has not been published by the Department. Opinions or points of view expressed are those of the author(s) and do not necessarily reflect the official position or policies of the U.S. Department of Justice.

Re-entry: Dynamic Risk Assessment 127
Webster, C. D., Douglas, K. S., Eaves, D., & Hart, S. D. (1997). HCR-20: Assessing Risk for
Violent - Version 2. Vancouver, Canada: Simon Fraser University and British Columbia
Forensic Psychiatric Services Commission.
Webster, C. D., Harris, G. T., Rice, M. E., Cormier, C., & Quinsey, V. L. (1994). The Violence
Prediction Scheme: Assessing dangerousness in high risk men. Toronto: Centre of
Criminology, University of Toronto.
Wells, L. E., & Rankin, J. H. (1991). Families and delinquency: A meta-analysis of the impact of
broken homes. Social Problems, 38, 71-93.
Williams, T. Y., Boyd, J. C., Cascardi, M. A., & Poythress, N. (1996). Factor structure and
convergent validity of the Aggression Questionnaire in an offender population.
Psychological Assessment, 8, 398-403.
Visser, R. A. (1982). Analysis of longitudinal data in behavioral and social research: An
exploratory survey. Leiden, The Netherlands: DSWO Press.
Yessine, A., & Kroner, D. G. (2004). Altering antisocial attitudes among federal male offenders
on release: A preliminary analysis of the Counter-Point Community Program. Research
Report No. R-152. Ottawa: Correctional Service of Canada.
Zamble, E., & Quinsey, V. L. (1997). The criminal recidivism process. Cambridge, UK:
Cambridge University Press.
This document is a research report submitted to the U.S. Department of Justice. This report has not been published by the Department. Opinions or points of view expressed are those of the author(s) and do not necessarily reflect the official position or policies of the U.S. Department of Justice.

Re-entry: Dynamic Risk Assessment 128
Dissemination of Research Findings
Publications and presentations resulting from this award are listed below.
Publications
Morgan, R. D., Kroner, D. G., Mills, J. F., Serna, C., & McDonald, B. et al. Dynamic risk
prediction: Reliability and validity of a multiphase longitudinal study. Manuscript in
preparation for publication (anticipated submission date: November 2011).
Kroner, D. G., Morgan, R. D., Mills, J. F., Serna, C., McDonald, B. & et al. Changes in self-
report and risk context over time. Manuscript in preparation for publication (anticipated
submission date: December 2011).
Mills, J. F., Morgan, R. D., Kroner, D. G., Serna, C., McDonald, B. & et al. Predicting
community failure: Cultural limitations of existing measures. Manuscript in preparation for
publication (anticipated submission date: January 2012).
Additional manuscripts to be completed upon further data analyses.
Conference Presentations
Morgan, R. D (June, 2011). Dynamic risk assessment: An overview. In D. G. Kroner (Chair),
Dynamic risk assessment: Examination of a 6-wave study with outcome data. Symposium
conducted at the Second North American Correctional and Criminal Justice Psychology
Conference, Toronto, Canada.
Kroner, D. G., Morgan, R. D., Mills, J. F., Serna, C., Bewley, M. T. (March 2010). Dynamic risk
Assessment: Can we get there? Paper presented at the annual convention of the American
Psychology-Law Society, Vancouver, Canada.
Morgan, R. D., Kroner, D. G., Mills, J. F., Serna, C., & Bewley, M. T. (August 2009). Can We
Use Dynamic Risk to Predict Future Criminal Behavior? In Garcia, M. (Moderator).
Answering Questions about Prisoner Reentry. Workshop presented at the annual convention
of the American Probation and Parole Association, Anaheim, CA.
Morgan, R. D., Kroner, D. G., Mills, J. F., Bauer, R., & Serna, C. (August 2009). Dynamic Risk
Assessment in Criminal Justice: Can We Get There? Poster presented at the annual
convention of the American Psychological Association, Toronto, Canada.
This document is a research report submitted to the U.S. Department of Justice. This report has not been published by the Department. Opinions or points of view expressed are those of the author(s) and do not necessarily reflect the official position or policies of the U.S. Department of Justice.